Submitted:
24 July 2025
Posted:
24 July 2025
You are already at the latest version
Abstract
Bisphenol A (BPA) replacement chemicals are used in products like food packaging, plastic piping, and sportswear. While they can be toxic, their neurotoxicity is less understood. This study treated differentiated human SH-SY5Y cells with Bisphenol S (BPS) and Bisphenol F (BPF) to explore mechanisms of toxicity. BPS reduced cell viability (50 µM at 48 h) more than BPF (200 µM at 48 h), with dose- and time-dependent effects. Both chemicals induced caspase 3/7 activity at 250 µM after 48 h, though no changes were observed in reactive oxygen species or mitochondrial ATPase activity, suggesting mitochondrial function was unaffected. RNA-seq analysis at 0.1 nM revealed distinct transcriptional networks affected by each bisphenol. BPS altered IL15R → NF-kB/NFATC and CD8 → NF-kB signaling, while BPF affected TLR9 and TNF → NF-kB targets. Pathway analysis showed that genes involved in neuroinflammation, protein folding, microglial function, and motor neuron regulation were disrupted. Despite low acute toxicity, both BPS and BPF altered gene expression at low, environmentally relevant concentrations. These transcriptomic changes may contribute to long-term neurological effects.
Keywords:
bisphenol replacements
; neurotoxicity
; RNA-seq
; mitochondria
; caspase activity
1. Introduction
Polycarbonate plastics containing Bisphenol A (BPA) were once widely used in manufactured products such as baby and children’s plastic cups, water bottles, plastic wraps, pre-packaged food containers, and sealants of the inner lining of metal cans; however, there is strong evidence of widespread BPA-induced reproductive dysfunction in wildlife (i.e., fish species [1]) and that exposures can lead to impairment of both the male [2] and female [3,4] mammalian reproductive system. The reproductive toxicity of BPA involves various mechanisms including estrogen receptor (ER) activation, binding to membrane bound G-protein coupled receptors (GPCRs) [5] and competitive inhibition of androgen receptors [6], as well as other steroid receptor-related mechanisms. In addition to reproduction, other physiological systems are disrupted following BPA exposure, either through direct effects via estrogen receptor activation or through other receptors involving the immune system, metabolism, and behavior [7,8]. There are also wildlife and human health concerns for prolonged exposure to BPA as it has been quantified in human urine, human tissues, and tissues of wildlife [9]. Consequently, BPA has been gradually phased out of many products and is now under strict environmental and human health related regulations for safety.
Due to the restrictions and/or bans of BPA usage in several countries, bisphenol replacements are used extensively in plastic products. These “BPA alternatives” are those primarily containing two hydroxyphenyl functionalities (i.e., bisphenol B, F, G, S, P, Z). BPF, for example, is useful in epoxy coatings needed for flooring, linings for storage tanks, road coverings, industrial adhesives and grouts, water pipes, and electrical varnishes [10]. Both BPF and BPS have also been measured in consumers products like personal care products, paper products, and food [10,11]. In the environment, bisphenols replacements are detectable in surface water, sewage, and sediment like BPA. These analogs share a common chemical structure to BPA and many may bind human estrogen receptors (ERs) with greater affinity than BPA [12]. Thus, replacement products for BPA continue to be under scientific scrutiny for their role in potential disruptions to the reproductive system. There is evidence that bisphenol replacements impair, not only reproduction in mammals [13], but also immune function [14], cardiovascular function [15], and metabolism [16].
Recently, concerns have been raised regarding exposure effects of BPA replacement chemicals in relation to neurodevelopment and neurotoxicity of wildlife and humans. Studies have detected BPA and BPF in the human brain at concentrations up to 2.4 ng/g [17] and these chemicals have been associated with impaired early neural development in children [18,19]. Other adverse neurological effects include dose-dependent delays or impairment of neuron and oligodendrocyte maturation with exposure to BPA and BPF [20]. Recent studies on BPA, BPB, and BPS in neuronal cell lines show that there can be neurotoxic effects involving reactive oxygen species (ROS) leading to increased malondialdehyde (MDA) content [21]. Experimental evidence for oxidative stress and neurotoxicity has also been observed in non-mammalian animal models like zebrafish [22,23,24].
To address knowledge gaps in how bisphenol replacements may affect the brain and to improve our understanding of the neurotoxicity of bisphenol chemical replacements in neuronal cells, we exposed human SH-SY5Y neuroblastoma cells to BPS and BPF. Human SH-SY5Y neuroblastoma cells are valuable in vitro models not only for their reliability in studying neuronal function and neurotoxicity, but also for the development of more physiologically relevant data compared to animal-derived cell lines. Additionally, we chose to focus on BPS and BPF as these replacements are increasingly being utilized despite their full toxicity mechanisms remaining understudied. We hypothesized that both bisphenol replacements would induce neurotoxicity via oxidative stress, leading to disruption in mitochondrial membrane potential and oxidative phosphorylation of SH-SY5Y cells. We also quantified the molecular response in cells using RNA-seq to elucidate mechanisms underlying any observed neurotoxicity at low concentrations to reflect concentrations in the human brain.
2. Materials and Methods
2.1. Chemicals
PESTANAL®, analytical standards for both BPF (4,4′-Methylenediphenol) (CAS Number 620-92-8) and BPS (4,4′-Sulfonyldiphenol) (CAS Number 80-09-1) were purchased from Sigma-Aldrich (St. Louis, MO, USA). Nominal stock solutions of BPS and BPF were prepared by dilution in 0.1% dimethyl sulfoxide (DMSO) (CAS no. 67-68-5, purity ≥99.9%, Sigma-Aldrich, USA). Oligomycin A (≥99%, CAS Number 579-13-5), carbonyl cyanide-4-phenylhydrazone (FCCP) (≥98%, CAS Number: 370-86-5), and antimycin A (≥95%, CAS Number 1397-94-0) were also purchased from Sigma for mitochondrial assays.
2.2. SH-SY5Y Culturing, Differentiation, and Chemical Exposures
Cell culturing of the differentiated SH-SY5Y cells have been outlined previously in our publication [25]. The complete method is provided in Supplemental Methods. Cells were purchased from ATCC® CRL 2266™ and validated by the company through STR profiling. To produce a more neuronal phenotype, SH-SY5Y cells were exposed to retinoic acid (RA) (10 μM) for 6 days as per established methods [26,27]. Details on media are given in Supplemental methods. Differentiated SH-SY5Y cells were maintained in DMEM:F12 with L-glutamine media supplemented with 1% (v/v) fetal bovine serum, and 1% Antibiotic-Antimycotic solution (Gibco) in a humidified atmosphere of 5% CO2 at 37 °C [28].
2.3. Cell Viability Assay
Cell culturing of the differentiated SH-SY5Y cells have been outlined previously in our publication [25]. The complete method is provided in Supplemental Methods. The CellTiter-Glo® Luminescent Cell Viability Assay (Promega) was used to determine the proportion of viable SH-SY5Y cells in culture. SH-SY5Y cells were exposed to media only, 0.1% DMSO solvent control, positive control (20 µM Antimycin/Rotenone), or one dose of either BPF or BPS at 0.1, 0.5, 1, 5, 10, 50, 100, 150, 200, or 250 µM (n=4). The luminescence was recorded at using a Synergy™ 4 Hybrid Microplate Reader (BioTek).
2.4. Caspase Activity Assay
The complete method for the caspase activity assay is provided in Supplemental Methods. Briefly, SH-SY5Y cells were collected and seeded at n=3 (wells/dose) after being differentiated for 6 days with retinoic acid. BFS or BPF was added over a concentration range of 0.1-250 µM. Approximately 100 µL of media containing ~10,000 cells were seeded in each well of a 96 well plate. Positive controls included 30 µg/mL digitonin (DIG), and either 1, 10, and 100 µM antimycin A and rotenone at each time point. These chemicals induce cytotoxicity and caspase activity. Each time point was conducted in different plates. At either 4, 24, and 48 hours, 100 µL of Caspase-Glo 3/7 reagent (Promega) was added to each well. After 30 seconds of orbital shaking at 400 rpm, the plate was incubated for 1.5 hours at room temperature. A Synergy™ 4 Hybrid Microplate Reader (BioTek) was used to measure luminescence. Background fluorescence of cells was considered and controlled for each assay (background corrected).
2.5. Mitochondrial Membrane Potential
Cell culturing of the differentiated SH-SY5Y cells have been outlined previously in our publication [25]. The complete method is provided in Supplemental Methods. Mitochondrial membrane potential (MMP) was determined by the Mitochondrial Membrane Potential Kit (Sigma-Aldrich). Cells were exposed to either media only, 0.1% DMSO solvent control, positive control (4 and 8 μM FCCP), or one dose of either BPF or BPS at 0.001, 0.01, 0.1, 0.5, 1, 5, 10, 50, 100, 150, 175, 200, and 250 μM (n=3). A Synergy™ 4 Hybrid Microplate Reader (BioTek) was used to measure luminescence. The experiment was conducted twice independently.
2.6. ATPase Activity
Cell culturing of the differentiated SH-SY5Y cells have been outlined previously in our publication [29]. The complete method is provided in Supplemental Methods. Cells were exposed in quadruplicate for 24 hours to one concentration of 10, 50, 100, 150, 175, or 250 µM BPS or BPF, or the positive control (10 µM oligomycin) (ATPase Assay Kit, ab234055). A BioTek Synergy H1 Spectrophotometer was used for a kinetic assay.
2.7. Mitochondrial Bioenergetics in Differentiated SH-SY5Y Cells
Cell culturing of the differentiated SH-SY5Y cells have been outlined previously in our publication [25]. The complete method is provided in Supplemental Methods. Mitochondrial bioenergetics was analyzed using a Seahorse XFe24 flux analyzer following the standard Mitochondrial Stress test regimen. Cells were exposed to media only, 0.1% DMSO, or one final concentration of either 0.1 nM, 0.1 μM, 100 μM, or 250 μM BPS using direct injection.
2.8. Intracellular Reactive Oxygen Species in Differentiated SH-SY5Y Cells
The quantification of reactive oxygen species in differentiated SH-SY5Y cells have been described previously in our publications [25,29]. The full methods are provided in Supplemental Methods. ROS production was measured using (1) the ROS-Glo™ H2O2 Assay (Promega, Cat #G8820) as per the manufacturer’s protocol and (2) with the fluorescent probe DCFDA (2’,7’-dichlorofluorescein diacetate).
2.9. RNA-Sequencing
All methods are provided in detail in the Supplemental Methods. Briefly, SH-SY5Y cells were exposed in T75 flasks by removing all the media and replacing it with 8 mL of differentiation media (DMEM:F12 containing 1% FBS, 1% antibiotic/antimycotic solution, and 10 µM retinoic acid) every 48 hours. On the 6th day, cells were exposed to media, 0.1 nM BPS, or 0.1 nM BPF (n=4-5) for 48 hours. Cells were spun down and added into TRIzol™ Reagent (Thermo Fisher Scientific, Waltham, MA USA) for total RNA extraction. Quality of samples were assessed using both the Qubit® 2.0 Fluorometer (ThermoFisher, Grand Island, NY, USA) and Agilent 2100 Bioanalyzer (Agilent Technologies, Inc.). Twelve samples were used for RNA-seq library construction (RINs>7).
Libraries and sequencing were conducted by Novogene (Novogene Corporation, Beijing, China) using the NEBNext Poly(A) mRNA Magnetic Isolation module (New England Biolabs, catalog # E7490). RNA library construction followed instructions outlined in the NEBNext® Ultra™ II Directional RNA Library Prep Kit for Illumina® (New England Biolabs, catalog #E7760). Individually prepared libraries were pooled by equimolar concentrations and sequenced using a NovoSeq 6000 instrument (150 bp paired end reads) (Illumina Inc., CA, USA). Data were processed as outlined in our published manuscript [30]. The reference genome (homo_sapiens_grch38_p12_gca_000001405_27) was used for alignment of RNA-seq data. Differentially expressed transcripts were revealed as stated in Supplemental Methods.
2.10. Bioinformatics of Pathways
As a first level analysis, enrichment analysis of the differential expressed genes was conducted for each concentration of BPF and BPS using the Gene Ontology (GO). Gene set enrichment analysis (GSEA) and subnetwork enrichment analysis (SNEA) were further conducted in Pathway Studio 12.0 (Elsevier, Amsterdam, Netherlands). Details are found in Supplemental Methods as well as in previously published studies [30,31]. All raw and processed transcriptome data are available via the NCBI Gene Expression Omnibus (GEO) database (GSE217951, release date April 2024).
2.11. Real-Time PCR Analysis
Real-time PCR followed our established methods using TRIzol® Reagent (Life Technologies, Carlsbad, CA, USA) [32]. Genomic DNA was removed using the TURBO DNA free™ Kit (ThermoFisher Scientific). The cDNA was generated with iScript™ Select cDNA Synthesis Kit (Bio-Rad, CA, USA). For quantitation, the CFX Connect System (BioRad, USA) was used with SSo-Fast™ EvaGreen® Supermix Kit (BioRad, Hercules, CA, USA). Samples were run in duplicate and cycling parameters have been previously described by us [32]. Further details are presented in Supplemental Methods.
The primers used in this study were obtained from published literature or designed using NCBI Primer. Based on the functional enrichment, genes related to transcription/translation were measured. These included General transcription factor IIH subunit 4 (Gtf2h4) (BT007321.1) [F’ TATTGGACCGATTGTATGGGCA, R’ AGCCCTGTACTTTCCTCCTGA] Secretogranin V (Scg5) (NG_051230.1) [F’ CTGTCCTGTTGGAAAAACAGCAG, R’ GACACTCCTCCGCTTTCGTC], and Valyl-tRNA synthetase 2 (Vars2) (BC113605) [F’ ACAGCCCCCGATATGTTGAG, R’ GGCCTGATATTCTGGTTTGAAGA]. Expression data were normalized to Gapdh [F’ TGCACCACCAACTGCTTAGC, R’ GGCATGGACTGTGGTCATGAG] [33] using CFX Manager™ software (v3.1) (baseline subtracted) and the Cq method was employed.
2.12. Statistical Analysis
All statistical analyses were conducted in GraphPad Prism (La Jolla, CA, USA, version 9.4). Differences for cell viability data, caspase activation, MMP, ATP synthase levels and ROS were analyzed using a One-way ANOVA followed by a Dunnett’s multiple comparison test to the DMSO solvent control. Relative mRNA levels were first log transformed (log10) and analyzed with ANOVA followed by a Dunnett’s test. Data are presented as mean ± S.D unless otherwise stated in figure caption. Significance of difference was considered when p < 0.05 for all endpoints.
3. Results
3.1. Cytotoxicity Based on Cell Viability
For all time points, the positive control (antimycin) reduced cell viability (Figure 1). At 24 hours, there were significant effects on cell viability [F (DFn, DFd), P value] (F (22, 62) = 25.8, P<0.0001) (Figure 1A). When comparing groups to the media control, BPS reduced cell viability at 100 µM and above while BPF reduced cell viability at 250 µM. At 48 hours, there were significant effects on cell viability (F (22, 70) = 24.59, P<0.0001) (Figure 1B). When comparing groups to the media control, BPS reduced cell viability at ~50 µM and above while BPF reduced cell viability at 200 µM. At 72 hours, there were significant effects on cell viability (F (22, 69) = 44.19, P<0.0001) (Figure 1C). BPS reduced cell viability at 100 µM and above while BPF reduced cell viability at 150 µM. Taken together, BPS exerted higher toxicity more quickly to differentiated SH-SY5Y cells relative to BPF.
3.2. Caspase 3/7 Activity
For Casp3/7-mediated apoptosis, positive controls for the assay included 1, 10, 100 µM antimycin/rotenone and cells treated with 30 µg/ml DIG. At 4 hours, the positive control of 10 and 100 µM antimycin/rotenone differed from the control (F (15,38) = 13.31, P<0.0001) (Figure 2A). BPF reduced Casp3/7 slightly which may be related to cell viability at the higher concentrations. At 24 hours, the positive controls for antimycin/rotenone induced casp3/7 activity, as well as the 250 µM of both BPS and BPF (F (15,38) = 50.43, P<0.0001) (Figure 2B). At 48 hours, the positive control of 1 µM and 10 µM antimycin/rotenone, as well as the 100 and 250 µM BPF and BPS differed significantly from the control (F (15,38) = 280.9, P<0.0001) (Figure 2C). The reduction in casp3/7 activity with the stronger positive controls at this later time point reflects the loss of cell viability in the assay due to toxicity.
3.3. Mitochondrial Membrane Potential
There was no difference between the solvent control and media control, and relative fluorescence measurements between treatments were compared to the solvent control. At 4 hours of exposure to BPS, MMP differed among experimental groups in the first (F (16,37) =3.07, P<0.0024) and second (F (16,37) =7.44, P<0.0001) experiment; however, this was due to the positive control and there were no changes in MMP in SH-SY5Y cells following exposure to BPS (Figure 3). At 4 hours of exposure to BPF, MMP again differed among experimental groups in the first (F (16,37) =3.10, P<0.0022) and second (F (16,37) =2.02, P<0.039) experiment; however, this was due to the positive control and there were no changes in MMP in SH-SY5Y cells following exposure to BPF (Figure 3). Taken together, data suggest that BPS and BPF do not affect the MMP in SH-SY5Y cells under this exposure regime.
3.4. ATPase Activity
ATPase activity differed significantly among treatments (F 12,39) = 2.1, P=0.037) (Figure 4). However, ATPase activity was only inhibited by the positive control (10 µM oligomycin, OM) and not by any concentration of BPS or BPF. Based on these results, we conclude ATPase activity is not altered by BPS nor BPF under these experimental conditions.
3.5. Reactive Oxygen Species
ROS was measured by two well established methods (Ros-Glo and DCFDA method) in SH-SY5Y cells following a 4-, 24-, and 48-hour exposure to one of several concentrations spanning 1 up to 250 µM. Neither BPS nor BPF induced ROS following 4-, 24-, and 48-hour exposure (Figure 5A-F). However, both positive controls (MEN and TBHT) increased ROS as expected (P<0.05).
3.6. Mitochondrial Bioenergetics
A mitochondrial stress test was conducted to measure oxygen consumption rates in cells following a 4-hour direct injection exposure to one concentration of either BPS or BPF. We tested concentrations of BPS and BPF that ranged 0.1 nM to 250 µM. We hypothesized that BPS and BPF would alter oxidative consumption rates of SH-SY5Y cells, an indicator of mitochondrial dysfunction. BPS did not affect oxygen consumption rates of SH-SY5Y mitochondria and did not affect oligomycin induced ATP production nor maximum respiration (Supplemental Figure S1). BPF affected oxygen consumption rates of SH-SY5Y mitochondria but only at the highest concentration tested and basal respiration was decreased over time following exposure to BPF (Supplemental Figure S2) (p<0.05).
3.7. Transcriptome Profiling in SH-SY5Y Cells Following BPS and BPF Exposure
Transcriptomes obtained were overall high quality, generating 35.3 – 47.2 million raw reads per sample (Supplemental Data). Total mapping to the human reference genome was high (92.94-95.91% total mapped and 86.44-89.84% uniquely mapped rates) and fragments per kilobase of transcript per million mapped reads (FPKM) levels were similar across samples.
Transcriptome patterns in general were unique amongst the three experimental groups (control, BPS and BPS) (Figure 6A). The number of differentially expressed genes in SH-SY5Y cells exposed to BPS was 1737 while 898 transcripts were differentially expressed in SH-SY5Y cells exposed to BPF (p-value < 0.05) (Figure 6B, Supplementary Data). For BPS, there were 30 transcripts that passed an FDR correction while a single transcript was altered by BPF (p-adj <0.05). Table 1 presents the top 10 expressed candidates in the BPS treatment, while the single transcript that passed an FDR correction in the BPF treatment was uncharacterized. Transcripts most affected by BPS included those related to translation (ribosomes) and metabolism.
Enrichment analysis with KEGG pathways is depicted as bubble plots. The enrichment of KEGG pathways was consistent with the cell network enrichment analysis conducted in Pathway Studio. The sole prominent gene network enriched following BPS exposure was related to ribosomes (Figure 7A). Prominent gene networks that were enriched following BPF exposure were those related to oxidative phosphorylation, proteasomes, Huntington’s disease, Parkinson’s disease, prion disease, and ribosomes (Figure 7B).
The top 10 pathways enriched in each dataset generated from BPS and BPF exposure are presented in Table 2. All GSEA data can be found in the Supplemental Data. In cells treated with BPS, gene sets enriched included Humoral Immunity in Vitiligo, Natural Killer T-Cell Roles in Diabetes Mellitus Type 1, and IL15R -> NF-kB/NFATC Signaling among others. In cells treated with BPF, gene sets enriched included GPCRs Family -> Expression Targets in Bone, TNF -> NF-kB Expression Targets, and Acute Phase in Atopic Dermatitis among others. Gene set enrichment analysis also identified common elements between BPS and BPF. These included immune-related signaling pathways (e.g., “CD4+ T-Cell Function Decline in HIV”, “Natural Killer Cell Activation”, and “IL2 Expression Targets”) and insulin related networks (e.g., “Natural Killer T-Cell Roles in Diabetes Mellitus Type 1”, “Insulin -> MEF/MYOD Expression Targets”, and “IGF1 -> ELK/SRF/HIF1A/MYC/SREBF Expression Targets”) (Table 3).
Pathway analysis revealed gene network associated with protein folding in SH-SY5Y cells exposed to BPF (Figure 8) and microglial and motor neuron dysregulation for BPS (Figure 9) as perturbed at the transcriptome level, both processes that underlie neuroinflammation and neurodegenerative diseases. Even though there was no change in mitochondrial bioenergetics nor MMP, there was some evidence of perturbed gene networks related to mitochondrial transport (Supplemental Figure S3).
3.8. Real-Time PCR Analysis
A subset of genes regulated by BPS and BPF were measured to compare to the RNA-seq data (Figure 10). Based on the functional enrichment, genes related to transcription/translation and measured for correspondence to the RNA-seq data. In general, transcripts followed expression patterns revealed by RNA-seq analysis. These included Gtf2h4, qPCR [F (2, 6) = 7.77, P=0.021] and RNA-seq [F(2, 7) = 149.8, P<0.0001]; Scg5, qPCR [F (2, 10) = 3.94, P=0.055] and RNA-seq [F (2, 9) = 2.24, P=0.16]; and Vars, qPCR [F (2, 9) = 4.41, P=0.046] and RNA-seq [F (2, 7) = 4.21, P=0.063].
4. Discussion
Bisphenol A has been restricted or banned in many countries because of the reported detrimental effects on human health associated with its exposure. Accordingly, derivatives (i.e., bisphenol B, E, F, and S) have been formulated to replace the utilization of BPA; however, limited data is available on the impact bisphenol derivatives have on toxicity mechanisms in neuronal cells. Neuronal cells can exhibit a varying degree of sensitivity towards chemical agents in different cell types; thus, it is important to elucidate different mechanisms of bisphenol-induced toxicity in cell types like neurons.
Our data indicated that both BPS and BPF induce cytotoxicity in SH-SY5Y cells, and responses were both time- and dose-dependent. Our data suggested that BPS was more cytotoxic (>50 µM at 48 h) to SH-SY5Y cells compared to BPF (>200 µM at 48 h). Other studies also report cytotoxicity for bisphenol replacements in neuronal cells. Liang et al. [34] exposed human embryonic stem cells to varying concentrations of seven different bisphenols (A, AF, B, E, F, S, and Z). During stem cell differentiation, cells were exposed to up to 300 µM for 24 hours and a concentration-dependent decrease in cell viability was observed. Interestingly, BPF and BPS were the least cytotoxic to human embryonic stem cells while BPAF was the most cytotoxic compound. In the study, proliferating cells were exposed from 0.001 - 300 µM for 24 hours and all bisphenols, except for BPS, reduced cell viability at the highest tested concentration. Additionally, for 16 days during the differentiation to neuron-like cells, cells exposed to 1, 10, or 100 nM of bisphenols decreased neurite length, suggesting that long-term bisphenol exposure can potentially contribute to neurotoxicity.
Other mammalian cells lines have been investigated for neurotoxicity of bisphenol replacements in rats and mice. Gill and Kumara [20] observed neurodevelopmental effects following rat fetal neural stem cells (rNSCs) exposure to 0.05 µM and 100 µM BPA or BPF for 7 days following their differentiation into neurons, astrocytes, or oligodendrocytes. BPA and BPF were found to increase cell proliferation and impact differentiation rates of neurons and oligodendrocytes in a dose-dependent manner. Additionally, morphometric analysis revealed that exposure to BPA and BPF reduced the branching of nerve fibers in the neurons, oligodendrocytes, and astrocytes. In another study, Pang et al. [35] observed that BPA, BPS, and BPB induced neurotoxic phenotypes in the hippocampal HT-22 cell line following exposure to 1 nM up to 100 μM for up to 7 days. After just 6 hours in the study, ROS production significantly increased in the cells following exposure to all compounds. Strong induction of apoptosis and lactate dehydrogenase (LDH) leakage rates were also detected following exposure for 24 and 48 hours. These studies prompted us to also investigate oxidative stress as a potential mechanism for neurotoxicity in the SH-SY5Y cells.
In our study, we did not observe any evidence for mitochondrial dysfunction (ROS production, MMP, ATPase activity) in SH-SY5Y cells following BPS and BPF exposure. These data suggest that mitochondria in SH-SY5Y cells may not be a primary target of BPS/BPF-induced toxicity; however, the mitochondria in other cell types may show increased sensitivity to bisphenol exposure. For instance, two other human neuroblastoma cell lines (IMR-32 and SK-N-SH) exposed to BPA, BPS, and BPB (1 nM up to 100 μM) for 24 hours [21] were observed to exhibit increased ROS and MDA content. In the study, MMP was reduced and protein levels of Bcl-2 Antagonist/Killer 1 (bak1), Bcl-2-Associated X (bax), cytochrome c (cyt c), and cysteinyl aspartate specific proteinase 3 (caspase-3) were increased, while protein levels of B-Cell Leukemia/Lymphoma 2 (blc-2) were down-regulated. Taken together, BPA, BPS, and BPB induced neurotoxic effects (oxidative stress and apoptosis) via the mitochondrial in these neuroblastoma cells. Another study conducted by Meng et al. [36] exposed hippocampal neurons of rats to BPA, BPS, or BPB (1 μM up to 100 μM) for 7 days. Exposure over 24 hours induced ROS production and increased MDA content; however, SOD activity decreased significantly. After a 7-day exposure to all bisphenols, cell viability decreased, and apoptosis rate increased. Reduction of MMP was also observed following exposure to BPA. In vitro, Huang et al. [37] exposed human granulosa KGN cells to up to 100 µM BPA, BPAF, BPF, or BPS and noted concentration-dependent ROS production. Specifically, 1-100 µM BPA and BPAF, 10 and 100 µM BPF, and 100 µM BPS induced ROS production. Additionally, antioxidant markers (i.e. catalase, superoxide dismutase, glutathione) were decreased depending on the bisphenol analog and oxidative biomacromolecule damage measured by increased levels of 8-hydroxy 2-deoxyguanosine, malondialdehyde, and protein carbonyl were documented with high concentrations of all tested compounds. We hypothesize that SH-SY5Y cells are more resistant to the effects of bisphenols relative to other neuronal cells lines. Indeed, there is good evidence that neuronal cell lines show varying degrees of sensitivity to chemical toxicants [38] and this may underscore the differences observed across studies.
As oxidative stress was not noted in the SH-SY5Y cells, we conducted a transcriptome analysis to identify other potential mechanisms related to BPS and BPF neurotoxicity. Our transcriptome analysis was conducted at a low concentration, relevant to potential exposures in the central nervous system [17]. The analysis revealed that a higher number of transcripts were responsive to BPS compared to BPF. This may be related to the relative toxicity potential of each compound. In addition, despite high similarity between the two molecules in chemical structure, the bisphenols perturbed unique signaling pathways in neuronal cells. For example, pathways unique to BPS but not BPF include Humoral Immunity in Vitiligo, Treg-Cell Activation in Diabetes Mellitus, and CD80 -> AP-1 Expression Targets while pathways unique to BPF but not BPS include IgE Receptors -> Targets in Lymphoid System and Blood, TLR9 Expression Targets, and Muscular Dystrophy, Facioscapulohumeral. However, there were several molecular pathways that were shared between BPF and BPS including Eosinophil Activation, IL2 Expression Targets, and TNF -> NF-kB Expression Targets. Other transcriptome studies show that these pathways/processes are also activated by BPA and its analogs [39,40].
Both bisphenols affected pathways such as “PARK2/PINK1/UCHL1 in Young Onset Parkinson’s Disease”, “TNF -> NF-kB Expression Targets”, and “Androgen Receptor/FKBP5 Signaling”. Kinch et al. [24] exposed embryonic zebrafish to 0.0068 μM BPA and BPS prior to neurogenesis (10-16 hpf), at the onset of neurogenesis (16-24 hpf), and at late neurogenic periods (24-36 hpf). Exposure to BPA and BPS led to a 180% and 240% increase in neurogenesis of the hypothalamus, respectively. Consequently, hyperactive behavior was observed in fish following the neurogenic window exposure. The pathway of BPA-mediated neurogenesis was shown to be associated with androgen receptor mediated upregulation of aromatase; thus, there is evidence that bisphenol replacements can be associated with neurological disorders, such as hyperactivity, and this may perturb early brain development especially during the neurogenic period of development. Several studies also elaborate on the connection of bisphenol exposure with neurodegenerative diseases (i.e., Parkinson’s disease, Alzheimer’s disease, and Amyotrophic lateral sclerosis) and neurodevelopmental disorders (i.e., autism and hyperactivity) [19]. Sukjamnong et al. [41] observed that prenatal rat exposure to 5,000 μg/kg BPA disrupts the transcriptome profiles of Alzheimer’s-related and neuroinflammatory genes in the hippocampus of offspring. Levels of tumor necrosis factor (tnf), nuclear factor-κB (NF-κB) protein, and its Alzheimer’s Disease related target gene (beta-secretase 1, bace1) increased. Thus, bisphenol exposure has been linked to neurodegenerative diseases.
Based on literature and databases that detail gene-protein interactions between entities, pathway analysis revealed that BPF impacted genes related to protein folding and BPS impacted genes related to microglia and motor neuron dysregulation. Most transcripts identified as being associated with a protein folding were downregulated and included Heat Shock Protein Family A Member 8 (HSPA8) and Member 14 (HSPA14), Heat Shock Protein 90 Alpha Family A Member 1 (HSP90AA1), and Translocase of Outer Mitochondrial Membrane 70 (TOMM70) among others. On the other hand, BPS upregulated both A Disintegrin and Metalloproteinase Domain 10 (ADAM10) and Domain 17 (ADAM17). Consequently, these genes promote microglial activation, which can contribute to neuroinflammation. Intriguingly, we found that both BPS and BPF affected pathways related to neuroinflammation, such as interleukin 2 (IL2), NF-κB, and TNF, and the two bisphenols are reported to impact similar pathways in in vivo and in vitro models; however, studies focus more on in vivo rodent models. Takahashi et al. [42] exposed pregnant mice to 20 and 200 μg/kg/day BPA over the course of their pregnancy and analyzed embryonic offspring brains where, compared to the controls, levels of inflammatory genes and signaling molecules were altered, including microglial markers, inflammatory factors (TNFα and interleukin 4), and neurotrophic factor (IGF-1). Similar neuronal inflammatory markers have also been reported by other studies. Akintunde et al. [43] exposed rats to 100 mg/kg BPA for 2 weeks and noted elevated neuronal interleukin-1β (IL-1β), TNFα, acetylcholinesterase (AChE), and monoamine oxidase-A (MAO-A) activity in the brain. Additionally, phosphodiesterase-5’ activity was enhanced, in which large increases may promote neuroinflammation [44]. In another study, Luo et al. [45] noted a 2.58- and 2.35-fold increase of TNF-α and interleukin-6 (IL-6), respectively, in the prefrontal cortex of F1 juvenile mice after mothers were treated with 50 mg/kg BPA for 2 weeks. Regarding in vitro models, BPA treatment (10 nM - 100 μM) increased hypothalamic pro-opiomelanocortin (POMC)-expressing mice cells and cultures, which was due to induced neuroinflammatory pathways (i.e., IKK-β/NFκB) [46]. Taken together, neuroinflammatory pathways appear to be altered with BPS and BPF exposure.
5. Conclusion
In summary, we evaluated the relative toxicity of BPS and BPF in a widely used neuronal cell line for degenerative disease research. We noted that in general, BPS exerted higher toxicity to the cells, inducing cytotoxicity and reducing cell viability at lower concentrations than BPF. We tested the hypothesis that the mitochondria of neuronal cells were a major target of BPS and BPF toxicity; however, negative effects on mitochondria were not readily detected based upon mitochondrial membrane potential, assessment of ROS levels, and mitochondrial bioenergetics. This suggests that the mitochondria may not be a direct target of BPS or BPF neurotoxicity. Nevertheless, chronic low dose exposures may still act to stress neurons and impair mitochondrial function. We identified several molecular pathways that may also underlie BPS-induced neurotoxicity at relevant tissue levels, including IL15R -> NF-kB/NFATC Signaling and CD8 -> NF-kB Expression Targets. Similarly, we identified several molecular pathways that may underlie BPF-induced neurotoxicity at relevant exposure levels, including TLR9 Expression Targets and TNF -> NF-kB Expression Targets. RNA-seq analysis revealed that, despite high conservation between the molecules in chemical structure, the bisphenol compounds perturb unique signaling pathways in neuronal cells. Taken together, acute exposures to bisphenol replacements may not have severe consequences on the phenotype of SH-SY5Y neuronal cells; however, with prolonged exposures, phenotypic manifestations of molecular perturbation may become more pronounced.
Supplementary Materials
The following supporting information can be downloaded at the website of this paper posted on Preprints.org. Supplemental Figures, Tables, and Data. Data also available in Zenodo (doi: 10.5281/zenodo.16187837)
Author Contributions
Investigation and writing—original draft preparation, A.G.; investigation, C.L.S.; writing—review and editing, E.I.; investigation, J.W.; investigation, S.S.; investigation, C.L.S.II.; investigation, formal analysis, writing—review and editing, supervision, and funding acquisition, C.J.M. All authors have read and agreed to the published version of the manuscript.
Funding
This research was funded by The University of Florida and the College of Veterinary Medicine provided funding as start-up funding (C.J.M). CLSII was supported by a UF Graduate School Fellowship (GSF).
Institutional Review Board Statement
Not applicable.
Data Availability Statement
All transcriptome data is available through the NCBI Gene Expression Omnibus at Accession (GSE217951).
Acknowledgments
None.
Conflicts of Interest
The authors declare no conflicts of interest. The funders had no role in the design of the study; in the collection, analyses, or interpretation of data; in the writing of the manuscript; or in the decision to publish the results.
Abbreviations
The following abbreviations are used in this manuscript:
| AChE | Acetylcholinesterase |
| ADAM10 | A Disintegrin and Metalloproteinase Domain 10 |
| ADAM17 | A Disintegrin and Metalloproteinase Domain 17 |
| AM/Rot | Antimycin/Rotenone |
| BAK1 | Bcl-2 Antagonist/Killer 1 |
| BAX | Bcl-2-Associated X |
| BACE1 | Beta-secretase 1 |
| BLC-2 | B-Cell Leukemia/Lymphoma 2 |
| BPA | Bisphenol A |
| BPF | Bisphenol F |
| BPS | Bisphenol S |
| Casp3/7 | Caspase 3/7 |
| Caspase3 | Cysteinyl aspartate specific proteinase 3 |
| CYT C | Cytochrome c |
| DCFDA | 2’,7’-dichlorofluorescein diacetate |
| DIG | Digitonin |
| DMSO | Dimethyl sulfoxide |
| ER | Estrogen receptor |
| FCCP | Carbonyl cyanide-4-phenylhydrazone |
| FPKM | Fragments per kilobase of transcript per million |
| GEO | Gene Expression Omnibus |
| GO | Gene Ontology |
| GPCR | G-protein coupled receptors |
| GSEA | Gene set enrichment analysis |
| HSPA8 | Heat Shock Protein Family A Member 8 |
| HSPA14 | Heat Shock Protein Family A Member 14 |
| HSP90AA1 | Heat Shock Protein 90 Alpha Family A Member 1 |
| IL-1β | Interleukin-1β |
| IL2 | Interleukin 2 |
| LDH | Lactate dehydrogenase |
| MAO-A | Monoamine oxidase-A |
| MDA | Malondialdehyde |
| MEN | Menadione |
| MMP | Mitochondrial membrane potential |
| NF-κB | Nuclear factor-κB |
| OM | Oligomycin |
| POMC | Pro-opiomelanocortin |
| RA | Retinoic acid |
| rNSCs | Rat fetal neural stem cells |
| ROS | Reactive oxygen species |
| TBHP | Tert-Butyl hydroperoxide |
| TNF | Tumor necrosis factor |
| TOMM70 | Translocase of Outer Mitochondrial Membrane 70 |
References
- Faheem, M.; Bhandari, R.K. Detrimental Effects of Bisphenol Compounds on Physiology and Reproduction in Fish: A Literature Review. Environ. Toxicol. Pharmacol. 2021, 81, 103497–103497. [CrossRef]
- Cariati, F.; D’uOnno, N.; Borrillo, F.; Iervolino, S.; Galdiero, G.; Tomaiuolo, R. “Bisphenol a: an emerging threat to male fertility”. Reprod. Biol. Endocrinol. 2019, 17, 1–8. [CrossRef]
- Pivonello, C.; Muscogiuri, G.; Nardone, A.; Garifalos, F.; Provvisiero, D.P.; Verde, N.; de Angelis, C.; Conforti, A.; Piscopo, M.; Auriemma, R.S.; et al. Bisphenol A: an emerging threat to female fertility. Reprod. Biol. Endocrinol. 2020, 18, 1–33. [CrossRef]
- Wang, X.H.; Souders, C.L.; Zhao, Y.H.; Martyniuk, C.J. Paraquat affects mitochondrial bioenergetics, dopamine system expression, and locomotor activity in zebrafish (Danio rerio). Chemosphere 2018, 191, 106–117. [CrossRef]
- Górowska-Wójtowicz, E., et al., Leydig cell tumorigenesis-implication of G-protein coupled membrane estrogen receptor, peroxisome proliferator-activated receptor and xenoestrogen exposure. In vivo and in vitro appraisal. Tissue and Cell, 2019. 61: p. 51-60.
- Chen, Q.; Wang, X.; Tan, H.; Shi, W.; Zhang, X.; Wei, S.; Giesy, J.P.; Yu, H. Molecular Initiating Events of Bisphenols on Androgen Receptor-Mediated Pathways Provide Guidelines for in Silico Screening and Design of Substitute Compounds. Environ. Sci. Technol. Lett. 2019, 6, 205–210. [CrossRef]
- Mu, X.; Liu, Z.; Zhao, X.; Yuan, L.; Li, Y.; Wang, C.; Xiao, G.; Mu, J.; Qiu, J.; Qian, Y. Bisphenol A Analogues Induce Neuroendocrine Disruption via Gut–Brain Regulation in Zebrafish. Environ. Sci. Technol. 2024, 58, 1022–1035. [CrossRef]
- Martínez, R.; Tu, W.; Eng, T.; Allaire-Leung, M.; Piña, B.; Navarro-Martín, L.; Mennigen, J.A. Acute and long-term metabolic consequences of early developmental Bisphenol A exposure in zebrafish (Danio rerio). Chemosphere 2020, 256, 127080. [CrossRef]
- Lehmler, H.-J., et al., Exposure to bisphenol A, bisphenol F, and bisphenol S in US adults and children: the national health and nutrition examination survey 2013–2014. ACS omega, 2018. 3(6): p. 6523-6532.
- Andújar, N.; Gálvez-Ontiveros, Y.; Zafra-Gómez, A.; Rodrigo, L.; Álvarez-Cubero, M.J.; Aguilera, M.; Monteagudo, C.; Rivas, A. Bisphenol A Analogues in Food and Their Hormonal and Obesogenic Effects: A Review. Nutrients 2019, 11, 2136. [CrossRef]
- Jurek, A.; Leitner, E. Analytical determination of bisphenol A (BPA) and bisphenol analogues in paper products by GC-MS/MS. Food Addit. Contam. Part A 2017, 34, 1225–1238. [CrossRef]
- Kojima, H.; Takeuchi, S.; Sanoh, S.; Okuda, K.; Kitamura, S.; Uramaru, N.; Sugihara, K.; Yoshinari, K. Profiling of bisphenol A and eight of its analogues on transcriptional activity via human nuclear receptors. Toxicology 2019, 413, 48–55. [CrossRef]
- imnáčová, H., et al., Low doses of Bisphenol S affect post-translational modifications of sperm proteins in male mice. Reproductive Biology and Endocrinology, 2020. 18: p. 1-10.
- Malaisé, Y.; Lencina, C.; Cartier, C.; Olier, M.; Ménard, S.; Guzylack-Piriou, L. Perinatal oral exposure to low doses of bisphenol A, S or F impairs immune functions at intestinal and systemic levels in female offspring mice. Environ. Heal. 2020, 19, 1–11. [CrossRef]
- Ferguson, M.; Lorenzen-Schmidt, I.; Pyle, W.G. Bisphenol S rapidly depresses heart function through estrogen receptor-β and decreases phospholamban phosphorylation in a sex-dependent manner. Sci. Rep. 2019, 9, 15948. [CrossRef]
- Zhang, R.; Guo, J.; Wang, Y.; Sun, R.; Dong, G.; Wang, X.; Du, G. Prenatal bisphenol S exposure induces hepatic lipid deposition in male mice offspring through downregulation of adipose-derived exosomal miR-29a-3p. J. Hazard. Mater. 2023, 453, 131410. [CrossRef]
- Charisiadis, P.; Andrianou, X.D.; van der Meer, T.P.; Dunnen, W.F.A.D.; Swaab, D.F.; Wolffenbuttel, B.H.R.; Makris, K.C.; van Vliet-Ostaptchouk, J.V. Possible Obesogenic Effects of Bisphenols Accumulation in the Human Brain. Sci. Rep. 2018, 8, 8186. [CrossRef]
- Jiang, Y.; Li, J.; Xu, S.; Zhou, Y.; Zhao, H.; Li, Y.; Xiong, C.; Sun, X.; Liu, H.; Liu, W.; et al. Prenatal exposure to bisphenol A and its alternatives and child neurodevelopment at 2 years. J. Hazard. Mater. 2020, 388, 121774. [CrossRef]
- Rebolledo-Solleiro, D., L.Y.C. Flores, and H. Solleiro-Villavicencio, Impact of BPA on behavior, neurodevelopment and neurodegeneration. Frontiers in Bioscience-Landmark, 2020. 26(2): p. 363-400.
- Gill, S.; Kumara, V.M.R. Comparative Neurodevelopment Effects of Bisphenol A and Bisphenol F on Rat Fetal Neural Stem Cell Models. Cells 2021, 10, 793. [CrossRef]
- Wang, C.; He, J.; Xu, T.; Han, H.; Zhu, Z.; Meng, L.; Pang, Q.; Fan, R. Bisphenol A(BPA), BPS and BPB-induced oxidative stress and apoptosis mediated by mitochondria in human neuroblastoma cell lines. Ecotoxicol. Environ. Saf. 2021, 207, 111299. [CrossRef]
- Kim, S.S.; Kim, J.L.; Hwang, K.-S.; Park, H.-C.; Bae, M.A.; Kim, K.-T.; Cho, S.-H. Mechanism of action and neurotoxic effects of chronic exposure to bisphenol F in adult zebrafish. Sci. Total. Environ. 2022, 851, 158258. [CrossRef]
- Gyimah, E.; Xu, H.; Dong, X.; Qiu, X.; Zhang, Z.; Bu, Y.; Akoto, O. Developmental neurotoxicity of low concentrations of bisphenol A and S exposure in zebrafish. Chemosphere 2021, 262, 128045. [CrossRef]
- Kinch, C.D.; Ibhazehiebo, K.; Jeong, J.-H.; Habibi, H.R.; Kurrasch, D.M. Low-dose exposure to bisphenol A and replacement bisphenol S induces precocious hypothalamic neurogenesis in embryonic zebrafish. Proc. Natl. Acad. Sci. 2015, 112, 1475–1480. [CrossRef]
- Sanchez, C.L.; Souders, C.L.; Pena-Delgado, C.J.; Nguyen, K.T.; Kroyter, N.; El Ahmadie, N.; Aristizabal-Henao, J.J.; Bowden, J.A.; Martyniuk, C.J. Neurotoxicity assessment of triazole fungicides on mitochondrial oxidative respiration and lipids in differentiated human SH-SY5Y neuroblastoma cells. NeuroToxicology 2020, 80, 76–86. [CrossRef]
- Xie, H.-R.; Hu, L.-S.; Li, G.-Y. SH-SY5Y human neuroblastoma cell line: in vitro cell model of dopaminergic neurons in Parkinson's disease.. 2010, 123, 1086–92.
- Kovalevich, J.; Langford, D. Considerations for the use of SH-SY5Y neuroblastoma cells in neurobiology. Methods Mol. Biol. 2013, 1078, 9–21. [CrossRef]
- Korecka, J.A.; van Kesteren, R.E.; Blaas, E.; Spitzer, S.O.; Kamstra, J.H.; Smit, A.B.; Swaab, D.F.; Verhaagen, J.; Bossers, K.; Lim, K.-L. Phenotypic Characterization of Retinoic Acid Differentiated SH-SY5Y Cells by Transcriptional Profiling. PLOS ONE 2013, 8, e63862. [CrossRef]
- Souders, C.L.; Sanchez, C.L.; Malphurs, W.; Aristizabal-Henao, J.J.; Bowden, J.A.; Martyniuk, C.J. Metabolic profiling in human SH-SY5Y neuronal cells exposed to perfluorooctanoic acid (PFOA). NeuroToxicology 2021, 85, 160–172. [CrossRef]
- Breton, T.S.; Murray, C.A.; Huff, S.R.; Phaneuf, A.M.; Tripp, B.M.; Patuel, S.J.; Martyniuk, C.J.; DiMaggio, M.A. Phoenixin-14 alters transcriptome and steroid profiles in female green-spotted puffer (Dichotomyctere nigroviridis). Sci. Rep. 2022, 12, 1–14. [CrossRef]
- Patuel, S.J.; English, C.; Lopez-Scarim, V.; Konig, I.; Souders, C.L.; Ivantsova, E.; Martyniuk, C.J. The novel insecticide broflanilide dysregulates transcriptional networks associated with ion channels and induces hyperactivity in zebrafish (Danio rerio) larvae. Sci. Total. Environ. 2023, 904, 167072. [CrossRef]
- Souders, C.L.; Rushin, A.; Sanchez, C.L.; Toth, D.; Adamovsky, O.; Martyniuk, C.J. Mitochondrial and transcriptome responses in rat dopaminergic neuronal cells following exposure to the insecticide fipronil. NeuroToxicology 2021, 85, 173–185. [CrossRef]
- Cicinnati, V.R.; Shen, Q.; Sotiropoulos, G.C.; Radtke, A.; Gerken, G.; Beckebaum, S. Validation of putative reference genes for gene expression studies in human hepatocellular carcinoma using real-time quantitative RT-PCR. BMC Cancer 2008, 8, 350–350. [CrossRef]
- Liang, X.; Yin, N.; Liang, S.; Yang, R.; Liu, S.; Lu, Y.; Jiang, L.; Zhou, Q.; Jiang, G.; Faiola, F. Bisphenol A and several derivatives exert neural toxicity in human neuron-like cells by decreasing neurite length. Food Chem. Toxicol. 2020, 135, 111015. [CrossRef]
- Pang, Q.; Li, Y.; Meng, L.; Li, G.; Luo, Z.; Fan, R. Neurotoxicity of BPA, BPS, and BPB for the hippocampal cell line (HT-22): An implication for the replacement of BPA in plastics. Chemosphere 2019, 226, 545–552. [CrossRef]
- Meng, L.; Liu, J.; Wang, C.; Ouyang, Z.; Kuang, J.; Pang, Q.; Fan, R. Sex-specific oxidative damage effects induced by BPA and its analogs on primary hippocampal neurons attenuated by EGCG. Chemosphere 2021, 264, 128450. [CrossRef]
- Huang, M.; Liu, S.; Fu, L.; Jiang, X.; Yang, M. Bisphenol A and its analogues bisphenol S, bisphenol F and bisphenol AF induce oxidative stress and biomacromolecular damage in human granulosa KGN cells. Chemosphere 2020, 253, 126707. [CrossRef]
- Heusinkveld, H.J.; Westerink, R.H. Comparison of different in vitro cell models for the assessment of pesticide-induced dopaminergic neurotoxicity. Toxicol. Vitr. 2017, 45, 81–88. [CrossRef]
- Miao, S.; Gao, Z.; Kou, Z.; Xu, G.; Su, C.; Liu, N. Influence of Bisphenol A on Developing Rat Estrogen Receptors and Some Cytokines in Rats: A Two-Generational Study. J. Toxicol. Environ. Heal. Part A 2008, 71, 1000–1008. [CrossRef]
- Zhu, J.; Jiang, L.; Liu, Y.; Qian, W.; Liu, J.; Zhou, J.; Gao, R.; Xiao, H.; Wang, J. MAPK and NF-κB Pathways Are Involved in Bisphenol A-Induced TNF-α and IL-6 Production in BV2 Microglial Cells. Inflammation 2014, 38, 637–648. [CrossRef]
- Sukjamnong, S.; Thongkorn, S.; Kanlayaprasit, S.; Saeliw, T.; Hussem, K.; Warayanon, W.; Hu, V.W.; Tencomnao, T.; Sarachana, T. Prenatal exposure to bisphenol A alters the transcriptome-interactome profiles of genes associated with Alzheimer’s disease in the offspring hippocampus. Sci. Rep. 2020, 10, 9487. [CrossRef]
- Takahashi, M.; Komada, M.; Miyazawa, K.; Goto, S.; Ikeda, Y. Bisphenol A exposure induces increased microglia and microglial related factors in the murine embryonic dorsal telencephalon and hypothalamus. Toxicol. Lett. 2018, 284, 113–119. [CrossRef]
- Akintunde, J.; Akintola, T.; Adenuga, G.; Odugbemi, Z.; Adetoye, R.; Akintunde, O. Naringin attenuates Bisphenol-A mediated neurotoxicity in hypertensive rats by abrogation of cerebral nucleotide depletion, oxidative damage and neuroinflammation. NeuroToxicology 2020, 81, 18–33. [CrossRef]
- García-Osta, A., et al., Phosphodiesterases as therapeutic targets for Alzheimer’s disease. ACS chemical neuroscience, 2012. 3(11): p. 832-844.
- Luo, G.; Wang, S.; Li, Z.; Wei, R.; Zhang, L.; Liu, H.; Wang, C.; Niu, R.; Wang, J. Maternal Bisphenol A Diet Induces Anxiety-Like Behavior in Female Juvenile with Neuroimmune Activation. Toxicol. Sci. 2014, 140, 364–373. [CrossRef]
- Salehi, A.; Loganathan, N.; Belsham, D.D. Bisphenol A induces Pomc gene expression through neuroinflammatory and PPARγ nuclear receptor-mediated mechanisms in POMC-expressing hypothalamic neuronal models. Mol. Cell. Endocrinol. 2019, 479, 12–19. [CrossRef]
Figure 1.
SH-SY5Y cell viability at (A) 24 hours, (B) 48 hours, or (C) 72 hours following exposure to media, 0.1% DMSO, Antimycin/Rotenone (AM/Rot), or one dose of either BPF or BPS at 0.1, 0.5, 1, 5, 10, 50, 100, 150, 200, or 250 µM. The column represents mean relative luminescence ± standard deviation relative to the media control (One-way ANOVA with Dunnett’s multiple comparison test, n=4/experiment). Asterisks denotes significant differences at *p< 0.05, **p<0.01, ***p<0.001, ****p<0.0001).
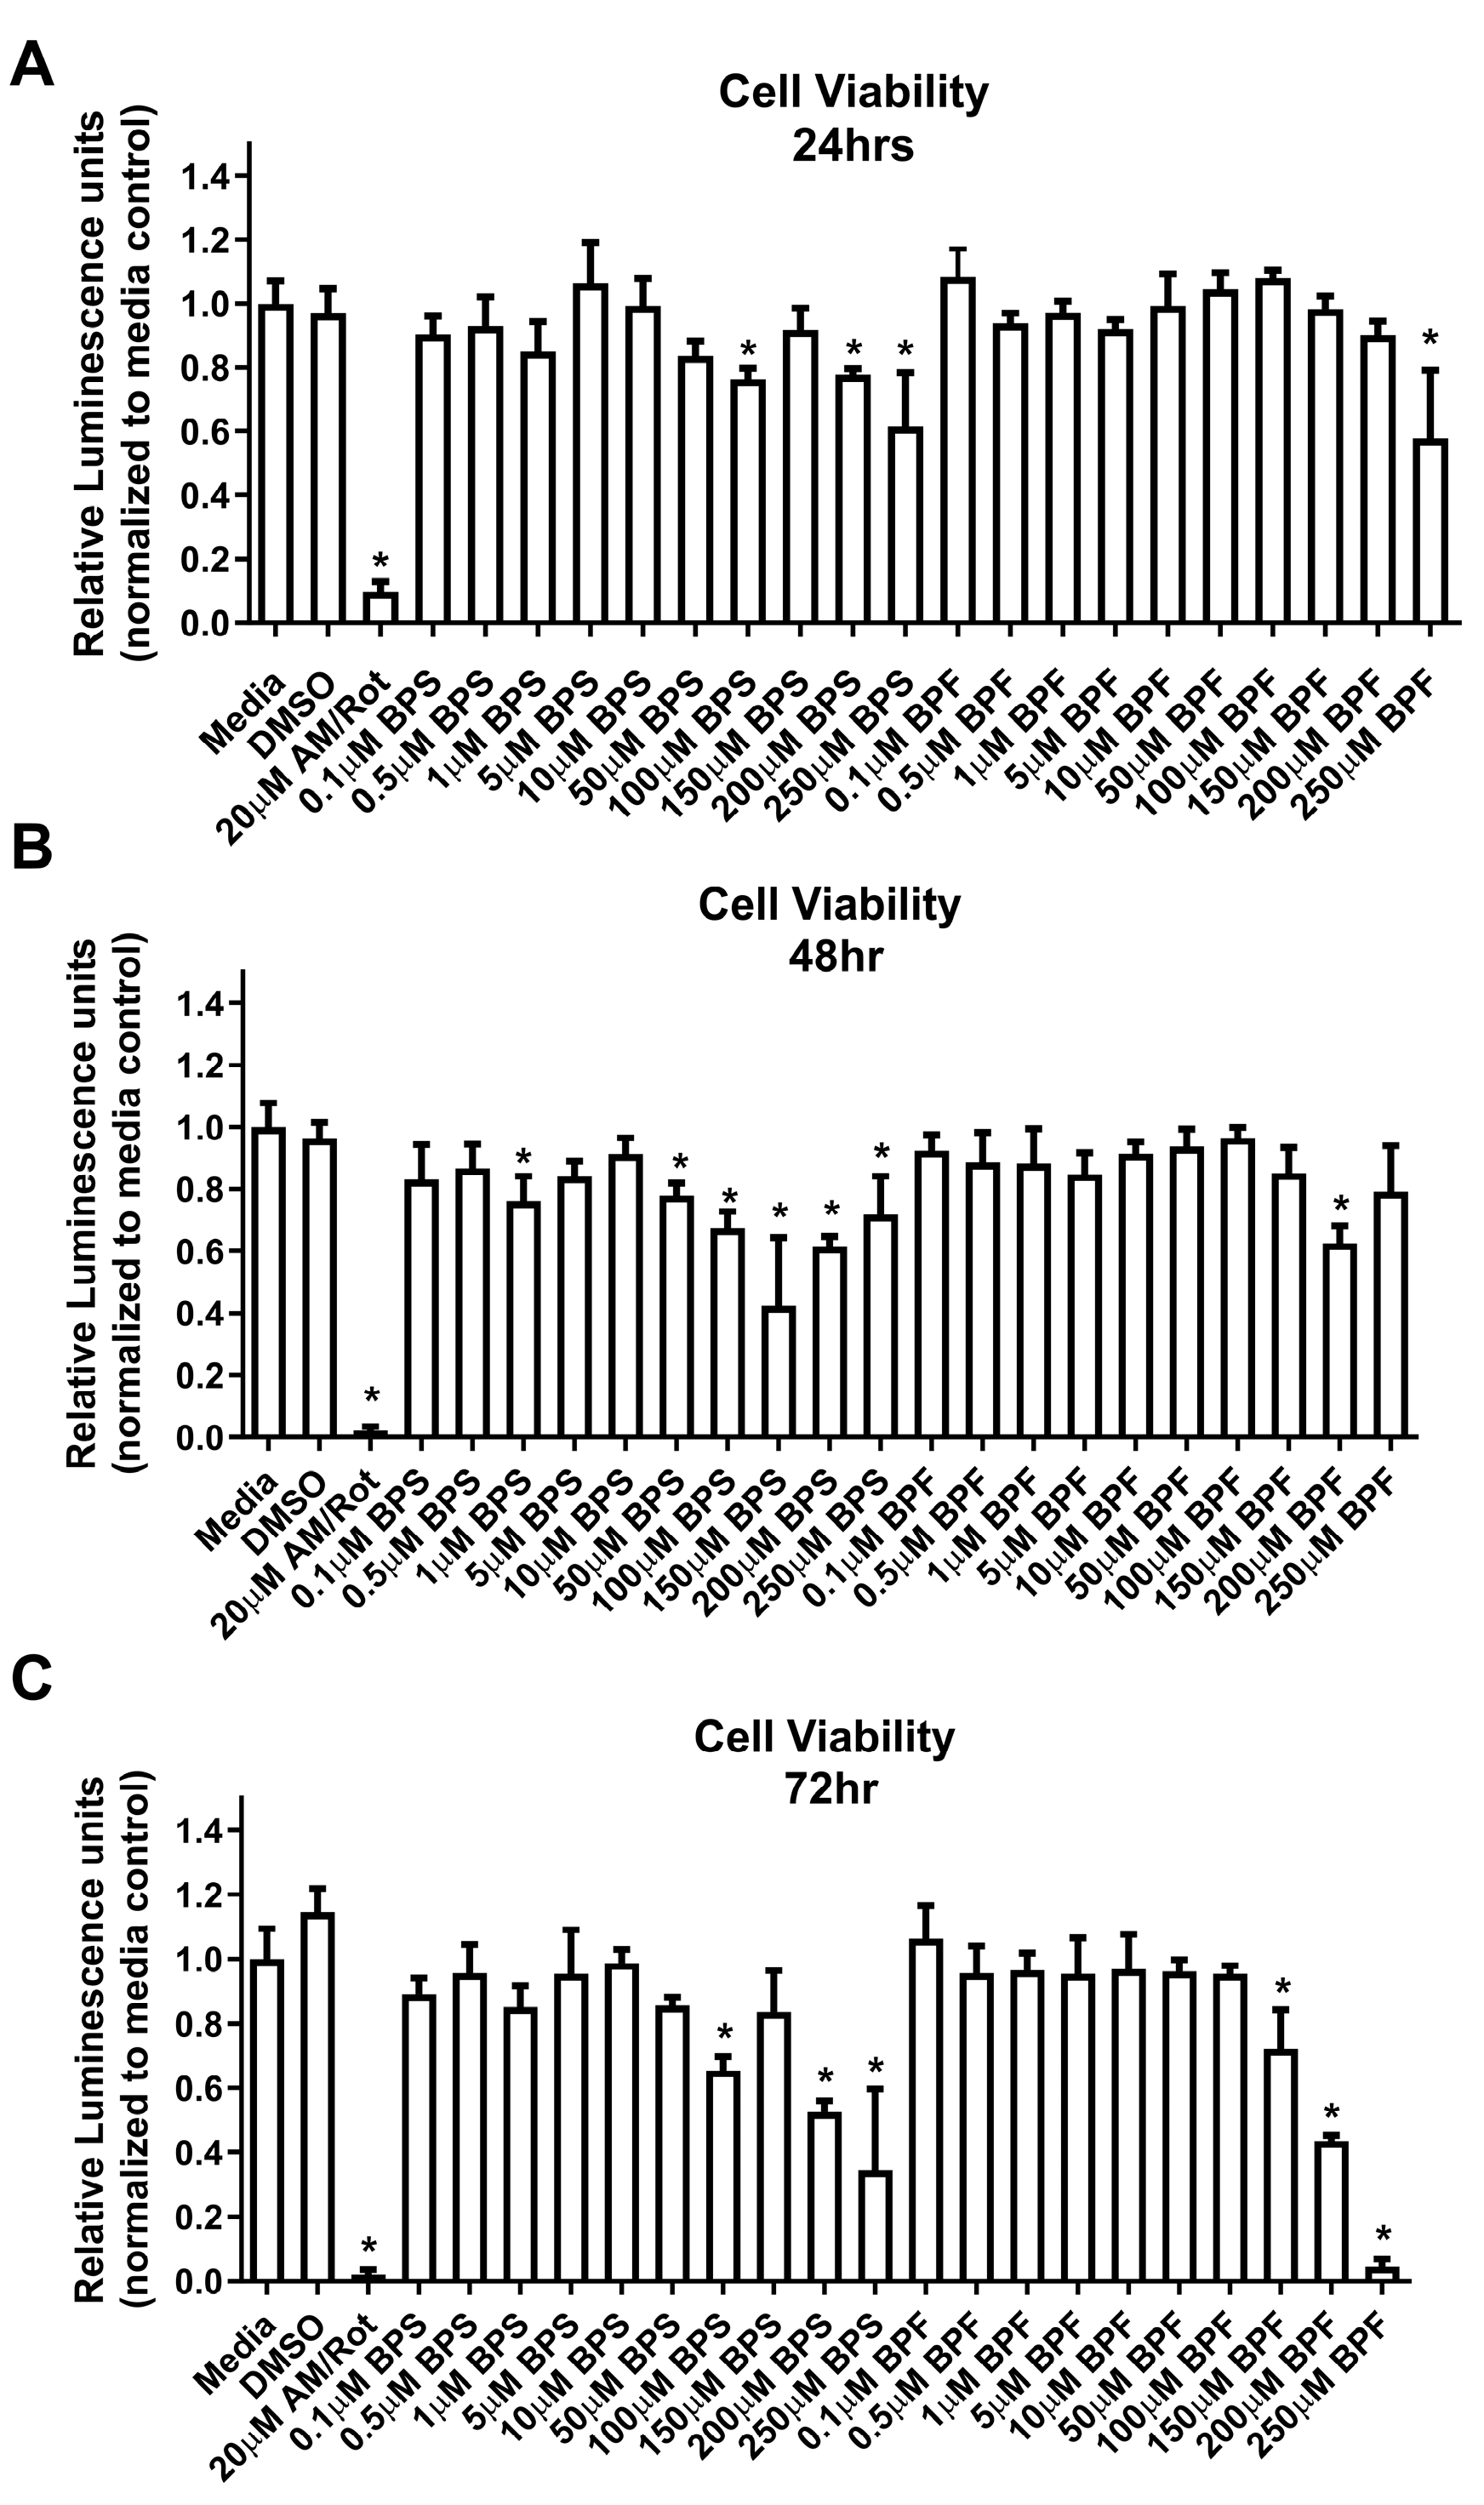
Figure 2.
Caspase 3/7 activity after (A) 4 hours, (B) 24 hours, and (C) 48 hours exposure to media, 0.1% DMSO, digitonin, Antimycin/Rotenone (1, 10, or 100 µM AM/Rot), or one concentration of either BPF or BPS at 0.1, 1, 10, 100, or 250 µM. The column represents mean relative luminescence ± standard deviation from the media control. Shading depicts the following groups (white = negative controls; light gray = positive controls; dark gray = BPS; black = BPF) (One-way ANOVA with Dunnett’s multiple comparison test, n=3/experiment). Asterisks denotes significant differences at *p< 0.05, **p<0.01, ***p<0.001, ****p<0.0001).
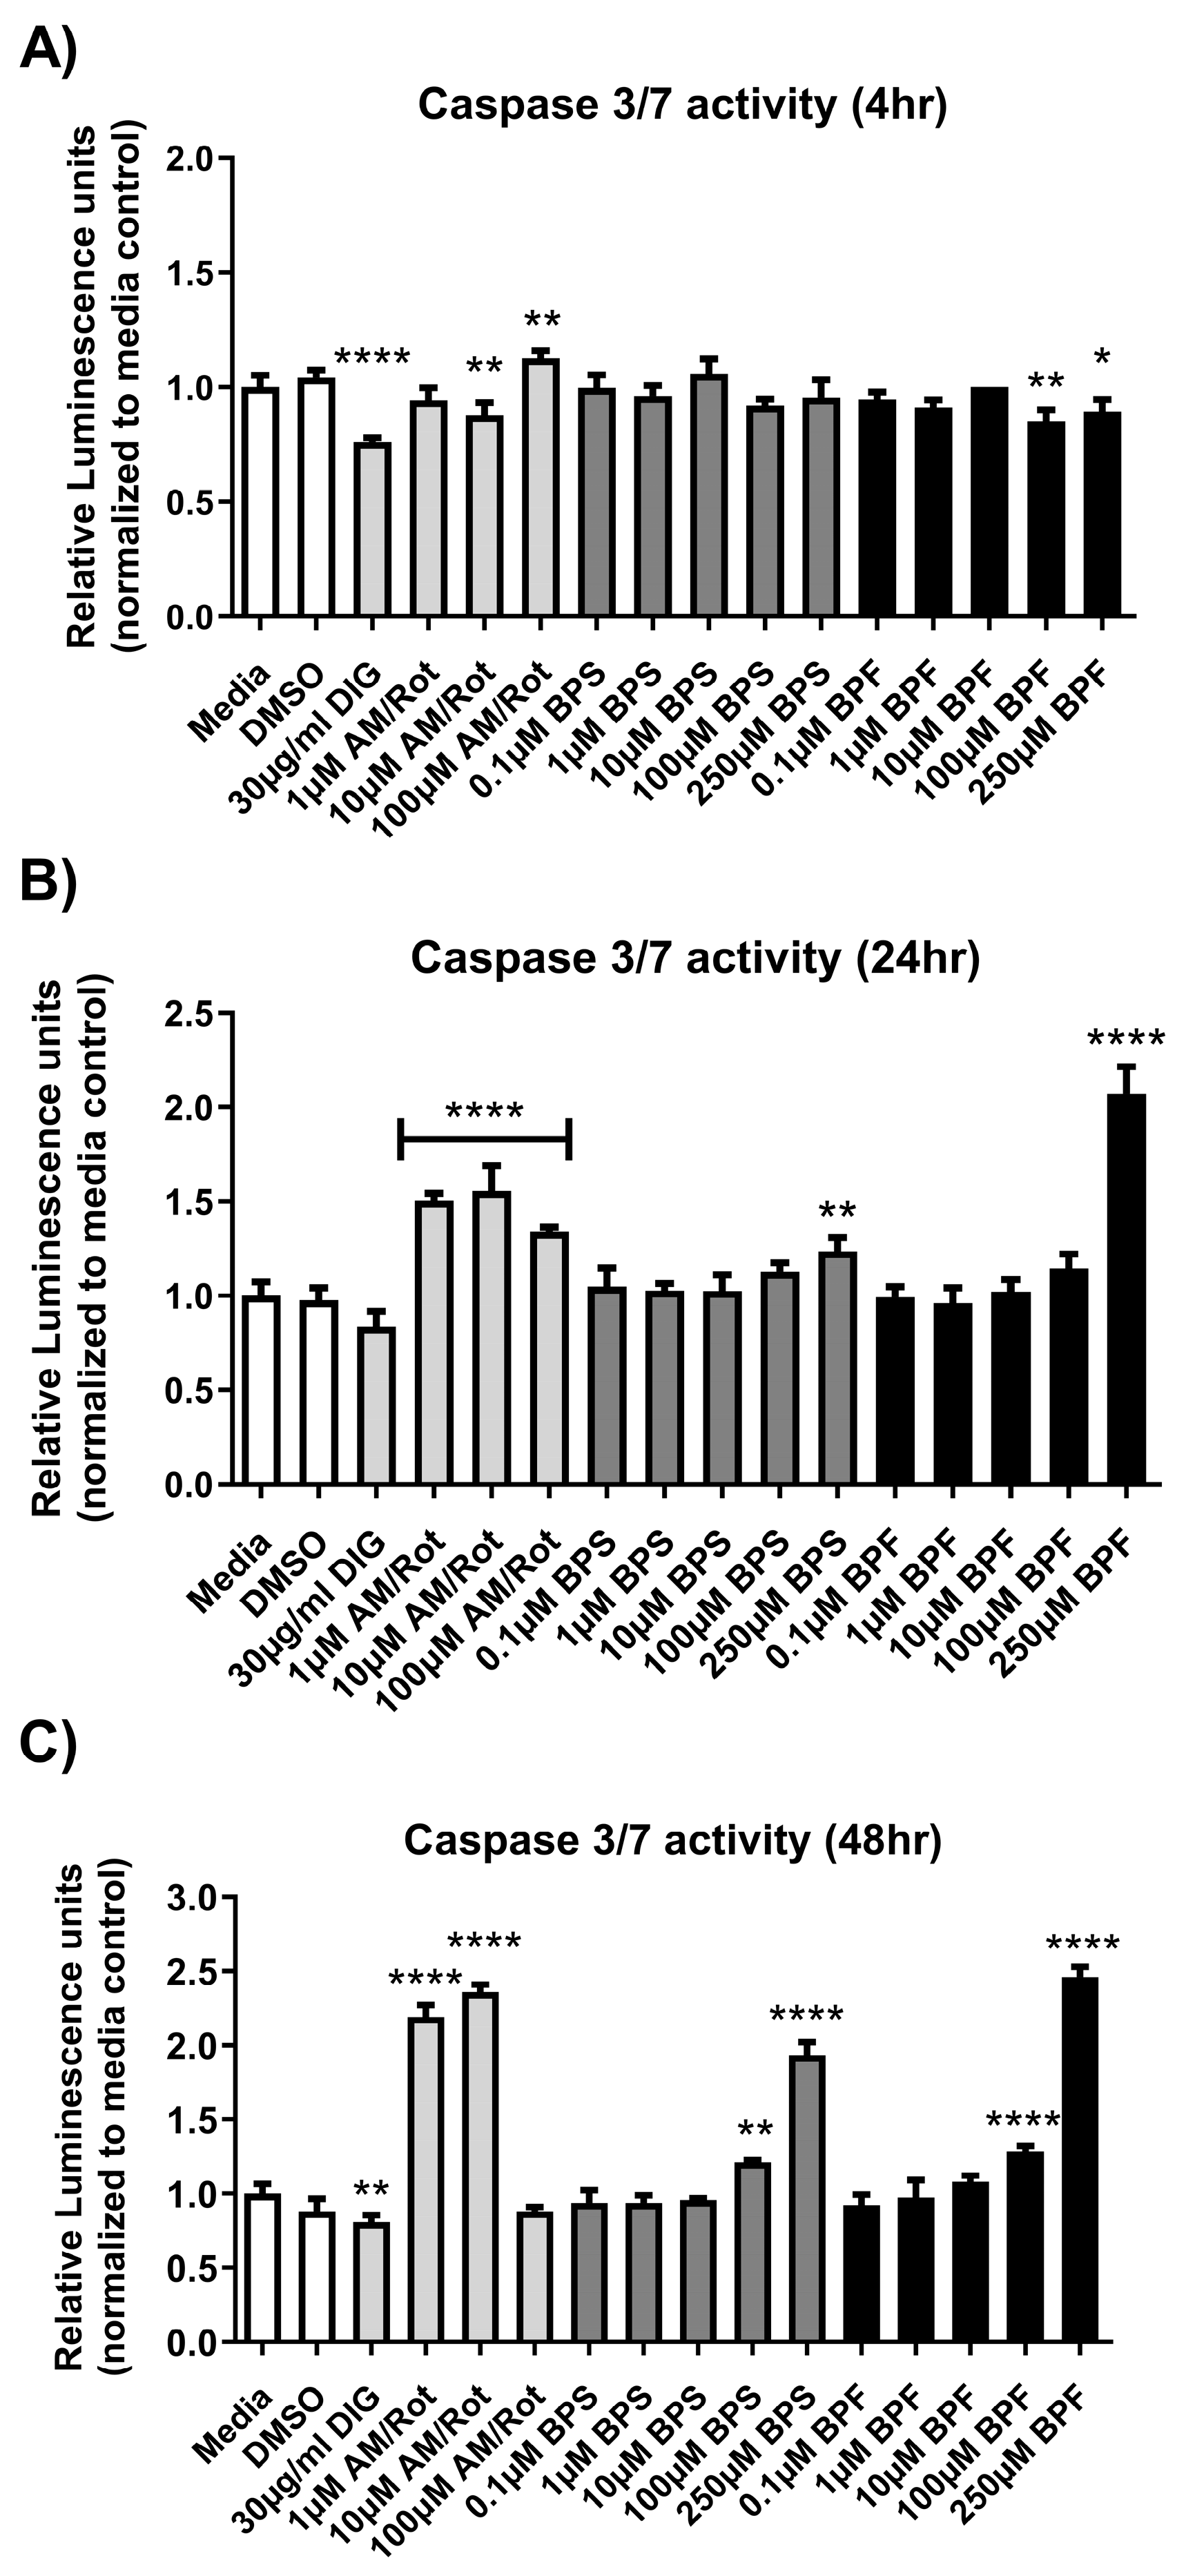
Figure 3.
Mitochondrial membrane potential (MMP) of SH-SY5Y cells treated with 0.1% DMSO, media, 4 and 8 μM carbonyl cyanide-4-phenylhydrazone (FCCP), or one dose of either BPF or BPS at 0.001 µM up to 250 µM after 4 hours. The experiment was conducted twice with the same results. Data are expressed as relative mean intensity units ± standard deviation standardized to the solvent control (One-way ANOVA followed by a Dunnett’s multiple comparison test, n=3/treatment/experiment). Asterisks denotes significant differences at *p< 0.05, **p<0.01, ***p<0.001, ****p<0.0001).
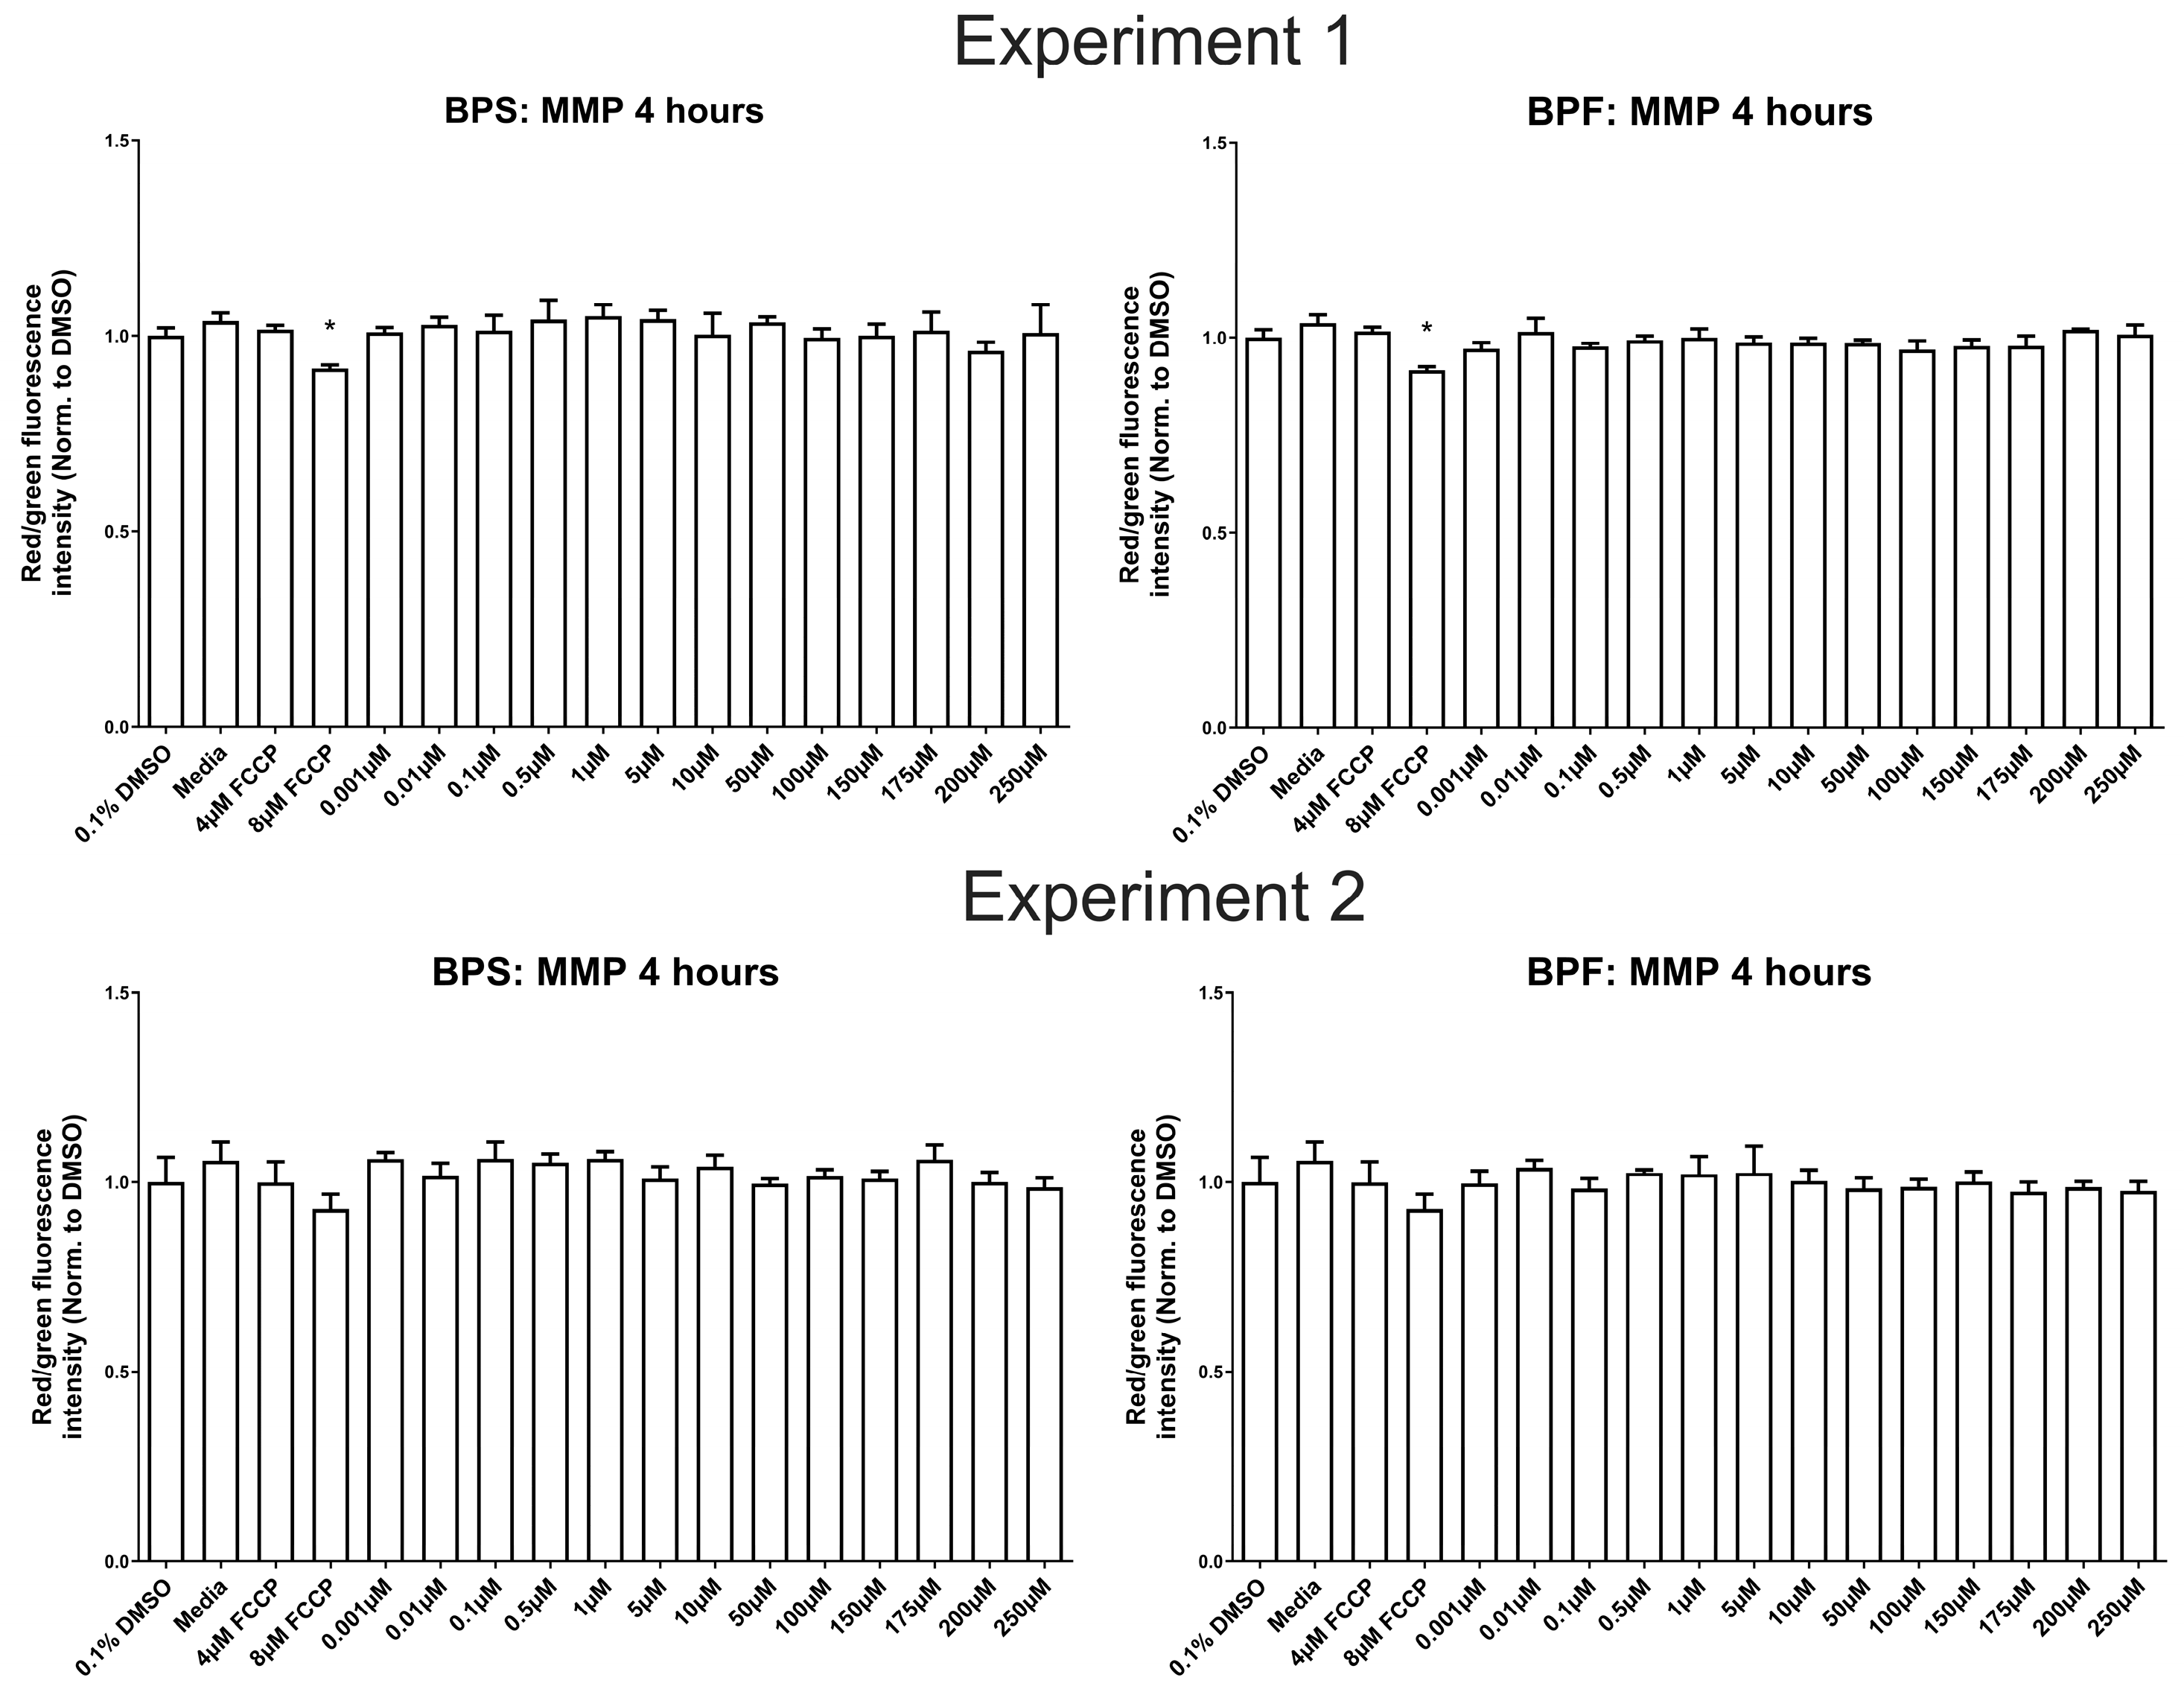
Figure 4.
ATP synthase activity following exposure to media, 0.1% DMSO, 10 µM oligomycin, or one dose of either BPF or BPS at 10, 50, 100, 175, or 250 µM. The column represents mean rate of absorbance ± standard deviation standardized to solvent control (One-way ANOVA with a Dunnett’s multiple comparison test, n=4/experimental group). Asterisks denotes significant differences at *p< 0.05, **p<0.01, ***p<0.001, ****p<0.0001.
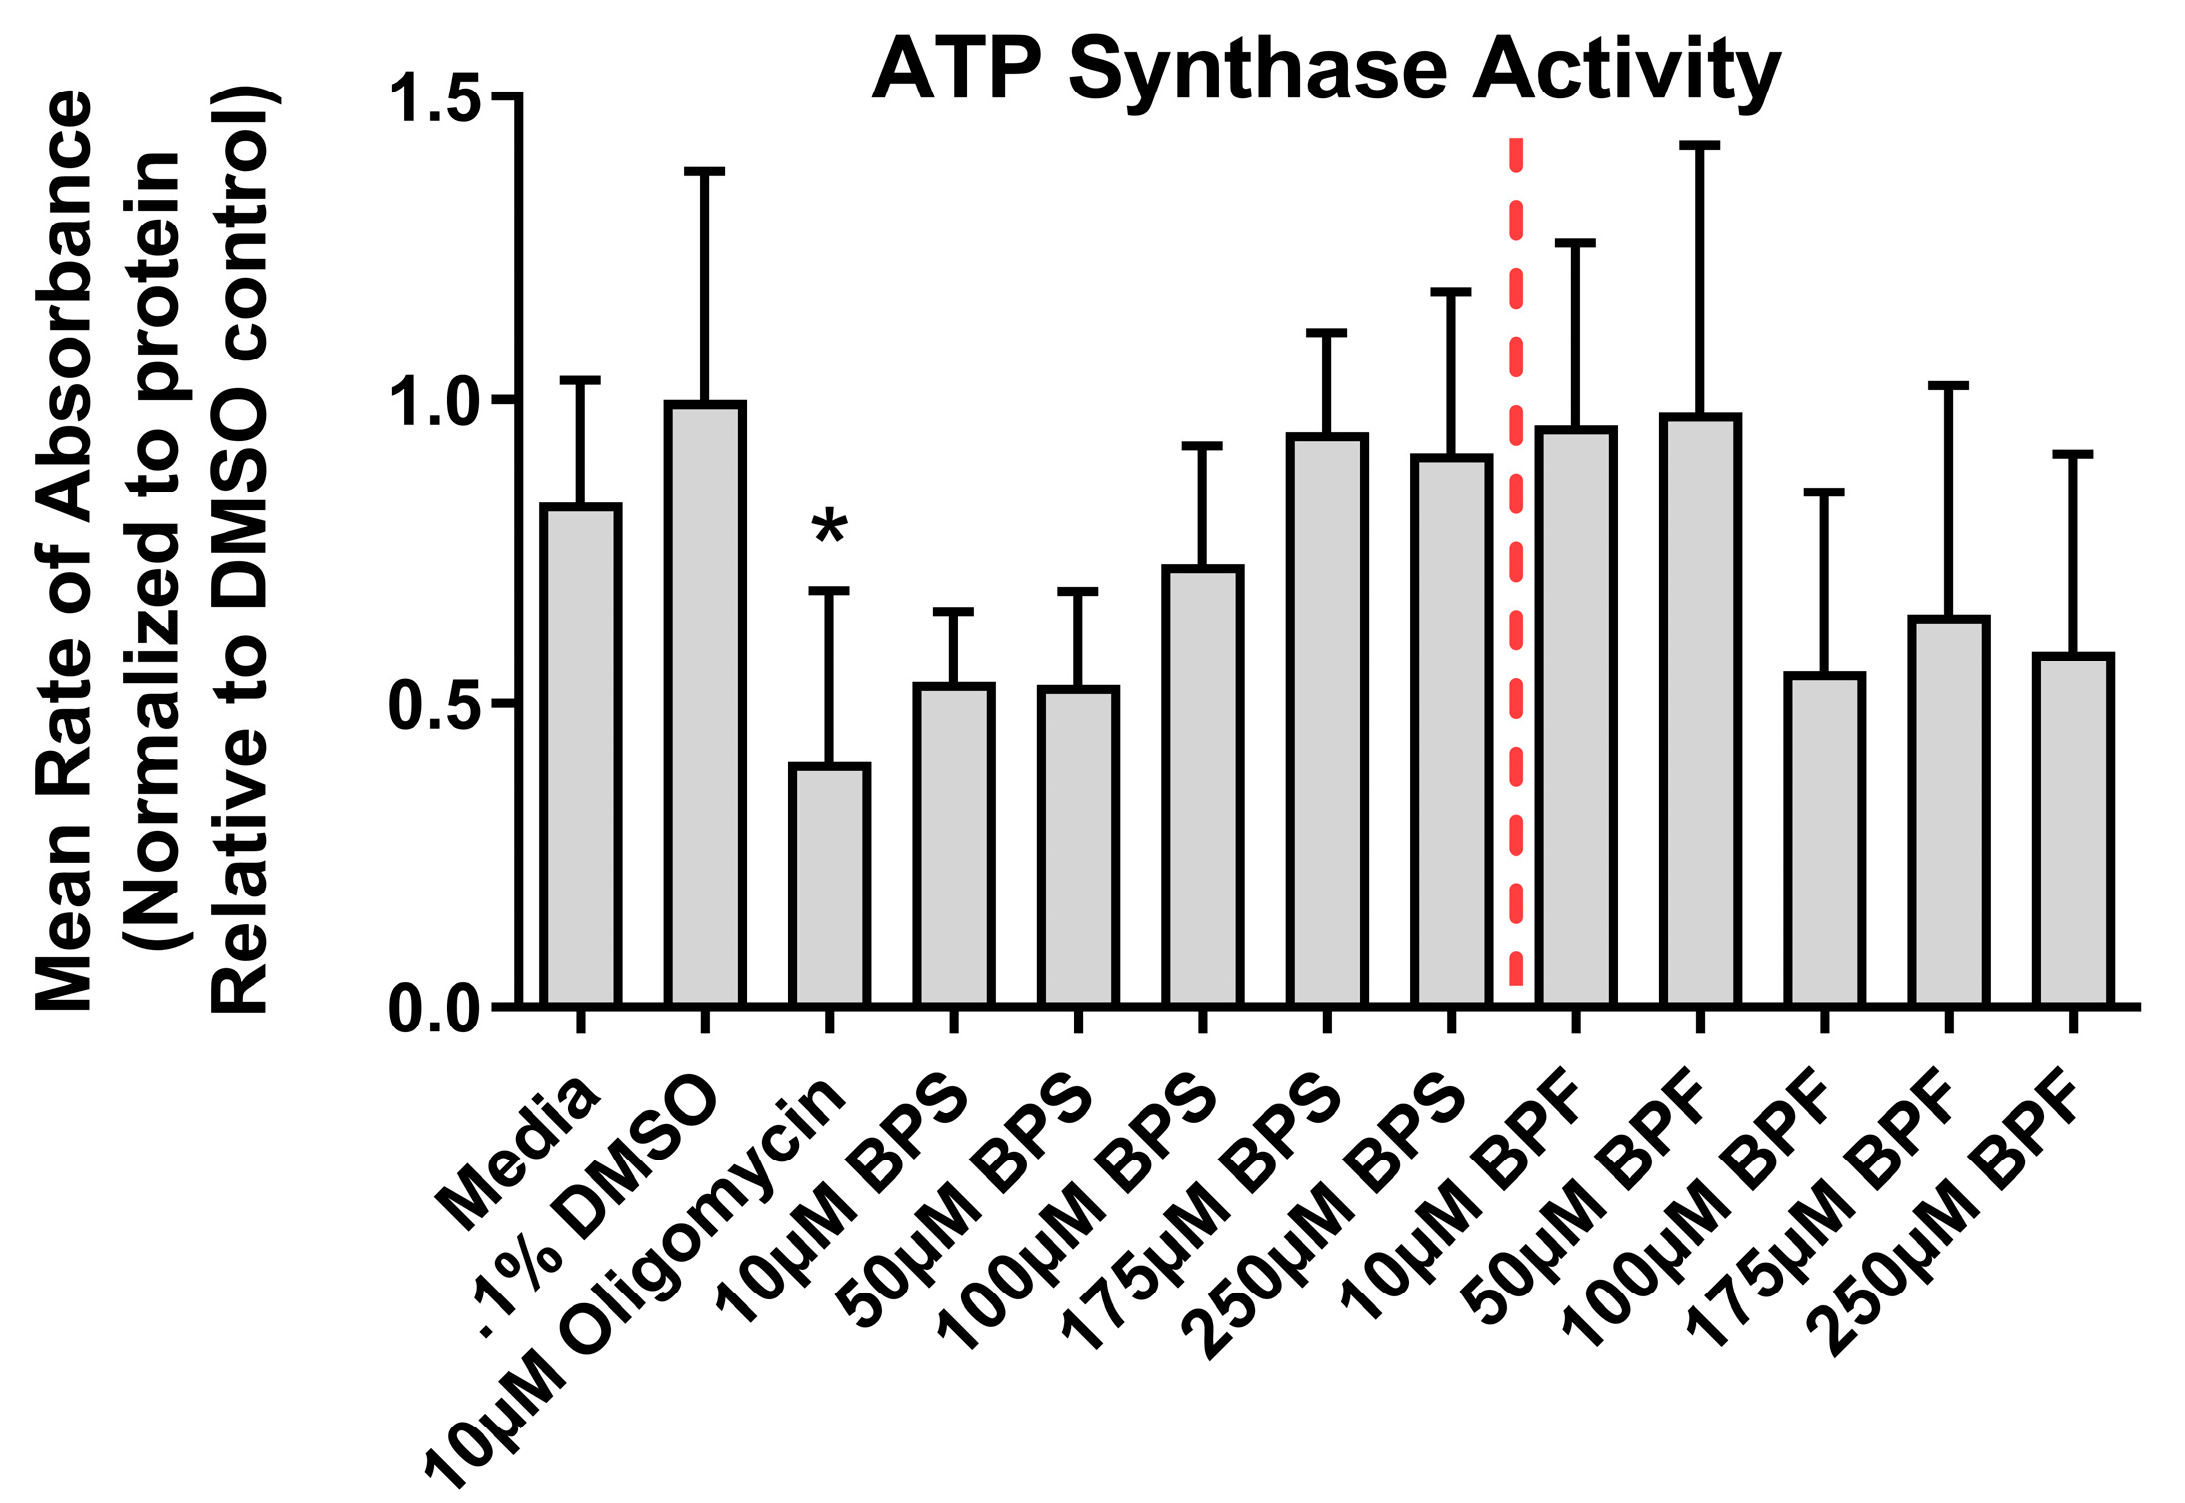
Figure 5.
Reactive oxygen species levels in SH-SY5Y cells after exposure to bisphenols. (A, B, C) 4, 24, and 48-hour ROS-Glo assay and (D, E, F) 4, 24, and 48-hour DCFDA-based assay following exposure to media, 0.1% DMSO, 50 and 200 µM tert-Butyl hydroperoxide (TBHP), 50 µM menadione (MEN), or one dose of either 1, 10, 100, 175, or 250 µM BPF or BPS. The column represents mean relative luminescence ± standard deviation from the media control (One-way ANOVA with a Dunnett’s multiple comparison test, n=4/experimental group). Asterisks denotes significant differences at *p< 0.05, **p<0.01, ***p<0.001, ****p<0.0001).
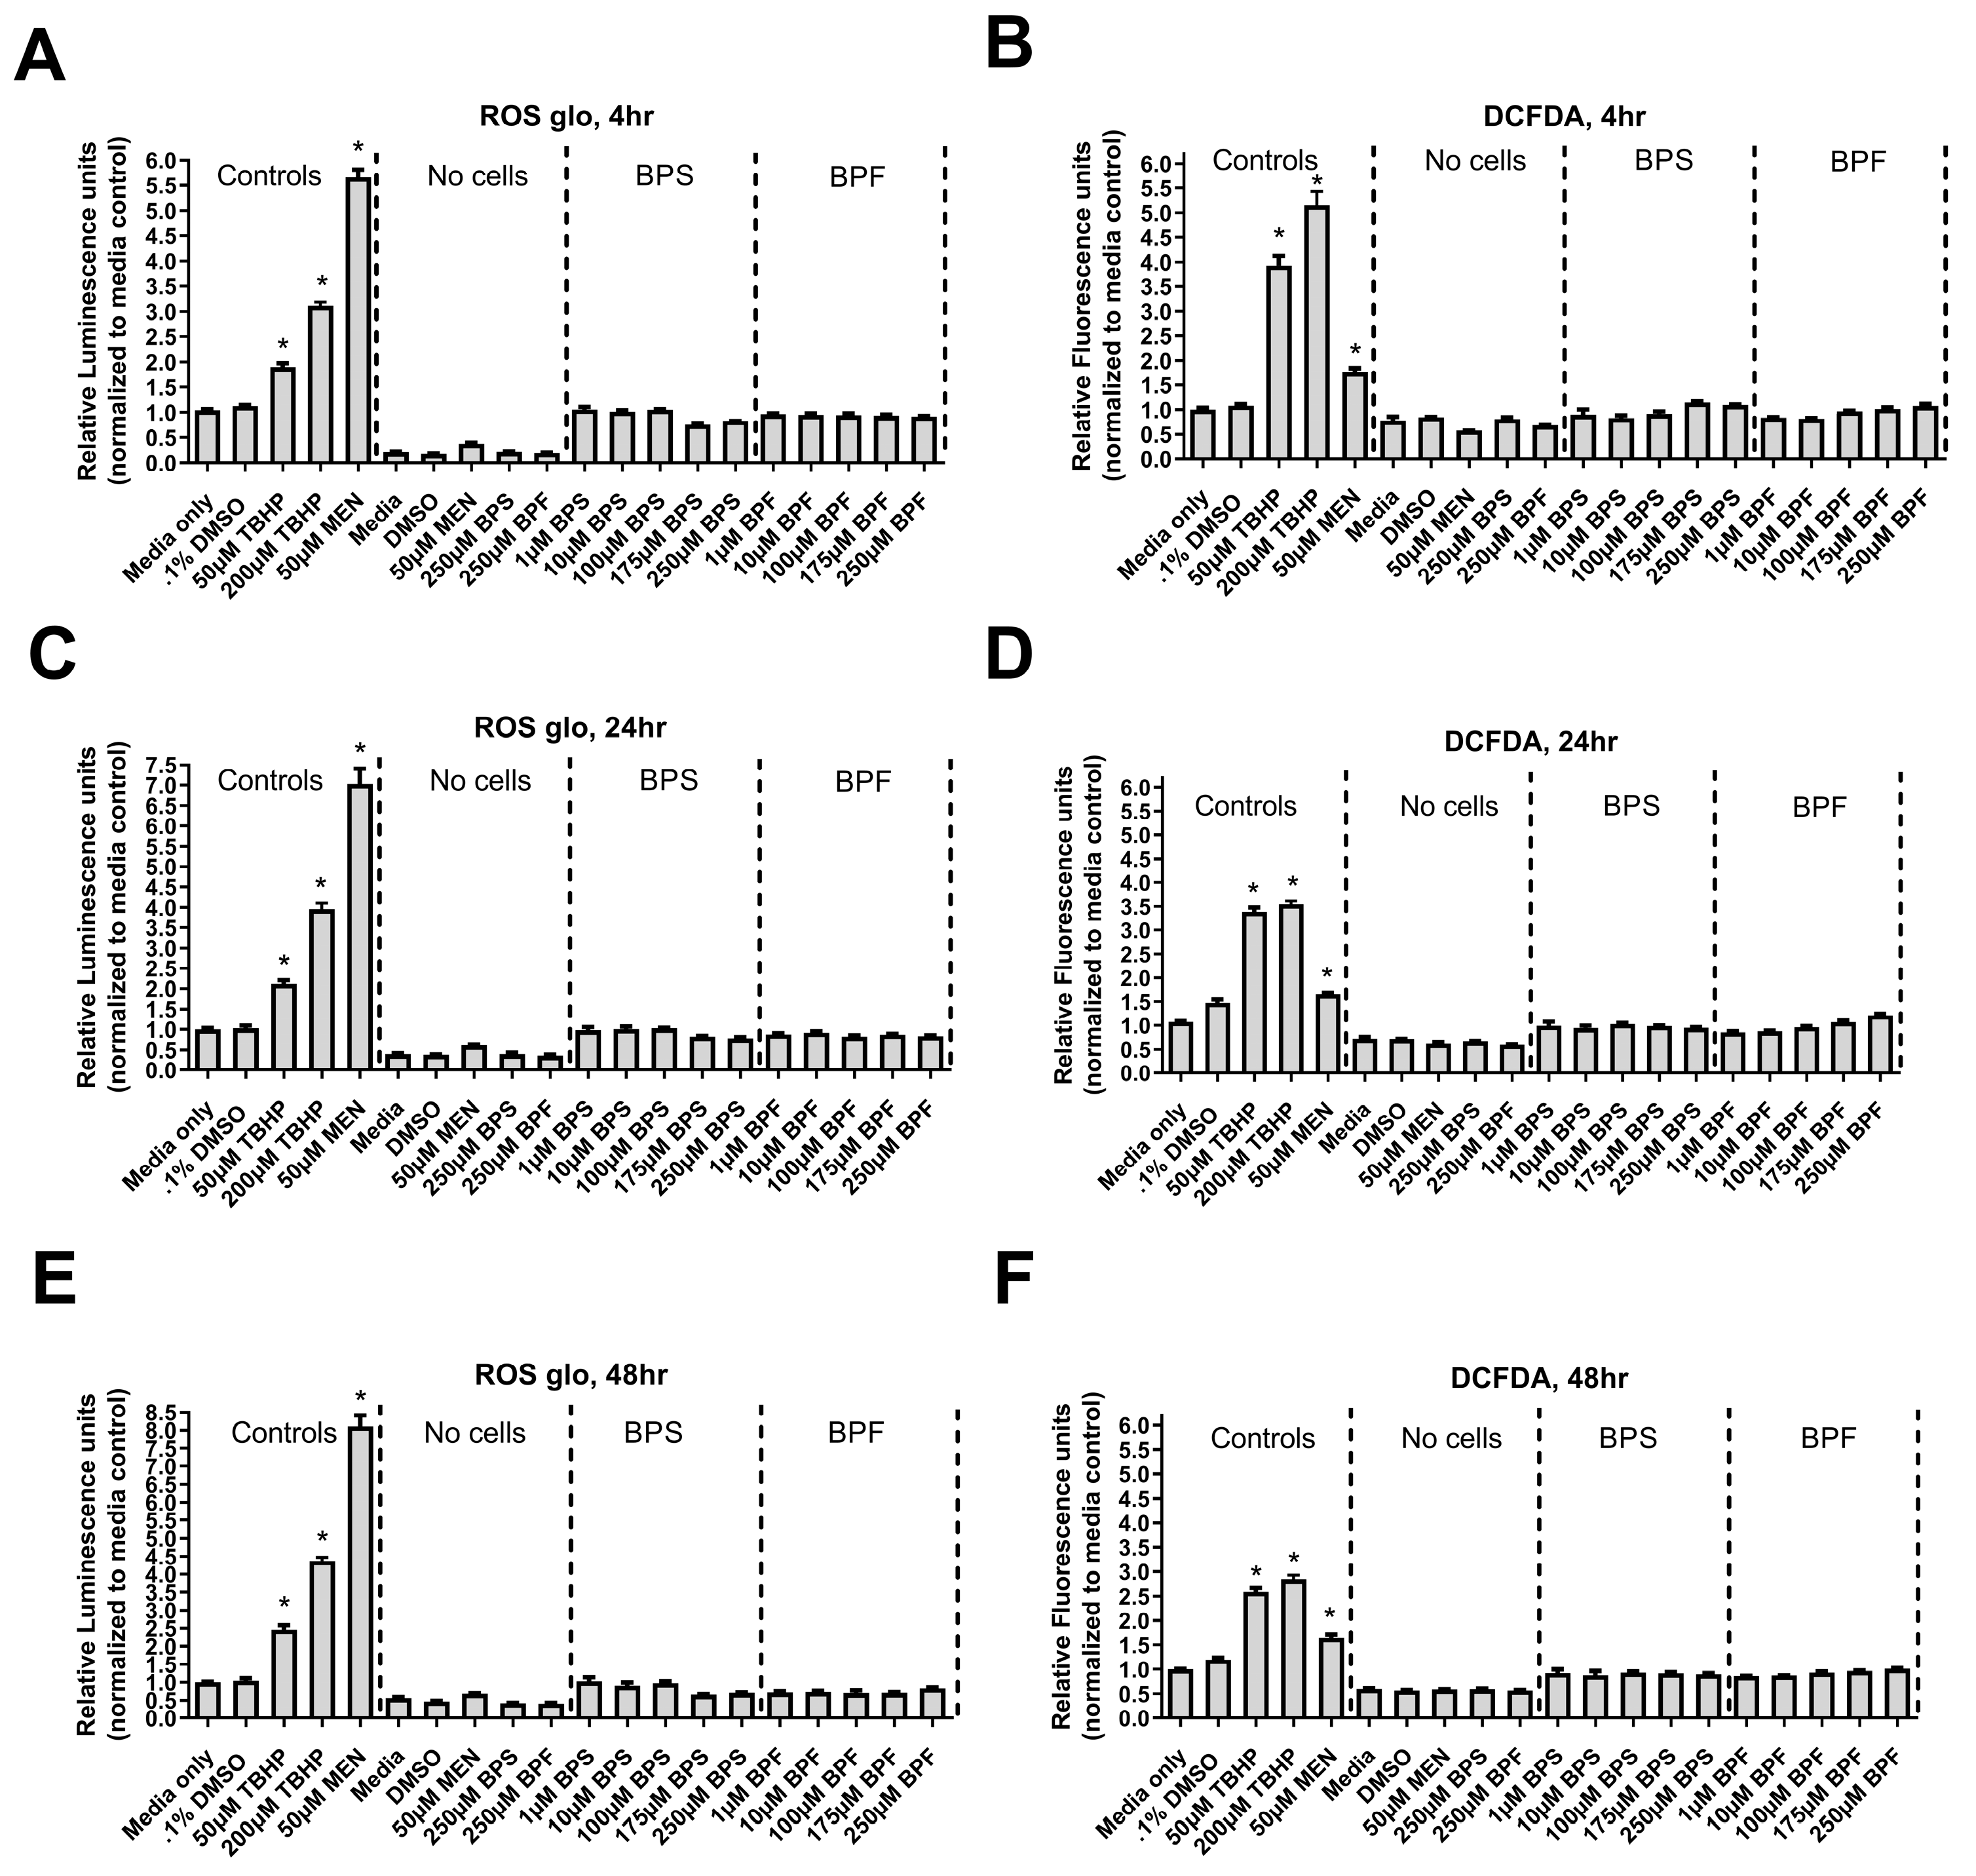
Figure 6.
(A) Clustering shown as a heatmap. (B) Differentially expressed genes in SH-SY5Y cells following exposure to either 0.1 nM BPF or BPS.
Figure 6.
(A) Clustering shown as a heatmap. (B) Differentially expressed genes in SH-SY5Y cells following exposure to either 0.1 nM BPF or BPS.
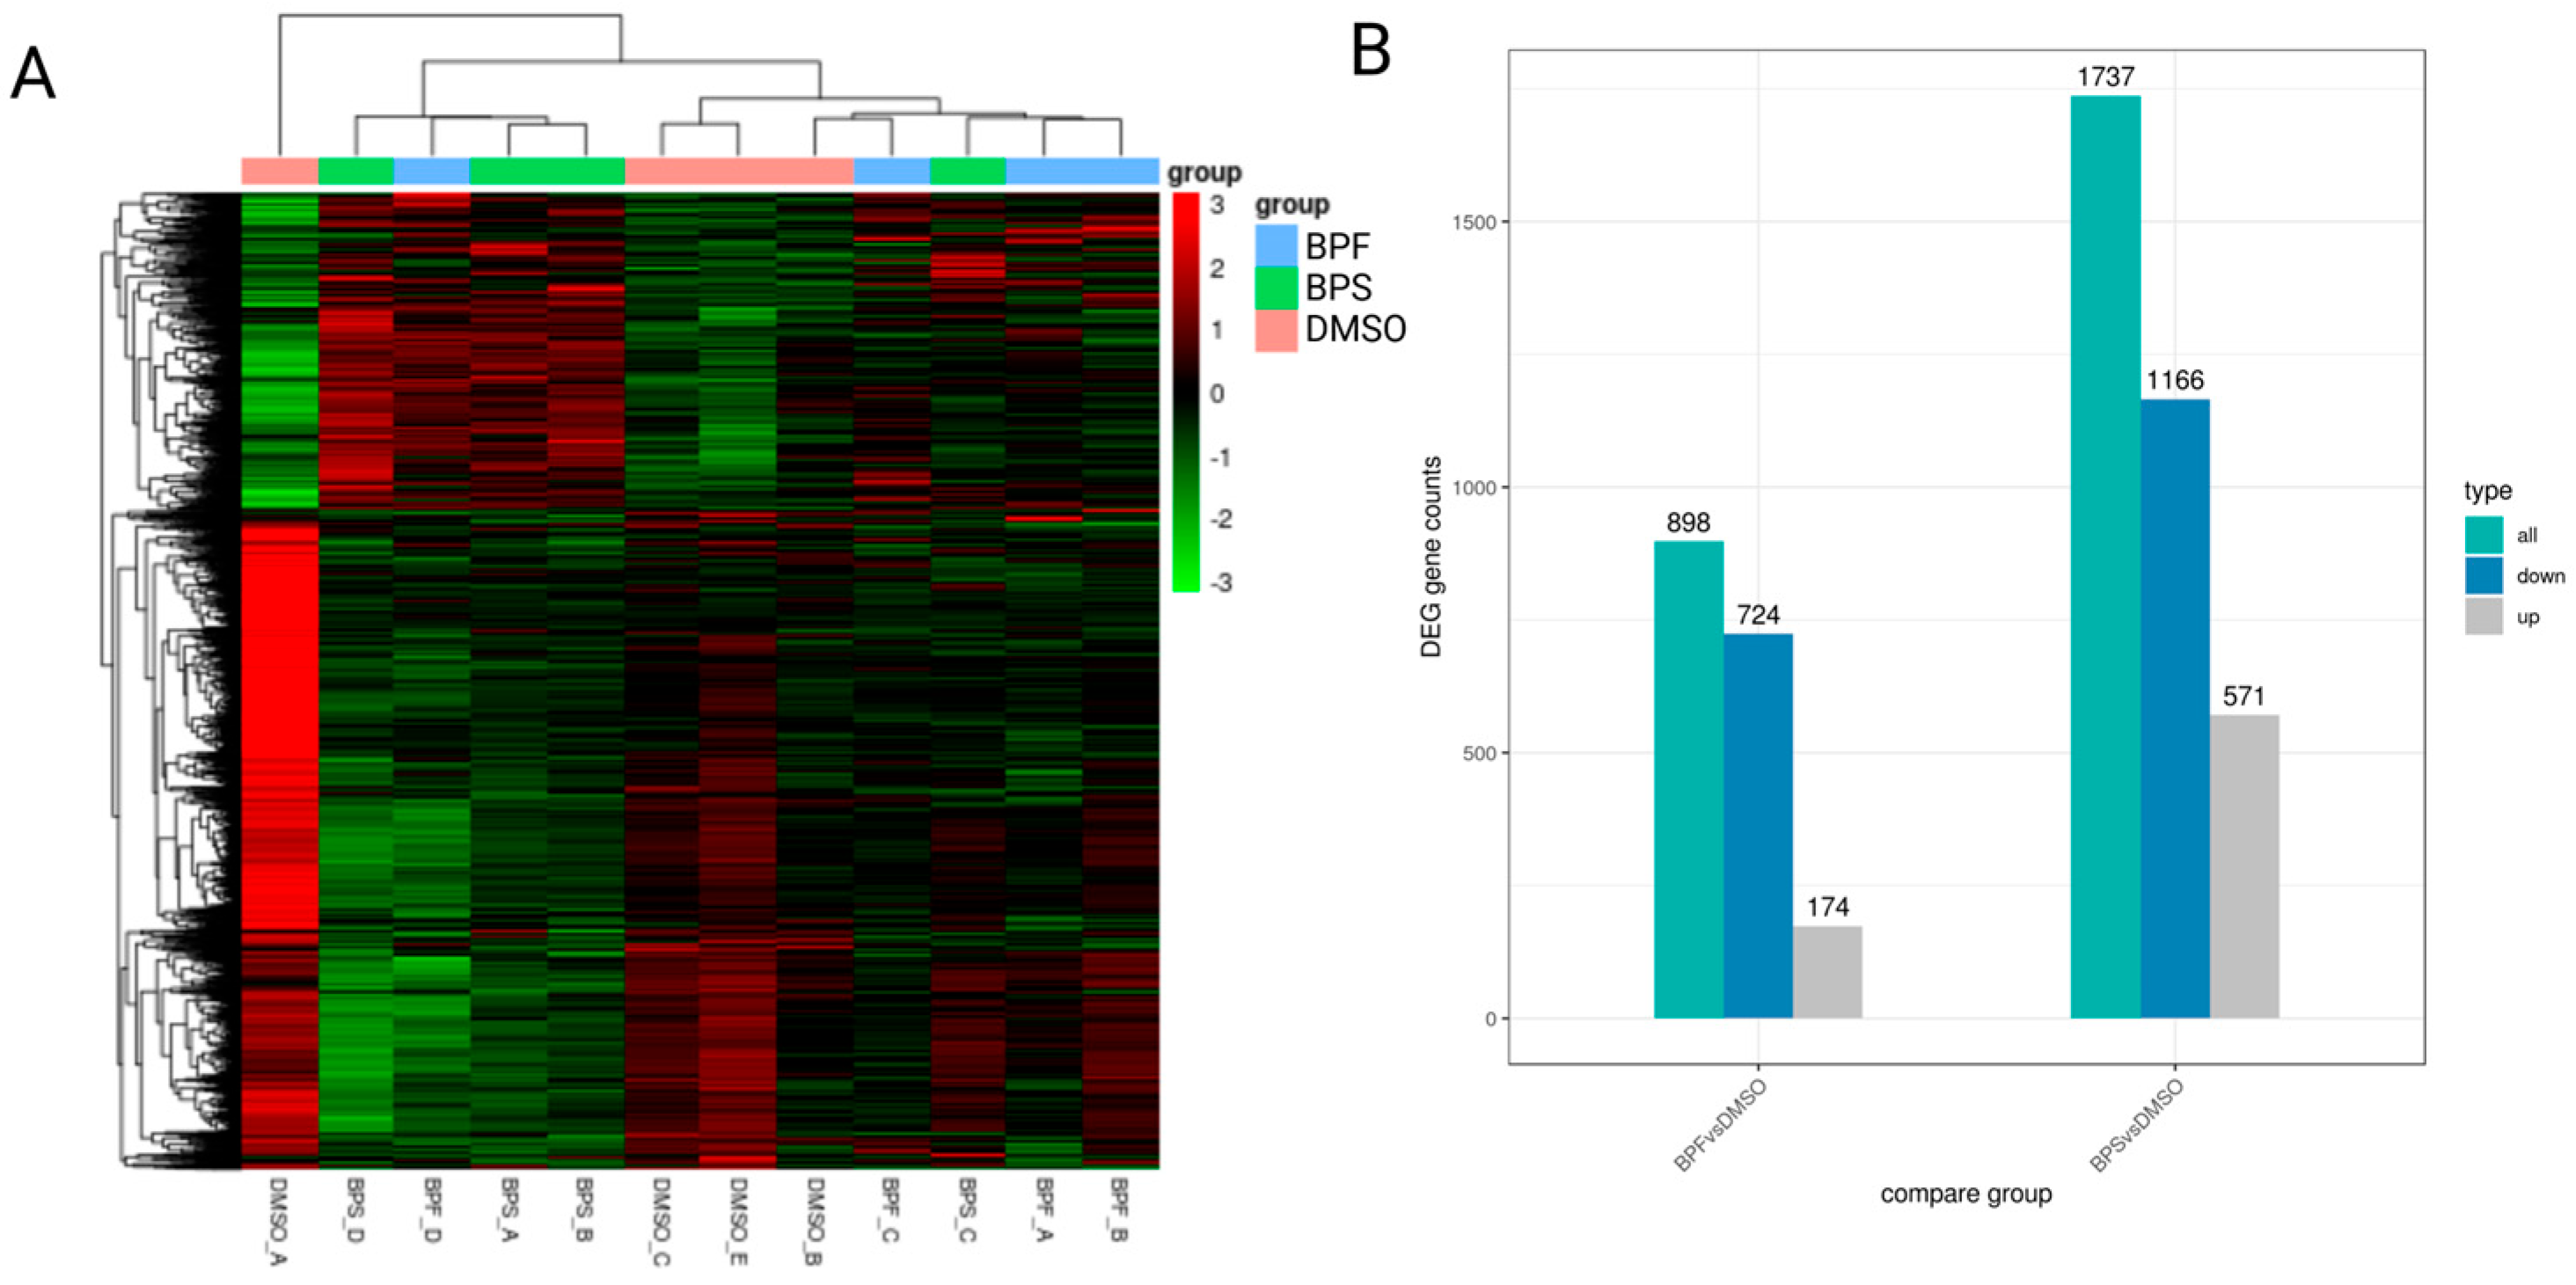
Figure 7.
Enrichment of KEGG pathways for (A) BPS and (B) BPF, depicted as bubble plots where p-values are represented by different colors and the numbers of genes are represented by the bubble size.
Figure 7.
Enrichment of KEGG pathways for (A) BPS and (B) BPF, depicted as bubble plots where p-values are represented by different colors and the numbers of genes are represented by the bubble size.
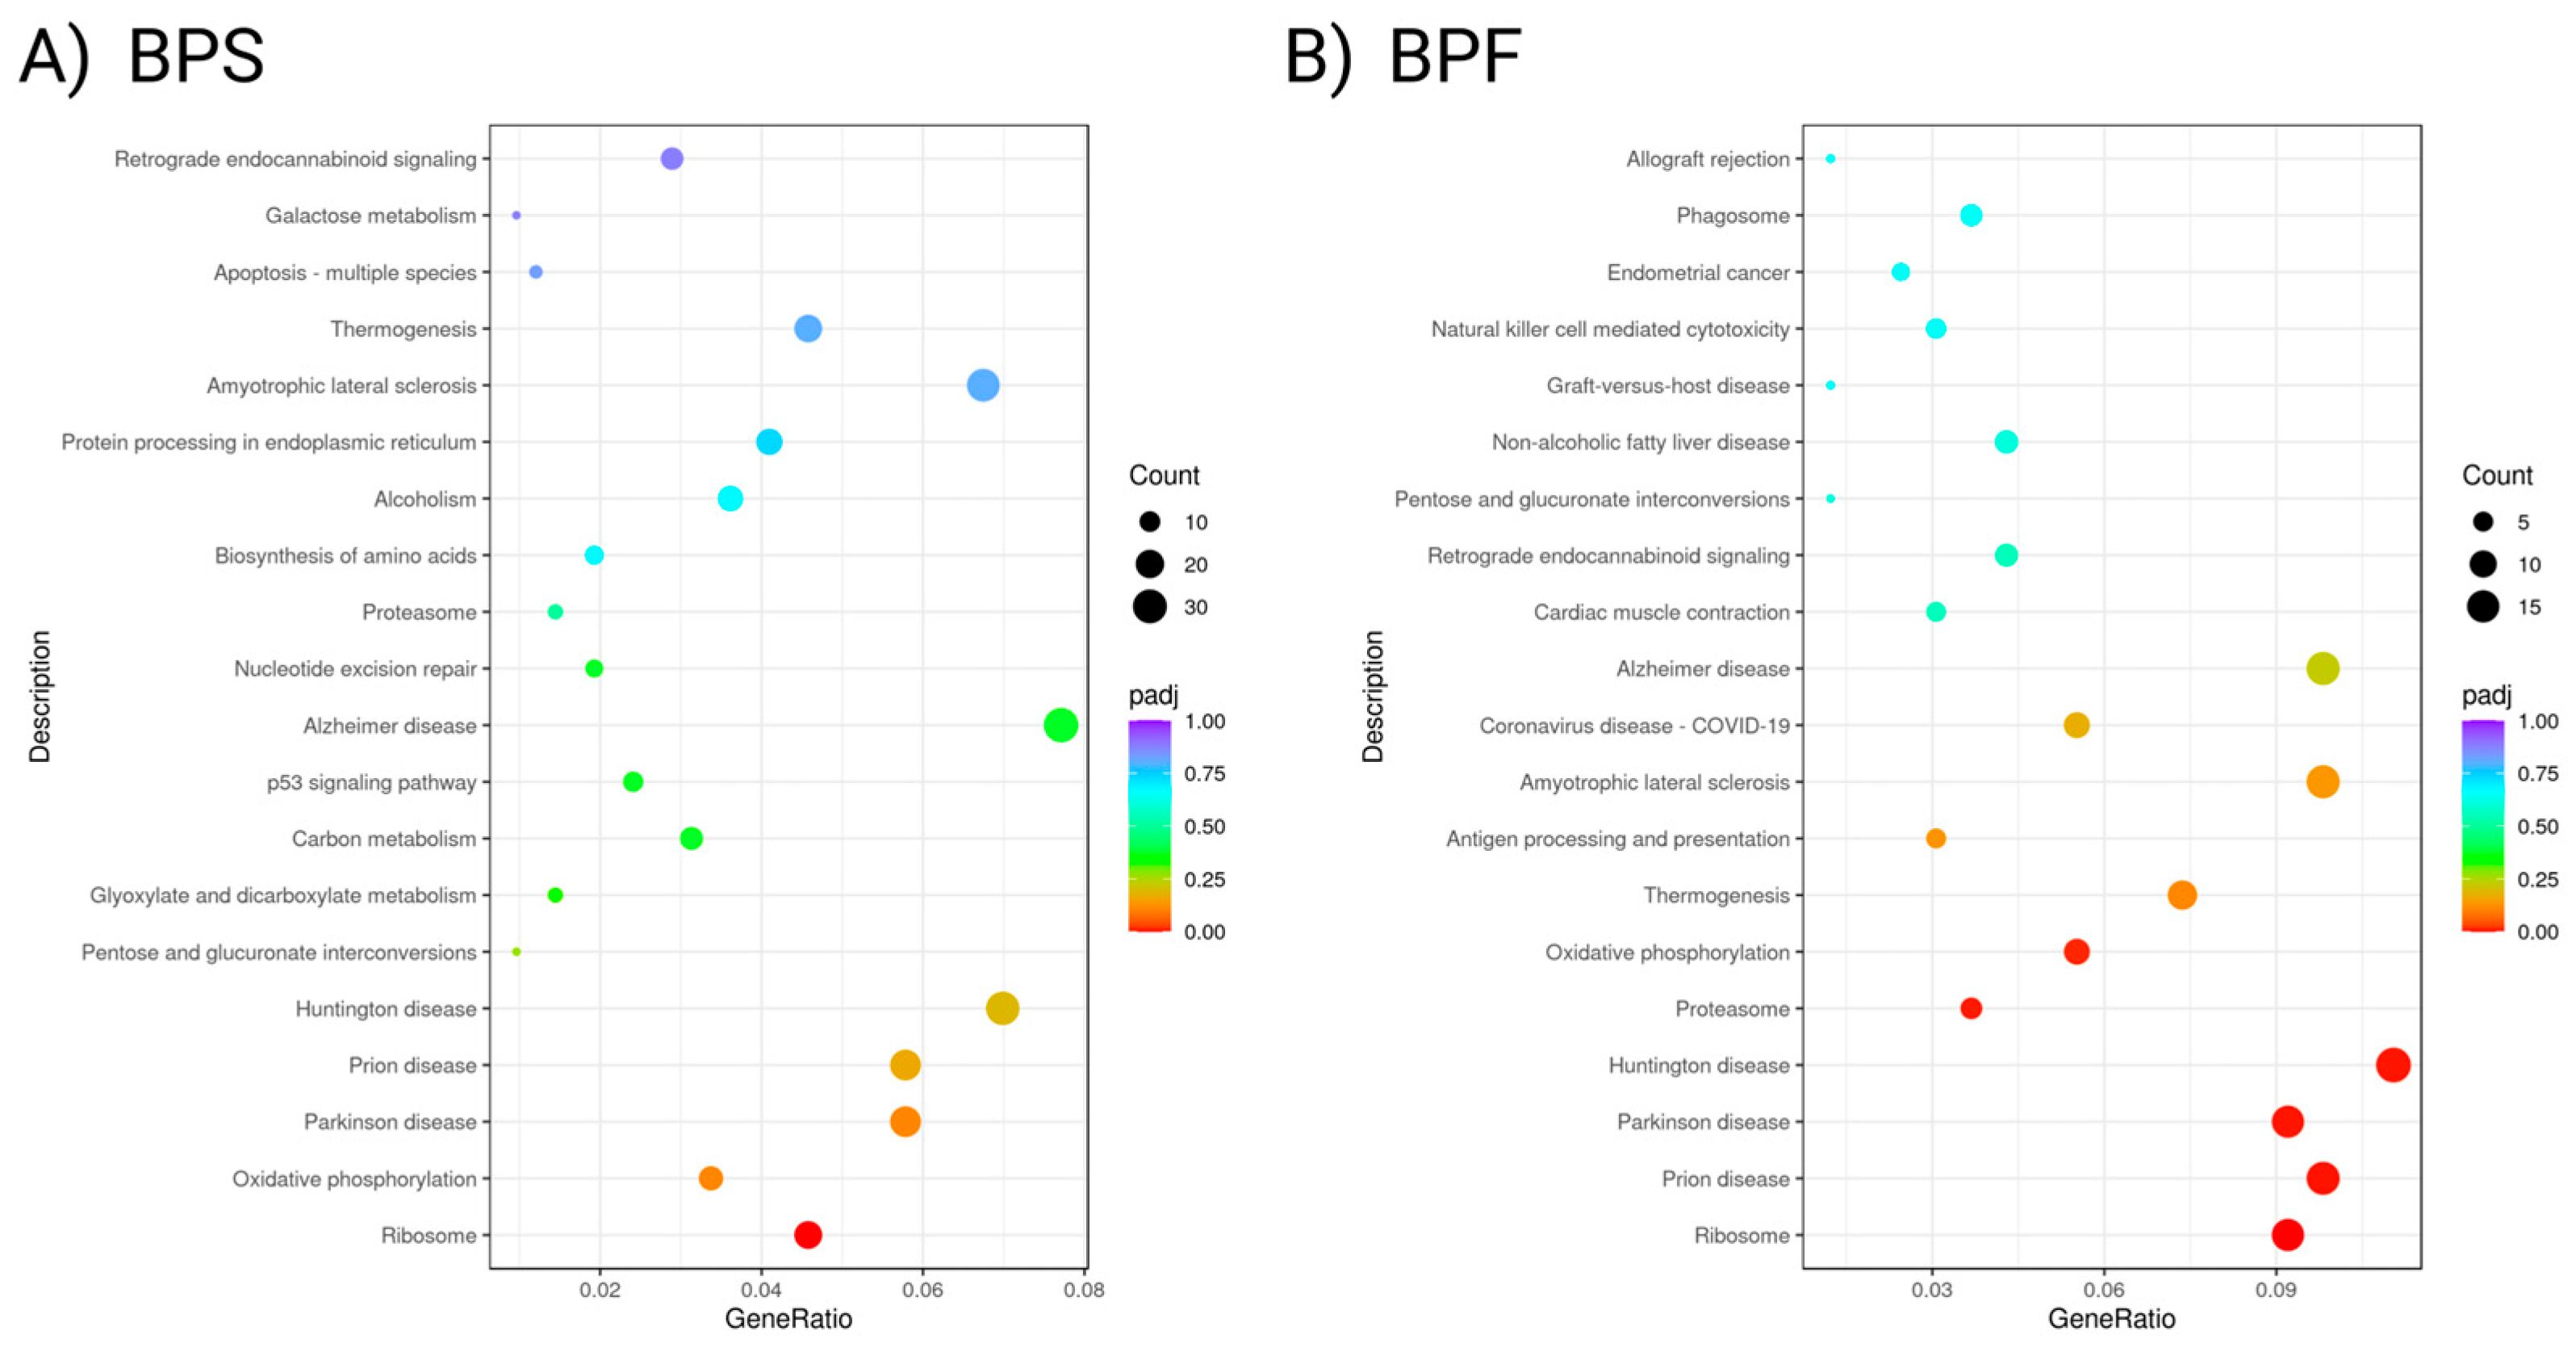
Figure 8.
Gene network associated with protein folding in SH-SY5Y cells exposed to BPF. Red indicates upregulation, and blue indicates down-regulation of the entity. Fold change, p-values, and abbreviations are given in Supplemental Data. The legend indicates type of interactions between entities.
Figure 8.
Gene network associated with protein folding in SH-SY5Y cells exposed to BPF. Red indicates upregulation, and blue indicates down-regulation of the entity. Fold change, p-values, and abbreviations are given in Supplemental Data. The legend indicates type of interactions between entities.
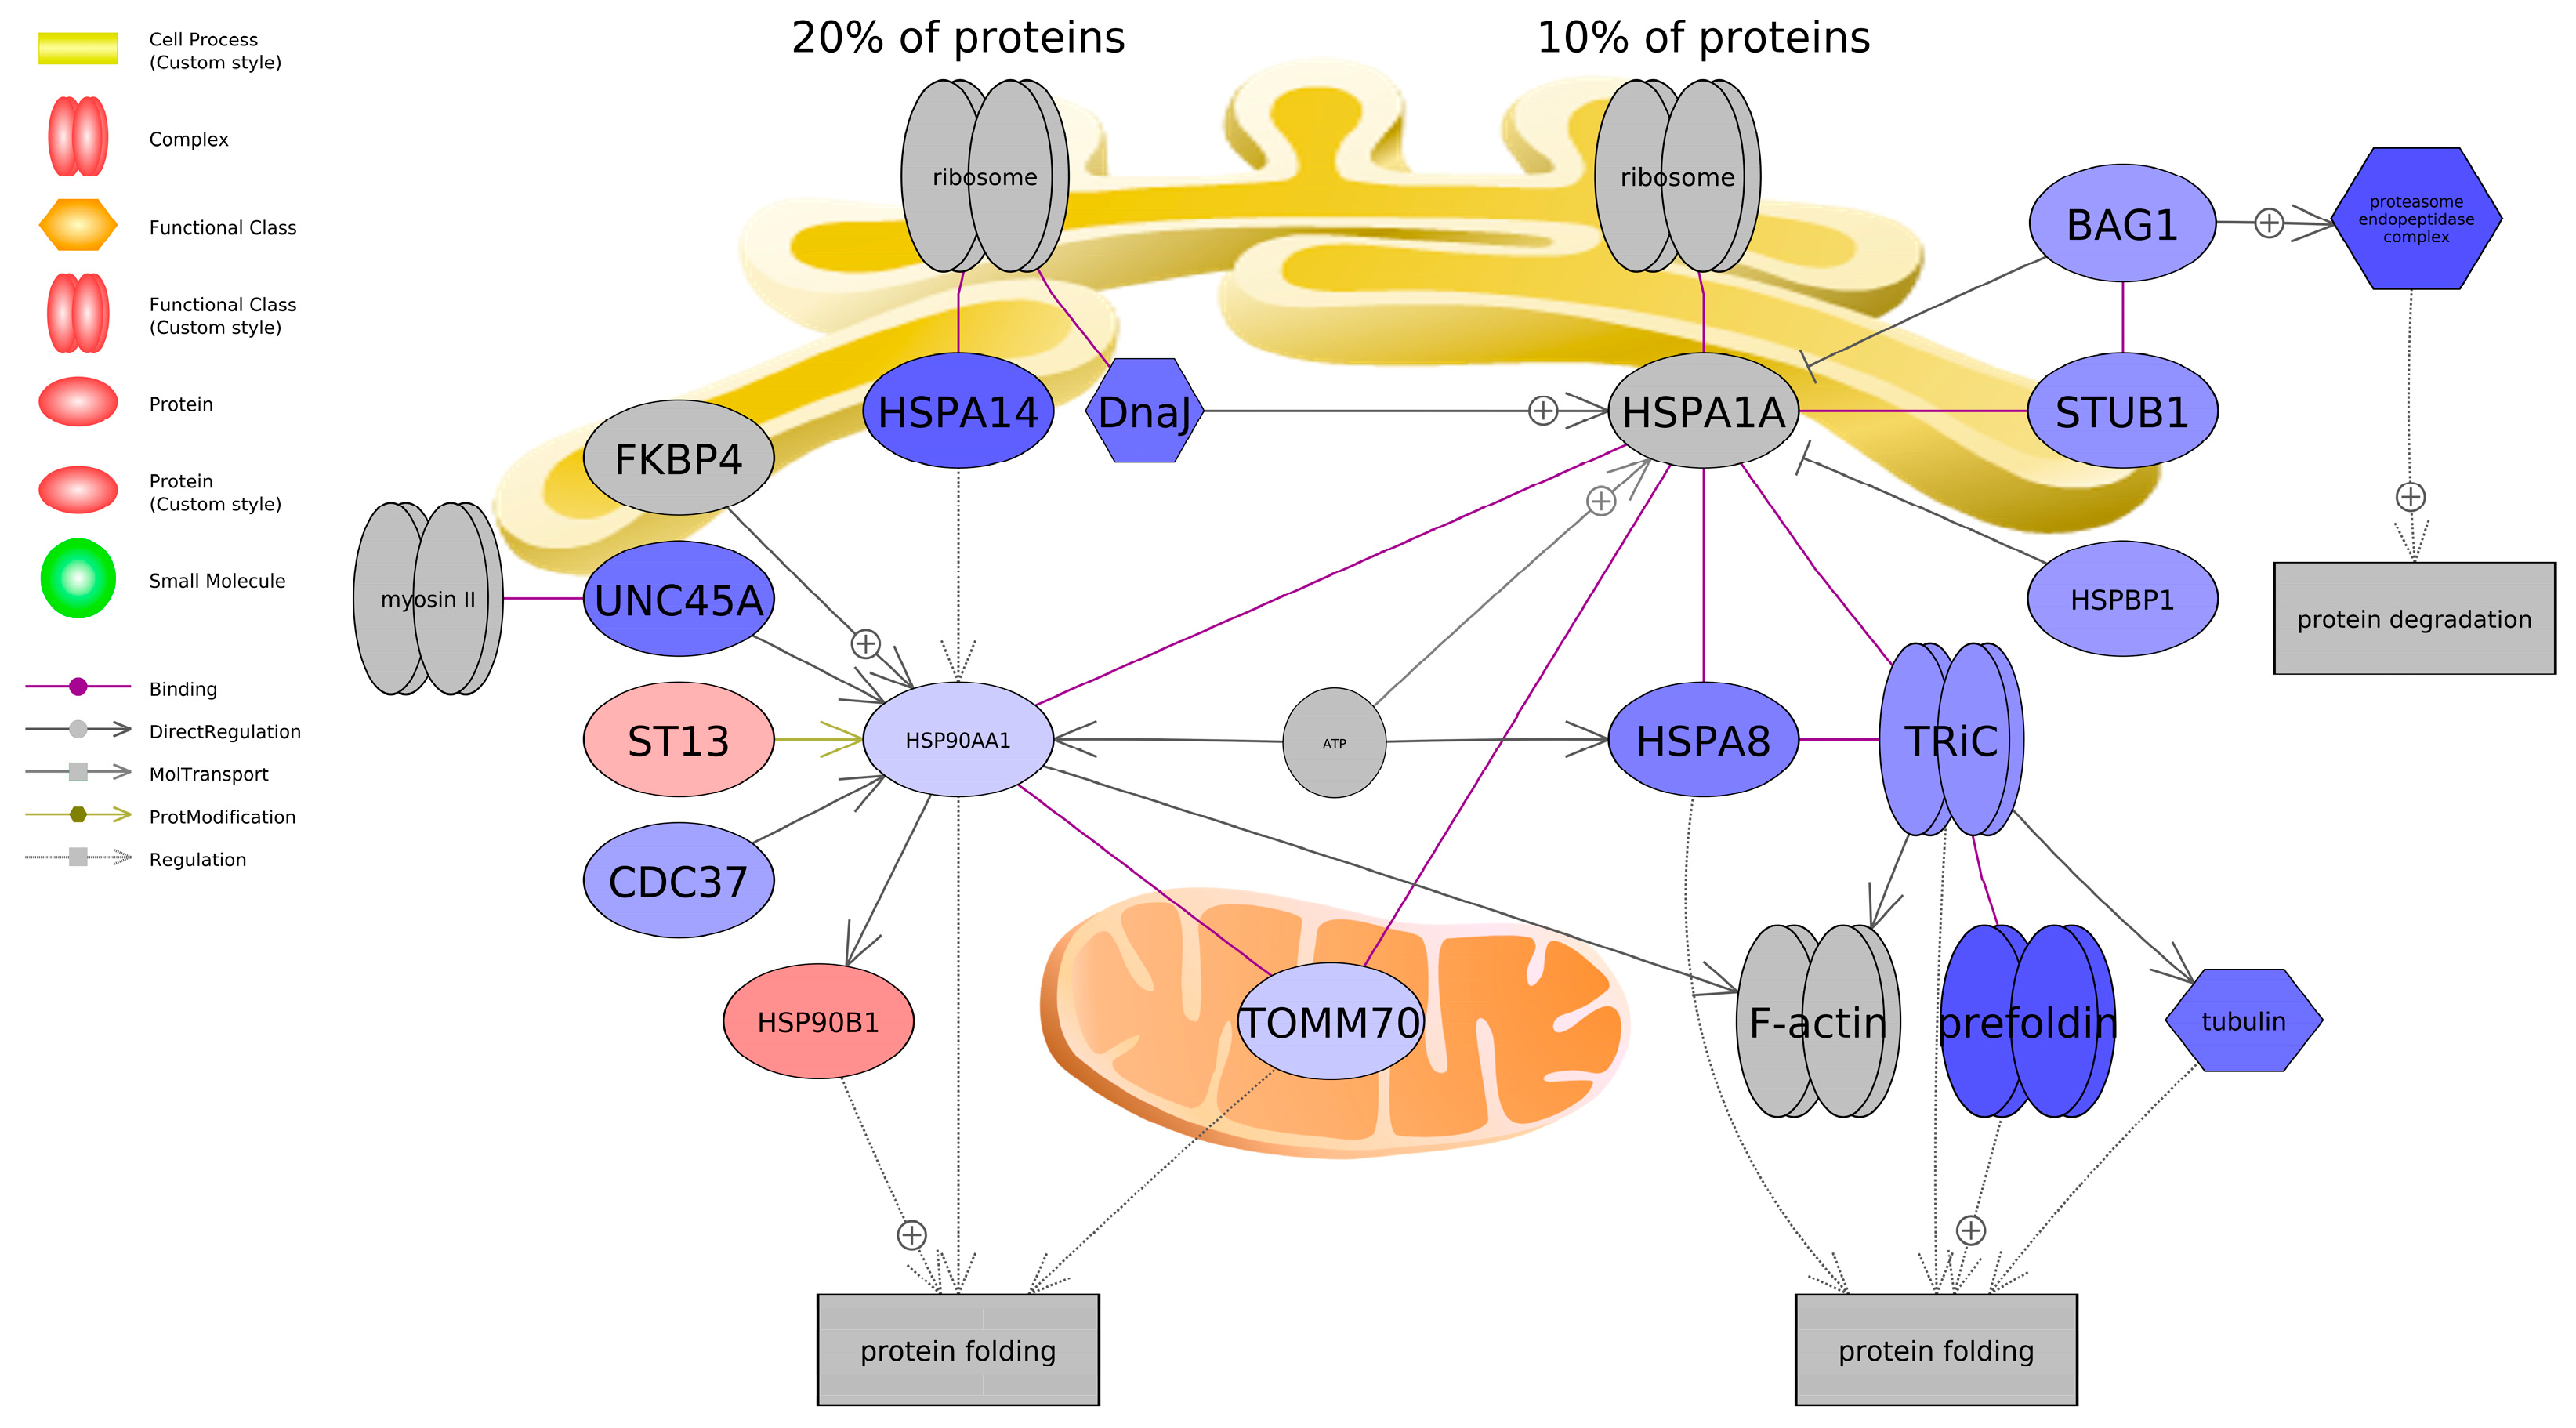
Figure 9.
Gene network associated with microglial and motor neuron dysregulation in SH-SY5Y cells exposed to BPF. Red indicates upregulation, and blue indicates down-regulation of the entity. Fold change, p-values, and abbreviations are given in Supplemental Data. The legend indicates type of interactions between entities.
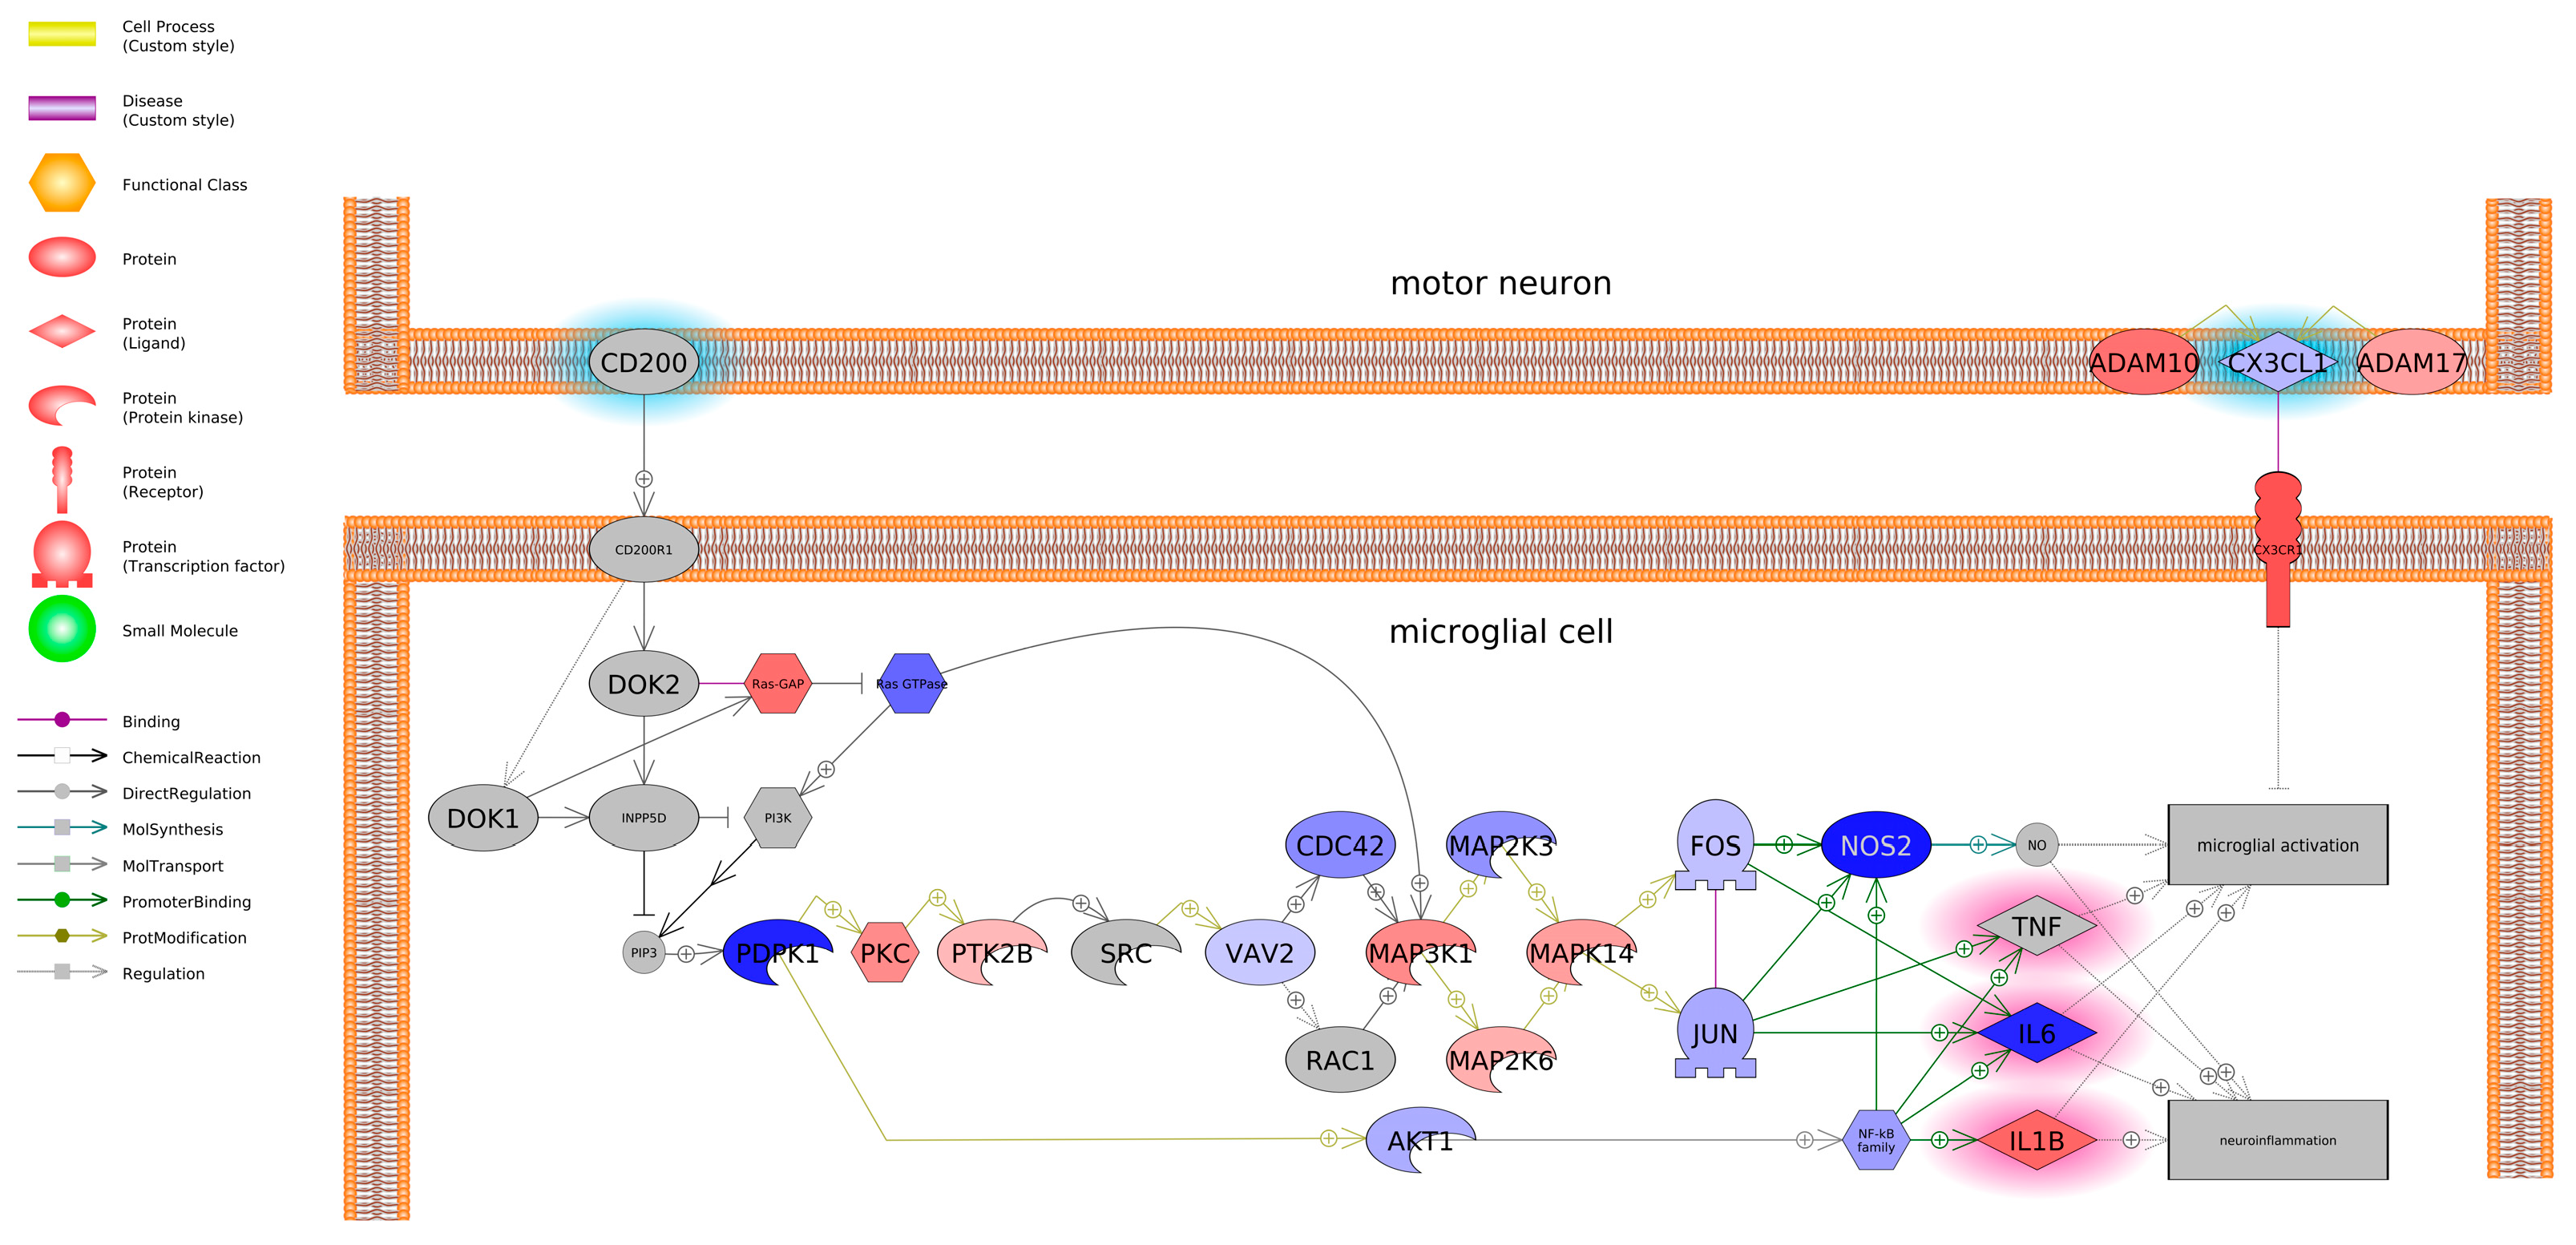
Figure 10.
The expression levels (log10 transformed) of (A) gtf2h4, (B) scg5, and (C) vars2 in SH-SY5Y cells exposed to either 0.1% DMSO, BPS, or BPF. Each circle is a biological replicate, and the horizontal line indicates the mean (± S.D.). Data analyzed using a One-way ANOVA with a Dunnett’s multiple comparisons test (n = 3 to 5 samples/treatment). Asterisks denotes significant differences at *p< 0.05, **p<0.01, ***p<0.001, ****p<0.0001).
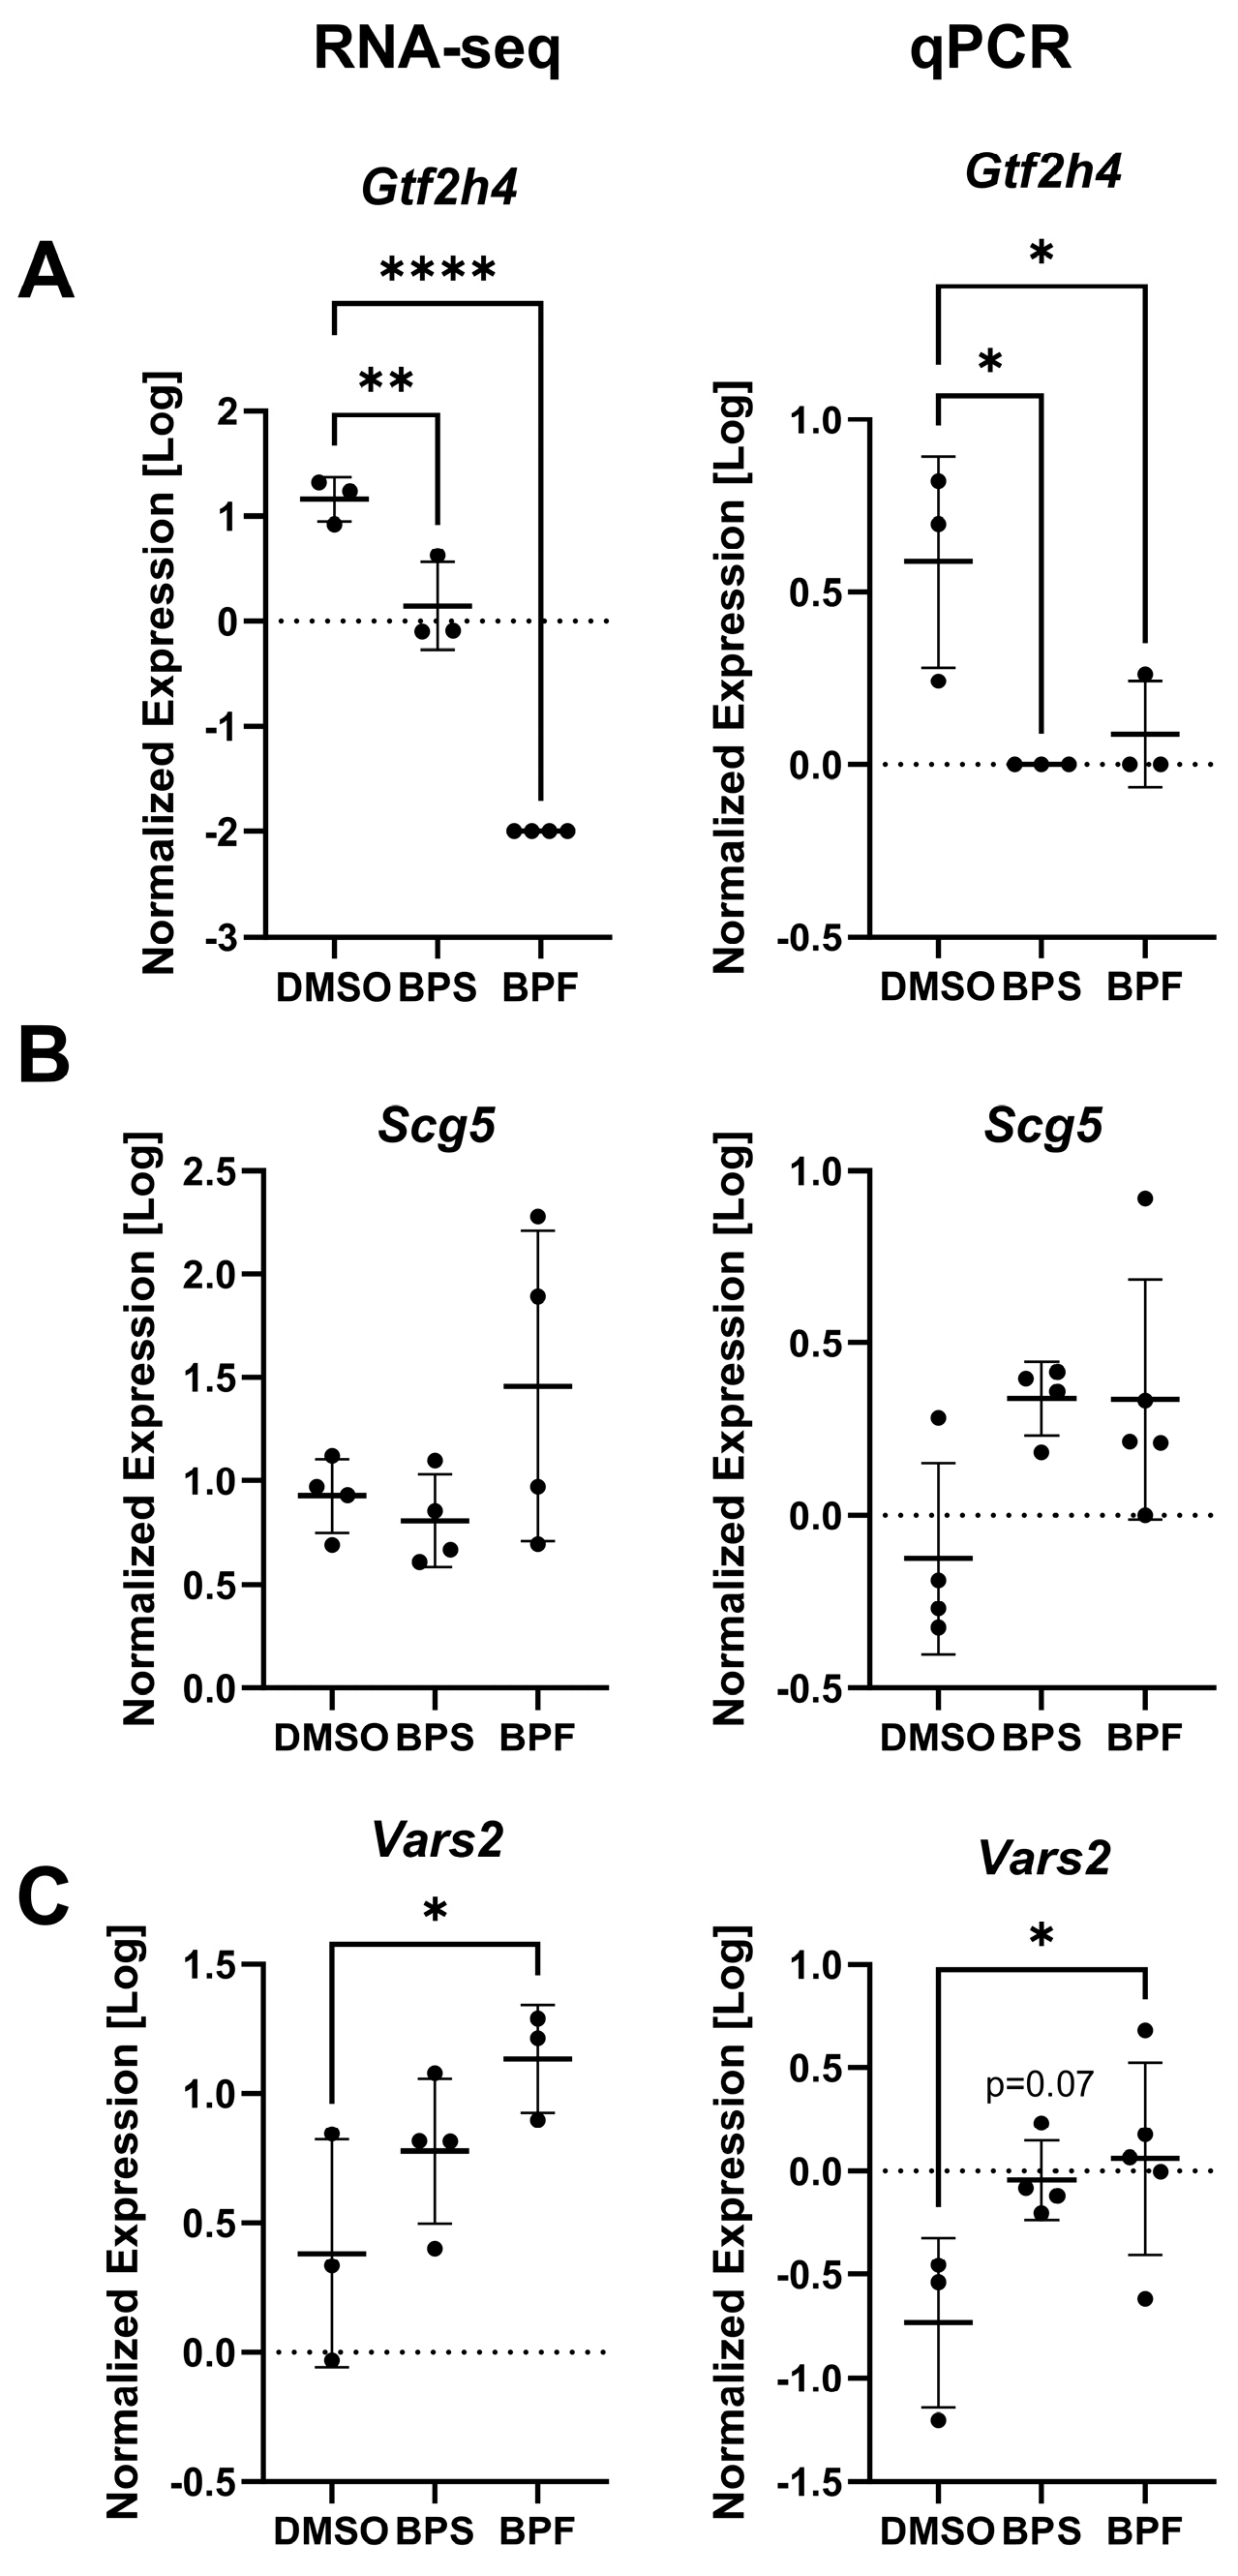

Table 1.
Top regulated DEGs in human SH-SY5Y cells following exposure to BPS (ranked by p-value). The table presents gene abbreviations, gene names, log2 fold change, p-adjusted, and p-values. Log2FC refers to fold change relative to control.
Table 1.
Top regulated DEGs in human SH-SY5Y cells following exposure to BPS (ranked by p-value). The table presents gene abbreviations, gene names, log2 fold change, p-adjusted, and p-values. Log2FC refers to fold change relative to control.
| Gene name | Full name | log2FC | padj | p-value |
| RPS2P55 | Ribosomal Protein S2 Pseudogene 55 | -1.455 | 0.001 | 4.4149×10-08 |
| MT-TT | Mitochondrially Encoded TRNA-Thr (ACN) | 1.587 | 0.006 | 6.6467×10-07 |
| HLA-C | Major Histocompatibility Complex, Class I, C | -2.063 | 0.006 | 1.4419×10-06 |
| AC016596.2 | Ribosomal protein L41 | -1.929 | 0.006 | 1.7420×10-06 |
| RPL35P5 | Ribosomal Protein L35 Pseudogene 5 | -2.069 | 0.006 | 1.7752×10-06 |
| AC010343.1 | Ribosomal protein S8 pseudogene | -1.794 | 0.006 | 2.1002×10-06 |
| RPS10P3 | Ribosomal Protein S10 Pseudogene 3 | -2.368 | 0.007 | 2.7400×10-06 |
| Unknown | Unknown | -2.907 | 0.007 | 3.1888×10-06 |
| DUSP8 | Dual Specificity Phosphatase 8 | -1.488 | 0.007 | 3.4916×10-06 |
| AC011005.1 | Unknown | -2.424 | 0.007 | 3.9371×10-06 |
Table 2.
Top pathways enriched in each transcriptome dataset following exposure to BPS or BPF. The table reports the name of the pathway, number of pathway entities, number of measured entities, median change, the normalized enrichment score, and the p-value. Data are presented in Supplemental Data.
| Chemical | Name |
# of Entities |
Expanded # of Entities | # of Measured Entities | Median Change | Normalized Score | p-value |
| BPS | Humoral Immunity in Vitiligo | 94 | 161 | 63 | -1.06 | 1.71 | 0.0017 |
| Natural Killer T-Cell Roles in Diabetes Mellitus Type 1 | 82 | 132 | 56 | 1.03 | 1.78 | 0.0018 | |
| T-Cell Maturation (Hypothesis) | 77 | 436 | 52 | 1.04 | 1.66 | 0.0018 | |
| IL2 Expression Targets | 97 | 138 | 61 | -1.05 | 1.77 | 0.0018 | |
| Atopic Dermatitis Onset | 72 | 348 | 51 | -1.06 | 1.69 | 0.0018 | |
| Treg-Cell Activation in Diabetes Mellitus | 72 | 121 | 57 | 1.03 | 1.67 | 0.0018 | |
| CD8 -> NF-kB Expression Targets | 44 | 63 | 30 | 1.05 | 1.73 | 0.0019 | |
| IL15R -> NF-kB/NFATC Signaling | 15 | 22 | 10 | -1.21 | 1.80 | 0.0019 | |
| RAS/RAF/MAPK Signaling Activation by Blocking of Tumor Suppressors | 47 | 427 | 27 | -1.06 | 1.79 | 0.0019 | |
| CD80 -> AP-1 Expression Targets | 28 | 32 | 14 | 1.07 | 1.80 | 0.0019 | |
| BPF | Dectin-2 (CLEC6A)/Mincle (CLEC4E)/BDCA2 (CLEC4C) Signaling | 23 | 33 | 11 | -1.02 | 1.86 | 0.0019 |
| IgE Receptors -> Targets in Lymphoid System and Blood | 25 | 70 | 6 | -1.38 | 1.73 | 0.0020 | |
| GPCRs Family -> Expression Targets in Bone | 15 | 17 | 6 | 1.33 | -1.64 | 0.0021 | |
| S/G2 Phase Transition | 49 | 247 | 132 | -1.13 | 1.51 | 0.0032 | |
| TNF -> NF-kB Expression Targets | 127 | 136 | 62 | -1.05 | 1.72 | 0.0033 | |
| TLR9 Expression Targets | 42 | 47 | 24 | 1.03 | 1.82 | 0.0035 | |
| CNR1-> Expression Targets in Nerve Tissue | 35 | 89 | 14 | 1.01 | 1.73 | 0.0036 | |
| Acute Phase in Atopic Dermatitis | 53 | 82 | 22 | 1.04 | 1.69 | 0.0038 | |
| Muscular Dystrophy, Facioscapulohumeral | 32 | 343 | 10 | 1.21 | 1.62 | 0.0039 | |
| Aminoglycosides and Cisplatin Induced Ototoxicity (Mouse Model) | 25 | 237 | 9 | -1.13 | 1.70 | 0.0040 |
Table 3.
Top overlapping pathways following exposure to BPS or BPF. The table reports the name of the pathway, number of measured entities, median change, and the p-value. Data are presented in Supplemental Data.
Table 3.
Top overlapping pathways following exposure to BPS or BPF. The table reports the name of the pathway, number of measured entities, median change, and the p-value. Data are presented in Supplemental Data.
| Overlapping Pathways |
# of Measured Entities BPF |
Median Change BPF | p-value PBF |
# of Measured Entities BPS |
Median Change BPS | p-value PBS |
| CD4+ T-Cell Function Decline in HIV | 56 | -1.006 | 0.005 | 57 | 1.006 | 0.004 |
| Natural Killer T-Cell Roles in Diabetes Mellitus Type 1 | 57 | -1.008 | 0.047 | 56 | 1.030 | 0.002 |
| Eosinophil Activation | 58 | -1.047 | 0.007 | 59 | -1.111 | 0.026 |
| IL2 Expression Targets | 61 | -1.058 | 0.014 | 61 | -1.047 | 0.002 |
| TNF -> NF-kB Expression Targets | 62 | -1.048 | 0.003 | 63 | -1.043 | 0.005 |
| CD8+ T-Cell Response in Celiac Disease | 65 | -1.076 | 0.016 | 64 | -1.096 | 0.004 |
| Natural Killer Cell Activation | 65 | -1.076 | 0.032 | 64 | -1.079 | 0.012 |
| Protein Folding | 69 | -1.224 | 0.021 | 71 | -1.264 | 0.035 |
| IGF1 -> ELK/SRF/HIF1A/MYC/SREBF Expression Targets | 74 | -1.107 | 0.037 | 74 | -1.101 | 0.036 |
| Insulin -> MEF/MYOD Expression Targets | 77 | -1.056 | 0.029 | 79 | -1.125 | 0.046 |
Disclaimer/Publisher’s Note: The statements, opinions and data contained in all publications are solely those of the individual author(s) and contributor(s) and not of MDPI and/or the editor(s). MDPI and/or the editor(s) disclaim responsibility for any injury to people or property resulting from any ideas, methods, instructions or products referred to in the content. |
© 2025 by the authors. Licensee MDPI, Basel, Switzerland. This article is an open access article distributed under the terms and conditions of the Creative Commons Attribution (CC BY) license (http://creativecommons.org/licenses/by/4.0/).
Copyright: This open access article is published under a Creative Commons CC BY 4.0 license, which permit the free download, distribution, and reuse, provided that the author and preprint are cited in any reuse.


