
Submitted:
22 July 2025
Posted:
23 July 2025
You are already at the latest version
Abstract
This study explores how mRNA and microRNA (miRNA) expression profiles distinguish subtypes of autism spectrum disorder (ASD) defined by mitochondrial function. Using lymphoblastoid cell lines (LCLs) from boys with ASD are classified into two groups: those with abnormal (AD-A) and normal (AD-N) mitochondrial function. Prior work established that about a third of ASD-derived LCLs show excessive mitochondrial respiration and stress vulnerability—features divergent from both controls and classical mitochondrial disease. Through RNA-seq, we identified 24 differentially expressed genes (DEGs)(14 downregulated, 10 upregulated in AD-N vs. AD-A), implicating processes such as mRNA processing, immune response, cancer biology, and crucially, mitochondrial and nuclear activities. Notably, genes such as DEPTOR (an mTOR modulator) were upregulated in AD-A, highlighting dysregulation in the mTOR pathway—a central regulator of cellular metabolism, protein synthesis, autophagy, and mitochondrial function. miRNA analysis revealed 18 differentially expressed miRNAs (DEMs) upregulated and one downregulated in AD-N compared to AD-A. Several miRNAs (including hsa-miR-1273h-3p, hsa-miR-197-3p, and hsa-miR-199a-5p) targeted both the differentially expressed genes and pathways previously linked to ASD, such as mTOR, Cam Kinase II, and mitochondrial regulation. Enrichment analyses indicated involvement in transcription, ATP binding, and oxidative stress-response pathways, with the ECM receptor interaction pathway notably prominent. These molecular signatures support the idea that mitochondrial dysfunction in ASD is tied to specific disruptions in the mTOR and PI3K/AKT signaling axes, influencing autophagy, oxidative stress handling, and neuronal metabolism. The findings highlight a miRNA-mRNA network that may underpin mitochondrial dysfunction and ASD heterogeneity, suggesting avenues for subtype-specific biomarkers and targeted therapies that address energy metabolism and cellular stress in ASD.
Keywords:
autism spectrum disorder
; CamKinase II
; MicroRNA
; mitochondria
; mTOR
1. Introduction
Autism Spectrum Disorder (ASD) is a complex neurodevelopmental condition defined by abnormalities in social communication along with restricted and repetitive behaviors and interests [1]. ASD affects one in 31 children in the United States (US) and has a four times higher prevalence in males than in females [2]. ASD is defined by behavioral features, but ASD demonstrate brain-based and/or systematic physiological abnormalities, highlighting the biological underpinnings [3]. These biological abnormalities have been leveraged to develop objective biomarkers, although no diagnostic biomarker is mature enough to utilize in clinic practice [4].
Many individuals with ASD manifest systemic metabolic and mitochondrial disorders, immune system abnormalities and oxidative stress [5]. Metabolic disorders are particularly important since many of these disorders can be mitigated with safe, well tolerated treatments [6,7]. Understanding these underlying disorders can assist in the development of objective biomarkers to assist with diagnosis, identify subgroups and screen for the best candidates for the most effective treatment [5].
Disorders of mitochondrial function may affect a substantial number of individuals with ASD [8]. However, the interpretation of these mitochondrial disorders is complicated as most are non-classical in nature. Indeed, a meta-analysis found that the overall prevalence of classical mitochondrial disease in ASD is 5% but about 30% or more of those with ASD manifest biomarkers of abnormal mitochondrial function [9]. Perhaps more striking, some studies find that 80% of immune cells from children with ASD have electron transport chain (ETC) complex deficits [10,11]. Furthermore, ASD has been linked to increased ETC complex activity [12,13,14,15] and mitochondrial respiration [16,17,18,19,20,21,22,23], whereas classic mitochondrial disease is usually defined by a significant reduction in ETC activity and respiration. Thus, individuals with ASD appear to have unique abnormalities in mitochondrial metabolism which has recently been linked to
Using the Seahorse 96 XF high-throughput respiratory analyzer our group has studied mitochondrial respiration in control and ASD lymphoblastic cell lines (LCLs). It was found that the LCLs from about one-third of children with ASD manifested elevated respiratory rates (about 200% of controls) and were more vulnerable to physiological stress. An important respiratory parameter, reserve capacity (RC), a measure of mitochondrial health, quickly plummeted in these cells when challenged with physiological stress as compared to other cell lines [20]. These physiologically vulnerable cell lines are called AD-A (ASD with abnormal mitochondrial function). Mitochondria from the remaining ASD LCLs were essential equivalent to controls and then are called AD-N (ASD with normal mitochondrial function). We have replicated these results in LCLs in seven additional studies [17,18,20,21,22,23,24] and have demonstrated that this pattern of respiratory abnormalities is also manifested in fresh in peripheral blood mononuclear cells (PBMCs) from individuals with ASD, especially children with neurodevelopmental regression [25,26].
The modulator mechanisms in the AD-A LCLs have been investigated. In one study we found the AD-A LCLs failed to upregulate PINK1, MFN2, SIRT1, SIRT3 DNM1L, HIF1z and PGC1a as compared to the AD-N LCLs. We also found that this increase in mitochondria respiration could be mitigated by rapamycin, implicating the mTOR pathway. To obtain further insight into the molecular mechanisms which drive the mitochondrial phenotype in the AD-A LCLs we use RNAseq mRNA and miRNA profiling in the LCLs and examine whether the differentially expressed (DE) genes are related to the mTOR or cellular and mitochondrial stress pathways previously identified.
2. Materials and Methods
2.1. Materials
RPMI 1640 culture media, penicillin/streptomycin, fetal bovine serum (FBS), phos-phate buffered saline (PBS), BCA Protein Assay Kit were all obtained from Thermo Fisher Scientific (Waltham, MA, USA). XF DMEM and XF-PS 96-well plates were obtained from Agilent Technologies (Santa Clara, CA, USA). The RNeasy mini kit was obtained from Qiagen (Hilden, Germany) and the High Capacity cDNA Reverse Transcription Kit and Power SYBR Green PCR Master Mix from Applied Biosystems (Waltham MA, USA). Poly-D-Lysine, 2,3-dimethoxy-1,4-napthoquinone (DMNQ), meta-phosphoric acid and all other chemicals were obtained from Sigma-Aldrich (St. Louis, MO, USA).
2.2. Cell Lines and Culture
LCLs were obtained from the Autism Genetic Resource Exchange (AGRE; Los Angeles, CA, USA). Details of the LCLs are presented in Table 1. Age was not significantly difference across groups as measured by paired t-test. LCLs were maintained in RPMI 1640 culture medium with 15% FBS and 1% penicillin/streptomycin in a humidified incubator at 37 °C with 5% CO2. All ASD LCLs were linked to the results of the gold-standard Autism Diagnostic Observation Schedule (ADOS) assessments of the children from which the LCLs were derived. These LCLs were used in a previous study examining bioenergetics [18].
2.3. Library Construction and Sequencing
Total RNA was extracted using Trizol reagent (Invitrogen, CA, USA), and sent to LC Sciences (Houston, Texas, USA) on dry ice. RNA integrity and quality were determined by Bioanalyzer 2100 (Agilent, CA, USA) with RIN number >7.0. Approximately, 1 ug of total RNA were used to prepare small RNA library according to protocol of TruSeq Small RNA Sample Prep Kits (Illumina, San Diego, USA). Single-end sequencing of 50bp was per-formed on an Illumina Hiseq 4000 at LC Sciences following the vendor’s recommended protocol [27]. Approximately 10 ug of total RNA was subjected to isolated Poly (A) mRNA with poly-T oligo attached magnetic beads (ThermoFisher, Carlsbad, CA, USA). Following purification, the poly(A)- or poly(A)+ RNA fractions were fragmented into small pieces using divalent cations under an elevated temperature. The cleaved RNA fragments were reverse transcribed to create the final cDNA library in accordance with the protocol for the mRNA-seq sample preparation kit (Illumina, San Diego, CA, USA) and the average insert size for the paired-end libraries was 300 bp (50 bp). Finally, paired-end sequencing was performed on an Illumina Hiseq 4000 following the vendor’s recommended protocol.
2.4. Bioinformatics Analysis
For miRNA Raw reads were processed with ACGT101-miR (LC Sciences, Houston, Texas, USA) to remove adapter dimers, junk, low complexity reads, common RNA families (rRNA, tRNA, snRNA, and snoRNA) and repeats. Unique sequences with lengths of 18–26 nucleotides were mapped to specific-species precursors obtained from the miRBase 21.0 by a BLAST search performed to identify known miRNAs and novel 3p- and 5p-derived miRNAs. The remaining sequences were aligned against the miRbase (Release 21) (https:// www.miRbase.org/) miRNA database, and perfectly matched sequences were considered to be conserved Homo sapiens miRNAs [27].
For mRNA, Raw data (raw reads) of fastq format were firstl processed through in-house perl scripts. In this step, clean data (clean reads) were obtained by removing reads containing adapter, reads containing ploy-N, and low quality reads from the raw data. At the same time, Q20, Q30 and GC content the clean data were calculated. All the downstream analyses were based on clean data with high quality. To quantify gene expression levels, featureCounts v1.5.0-p3 was used to count the number of reads mapped to each gene. The expected number of Fragments Per Kilobase of transcript sequence per Million base pairs sequenced (FPKM) of each gene was calculated based on the length of the gene and reads count. Differential expression analysis of two conditions/groups (two biological replicates per condition) was performed using the DESeq2 R package (1.20.0). DESeq2 provide statistical routines for determining differential expression in digital gene expression data using a model based on the negative binomial distribution. The P value of mRNA differential analysis was corrected for the false discovery rate (FDR), and genes with a FDR < 0.05 were regarded as DEGs. The resulting P-values were adjusted using the Benjamini and Hochberg’s approach for controlling the false discovery rate. A threshold of p<= 0.05 was used in all analysis.
2.5. Target Prediction and Enrichment Analysis
To determine if specific genes were targeted by miRNAs, miRWalk2.0 was used with a threshold of 1.0 [28]. In contrast, the miRWalk2.0 platform performs a robust meta-analytic integration of predicted miRNA–mRNA interactions by aggregating data from 13 independent target prediction algorithms. This multi-source consensus framework enhances the stringency of target identification and minimizes false-positive rates by leveraging algorithmic complementarity and cross-validation across diverse computational methodologies [29,30]. Finally, the DEGs and DEMs (p < 0.05) were further selected to test for functional enrichment analysis using IPA software.
2.6. Relationship to Genes Previous Identifed Differentiating AD-A and AD-N
Several studies have identifed gene expression differences in LCLs between the AD_A and AD-N groups, These include UCP2, mTOR, AMPK, PINK1, PTEN, MFN2, PTEN, AKT1, SOD2, SIRT1, SIRT3, DNM1L, HIF1A, PPARGC1A. In our previous studies comparing AD-N and AD-A we found that the mTOR pathway way higly invoved in modulation of respiration in the AD-A groups. Thus, we exmained the relation of miRNAs to core mTOR genes, including MTOR, RPTOR, RICTOR, mST8, DEPTOR, PRAS40, mSIN1 as well as upstream regulators AMPK (PRKAA1 , PRKAA2, PRKAB1, PRKAB2, PRKAG1, PRKAG2, PRKAG3), LKB1, AKT (AKT1, SKT2, AKT3), PTEN, RHEB, TSC1, TSC2, PI3K (PIK3CA, PIK3CB, PIK3CD, PIK3R1, PIK3R2, PIK3R3). We also examine the genes idenfitied and verifed in our previous miRNA manuscrupt differentaition ASD and siblings controls. These include AUTS2, FMR1, IL27, FOXP1, NTN1, NCAM2, GABRA4. In our previous study we also found that Cam Kinase II was differentially expressed and correlateed with ASD severity, so we examined CAMK2A, CAMK2B, CAMKK2.
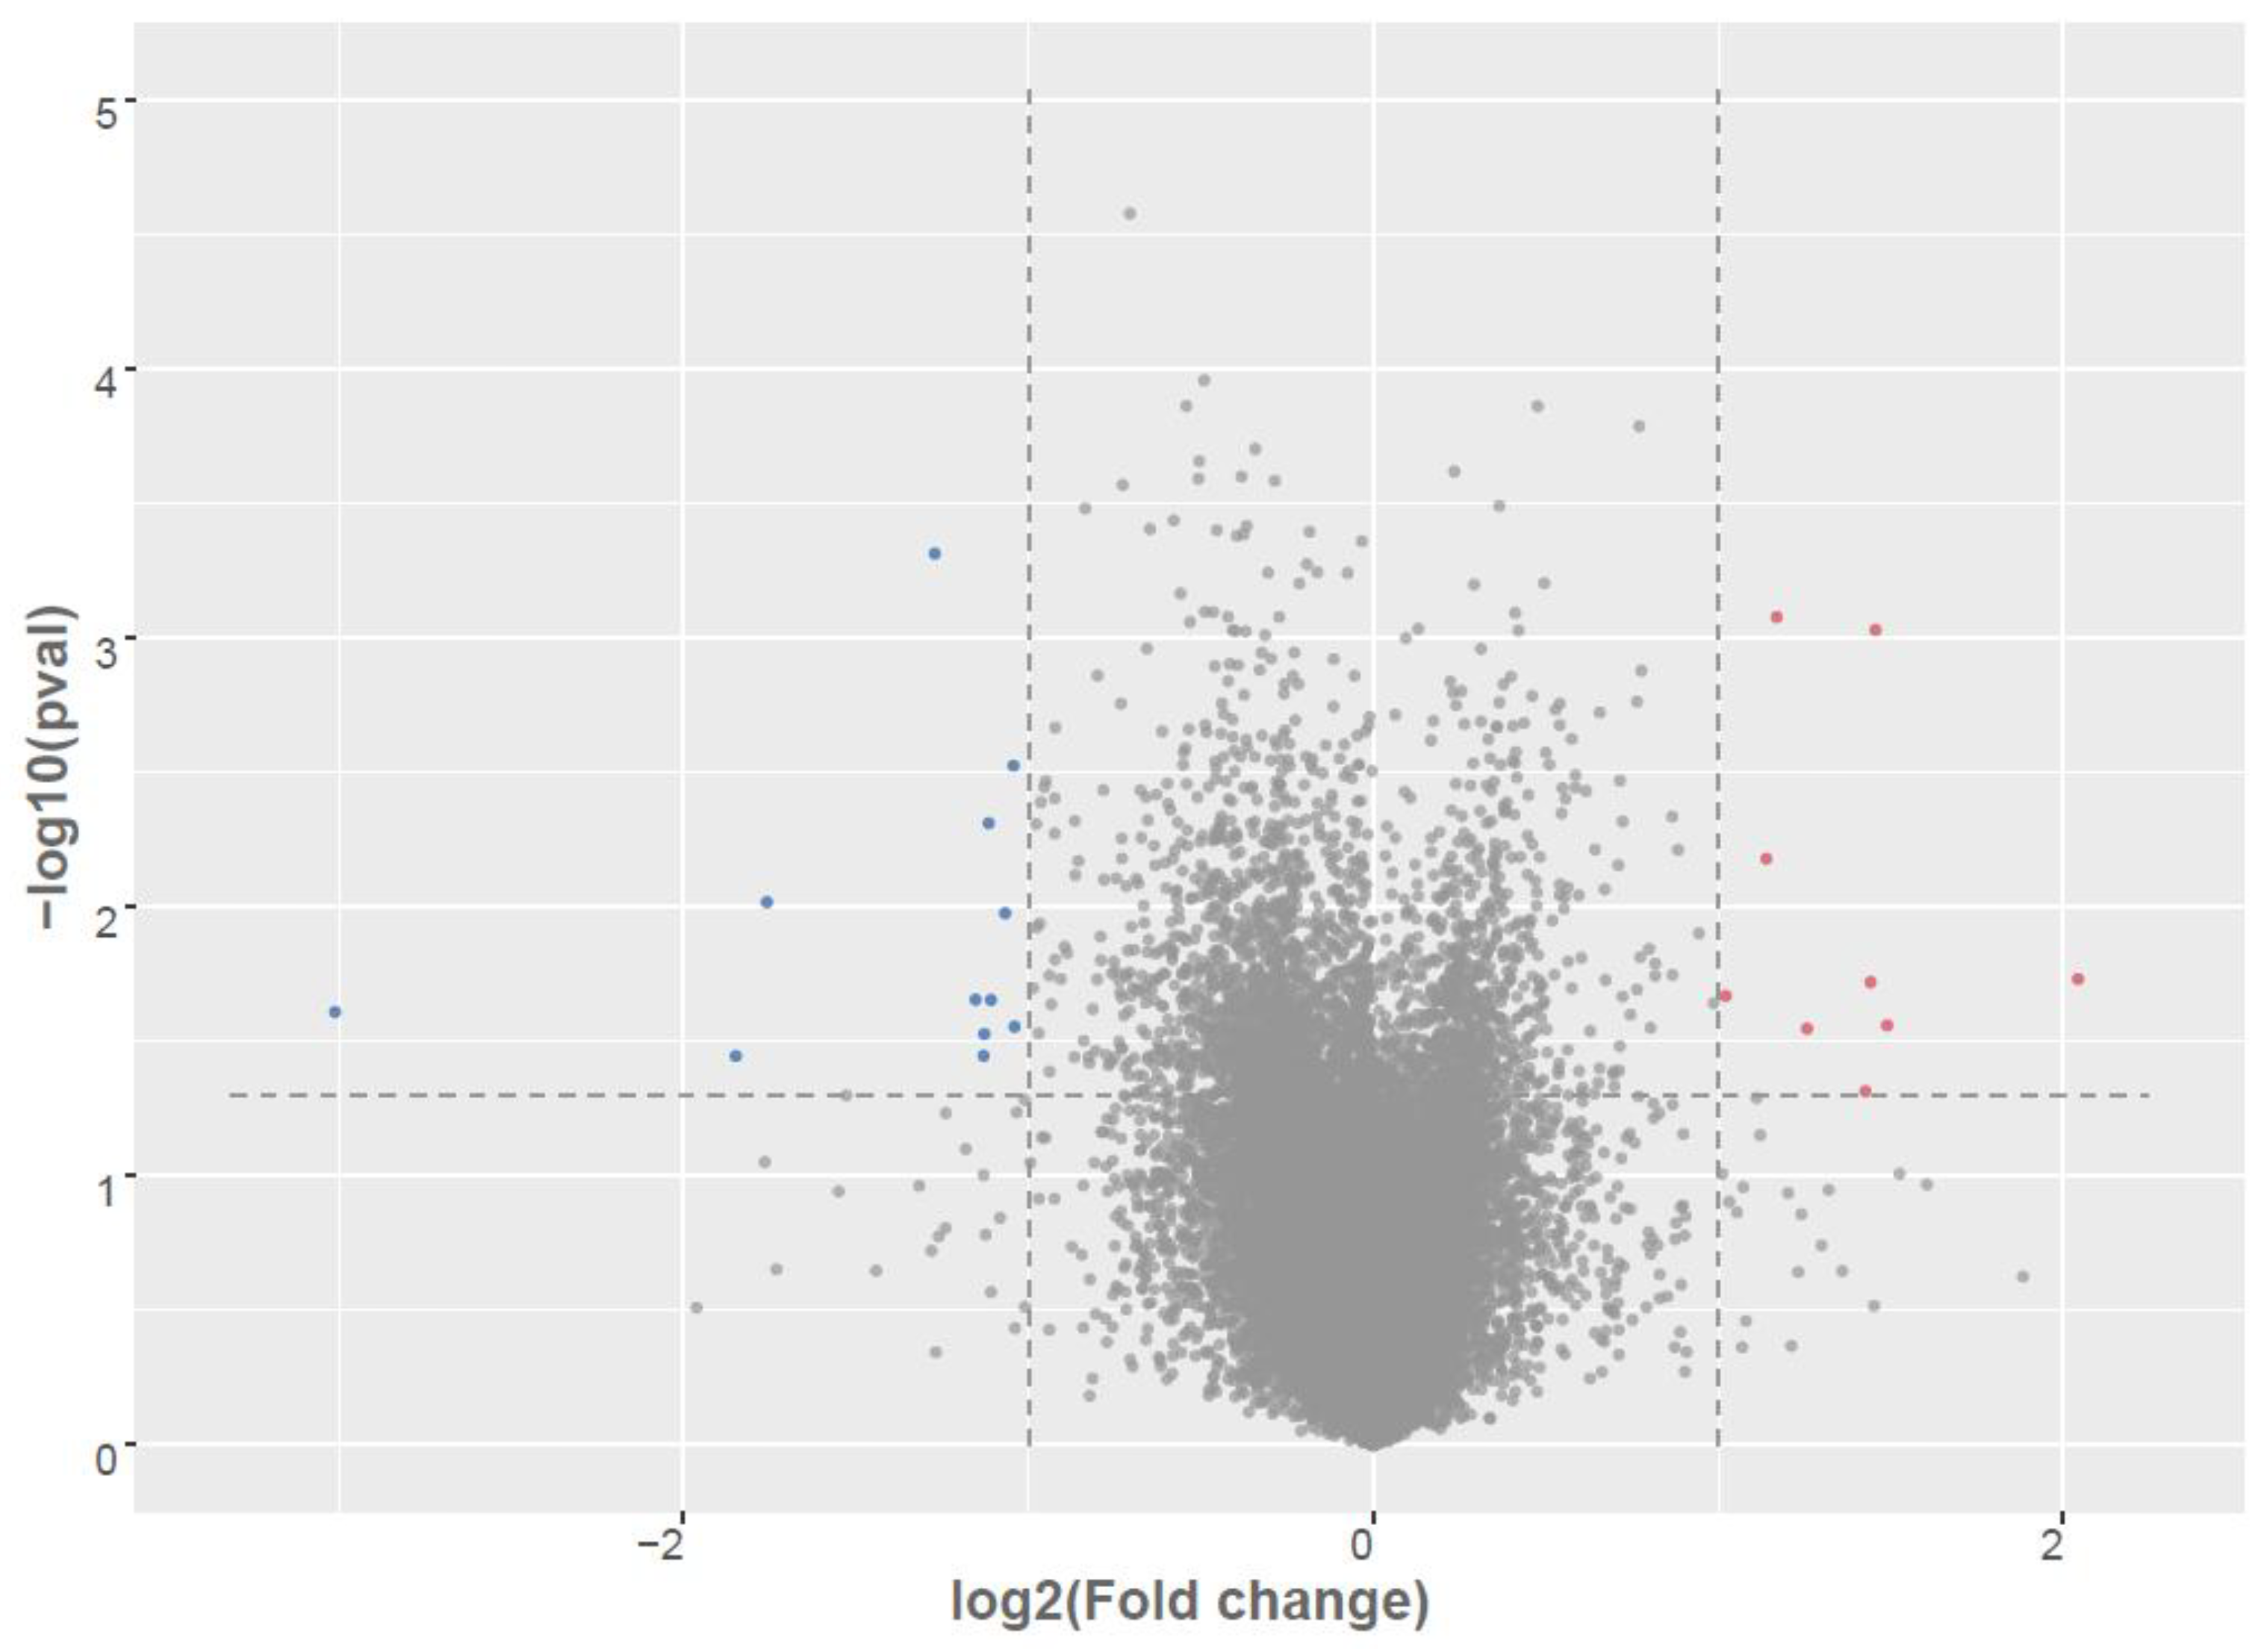
Figure 1.
Differential expression of mRNAs in LCLs groups. Volcano plot of differentially expressed between AD-A and AD-N. Red dots are up-regulated, Blue dots are down-regulated; Grey dots no change; To determine significant genes (red and blue color dots), the p-value cut-off was set to 0.05 and fold change of 1.0.
3. Results
3.1. Identification of Differentially Expressed Genes (DEGs)
Table 2 summarizes 24 differentially expressed genes (DEGs) between the AD-A and AD-N groups, identified through RNA-seq analysis using a significance threshold of p < 0.05 and an absolute log₂ fold change > 1.0. Among these, 14 transcripts were significantly downregulated (i.e., elevated in AD-A relative to AD-N), while 10 exhibited upregulation (i.e., elevated in AD-N).Genes upregulated in the AD-N cohort include mitochondrial ribosomal protein MRPL41 and the nuclear RNA processing gene RPP25L, suggesting perturbed mRNA maturation dynamics. Additionally, transcripts linked to immunological function (e.g., HLA-DQA2, HEXIM1, PNMA1) and oncogenic pathways(HEXIM1, FRAT2, PNMA1, HMGA1) were enriched.
Conversely, the AD-A group demonstrated upregulation of several transcripts implicated in tumorigenesis (CAB39), intracellular signaling (CAB39), autoimmunity (IFIT3), and mTOR signaling (DEPTOR). Genes involved in transcriptional regulation (TCEAL8, DDX21, CHD3, HIST2H2BE) and phospholipid metabolism (LYPLA1) were also significantly elevated. Notably, none of these DEGs are curated within the SFARI Gene database, indicating a potential divergence from established autism-related gene sets.

Table 2.
Top differentially expressed mRNAs between AD-A and AD-N LCLs.
| Up Regulated in AD-N (LCLs from Children with Autism with Normal Mitochondrial Function). Bolded an italic are known biomarkers for ASD. | |||
|---|---|---|---|
| mRNA | log2(FC) | -log10(p) | Gene Name |
| MRPL41 | 2.04 | 1.73 | Mitochondrial ribosomal protein l41 |
| HLA-DQA2 | 1.49 | 1.56 | Major histocompatibility complex, class ii, dq alpha-2 |
| GAPDHP1 | 1.46 | 3.03 | Glyceraldehyde-3-phosphate dehydrogenase pseudogene 1 |
| RPP25L | 1.44 | 1.72 | Ribonuclease P/MRP Subunit p25 |
| SNRPFP2 | 1.43 | 1.31 | Small nuclear ribonucleoprotein polypeptide F pseudogene 2 |
| HEXIM1 | 1.26 | 1.55 | Hexamethylene bis acetamide-inducible protein 1 |
| FRAT2 | 1.17 | 3.08 | Frequently rearranged in advanced t-cell lymphomas 2 |
| FAM110A | 1.14 | 2.18 | Family with sequence similarity 110 |
| PNMA1 | 1.11 | 1.29 | Paraneoplastic antigen ma1 |
| HMGA1 | 1.02 | 1.67 | High mobility group at-hook 1 |
| Down Regulated in AD-N (LCLs from Children with Autism with Normal Mitochondrial Function) | |||
| miRNA ID | log2(FC) | -log10(p) | Gene Name |
| CTD-2287O16.1 | -3.01 | 1.61 | Pseudogene |
| CAB39 | -1.85 | 1.45 | Calcium-binding protein 39 |
| RP11-603J24.17 | -1.76 | 2.02 | Antisense gene |
| IFIT3 | -1.53 | 1.30 | Interferon-induced protein with tetratricopeptide repeats 3 |
| CECR1 | -1.27 | 3.31 | Adenosine deaminase 2 |
| DEPTOR | -1.15 | 1.65 | Dep domain-containing protein 6 |
| F13A1 | -1.13 | 1.45 | Factor xiii, a1 subunit |
| TCEAL8 | -1.13 | 1.53 | Transcription elongation factor a like 8 |
| LYPLA1 | -1.12 | 2.31 | Lysophospholipase i |
| IQUB | -1.11 | 1.65 | Iq motif- and ubiquitin domain-containing protein |
| FAM103A2P | -1.07 | 1.98 | RNA guanine-7 methyltransferase activating subunit like |
| DDX21 | -1.04 | 2.52 | Dexd-BOX HELICASE 21 |
| CHD3 | -1.04 | 1.55 | Chromodomain helicase dna-binding protein 3 |
| HIST2H2BE | -1.01 | 1.28 | Histone gene cluster 2, h2b histone family, member e |
GO enchainment analysis (Figure 2) several processes with high rich factor ?? and statistical significance including 75K snRNA binding, adenosine receptor binding and catabolic processes, palmitoyl-protein hydrolase and protein depalmitoylation activity and positive regulator of signal transduction of p53. Significantly inhibited pathways were of peptide crops-linking, nitric oxide metabolic process and mitochondrial larghe ribnosomal subunit.
To elucidate the biological relevance of differentially expressed genes, we examined their association with Gene Ontology (GO) biological processes, focusing on those reaching statistical significance (p < 0.05), as summarized in Table 3. Among the genes enriched in the AD-N subgroup, HEXIM1 and MRPL41 emerged as consistently implicated in distinct molecular pathways.. HEXIM1 was associated with cyclin-dependent protein serine/threonine kinase activity and positive regulation of p53 class mediators while MRPL41 was related to gene translation in the mitochondria. CECR1, DDX21, F13A1, LYPLA1 were consistently related to processes increased in the AD-A group. CECR1 GO processes all points to adenosine catabolism and salvage, DDX21 all point to RNA metabolism, F13A1 all point to healing processes and LYPLA1 GO processes point to lipoprotein modifications and membrane signaling dynamics. FRAT2, HEXIM1, MRPL41, CECR1, DDX21, RPP25L had genes with both increased and decreased differential expression between groups.
Figure 2.
Enrichment analysis of the differentially expressed mRNAs by IPA software. The top 20 enriched GO functional processes of the target genes of differentially expressed mRNAs. Red=activated; Blue= Inhibited.
Figure 2.
Enrichment analysis of the differentially expressed mRNAs by IPA software. The top 20 enriched GO functional processes of the target genes of differentially expressed mRNAs. Red=activated; Blue= Inhibited.
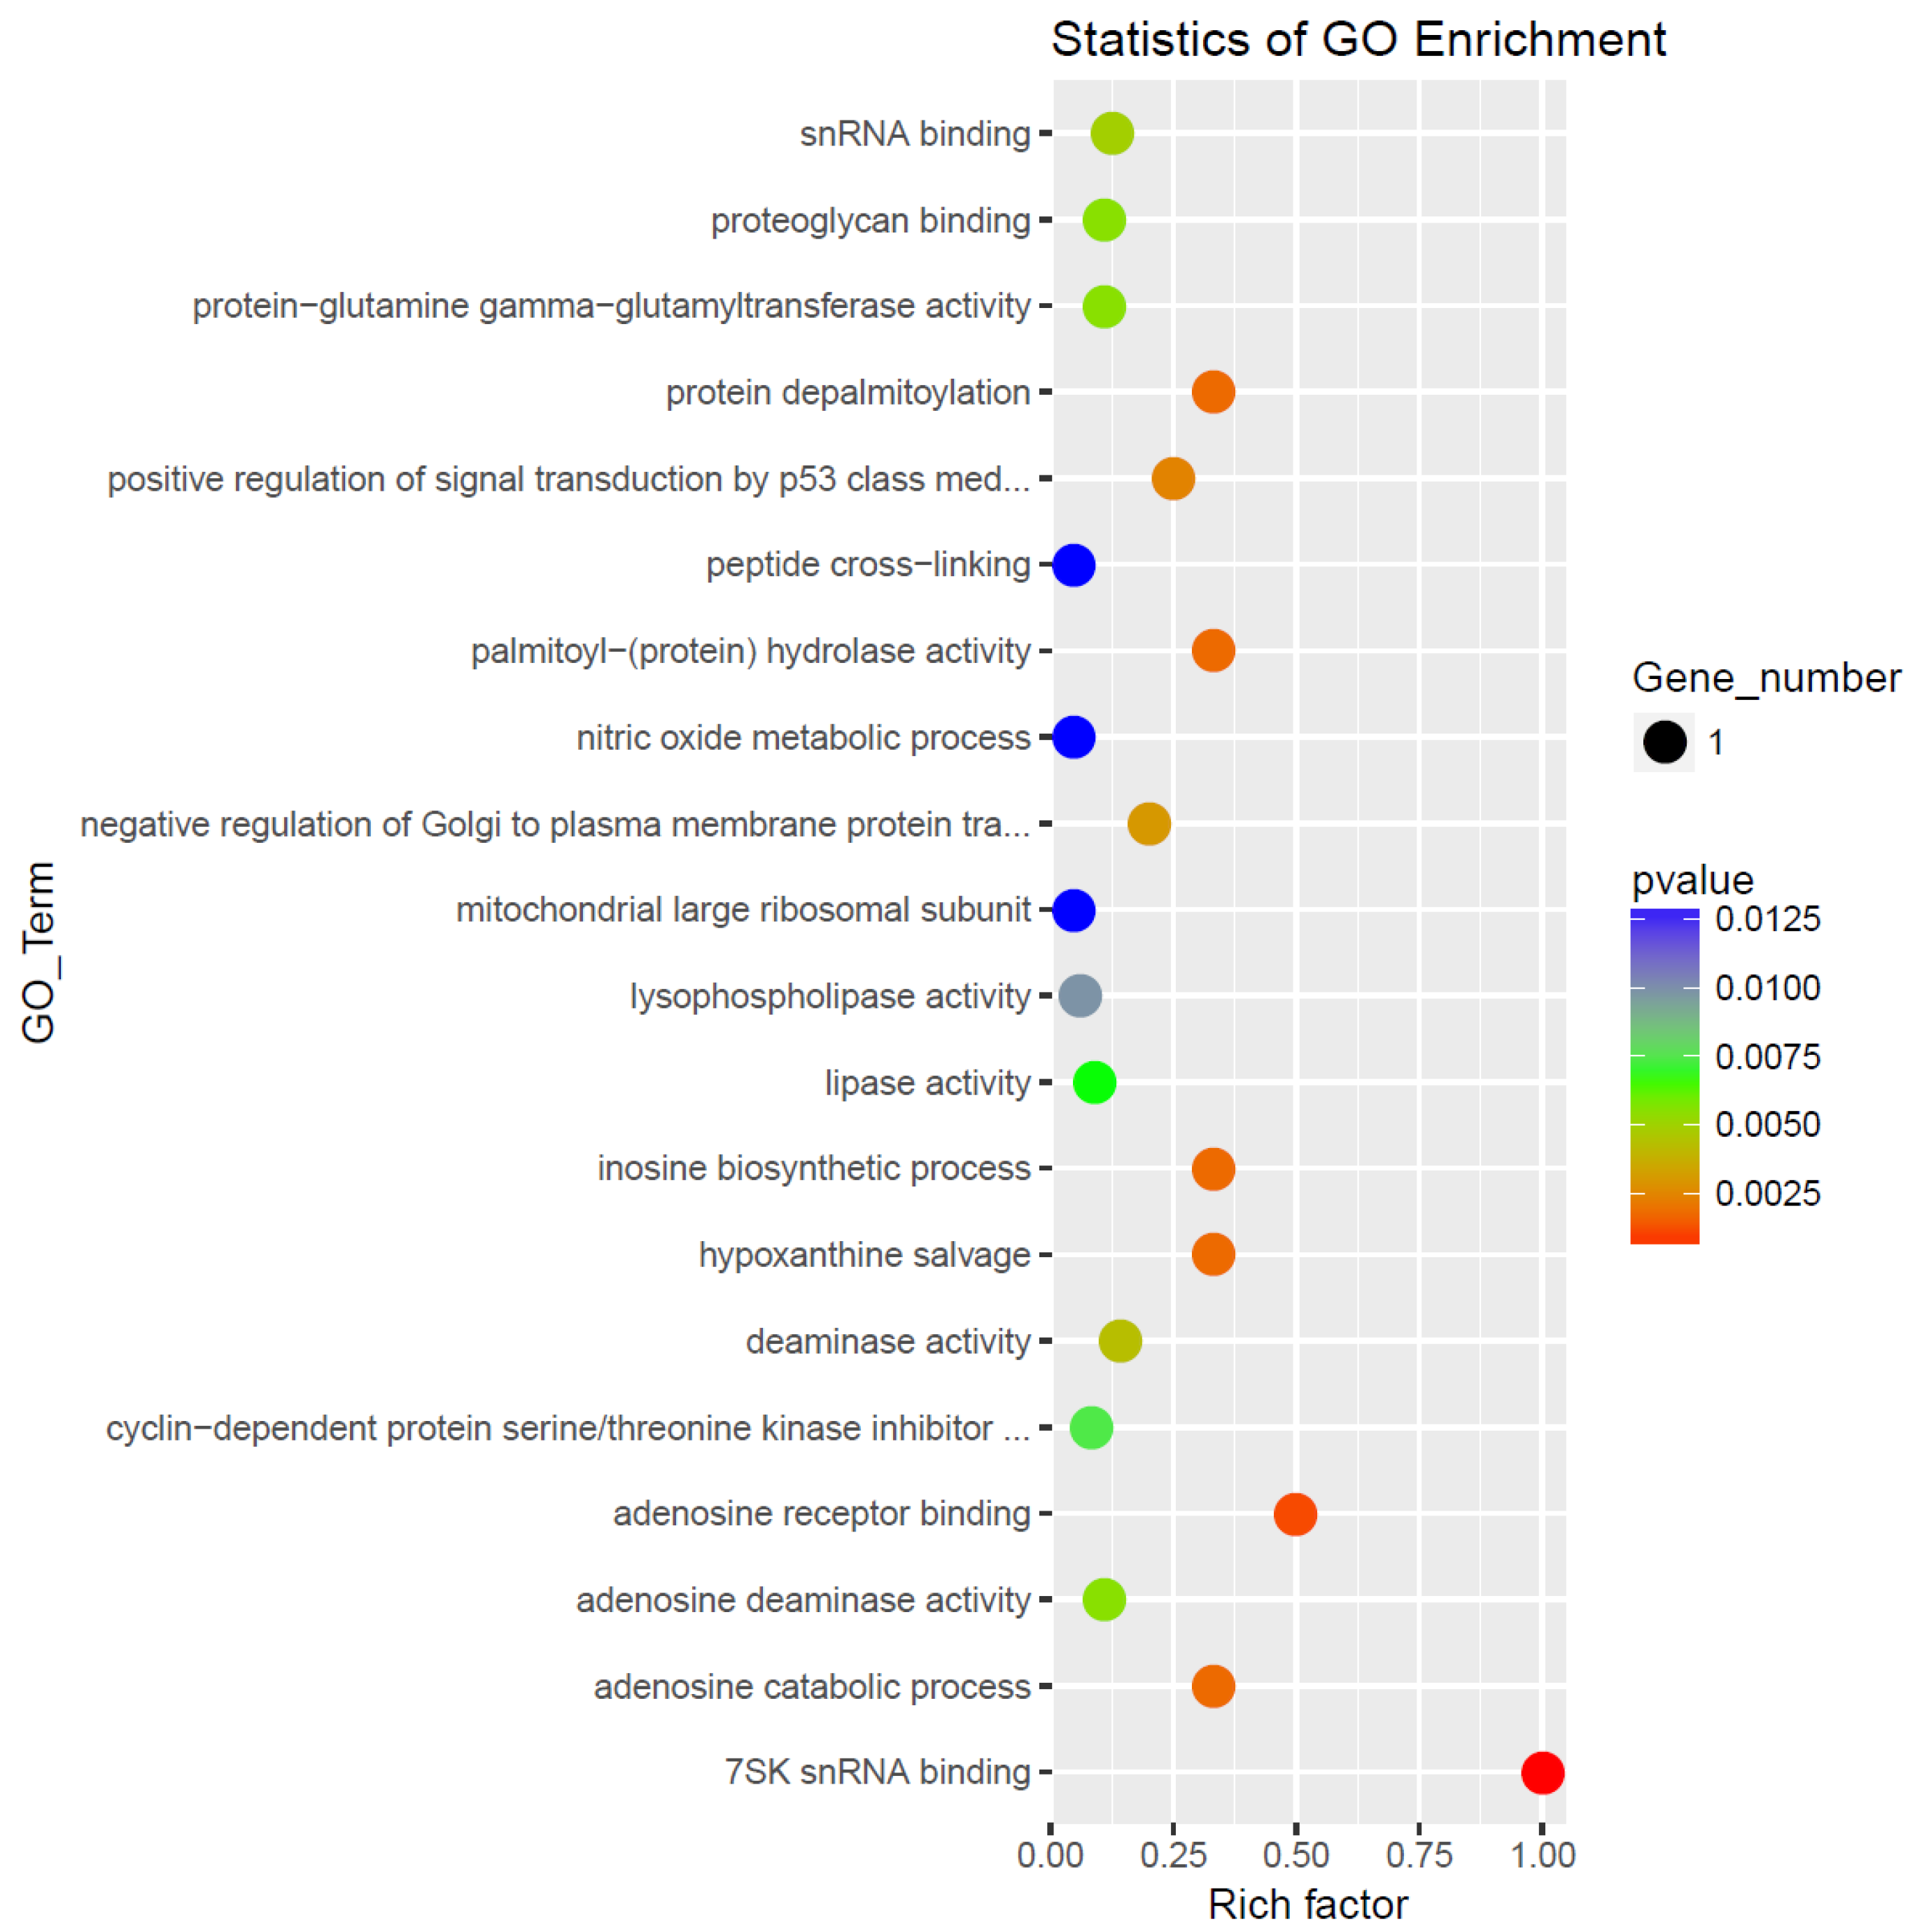
Figure 3.
Differential expression of miRNA in LCLs groups by small RNA-seq analysis (miRNA seq). Volcano plot of differentially expressed between AD-A and AD-N. Red dots are up-regulated, Blue dots are down-regulated; Grey dots no change; To determine significant genes (red and blue color dots), the p-value cut-off was set to 0.05 and fold change of 1.0.
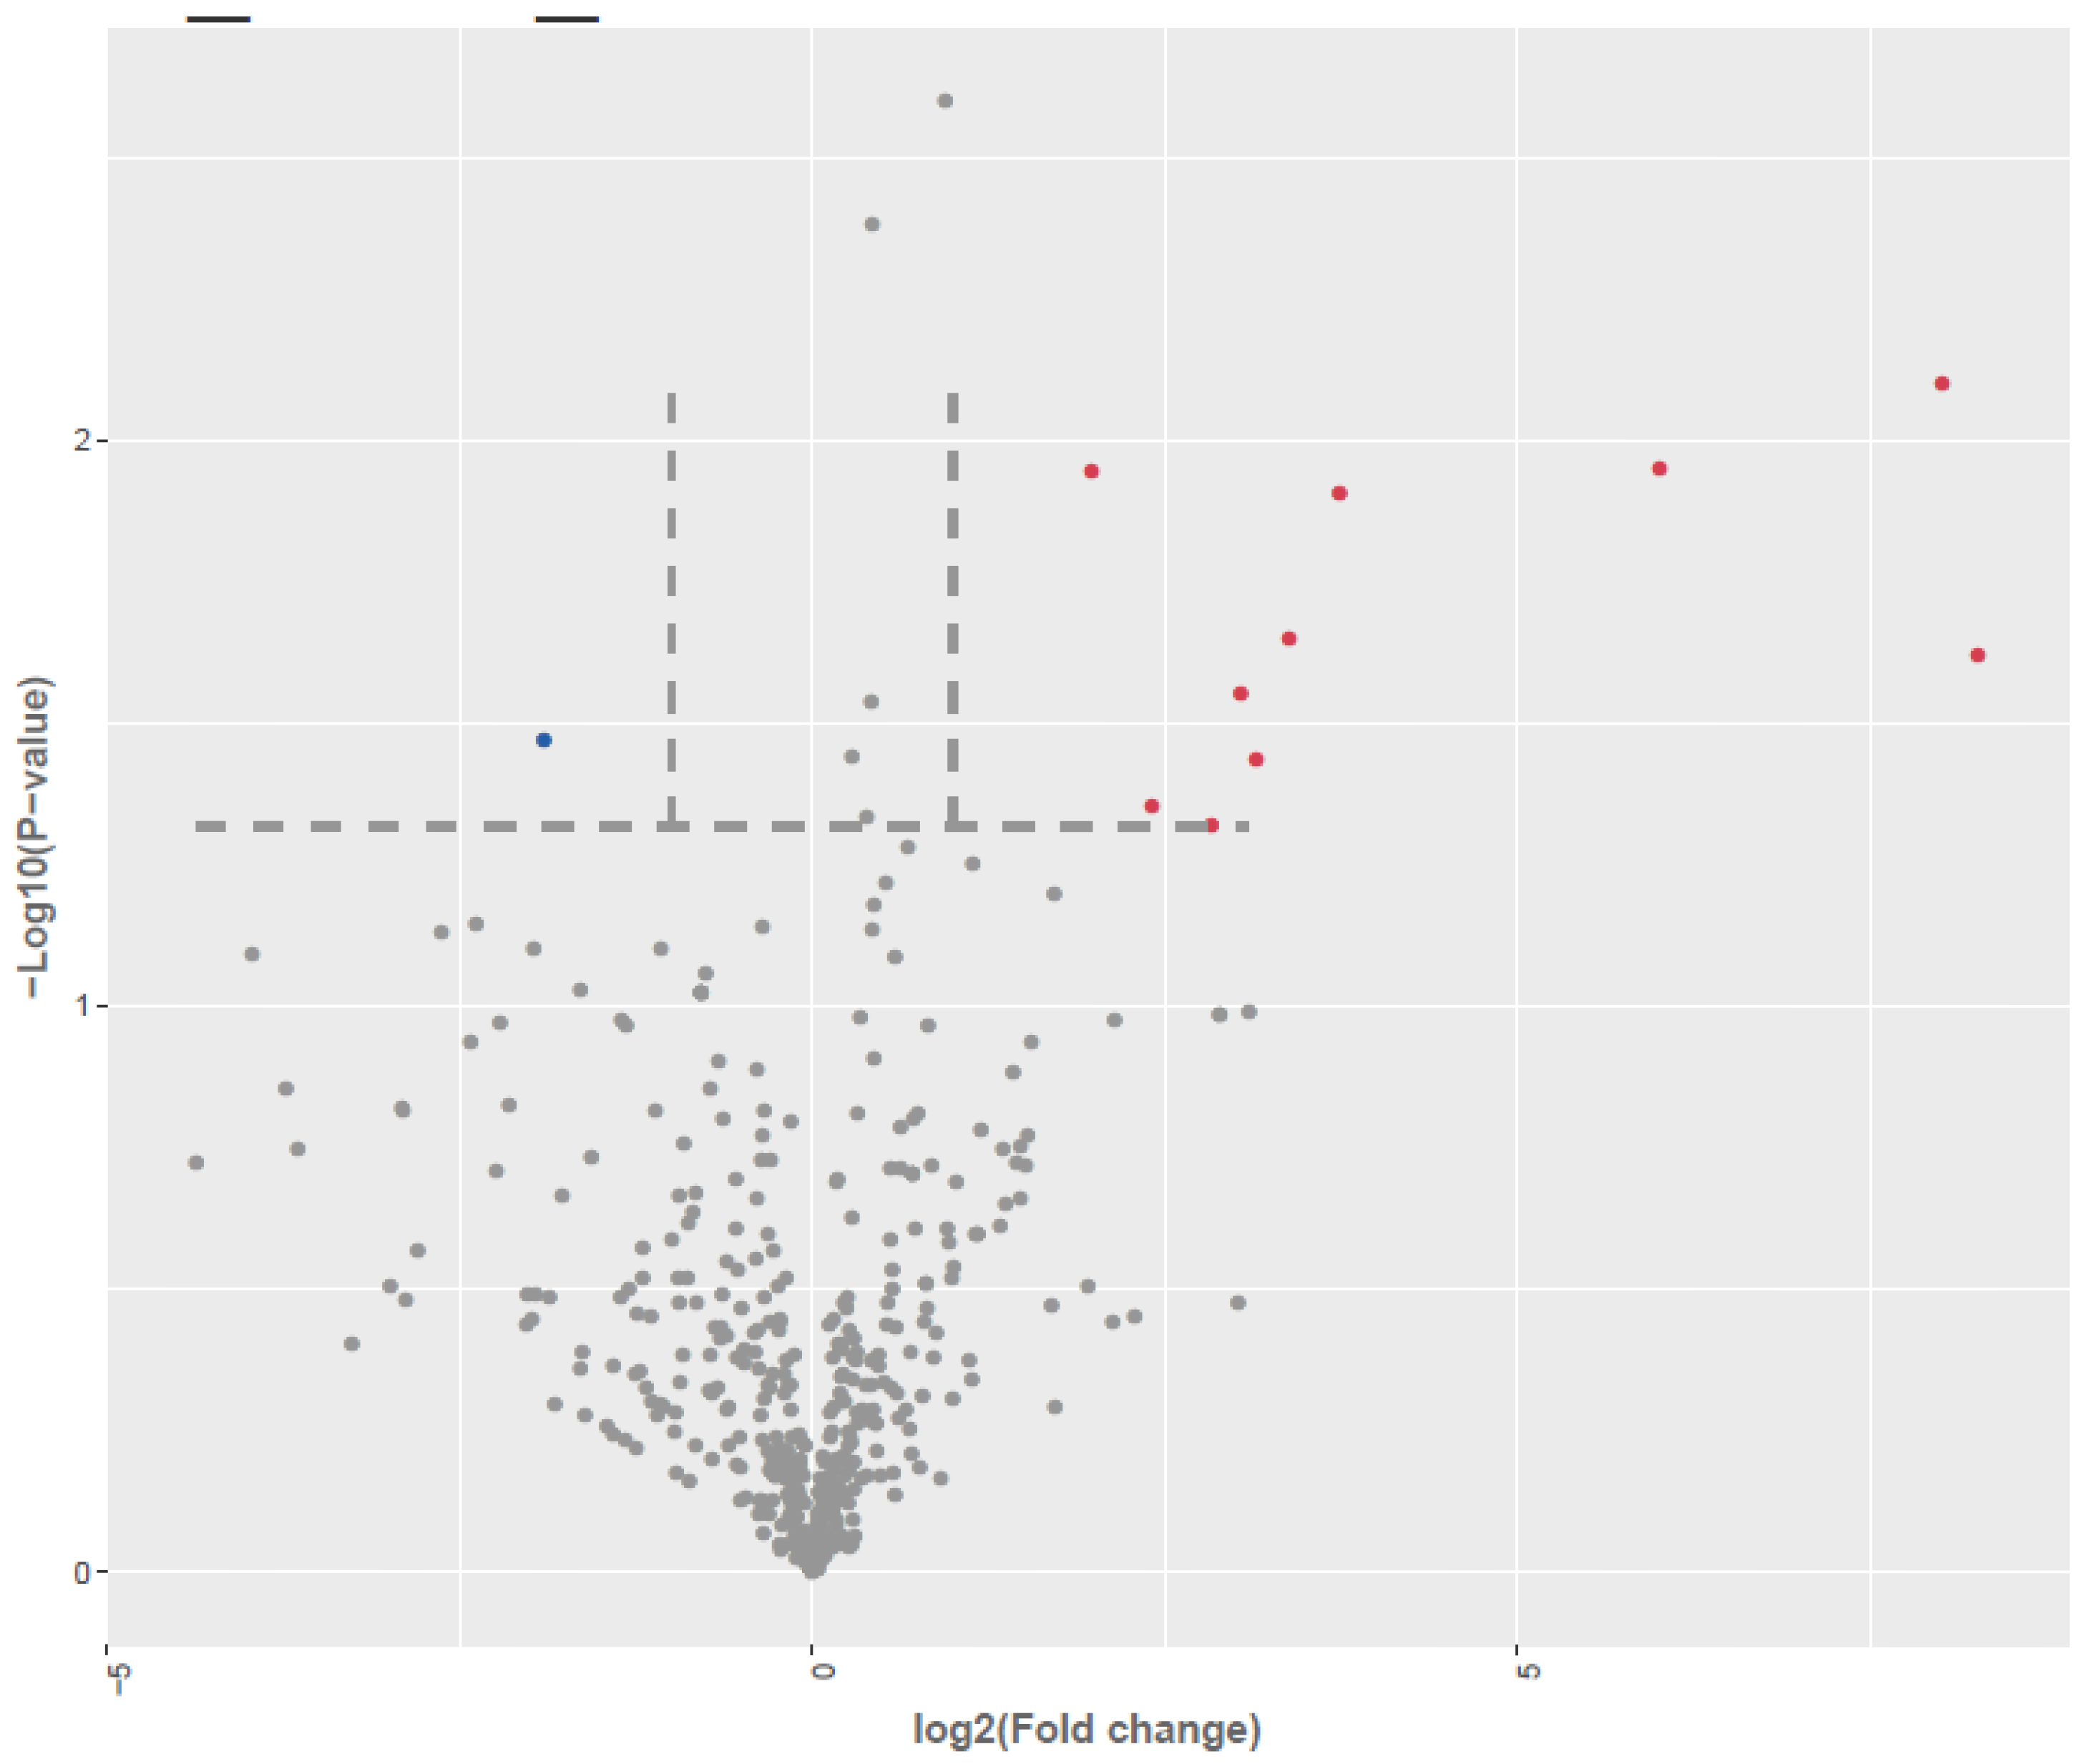
3.2. Identification of Differentially Expressed miRNAs (DEMs)
Annotation of total and unique miRNA species across AD-A, AD-N, and control samples revealed comparable distribution profiles, as illustrated by the pie charts in Supplementary Figures S1A and S1B. Analysis of read length distributions across these groups demonstrated a pronounced enrichment around 22 nucleotides, with the majority of high-confidence reads falling within the 21–24 nt range (Supplementary Figure S2), consistent with canonical miRNA length signatures.
Differential expression analysis, visualized through volcano plots (Figure 1A), identified a subset of both annotated and novel miRNAs meeting stringent thresholds of |log₂ fold change| and p ≤ 0.05. A comparative analysis between AD-N and AD-A samples revealed 19 significantly dysregulated miRNAs, including 18 upregulated and 1 downregulated transcripts out of 525 detected miRNA species.
These differentially expressed miRNAs, along with their fold-change values and statistical significance, are detailed in Table 4. Hierarchical clustering and heatmap visualization (Supplementary Figure S3) illustrate expression dynamics across samples, using a two-color gradient to depict relative abundance—ranging from red (upregulation) to green (downregulation).Integrative analysis revealed that a subset of dysregulated miRNAs—namely hsa-miR-1273h-3p, hsa-miR-197-3p, hsa-miR-199a-5p, hsa-miR-204-5p, hsa-miR-874-5p, hsa-miR-100, hsa-miR-941 and hsa-miR-769-5p. —are predicted to target mRNAs previously identified as differentially expressed, suggesting coordinated post-transcriptional regulatory mechanisms driving disease-specific transcriptomic remodeling.
The graph in Figure 4 represents the target genes of the differentially dysregulated miRNAs enriched in GO terms, where the color of the circle indicates the statistical significance expressed in log10 values and the size of the circle the number of target genes involved. KEGG pathway analysis showed that the target genes were notably enriched in the pathways involving transport, transferase activity, DNA transcription, nucleotide and metal ion binding, and ATP binding.
To assess whether the differentially expressed miRNAs converge on common molecular pathways, we utilized miRPath v.3 to perform integrative pathway analysis based on the union of miRNAs targeting both experimentally identified mRNAs and computationally predicted gene targets [31]. KEGG pathway enrichment revealed eight distinct functional categories, while Gene Ontology (GO) analysis identified seven enriched biological process categories. As illustrated in Figure 5, ECM-receptor interaction emerged as the most prominent and broadly targeted pathway, with the largest subset of associated miRNAs, suggesting a central role for extracellular matrix signaling in the regulatory network implicated in ASD subtypes.
4. Discussion
We report the identification of two biologically distinct subgroups of autism spectrum disorder (ASD) based on mitochondrial functional phenotypes in lymphoblastoid cell lines (LCLs): AD-A (ASD with aberrant mitochondrial function characterized by elevated respiration and stress sensitivity) and AD-N (ASD with normative mitochondrial function). To elucidate molecular mechanisms underlying these phenotypes, we conducted integrated transcriptomic profiling—encompassing both mRNA and miRNA sequencing—followed by differential expression analysis, functional enrichment, and pathway interrogation, with a particular focus on mTOR and mitochondrial stress-related genes previously implicated in these ASD subtypes.
RNA-seq analysis revealed 24 mRNAs differentially expressed between AD-A and AD-N groups (p < 0.05, |log₂FC| > 1), with 14 transcripts upregulated in AD-A and 10 in AD-N. Upregulated transcripts in AD-N included MRPL41 and RPP25L, implicated in mitochondrial and nuclear RNA processing, respectively, as well as immune-related and oncogenic transcripts (HLA-DQA2, HEXIM1, PNMA1). In contrast, AD-A LCLs exhibited increased expression of genes associated with intracellular signaling (CAB39), autoimmune processes (IFIT3), and mTOR pathway regulation (DEPTOR), as well as genes involved in transcriptional control (TCEAL8, CHD3, DDX21) and lipid metabolism (LYPLA1). Gene Ontology (GO) enrichment analysis highlighted perturbations in snRNA binding, purinergic signaling, p53 regulation, and depalmitoylation processes..
Out of 525 detected miRNAs, 18 were upregulated and 1 was downregulated in AD-N as compared to AD-A. Several differentially expressed miRNAs, including hsa-miR-1273h-3p, hsa-miR-197-3p, hsa-miR-199a-5p, hsa-miR-204-5p, hsa-miR-874-5p, hsa-miR-100-5p, hsa-miR-941, and hsa-miR-769-5p, target both the genes identified in the mRNA analysis and those previously implicated in ASD, such as the mTOR pathway and Cam Kinase II. Pathway enrichment analysis revealed overrepresentation of pathways involved in transport, transferase activity, DNA transcription, nucleotide/metal ion binding, and ATP binding. The ECM receptor interaction pathway was notably enriched.
The results show a miRNA-mRNA network potentially regulating mitochondrial function in ASD, particularly the mTOR, PI3K/AKT, and autophagy pathways previously associated with mitochondrial regulation, immune response, and neuronal health. The study also connects some of these molecular changes to genes previously differentiated between ASD subtypes and affected by ASD severity.
Of particular note, the mechanistic target of rapamycin (mTOR) emerged as a central node in the transcriptomic network. mTOR exists in two functionally distinct complexes: mTORC1, which governs protein synthesis, mitochondrial metabolism, and autophagy, and mTORC2, which modulates cytoskeletal dynamics and cell survival. Hyperactivation of mTORC1—a phenomenon documented in a subset of ASD individuals—impairs mitophagy, elevates mitochondrial ROS, synaptic pruning and disrupts ATP homeostasis, culminating in synaptic and dendritic pathologies linked to core ASD features [21,28,30,31].
CaMKII also has a critical role in post-synaptic neuronal function where it modulates long-term potentiation and NMDA-dependent synaptic plasticity [32,33]. CaMKII has an important role in regulation of NMDA receptors, resulting neuronal excitability through glutamate transmission [34]. This may be significant as dysregulation of long-term potentiation [35] and glutamate regulation [36] has been implicated in psychiatric disorders. Mutations in CaMKIIα and CaMKIIβ are association with intellectual disability [37] and ASD behaviors [38].
Our previous study examining miRNA which distinguished ASD LCLs from controls identified two candidate miRNAs, hsa-miR-181a-5p and hsa-miR-320a [39], which are highly expressed in brain and spinal cord [40] and they have been identified as dysregulated in previous ASD studies [41,42,43]. Interestingly, both miR-181a-5p [44,45] and miR-320a [46] target AKT3, a key regulator of the PI3K-AKT-mTOR [47] and PTEN/Akt/TGF-β1 signaling pathway [27], two pathways which overlap the pathways identified in this study and are known to be involved in ASD.
5. Conclusions
This study underscores the molecular heterogeneity of ASD by identifying a distinct ASD subgroup characterized by abnormal mitochondrial function (AD-A) and unique miRNA–mRNA expression profiles. The enrichment of transcripts involved in mTOR signaling, cellular stress responses, and mitochondrial regulation highlights convergent pathways that may underpin the metabolic phenotype observed in this subset. These findings not only provide mechanistic insights into ASD pathophysiology but also point to actionable molecular signatures with potential utility as biomarkers for stratification. Importantly, the delineation of ASD subtypes based on mitochondrial and transcriptional dysregulation offers a critical step toward precision diagnostics and paves the way for pathway-targeted therapies tailored to metabolically vulnerable individuals with ASD.
Supplementary Materials
The following supporting information can be downloaded at the website of this paper posted on Preprints.org, Figure S1: Distribution of small RNA type, Figure S2: Length Distribution of miRNAs; Figure S3A: Heat Map for AD-N vs AD-A.
Author Contributions
Conceptualization, PSG, REF, SR.; methodology, SR, SM, SB, PSG, REF; validation, SR, SM, SB; formal analysis, SR, HD, SM; data curation, HD.; writing—original draft preparation, PSG, REF.; visualization, PSG, REF, RS.; supervision, SR, PSG, REF.; funding acquisition, REF. All authors have read and agreed to the published version of the manuscript.
Funding
This research was made possible with funds from Jonty Foundation (St Paul, MN), the XEL Foundation (Pittsburgh, PA) and the Brain Foundation (Pleasanton, CA).
Institutional Review Board Statement
These experiments were performed on deidentified cell lines and thus not considered human research as verified by a determination from the University of Arkansas for Medical Sciences Investigational Review Board.
Informed Consent Statement
Not applicable.
Data Availability Statement
Data is available upon request.
Conflicts of Interest
The authors declare no conflict of interest. The funders had no role in the design of the study; in the collection, analyses, or interpretation of data; in the writing of the manuscript, or in the decision to publish the results.
References
- APA. Diagnostic and statistical manual of mental disorders., 5th ed.; American Psychiatric Association: Washington, DC, 2013. [Google Scholar]
- Shaw, K.A.; Williams, S.; Patrick, M.E.; Valencia-Prado, M.; Durkin, M.S.; Howerton, E.M.; Ladd-Acosta, C.M.; Pas, E.T.; Bakian, A.V.; Bartholomew, P.; et al. Prevalence and Early Identification of Autism Spectrum Disorder Among Children Aged 4 and 8 Years - Autism and Developmental Disabilities Monitoring Network, 16 Sites, United States, 2022. MMWR Surveill Summ 2025, 74, 1–22. [Google Scholar] [CrossRef] [PubMed]
- Frye, R.E. A Personalized Multidisciplinary Approach to Evaluating and Treating Autism Spectrum Disorder. J Pers Med 2022, 12. [Google Scholar] [CrossRef] [PubMed]
- Jensen, A.R.; Lane, A.L.; Werner, B.A.; McLees, S.E.; Fletcher, T.S.; Frye, R.E. Modern Biomarkers for Autism Spectrum Disorder: Future Directions. Mol Diagn Ther 2022, 26, 483–495. [Google Scholar] [CrossRef] [PubMed]
- Rossignol, D.A.; Frye, R.E. A review of research trends in physiological abnormalities in autism spectrum disorders: immune dysregulation, inflammation, oxidative stress, mitochondrial dysfunction and environmental toxicant exposures. Molecular psychiatry 2012, 17, 389–401. [Google Scholar] [CrossRef] [PubMed]
- Rose, S.; Niyazov, D.M.; Rossignol, D.A.; Goldenthal, M.; Kahler, S.G.; Frye, R.E. Clinical and Molecular Characteristics of Mitochondrial Dysfunction in Autism Spectrum Disorder. Mol Diagn Ther 2018, 22, 571–593. [Google Scholar] [CrossRef] [PubMed]
- Niyazov, D.M.; Kahler, S.G.; Frye, R.E. Primary Mitochondrial Disease and Secondary Mitochondrial Dysfunction: Importance of Distinction for Diagnosis and Treatment. Mol Syndromol 2016, 7, 122–137. [Google Scholar] [CrossRef] [PubMed]
- Frye, R.E.; Rincon, N.; McCarty, P.J.; Brister, D.; Scheck, A.C.; Rossignol, D.A. Biomarkers of mitochondrial dysfunction in autism spectrum disorder: A systematic review and meta-analysis. Neurobiol Dis 2024, 197, 106520. [Google Scholar] [CrossRef] [PubMed]
- Rossignol, D.A.; Frye, R.E. Mitochondrial dysfunction in autism spectrum disorders: a systematic review and meta-analysis. Molecular psychiatry 2012, 17, 290–314. [Google Scholar] [CrossRef] [PubMed]
- Napoli, E.; Wong, S.; Hertz-Picciotto, I.; Giulivi, C. Deficits in bioenergetics and impaired immune response in granulocytes from children with autism. Pediatrics 2014, 133, e1405–1410. [Google Scholar] [CrossRef] [PubMed]
- Giulivi, C.; Zhang, Y.F.; Omanska-Klusek, A.; Ross-Inta, C.; Wong, S.; Hertz-Picciotto, I.; Tassone, F.; Pessah, I.N. Mitochondrial dysfunction in autism. JAMA : the journal of the American Medical Association 2010, 304, 2389–2396. [Google Scholar] [CrossRef] [PubMed]
- Graf, W.D.; Marin-Garcia, J.; Gao, H.G.; Pizzo, S.; Naviaux, R.K.; Markusic, D.; Barshop, B.A.; Courchesne, E.; Haas, R.H. Autism associated with the mitochondrial DNA G8363A transfer RNA(Lys) mutation. J Child Neurol 2000, 15, 357–361. [Google Scholar] [CrossRef] [PubMed]
- Frye, R.E.; Naviaux, R.K. Autistic disorder with complex IV overactivity: A new mitochondrial syndrome. Journal of Pediatric Neurology 2011, 9, 427–434. [Google Scholar]
- Palmieri, L.; Papaleo, V.; Porcelli, V.; Scarcia, P.; Gaita, L.; Sacco, R.; Hager, J.; Rousseau, F.; Curatolo, P.; Manzi, B.; et al. Altered calcium homeostasis in autism-spectrum disorders: evidence from biochemical and genetic studies of the mitochondrial aspartate/glutamate carrier AGC1. Molecular psychiatry 2010, 15, 38–52. [Google Scholar] [CrossRef] [PubMed]
- Delhey, L.; Kilinc, E.N.; Yin, L.; Slattery, J.; Tippett, M.; Wynne, R.; Rose, S.; Kahler, S.; Damle, S.; Legido, A.; et al. Bioenergetic variation is related to autism symptomatology. Metabolic brain disease 2017, 32, 2021–2031. [Google Scholar] [CrossRef] [PubMed]
- Hassan, H.; Gnaiger, E.; Zakaria, F.; Makpol, S.; Karim, N.A. Alterations in mitocohndrial respiratiory capacity and membrane potential: a link between mitochondrial dysregulation and autism. MitoFit.
- Rose, S.; Bennuri, S.C.; Davis, J.E.; Wynne, R.; Slattery, J.C.; Tippett, M.; Delhey, L.; Melnyk, S.; Kahler, S.G.; MacFabe, D.F.; et al. Butyrate enhances mitochondrial function during oxidative stress in cell lines from boys with autism. Transl Psychiatry 2018, 8, 42. [Google Scholar] [CrossRef] [PubMed]
- Rose, S.; Bennuri, S.C.; Wynne, R.; Melnyk, S.; James, S.J.; Frye, R.E. Mitochondrial and redox abnormalities in autism lymphoblastoid cells: a sibling control study. FASEB journal : official publication of the Federation of American Societies for Experimental Biology 2017, 31, 904–909. [Google Scholar] [CrossRef] [PubMed]
- Rose, S.; Frye, R.E.; Slattery, J.; Wynne, R.; Tippett, M.; Melnyk, S.; James, S.J. Oxidative stress induces mitochondrial dysfunction in a subset of autistic lymphoblastoid cell lines. Transl Psychiatry 2015, 5, e526. [Google Scholar] [CrossRef] [PubMed]
- Rose, S.; Frye, R.E.; Slattery, J.; Wynne, R.; Tippett, M.; Pavliv, O.; Melnyk, S.; James, S.J. Oxidative stress induces mitochondrial dysfunction in a subset of autism lymphoblastoid cell lines in a well-matched case control cohort. PloS one 2014, 9, e85436. [Google Scholar] [CrossRef] [PubMed]
- Bennuri, S.C.; Rose, S.; Frye, R.E. Mitochondrial Dysfunction Is Inducible in Lymphoblastoid Cell Lines From Children With Autism and May Involve the TORC1 Pathway. Frontiers in psychiatry 2019, 10, 269. [Google Scholar] [CrossRef] [PubMed]
- Frye, R.E.; Rose, S.; Chacko, J.; Wynne, R.; Bennuri, S.C.; Slattery, J.C.; Tippett, M.; Delhey, L.; Melnyk, S.; Kahler, S.G.; et al. Modulation of mitochondrial function by the microbiome metabolite propionic acid in autism and control cell lines. Transl Psychiatry 2016, 6, e927. [Google Scholar] [CrossRef] [PubMed]
- Frye, R.E.; Rose, S.; Wynne, R.; Bennuri, S.C.; Blossom, S.; Gilbert, K.M.; Heilbrun, L.; Palmer, R.F. Oxidative Stress Challenge Uncovers Trichloroacetaldehyde Hydrate-Induced Mitoplasticity in Autistic and Control Lymphoblastoid Cell Lines. Sci Rep 2017, 7, 4478. [Google Scholar] [CrossRef] [PubMed]
- Rose, S.; Frye, R.E.; Slattery, J.; Wynne, R.; Tippett, M.; Melnyk, S.; James, S.J. Oxidative stress induces mitochondrial dysfunction in a subset of autistic lymphoblastoid cell lines. Translational psychiatry 2015, 5, e526. [Google Scholar] [CrossRef] [PubMed]
- Frye, R.E.; McCarty, P.J.; Werner, B.A.; Rose, S.; Scheck, A.C. Bioenergetic signatures of neurodevelopmental regression. Front Physiol 2024, 15, 1306038. [Google Scholar] [CrossRef] [PubMed]
- Frye, R.E.; Cakir, J.; Rose, S.; Delhey, L.; Bennuri, S.C.; Tippett, M.; Palmer, R.F.; Austin, C.; Curtin, P.; Arora, M. Early life metal exposure dysregulates cellular bioenergetics in children with regressive autism spectrum disorder. Transl Psychiatry 2020, 10, 223. [Google Scholar] [CrossRef] [PubMed]
- Li, H.Y.; He, H.C.; Song, J.F.; Du, Y.F.; Guan, M.; Wu, C.Y. Bone marrow-derived mesenchymal stem cells repair severe acute pancreatitis by secreting miR-181a-5p to target PTEN/Akt/TGF-beta1 signaling. Cellular signalling 2020, 66, 109436. [Google Scholar] [CrossRef] [PubMed]
- Dweep, H.; Gretz, N. miRWalk2.0: a comprehensive atlas of microRNA-target interactions. Nat Methods 2015, 12, 697. [Google Scholar] [CrossRef] [PubMed]
- Dweep, H.; Gretz, N.; Felekkis, K. A schematic workflow for collecting information about the interaction between copy number variants and microRNAs using existing resources. Methods Mol Biol 2014, 1182, 307–320. [Google Scholar] [CrossRef] [PubMed]
- Papagregoriou, G.; Erguler, K.; Dweep, H.; Voskarides, K.; Koupepidou, P.; Athanasiou, Y.; Pierides, A.; Gretz, N.; Felekkis, K.N.; Deltas, C. A miR-1207-5p binding site polymorphism abolishes regulation of HBEGF and is associated with disease severity in CFHR5 nephropathy. PloS one 2012, 7, e31021. [Google Scholar] [CrossRef] [PubMed]
- Vlachos, I.S.; Zagganas, K.; Paraskevopoulou, M.D.; Georgakilas, G.; Karagkouni, D.; Vergoulis, T.; Dalamagas, T.; Hatzigeorgiou, A.G. DIANA-miRPath v3.0: deciphering microRNA function with experimental support. Nucleic Acids Res 2015, 43, W460–466. [Google Scholar] [CrossRef] [PubMed]
- Hell, J.W. CaMKII: claiming center stage in postsynaptic function and organization. Neuron 2014, 81, 249–265. [Google Scholar] [CrossRef] [PubMed]
- Fan, X.; Jin, W.Y.; Wang, Y.T. The NMDA receptor complex: a multifunctional machine at the glutamatergic synapse. Frontiers in cellular neuroscience 2014, 8, 160. [Google Scholar] [CrossRef] [PubMed]
- Zhang, Y.; Matt, L.; Patriarchi, T.; Malik, Z.A.; Chowdhury, D.; Park, D.K.; Renieri, A.; Ames, J.B.; Hell, J.W. Capping of the N-terminus of PSD-95 by calmodulin triggers its postsynaptic release. The EMBO journal 2014, 33, 1341–1353. [Google Scholar] [CrossRef] [PubMed]
- Marsili, L.; Suppa, A.; Di Stasio, F.; Belvisi, D.; Upadhyay, N.; Berardelli, I.; Pasquini, M.; Petrucci, S.; Ginevrino, M.; Fabbrini, G.; et al. BDNF and LTP-/LTD-like plasticity of the primary motor cortex in Gilles de la Tourette syndrome. Experimental brain research 2017, 235, 841–850. [Google Scholar] [CrossRef] [PubMed]
- Laoutidis, Z.G.; Lekka, G.E.; Kioulos, K.T. Glutamatergic Agents as Add-On Medication for the Treatment of Obsessive-Compulsive Disorder: A Systematic Review and Meta-Analysis. The Journal of clinical psychiatry 2016, 77, e1576–e1583. [Google Scholar] [CrossRef] [PubMed]
- Kury, S.; van Woerden, G.M.; Besnard, T.; Proietti Onori, M.; Latypova, X.; Towne, M.C.; Cho, M.T.; Prescott, T.E.; Ploeg, M.A.; Sanders, S.; et al. De Novo Mutations in Protein Kinase Genes CAMK2A and CAMK2B Cause Intellectual Disability. American journal of human genetics 2017, 101, 768–788. [Google Scholar] [CrossRef] [PubMed]
- Stephenson, J.R.; Wang, X.; Perfitt, T.L.; Parrish, W.P.; Shonesy, B.C.; Marks, C.R.; Mortlock, D.P.; Nakagawa, T.; Sutcliffe, J.S.; Colbran, R.J. A Novel Human CAMK2A Mutation Disrupts Dendritic Morphology and Synaptic Transmission, and Causes ASD-Related Behaviors. The Journal of neuroscience : the official journal of the Society for Neuroscience 2017, 37, 2216–2233. [Google Scholar] [CrossRef] [PubMed]
- Gill, P.S.; Dweep, H.; Rose, S.; Wickramasinghe, P.J.; Vyas, K.K.; McCullough, S.; Porter-Gill, P.A.; Frye, R.E. Integrated microRNA-mRNA Expression Profiling Identifies Novel Targets and Networks Associated with Autism. J Pers Med 2022, 12. [Google Scholar] [CrossRef] [PubMed]
- Ludwig, N.; Leidinger, P.; Becker, K.; Backes, C.; Fehlmann, T.; Pallasch, C.; Rheinheimer, S.; Meder, B.; Stahler, C.; Meese, E.; et al. Distribution of miRNA expression across human tissues. Nucleic Acids Res 2016, 44, 3865–3877. [Google Scholar] [CrossRef] [PubMed]
- Abu-Elneel, K.; Liu, T.; Gazzaniga, F.S.; Nishimura, Y.; Wall, D.P.; Geschwind, D.H.; Lao, K.; Kosik, K.S. Heterogeneous dysregulation of microRNAs across the autism spectrum. Neurogenetics 2008, 9, 153–161. [Google Scholar] [CrossRef] [PubMed]
- Mundalil Vasu, M.; Anitha, A.; Thanseem, I.; Suzuki, K.; Yamada, K.; Takahashi, T.; Wakuda, T.; Iwata, K.; Tsujii, M.; Sugiyama, T.; et al. Serum microRNA profiles in children with autism. Molecular autism 2014, 5, 40. [Google Scholar] [CrossRef] [PubMed]
- Talebizadeh, Z.; Butler, M.G.; Theodoro, M.F. Feasibility and relevance of examining lymphoblastoid cell lines to study role of microRNAs in autism. Autism research : official journal of the International Society for Autism Research 2008, 1, 240–250. [Google Scholar] [CrossRef] [PubMed]
- Hou, Y.; Fu, L.; Li, J.; Li, J.; Zhao, Y.; Luan, Y.; Liu, A.; Liu, H.; Li, X.; Zhao, S.; et al. Transcriptome Analysis of Potential miRNA Involved in Adipogenic Differentiation of C2C12 Myoblasts. Lipids 2018, 53, 375–386. [Google Scholar] [CrossRef] [PubMed]
- Zhu, J.; Wang, F.L.; Wang, H.B.; Dong, N.; Zhu, X.M.; Wu, Y.; Wang, Y.T.; Yao, Y.M. TNF-alpha mRNA is negatively regulated by microRNA-181a-5p in maturation of dendritic cells induced by high mobility group box-1 protein. Sci Rep 2017, 7, 12239. [Google Scholar] [CrossRef] [PubMed]
- Khandelwal, A.; Sharma, U.; Barwal, T.S.; Seam, R.K.; Gupta, M.; Rana, M.K.; Vasquez, K.M.; Jain, A. Circulating miR-320a Acts as a Tumor Suppressor and Prognostic Factor in Non-small Cell Lung Cancer. Frontiers in oncology 2021, 11, 645475. [Google Scholar] [CrossRef] [PubMed]
- Sharma, A.; Mehan, S. Targeting PI3K-AKT/mTOR signaling in the prevention of autism. Neurochemistry international 2021, 147, 105067. [Google Scholar] [CrossRef] [PubMed]
Figure 4.
Enrichment analysis of the differentially expressed miRNAs by IPA software. The top 20 enriched GO functional processes of the target genes of differentially expressed mRNAs.
Figure 4.
Enrichment analysis of the differentially expressed miRNAs by IPA software. The top 20 enriched GO functional processes of the target genes of differentially expressed mRNAs.
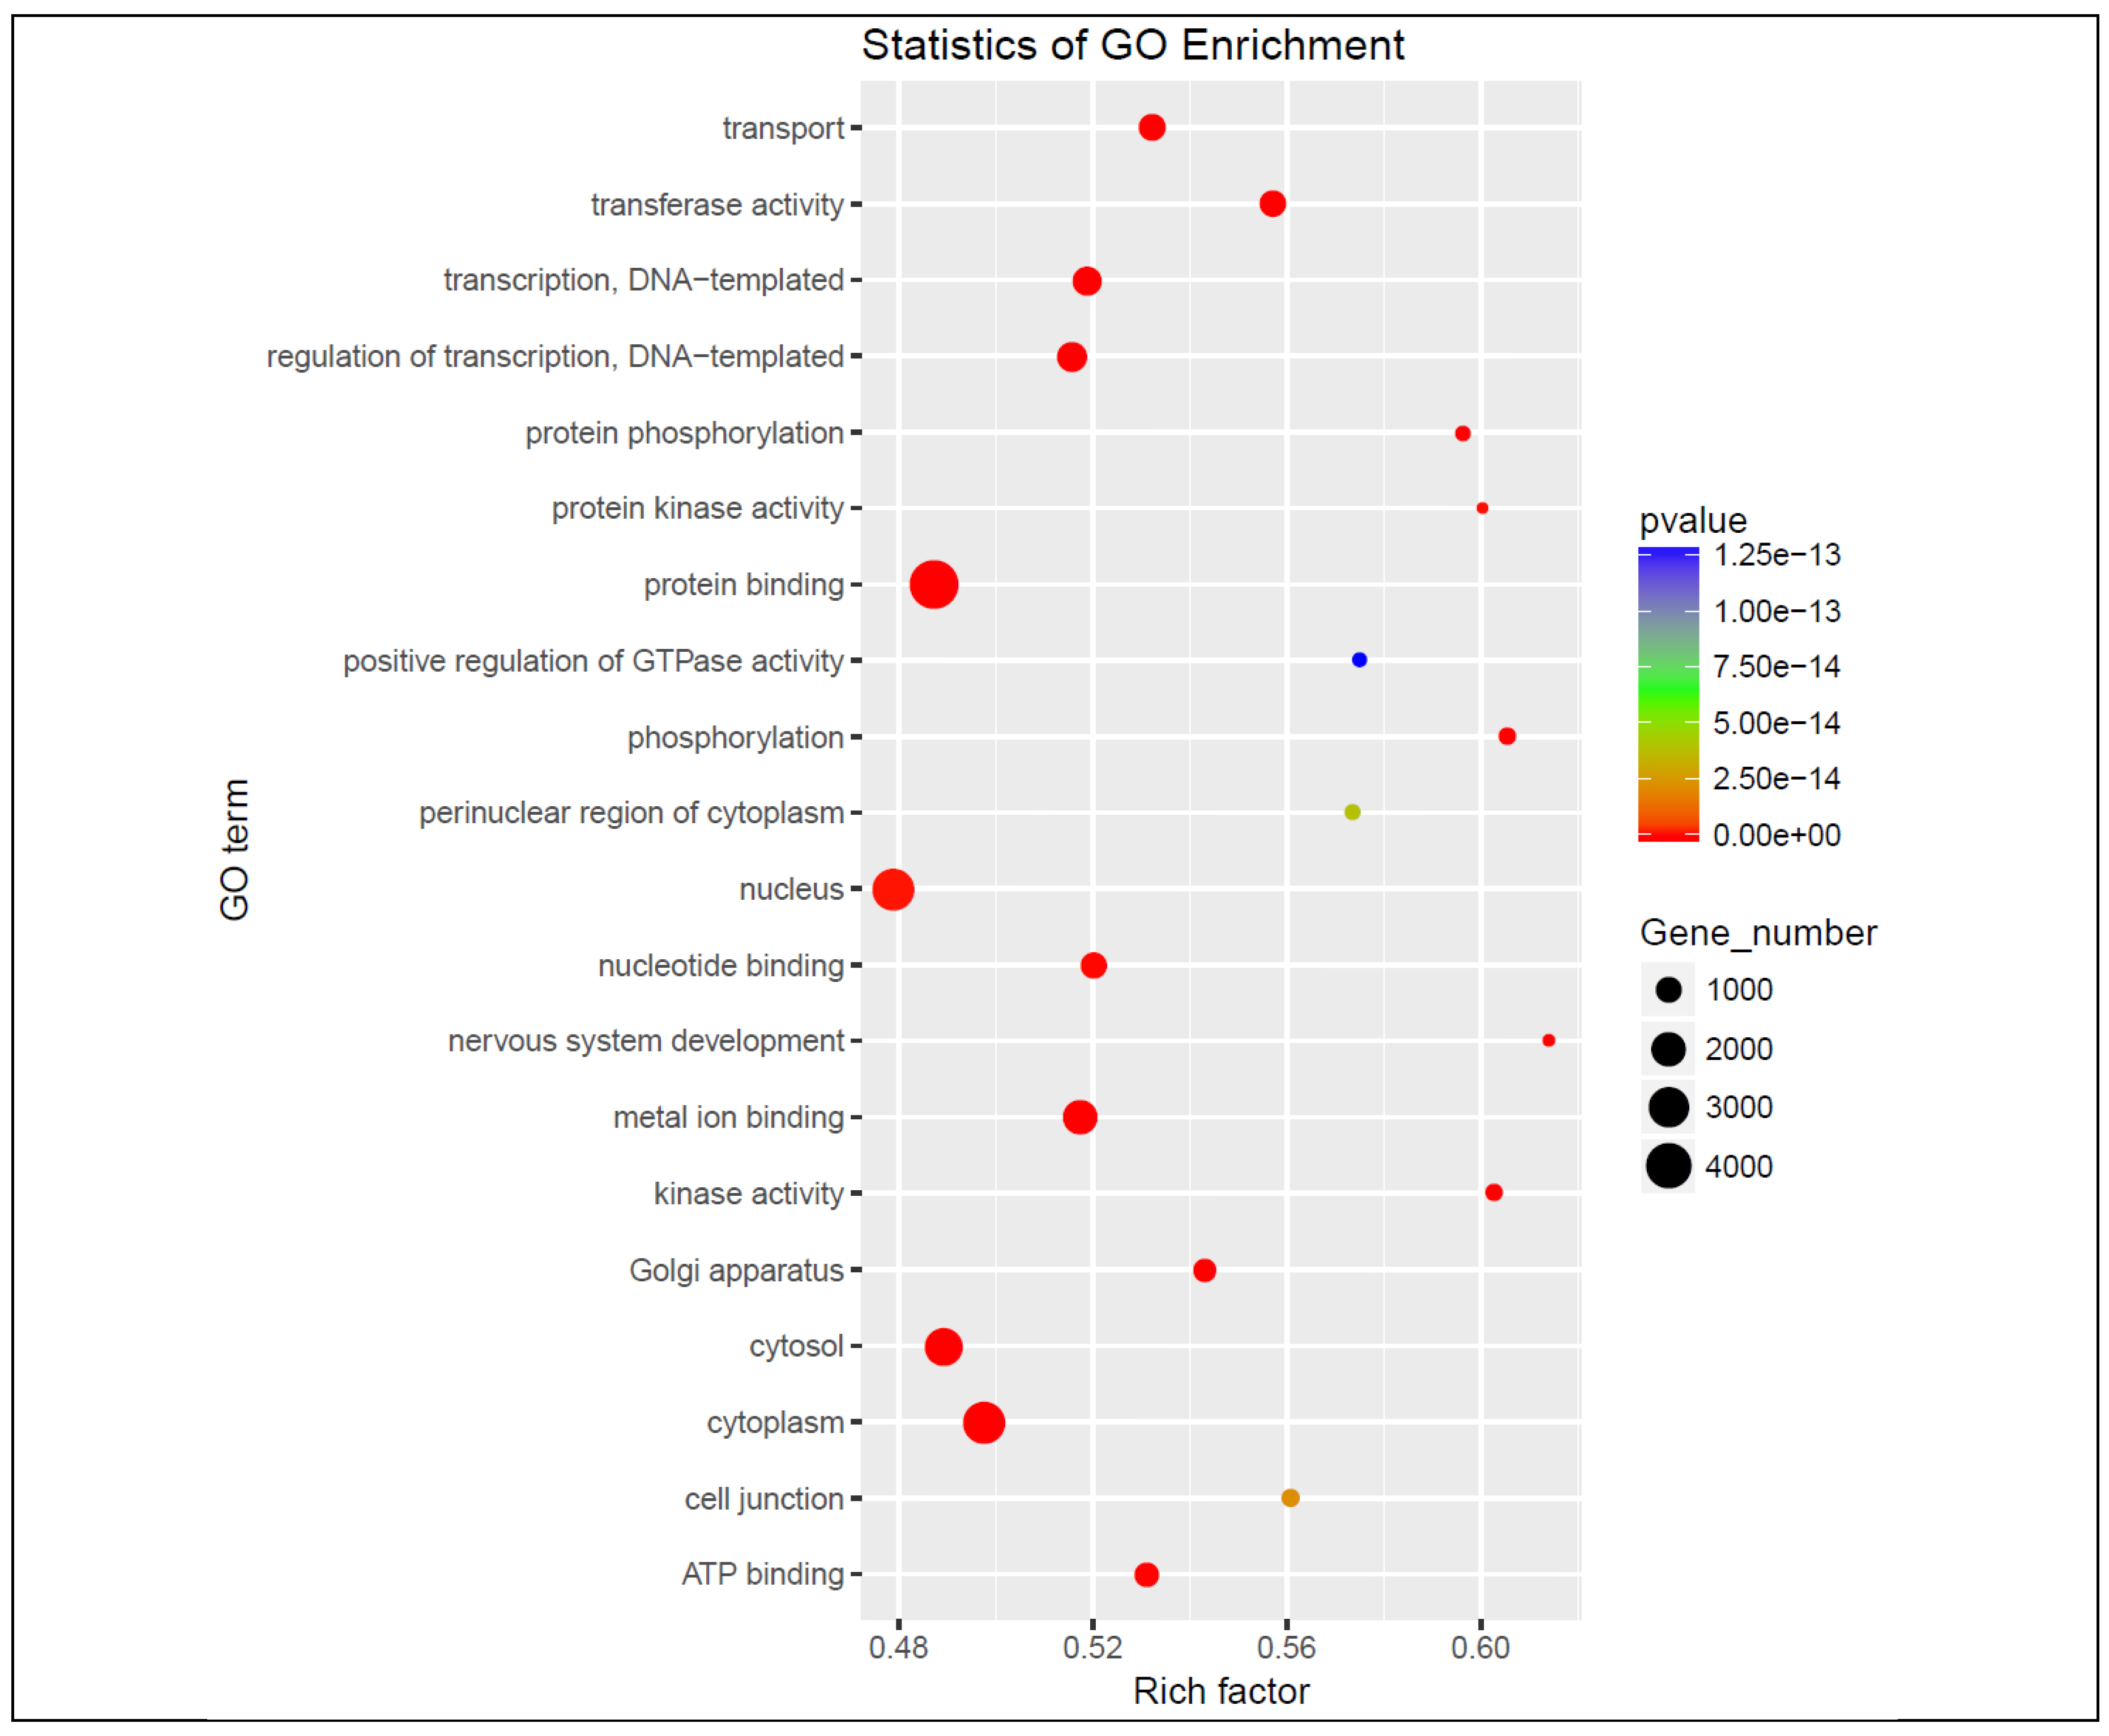
Figure 5.
Integrative pathway analysis demonstrated convergence on ECM-receptor interaction as the most broadly targeted pathway.
Figure 5.
Integrative pathway analysis demonstrated convergence on ECM-receptor interaction as the most broadly targeted pathway.
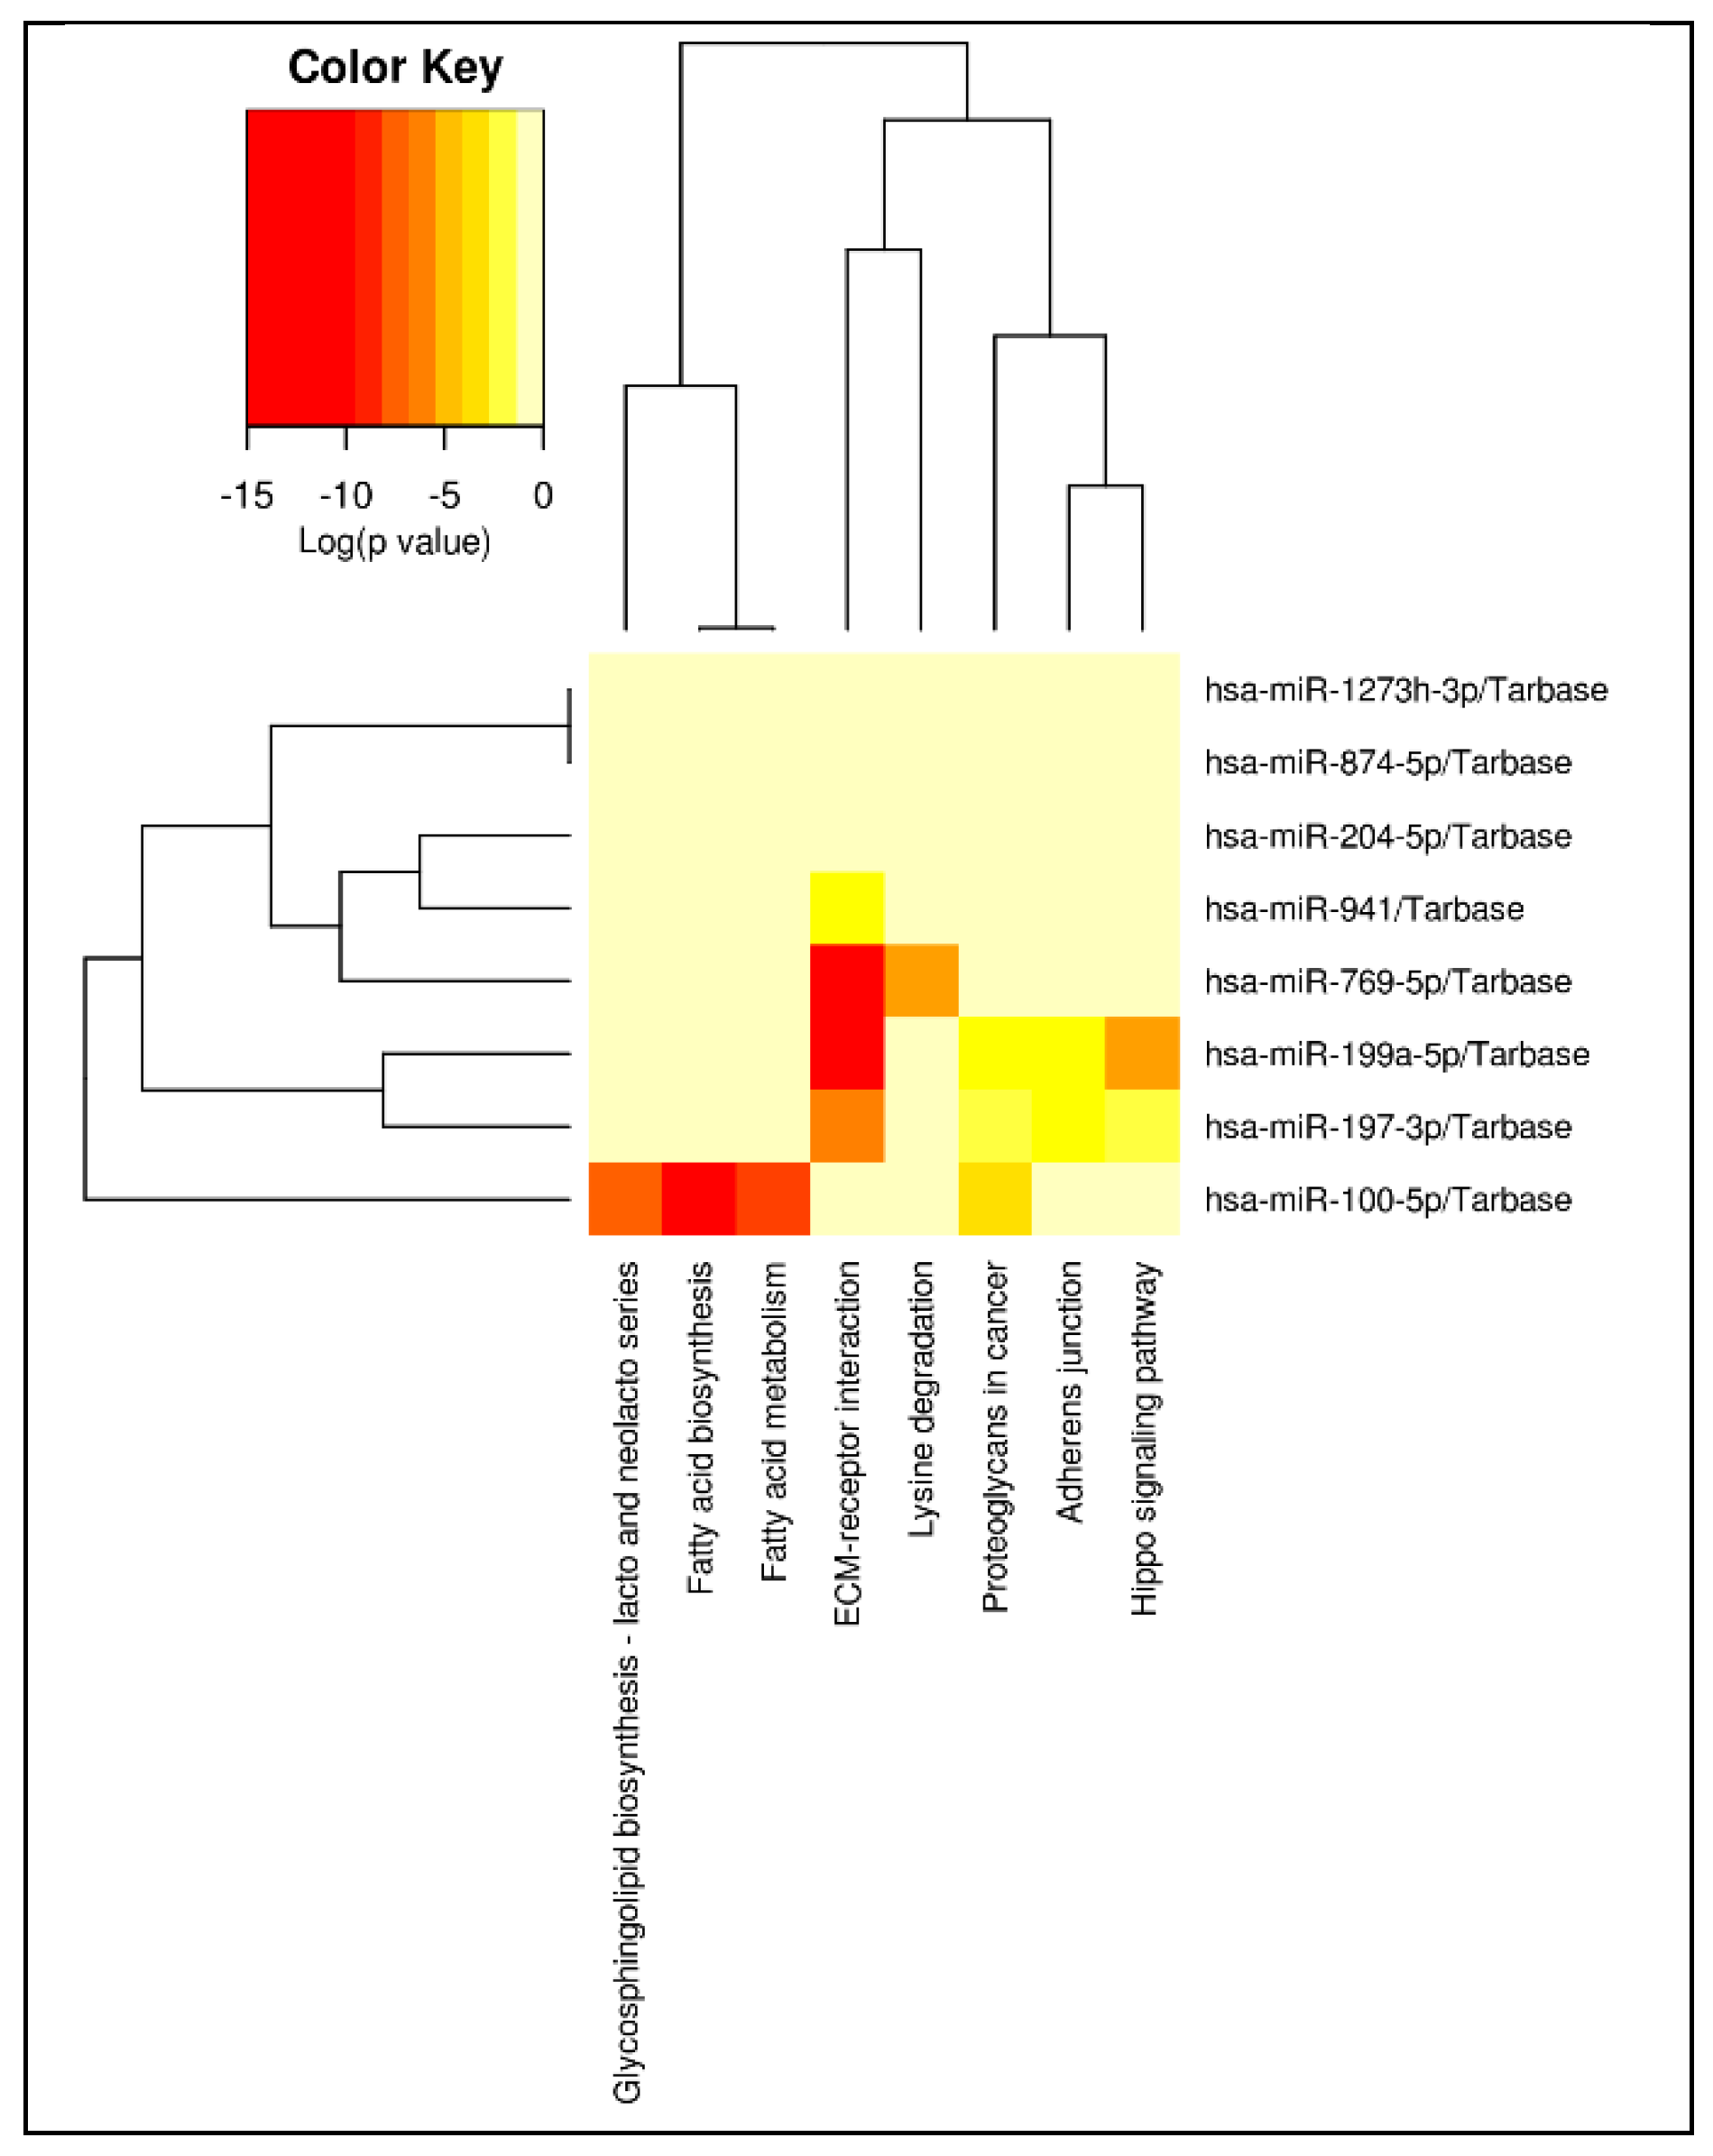
Table 1.
Lymphoblastoid Cell Lines (LCLs) used in this study. LCLs are from males with Autistic Disorder. Average age of each group is provided. There is no significant age difference between groups (p=0.31).
Table 1.
Lymphoblastoid Cell Lines (LCLs) used in this study. LCLs are from males with Autistic Disorder. Average age of each group is provided. There is no significant age difference between groups (p=0.31).
| Autistic Disorder (N) | Autistic Disorder (A) | ||
|---|---|---|---|
| ID | Age | ID | Age |
| 4363 | 4 | 3540 | 3 |
| 8022 | 5 | 8495 | 4 |
| 10054 | 6 | 3620 | 7 |
| 7439 | 7 | 8594 | 7 |
| 10618 | 7 | 3110 | 7 |
| 8367 | 7 | 9713 | 7 |
| 9650 | 7 | 14441 | 7 |
| 0775 | 8 | 2591 | 11 |
| 4757 | 10 | 16499 | 11 |
| 3497 | 10 | 2746 | 13 |
| 38988 | 12 | ||
| 2942 | 12 | ||
| 3563 | 12 | ||
| 1129 | 13 | ||
| 4349 | 17 | ||
| 9.1 (3.4) | 7.7 (3.0) | ||
Table 3.
GO processes related to differentially expressed mRNA genes.
| Gene | p-value | GO Functional Process |
|---|---|---|
| Upregulated Pathways in ASD LCL with Normal Mitochondrial Function | ||
| Biological Process | ||
| Hexamethylene bis acetamide-inducible protein 1 | 0.002 | Positive regulation of signal transduction by p53 class mediator |
| 0.01 | Negative regulation of cyclin-dependent protein serine/threonine kinase activity | |
| Molecular function | ||
| 0.01 | Snrna binding | |
| 0.01 | Cyclin-dependent protein serine/threonine kinase inhibitor activity | |
| Biological Process | ||
| Mitochondrial ribosomal protein l41 | 0.05 | Mitochondrial translational termination |
| 0.05 | Mitochondrial translational elongation | |
| 0.05 | Mitochondrial translational initiation | |
| Cellular component | ||
| 0.01 | Mitochondrial large ribosomal subunit | |
| Mixed Regulation | ||
| 0.03 | Biological Process | |
| Frequently rearranged in advanced t-cell lymphomas 2 (up) | Multicellular organismal development | |
| Adenosine deaminase 2 (down) | ||
| Molecular Function | ||
| Dexd-BOX HELICASE 21 (down) | 0.03 | Poly(A) RNA binding |
| Mitochondrial ribosomal protein l41 (up) | ||
| Ribonuclease P/MRP Subunit p25 (up) | ||
| Down Regulated in ASD LCL with Normal Mitochondrial Function | ||
| Biological Process | ||
| Adenosine deaminase 2 | 0.001 | adenosine catabolic process |
| 0.001 | hypoxanthine salvage | |
| 0.001 | inosine biosynthetic process | |
| Molecular Function | ||
| 0.001 | Adenosine receptor binding | |
| 0.01 | Deaminase activity | |
| 0.01 | Proteoglycan binding | |
| 0.01 | Adenosine deaminase activity | |
| Biological Process | ||
| Dexd-BOX HELICASE 21 | 0.02 | Response to exogenous dsrna |
| 0.03 | RNA secondary structure unwinding | |
| Molecular Function | ||
| 0.00 | 7SK snrna binding | |
| 0.01 | Snorna binding | |
| 0.02 | Rrna binding | |
| 0.03 | Double-stranded RNA binding | |
| 0.04 | ATP-dependent RNA helicase activity | |
| 0.05 | Helicase activity | |
| Biological Process | ||
| Factor xiii, a1 subunit | 0.01 | Peptide cross-linking |
| 0.05 | Platelet degranulation | |
| 0.05 | Wound healing | |
| Cellular component | ||
| 0.03 | Platelet alpha granule lumen | |
| Molecular Function | ||
| 0.01 | Protein-glutamine γ-glutamyltransferase activity | |
| Biological Process | ||
| Lysophospholipase I | 0.00 | Protein depalmitoylation |
| 0.00 | Negative regulation of Golgi to plasma membrane protein transport | |
| 0.01 | Nitric oxide metabolic process | |
| 0.01 | Regulation of nitric-oxide synthase activity | |
| 0.04 | Fatty acid metabolic process | |
| Molecular Function | ||
| 0.00 | Palmitoyl-(protein) hydrolase activity | |
| 0.01 | Lipase activity | |
| 0.01 | Lysophospholipase activity | |
Table 4.
Top differentially expressed miRNAs between AD-A and AD-N LCLs.
| Up Regulated in AD-N (LCLs from Children with Autism with Normal Mitochondrial Function) | |||||
|---|---|---|---|---|---|
| miRNA ID | log2(FC) | -log10(p) | mRNA | Predicted | mTOR |
| hsa-miR-1273h-3p | 0.95 | 2.60 | IFIT3, CHD3, FAM110A, HMGA1 | CAMKK2, SOD2, DNM1L MFF, HIF3A |
AKR3 |
| hsa-miR-197-3p | 0.42 | 2.38 | CHD3, FRAT2 | CAMK2A, PPARGC1A, DNM1L, PINK1, HIF3A, HIF1A, CREB1, AUTS2 | AKT2 AKT3 PRKAG1 |
| hsa-miR-206 | inf | 2.20 | CAMKK2, OPA1, AUTS2, FMR1 | ||
| oan-let-7e-5p | inf | 1.86 | OPA1 | ||
| hsa-miR-144-3p_R-1 | inf | 1.45 | |||
| hsa-miR-133a-3p | 8.27 | 1.62 | |||
| hsa-miR-1-3p | 8.02 | 2.10 | |||
| hsa-miR-126-3p | 6.01 | 1.95 | HIF1A, PPARGC1A, SIRT1, SOD2 | ||
| hsa-miR-199a-5p | 3.74 | 1.91 | F13A1 | CAMK2A, CAMKK2, HIF1A, SOD2, MFN2, DNM1L, AUTS2, FMR1, IL27, |
TSC1, RHEB AKT3, PIK3R3 |
| hsa-miR-204-5p | 3.38 | 1.65 | HEXIM1, FAM110A, HMGA1 | DNM1L, SIRT3, HIF1A CAMK2A |
AKT3 PIK3R3 |
| hsa-miR-874-5p | 3.15 | 1.43 | PNMA1 | CAMK2B, MFN2, AKT1S1, DNM1L, HIF1A, CREB1, PPARGC1A | TSC1 TSC2 AKT2, |
| hsa-miR-100-5p | 3.04 | 1.55 | IFIT3 | CREB1 |
|
| hsa-miR-941 | 1.34 | 1.54 | DDX21, CHD3 | SOD2, PPARGC1A, HIF1A, | TSC1 AKT2,3 PIK3R3 |
| hsa-miR-769-5p | 1.22 | 1.44 | CHD3 | HIF1A, AUTS2 | AKT3 |
| hsa-miR-199b-3p | 2.83 | 1.32 | |||
| bta-mir-1246-p3_1ss2CT | 2.41 | 1.35 | |||
| hsa-miR-3687 | 1.98 | 1.94 | |||
| hsa-miR-1254 | 1.31 | 1.33 | |||
| Down Regulated in AD-N (LCLs from Children with Autism with Normal Mitochondrial Function) | |||||
| miRNA ID | log2(FC) | -log10(p) | mRNA | Predicted | |
| PC-5p-15865_73 | -1.91 | 1.47 | |||
Disclaimer/Publisher’s Note: The statements, opinions and data contained in all publications are solely those of the individual author(s) and contributor(s) and not of MDPI and/or the editor(s). MDPI and/or the editor(s) disclaim responsibility for any injury to people or property resulting from any ideas, methods, instructions or products referred to in the content. |
© 2025 by the authors. Licensee MDPI, Basel, Switzerland. This article is an open access article distributed under the terms and conditions of the Creative Commons Attribution (CC BY) license (http://creativecommons.org/licenses/by/4.0/).
Copyright: This open access article is published under a Creative Commons CC BY 4.0 license, which permit the free download, distribution, and reuse, provided that the author and preprint are cited in any reuse.


