Submitted:
22 July 2025
Posted:
23 July 2025
You are already at the latest version
Abstract
Seed size and number are two important components of plant reproductive traits. Previous theoretical studies have suggested that resource limitations lead to a strong trade-off between seed size and seed number. However, empirical evidence from natural communities remains scarce. In this study, the relationship between seed size and seed number was tested at the community level and in three functional groups—graminoids, forbs and legumes—in a natural alpine steppe community in the Tianshan Mountains. The role of limiting resources in reproduction and in determining trade-off patterns was also examined by treating the reproductive biomass and allocation of each species as a resource pool for producing seeds. Our results showed a significant negative relationship between seed size and seed number at the community level, which indicated that a trade-off between seed size and number existed and that the species that produced large seeds produced fewer seeds and vice versa. This trade-off was detected for the graminoid group but not for the forb or legume group. Moreover, the graminoid group presented lower reproductive biomass and allocation than the forb and legume groups did, indicating that the graminoid species were more strictly limited by reproductive resources. Our study provides evidence of a seed size‒number trade-off in a natural alpine steppe community, and the important role of reproductive resources in determining the trade-off.
Keywords:
seed size
; seed number
; trade-off
; functional group
; alpine steppe
1. Introduction
In the long process of natural selection, resource allocation trade-offs between different functions (e.g., competitive ability vs. dispersal ability, vegetative growth vs. reproduction) during the plant life cycle are closely related to life history strategies [1,2,3,4]. The issue of plant life history strategies is a topic of current interest in model studies and has been widely investigated in empirical research [5,6,7,8]. Many famous theories have been proposed in previous studies, including the r–K theory [9,10] and the leaf–height–seed (LHS) scheme [11]. In these theories, seed characteristics, as key functional traits of plants, are closely associated with reproductive strategies [3,12,13] and play crucial roles in determining plant fitness.
Previous studies on reproductive strategies have assessed the balancing mechanisms associated with seed size and seed number [14,15,16,17]. This is because seed size is closely associated with seed dispersal, germination, seedling establishment, and the distribution patterns of plant populations [18,19,20]. Many studies have shown that larger seeds typically have a greater chance of germinating and surviving to maturity than smaller seeds do [21,22]. This is because larger seeds contain more nutrients, which provide the seedling with the energy it needs to grow and develop [23]. However, producing larger seeds is more costly for the plant, as it requires more resources to produce a single large seed than multiple small seeds [24]. Therefore, plants must carefully balance the benefits of producing larger seeds with the cost of doing so [24,25]. In contrast, plants that produce many small seeds have a greater chance of producing at least some offspring that will survive and reproduce [26,27]. This is because producing a large number of seeds increases the chance that at least some of them will find suitable conditions for germination and growth [28]. However, producing a large number of seeds is also costly for the plant, as it requires a significant amount of resources to produce and maintain those small seeds [29,30]. In summary, plants must balance the trade-off between seed size and seed number to maximize their reproductive success and fitness because the resources they acquire from the environment are limited.
The relationships between seed size and number for plants depends on several factors, including environmental conditions [31,32], resource competition [8,33] and phenotypic plasticity [34]. Among these factors, the variation in environmental conditions is the most important. For example, plants growing in resource-poor environments may produce abundant small seeds to increase the chances of offspring survival [13], whereas plants growing in resource-rich environments may produce a few large seeds to ensure the survival of high-quality offspring [35]. Additionally, the seed traits variation depended on different functional groups such as graminoid, forb and legume. In general, legume species produced a few large seeds [36], but forb species tended to produce many small seeds in alpine grassland [37]. The graminoid species enable to produce several different types of seeds from small and spherical to large and non-spherical seeds [38]. Therefore, both abiotic and biotic factors affect the trade-off patterns between seed size and seed number, but the underlying mechanisms are still not clear [39].
Research on seed size‒seed number trade-offs has a long history, and many studies have indicated that this trade-off plays a critical role in promoting successful reproduction and population maintenance in plant species [40,41]. To date, most previous studies have concentrated on theoretical theories and specific models [20,22,42], but empirical evidence is still rare. Moreover, previous empirical studies either focused on specific environments or compared seed size and number in sparse species communities [5,26,43]. Evidence from multispecies natural communities and different plant functional groups is still scarce [44]. In addition, in general, most researchers have shown that resource limitation plays an important role in determining seed size and number trade-off in theory [17,45], but evidence from an experimental approach to this is still lacking.
In this study, we aimed to examine whether a trade-off between seed size and seed number exists in a multispecies natural alpine steppe community and in functional groups of forbs, graminoids and legumes. The role of limiting resources in determining trade-off patterns was also tested by treating reproductive biomass and allocation as a resource pool that a plant can distributed to reproductive part [46,47,48]. Specifically, three closely related questions were asked:
- Does a trade-off between seed size and number exist in a multispecies natural alpine steppe community?
- Are the trade-off patterns different in different functional groups?
- What is the role of limiting resources in determining seed size and number trade-offs?
2. Results
Both seed size per grain and seed number per ramet varied considerably among the 11 common species at our study site. Stipa purpurea (2.64 mg in 2018, 2.72 mg in 2019) and Astragalus multicaulis (1.13 mg in 2018, 3.74 mg in 2019) had greater grain weights than the other species did. The two grass species Festuca ovina (1772 in 2018, 858 in 2019) and Koeleria cristata (539 in 2018, 2301 in 2019) produced more seeds per ramet than the other species did (Table 1, Figure 1). Although the seed size and number of seeds of the species changed between 2018 and 2019, the ranks of the species were similar in those two years (Figure 1).
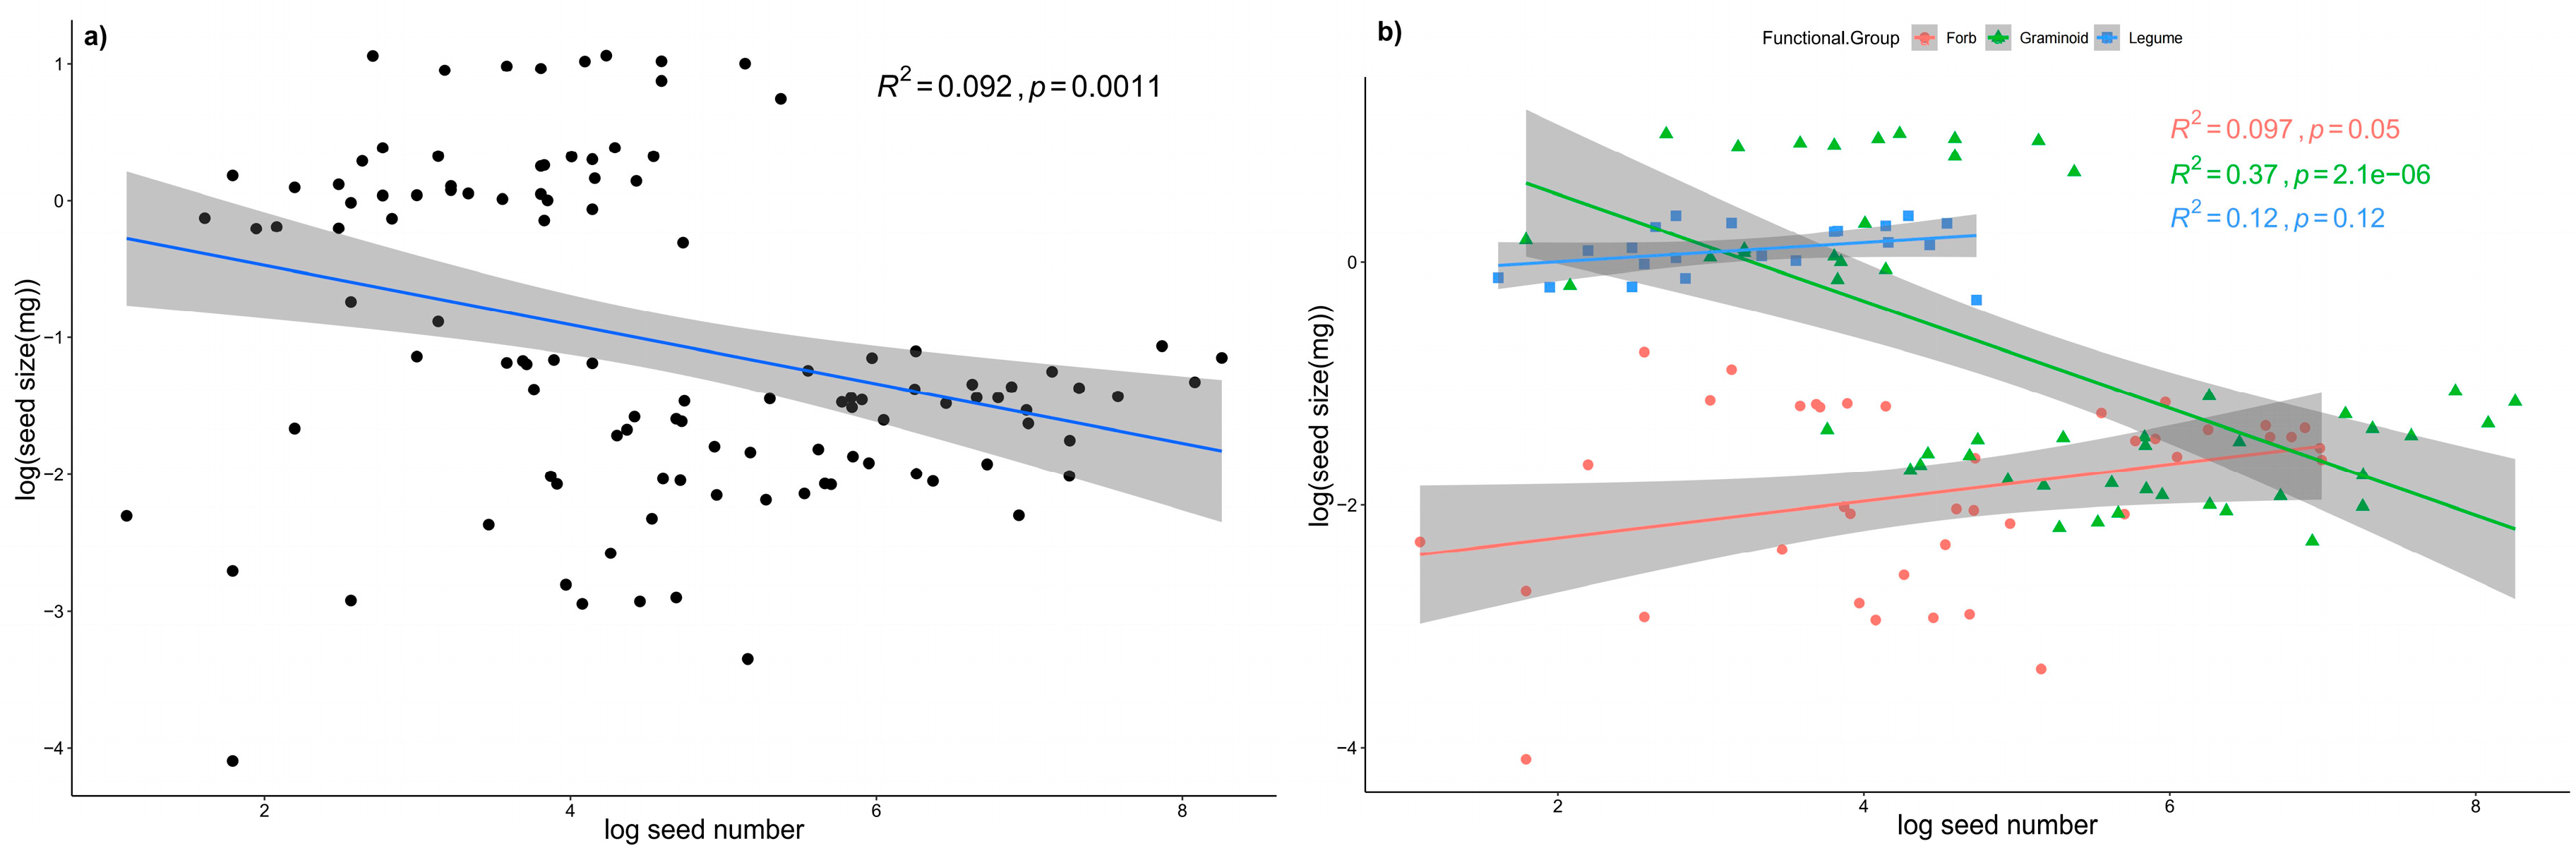
A significant negative linear relationship existed between seed size and seed number at the community level in 2018 and 2019, which indicated a trade-off between seed number and seed size in the alpine steppe community (Figure 2 a, c). In 2018, the negative relationship between seed number and seed size was not very strong (Figure 2a), with an R2 value of 0.092, although the relationship was statistically significant (p = 0.0011). In 2019, the relationship between seed number and seed size was strong (Figure 2c), with a high R2 and low p value (R2 = 0.47, p < 0.001). At the functional level, for graminoids, there were significant negative relationships between seed number and seed size in both 2018 and 2019 (Figure 2 b, d); in contrast, for forbs and legumes, the relationships between seed number and seed size were not significant (Figure 2 b, d). In line with these results, significant negative relationships also appeared between the mean value of seed size and number (Figure A2). After the phylogenetically independent contrasts (PICs), the negative linear relationships were still significant in 2018 (R2 = 0.34, p < 0.05) and marginally significant in 2019 (R2 = 0.45, p = 0.06), which indicated that the phylogenetic effect did not change the trade-off relationships (Table A1). After the two years data pooled, the relationships between seed size and number were consistent with each year (Figure A4).
The ANOVA and HSD test results showed that the reproductive biomass and reproductive allocation of graminoids were significantly lower than those of forbs and legumes in both 2018 and 2019 (Figure 3). In 2018, the mean reproductive biomasses of graminoids, forbs, and legumes were 0.097 g, 0.165 g and 0.178 g, respectively. In 2019, legumes had the highest reproductive biomass (0.306 g), the reproductive biomass of forbs was 0.259 g, and grass had the lowest reproductive biomass (0.164 g).
The seed traits varied among the three functional groups (Figure 4), which suggested that the adaptive strategies of the three functional groups may differ. The legume species had the greatest seed size and highest seed nitrogen content but the lowest seed number (Figure 4 a, b, g), whereas the forb species had the lowest seed size, seed nitrogen content and phosphorus content (Figure 4 b, g, h); the seed number and length of graminoids were higher than those in legumes and forbs, while the seed chemical traits were between the two groups (Figure 4 a, f, g, h). The PCA results indicated that the seed traits between forbs and legumes were distinct, but graminoids were not separated from forbs and legumes (Figure A3).
3. Discussion
In a two-year field experiment, our results revealed that a trade-off between seed size and number existed in a multispecies alpine steppe community (Figure 2 a, c). However, the relationships between seed size and number were inconsistent across the different functional groups, as a trade-off existed in the graminoid group but not in the forb or legume groups (Figure 2 b, d). Thus, the seed size‒number trade-off at the community level was determined primarily by graminoid species may cause by their low reproductive biomass and allocation, which indicated that resource limitations were present for graminoid species but not for forb or legume species (Figure 3). In this study, we tested the seed size‒number trade-off in multispecies communities and different functional groups and documented that resource limitations play an important role in determining trade-off patterns. Our results were robust across different years and after the effects of phylogenetic relationships among species were eliminated.
The trade-off between seed size and number varies across different plant species, and ecologists have conducted extensive theoretical research on this relationship [49,50]. For example, life history strategy theory suggests that different species evolve different life history strategies (i.e., trade-offs between survival, growth, and reproduction) to maximize survival and reproductive success, including the r-strategy and K-strategy [9,10]. Other studies have explored the effects of resource availability decisions on plants in different growing environments, which is called resource availability theory [45,51,52]. Ben-Hur and Kadmon (2015) explained the coexistence of competing species in terms of a trade-off between competitive ability and colonization ability on the basis of competition‒colonization trade-off models [53]. Germain et al discovered through the cultivation of populations of each species in both humid and arid environments that there is a strong trade-off between seed size and number among species but no consistent trade-off within species, highlighting the importance of the maternal environment in terms of ecological dynamics, particularly in the context of multispecies coexistence [31,54]. Despite the plethora of theoretical studies and a handful of experimental evidence on seed size‒number trade-offs, research has been based on either a particular model or a controlled experiment, and studies of natural communities with multiple species are still lacking. In this study, we provide definitive evidence for this theory in a natural alpine steppe community involving multiple species.
Resource limitations played a crucial role in determining the trade-off between seed size and number at our study site. This refers to the fact that plants have finite resources available to allocate towards seed production, and they need to make strategic decisions on how to distribute these resources effectively based on the environment [22,55,56]. In this study, we used reproductive biomass and allocation to indicate the resource pool that is available for allocation to seeds in each species. Our results revealed that the reproductive biomass and allocation of graminoids were significantly lower than those of forbs and legumes in 2018 and 2019, which suggests that the reproductive resource pool of graminoids was lower than that of forbs and that legume and graminoid species experienced stricter resource limitations in terms of reproduction. A probable explanation is that the graminoid species undergo both sexual and clonal reproduction at our study site, but the forb and legume species only carry out sexual reproduction (Table 1). Unlike forb and legume species, graminoid species do not need to allocate vast resources to their reproduction because they are also able to produce offspring through tillering. As previous studies have shown, the two reproductive modes, i.e., sexual and asexual, affect resource allocation patterns and the seed size‒number trade‒off in perennial plants [57]. Species with asexual propagation can establish local populations via rapid, short-distance dispersal and forage in high-quality environments by escaping from poor sites and proliferating at richer sites [58,59]; thus, sexual reproduction enhances the competitive ability of these species, especially under nutrient enrichment conditions. In contrast, sexually reproducing plants are able to disperse seeds long distances, easily colonize new environments and tolerate more severe habitats [60,61]. At our study site, the soil type is chestnut soil, which contains a high percentage of humus (19.8%) and is a fertile soil. The precipitation was 409 mm and 469 mm in 2018 and 2019, respectively, which was greater than the mean annual precipitation (265.7 mm) in recent decades. Thus, graminoid species may not need to allocate many resources to sexual reproduction due to the current environmental situation. Previous studies have suggested that the constraining resources in alpine plant communities may include low temperatures and precipitation [54,62,63,64]. Specifically, previous studies have documented that water (the mean annual precipitation is only 265.7 mm) and nitrogen limited the above-ground biomass in our study site [65]. In the future, more studies are needed to distinguish the important roles of these resources in determining the patterns of seed size‒number trade-offs.
The seed size–number trade-off was detected in graminoids but not in forbs or legumes (Figure 2). As the resource allocation theory predicts, different environments will select for different optimal patterns of resource allocation to reproductive versus vegetative functions [30,66] and different trade-offs in optimal seed size [45,67] with fecundity [68]. Our experimental results strongly support this idea (Figure 2). Moreover, the strategies used by plants to adapt to the alpine environment differed among the three functional groups. At our study site, the legume species had the lowest seed number; in contrast, the legume species had the greatest seed size and largest seed volume (Figure 3). The seed nitrogen content of legumes is significantly greater than that of forbs and graminoids (Figure 3), which may be caused by the nitrogen-fixing ability of legume species and the high level of nitrogen in their tissues [69,70]. Thus, legume species tend to exhibit competitive strategies because high seed size and large seed volume are often closely related to a high survival rate of seedlings [36], and the high seed nitrogen content also indicates that their seeds contain more nutrients for seedling survival and growth. In contrast, forb species produced small, round seeds with the lowest seed size and seed length, while the seed carbon content in the forb group was slightly greater than that in the graminoid and legume groups (Figure 3). These characteristics indicate that forb species prioritize tolerance strategies because small and high-carbon-content seeds might be buried more deeply and persist longer in the soil than large and nonspherical seeds [37]. Moreover, the graminoid group, which had intermediate seed sizes and nutrient contents, selected a compromise strategy between competition and tolerance. In fact, the five graminoid species produced two types of seeds: Stipa purpurea and Agropyron cristatum produced large, nonspherical seeds, whereas Poa crymophila, Koeleria cristata and Festuca ovina produced small, spherical seeds. The compromise strategy was well adapted to alpine conditions; thus, more graminoid species coexisted at our study site than forb and legume species did.
In this study, we demonstrated the existence of trade-offs between seed size and number in a multispecies alpine steppe community, particularly in graminoids. The seed size‒number trade-off was determined by the reproductive resources and mode of the plant. In addition, species in different functional groups may adopt different strategies to adapt to alpine habitats during the seed stage. In the future, more comprehensive studies are needed to test the seed size‒number trade-off pattern in other ecosystems and explore the underlying mechanisms in natural communities. Additionally, the role of the seed size‒number trade-off in affecting community composition should be investigated because both seed size and seed number are closely related to species fitness in the plant community.
4. Materials and Methods
4.1. Study Site
This study was conducted in Bayanbulak grassland, near the Bayanbulak Grassland Ecosystem Research Station (42°52’N, 83°42’E), which is located in the southern Tianshan Mountains within Hejing County, Xinjiang Uygur Autonomous Region, China. This region is one of the largest stock-breeding bases in Xinjiang and is recognized as a biodiversity hotspot in Central Asia. At our study site, the altitude is approximately 2470 m. On the basis of meteorological data from recent decades (2014-2023), the mean annual precipitation is 265.7 mm (mostly concentrated from May to August), the mean annual temperature is -4.8 °C, the amount of evaporation is 1022.9-1247.5 mm, the total annual sunshine duration is 2466-2616 h, and the annual snow cover duration is 150-180 days. There is no absolute frost-free period, and the climate is typically alpine. The vegetation is alpine steppe, and the dominant plant species are Stipa purpurea, Festuca ovina, Agropyron cristatum (Poaceae) and Astragalus polycladus (Leguminosae). The average aboveground dry biomass is 71–382 g/m2, and the richness is 9–13 species/m2.
4.2. Experimental Design and Seed Trait Measurements
In 2018 and 2019, from the middle of August to the end of September, 11 common species were sampled from an enclosed and flat alpine steppe community (approximately 5 hectares). This area has been fenced since 2018, and livestock such as sheep and horses have been forbidden throughout the year, but wild animals, including marmots (Marmota bobac) and zokors (Myospalax spp.), have been allowed inside. These 11 species accounted for more than 97% of the above-ground biomass and 92% of the cover at our study site. For each species, when the seeds ripened naturally, 12–15 healthy plant individuals were randomly sampled, then clipped and placed in an envelope, each individual was at least 10 meters apart in this process.
In the laboratory, after the seeds were air-dried, we removed the reproductive part of each individual and then weighed them on an electronic balance to 0.0001 g to represent reproductive biomass. The reproductive allocation was defined as the ratio of reproductive biomass to ramet biomass of each species. Then, the number of seeds was counted, and the mass of the seeds in each reproductive part was weighed. In our study, we defined seed size as the seed mass per capita, that is, the seed mass divided by the number of seeds for each individual. We then measured the other six seed traits, which included three morphological traits (seed length, width and height) and three chemical traits (seed carbon, nitrogen and phosphorus contents), of each species. To measure morphological traits, 10 randomly selected seeds from each species were scanned, and the image was analysed with Epson Expression 10000XL and imaging software (Win SEEDLETM, Canada). Next, about 2 g seeds were crushed with a ball mill and used to measure the carbon, nitrogen and phosphorus contents. The carbon content was measured via the potassium dichromate external heating method. The nitrogen and phosphorus concentrations were analysed via a continuous flow injection analyser (SKALAR, Breda, the Netherlands).
4.3. Statistical Analysis
All 11 species in our study were divided into three functional groups: forb, graminoid and legume (Table 1). First, the seed number and size data were log-transformed prior to analysis. Next, we described the distribution of seed size and number of seeds per ramet for different plant species. Next, we used simple linear regression to examine the relationship between seed size and seed number at the community level and among the three functional groups for each year (2018 and 2019) and two years data pooled, respectively [44]. Then, the means of seed size and seed number for each species were calculated, and simple linear regression was used to detect the relationship between them; in this way, we eliminated the random effects of different species. A phylogenetically independent contrasts (PICs) analysis was subsequently performed to test the potential effects of the phylogenetic relationships among species on the correlations between seed size and seed number [71]. To perform this analysis, a phylogenetic tree that included the 11 species was constructed (Figure S1). We downloaded 11 ITS sequences representing each species from NCBI. All sequences were aligned using MEGA 5, and a maximum likelihood (ML) tree was constructed on the basis of the aligned ITS sequence variations using MEGA version 5.0, with default parameters [72].
Finally, the reproductive allocation of each species was calculated as the reproductive biomass divided by the individual biomass, and the reproductive biomass and reproductive allocation of the three functional groups were subsequently analysed via ANOVA and the HSD test. To detect the reproductive strategies of the three functional groups, eight seed traits (number, size, length, width, height, carbon content, nitrogen content and phosphorus content) were subjected to principal components analysis (PCA).
All analyses were carried out in R version 4.2.2 (R Development Core Team, 2019). The PICs analysis was conducted via the “ape” and “ade4” packages, the HSD test was performed via the “agricolae” package, and the data were cleaned and plotted via the “tidyverse” and “ggplot2” packages, respectively.
Author Contributions
Conceptualization: XZ, ZR. Methodology: XZ, JL, RD. Formal analysis: XZ, ZR, HB. Data curation: XZ, RD, HB. Writing-original draft: XZ. Writing-review and editing: JL. Visualization: JL.
Funding
The study was supported by Natural Science Foundation of Xinjiang Uygur Autonomous Region (2022D01C676, 2024D01C33) and National Natural Science Foundation of China (Grant No. 32171518).
Data Availability Statement
All the required data are uploaded as supplementary material.
Acknowledgments
We would like to thank the staff of the Research Station of Bayanbulak Grass land Ecosystems for providing invaluable field assistance.
Conflicts of Interest
The authors declare that they have no conflict of interest.
Abbreviations
The following abbreviations are used in this manuscript:
| PICs | phylogenetically independent contrasts |
| PCA | principal components analysis |
Appendix A

Table A1.
The results of linear regression and linear regression based on PICs (phylogenet ically independent contrasts) between mean value of species’ seed size and seed number in community.
Table A1.
The results of linear regression and linear regression based on PICs (phylogenet ically independent contrasts) between mean value of species’ seed size and seed number in community.
| year | linear regression | linear regression based on PICs | ||||
| slope | R2 | p | slope | R2 | p | |
| 2018 | -0.88 | 0.47 | 0.02 | -0.67 | 0.34 | 0.04 |
| 2019 | -0.74 | 0.60 | 0.02 | -0.64 | 0.45 | 0.06 |
Table A2.
The raw data of eight seed traits for article analysis. (C: seed carbon content, N: seed nitrogen content, P: seed phosphorus content).
Table A2.
The raw data of eight seed traits for article analysis. (C: seed carbon content, N: seed nitrogen content, P: seed phosphorus content).
| Species | seed number | seed size (mg) |
length (mm) |
width (mm) |
height (mm) |
C (%) |
N (%) |
P (%) |
| Oxytropis_glabra | 22.63 | 1.13 | 1.99 | 1.56 | 0.77 | 54.55 | 6.45 | 0.50 |
| Astragalus_alpinus | 54.1 | 1.13 | 1.829 | 1.49 | 0.66 | 46.53 | 6.86 | 0.67 |
| Stipa_purpurea | 22 | 2.64 | 5.459 | 1.08 | 1.02 | 54.87 | 2.78 | 0.42 |
| Poa_crymophila | 272.64 | 0.2 | 1.16 | 0.69 | 0.22 | 52.09 | 2.70 | 0.47 |
| Festuca_ovina | 1772 | 0.28 | 2.92 | 0.72 | 0.38 | 53.00 | 3.96 | 0.50 |
| Koeleria_cristata | 538.55 | 0.13 | 3.40 | 0.78 | 0.06 | 47.44 | 4.10 | 0.99 |
| Agropyron_cristatum | 34 | 1.05 | 1.41 | 0.59 | 0.54 | 60.19 | 5.79 | 0.81 |
| Potentilla_bifurca | 35.63 | 0.34 | 1.44 | 1.15 | 0.92 | 54.68 | 1.42 | 0.34 |
| Leontopodium_ leontopodioides |
308 | 0.05 | 1.31 | 0.56 | 0.33 | 61.88 | 6.60 | 0.93 |
| Potentilla_multifida | 91.09 | 0.13 | 1.61 | 1.14 | 0.76 | 54.74 | 2.57 | 0.39 |
| Potentilla_fragarioides | 653.9 | 0.24 | 1.32 | 0.94 | 0.60 | 55.74 | 5.26 | 0.52 |
Table A3.
The raw data of reproductive biomass, seed number and seed mass for article analysis.
| Species | Reproductive Biomass (g) |
Seed number |
Seed Size (mg) |
Functional Group |
| Oxytrois_glabra | 0.1307 | 23 | 1.382609 | Legum |
| Oxytrois_glabra | 0.3706 | 63 | 1.350794 | Legum |
| Oxytrois_glabra | 0.0564 | 12 | 0.816667 | Legum |
| Oxytrois_glabra | 0.1233 | 16 | 1.0375 | Legum |
| Oxytrois_glabra | 0.1128 | 13 | 0.984615 | Legum |
| Oxytrois_glabra | 0.0799 | 16 | 1.46875 | Legum |
| Oxytrois_glabra | 0.0718 | 9 | 1.1 | Legum |
| Oxytrois_glabra | 0.0425 | 12 | 1.125 | Legum |
| Oxytrois_glabra | 0.0565 | 5 | 0.88 | Legum |
| Oxytrois_glabra | 0.1422 | 7 | 0.814286 | Legum |
| Oxytrois_glabra | 0.7849 | 73 | 1.469863 | Legum |
| Astragalus_multicaulis | 0.0382 | 28 | 1.053571 | Legum |
| Astragalus_multicaulis | 0.0767 | 14 | 1.335714 | Legum |
| Astragalus_multicaulis | 0.5019 | 94 | 1.380851 | Legum |
| Astragalus_multicaulis | 0.1016 | 35 | 1.011429 | Legum |
| Astragalus_multicaulis | 0.215 | 45 | 1.286667 | Legum |
| Astragalus_multicaulis | 0.1508 | 46 | 1.295652 | Legum |
| Astragalus_multicaulis | 0.079 | 17 | 0.876471 | Legum |
| Astragalus_multicaulis | 0.1719 | 64 | 1.176563 | Legum |
| Astragalus_multicaulis | 0.235 | 114 | 0.734211 | Legum |
| Astragalus_multicaulis | 0.215 | 84 | 1.153571 | Legum |
| Potentilla_multifida | 0.0233 | 93 | 0.097849 | Forb |
| Potentilla_multifida | 0.0186 | 32 | 0.09375 | Forb |
| Potentilla_multifida | 0.0192 | 50 | 0.126 | Forb |
| Potentilla_multifida | 0.0465 | 112 | 0.129464 | Forb |
| Potentilla_multifida | 0.0124 | 9 | 0.188889 | Forb |
| Potentilla_multifida | 0.0329 | 142 | 0.116197 | Forb |
| Potentilla_multifida | 0.0213 | 48 | 0.133333 | Forb |
| Potentilla_multifida | 0.0748 | 300 | 0.125667 | Forb |
| Potentilla_multifida | 0.039 | 113 | 0.199115 | Forb |
| Potentilla_multifida | 0.0115 | 100 | 0.131 | Forb |
| Potentilla_multifida | 0.014 | 3 | 0.1 | Forb |
| Poa_crymophila | 0.0397 | 74 | 0.17973 | Graminoid |
| Poa_crymophila | 0.0754 | 115 | 0.231304 | Graminoid |
| Poa_crymophila | 0.2717 | 1428 | 0.173109 | Graminoid |
| Poa_crymophila | 0.0673 | 177 | 0.158757 | Graminoid |
| Poa_crymophila | 0.1137 | 346 | 0.154046 | Graminoid |
| Poa_crymophila | 0.0858 | 201 | 0.235323 | Graminoid |
| Poa_crymophila | 0.0349 | 83 | 0.206024 | Graminoid |
| Poa_crymophila | 0.0293 | 79 | 0.187342 | Graminoid |
| Poa_crymophila | 0.039 | 109 | 0.202752 | Graminoid |
| Poa_crymophila | 0.028 | 43 | 0.251163 | Graminoid |
| Poa_crymophila | 0.226 | 344 | 0.22064 | Graminoid |
| Festuca_ovina | 0.2495 | 3234 | 0.265121 | Graminoid |
| Festuca_ovina | 0.0572 | 522 | 0.332184 | Graminoid |
| Festuca_ovina | 0.0422 | 636 | 0.227358 | Graminoid |
| Festuca_ovina | 0.0928 | 1272 | 0.286321 | Graminoid |
| Festuca_ovina | 0.092 | 1956 | 0.238957 | Graminoid |
| Festuca_ovina | 0.2663 | 2610 | 0.345057 | Graminoid |
| Festuca_ovina | 0.3495 | 3858 | 0.316952 | Graminoid |
| Festuca_ovina | 0.0216 | 342 | 0.236842 | Graminoid |
| Festuca_ovina | 0.2798 | 1518 | 0.253755 | Graminoid |
| Potentilla_fragarioides | 0.4291 | 894 | 0.237136 | Forb |
| Potentilla_fragarioides | 0.4694 | 976 | 0.25584 | Forb |
| Potentilla_fragarioides | 0.2449 | 518 | 0.251544 | Forb |
| Potentilla_fragarioides | 0.2815 | 392 | 0.316327 | Forb |
| Potentilla_fragarioides | 0.1571 | 423 | 0.201182 | Forb |
| Potentilla_fragarioides | 0.1629 | 322 | 0.229503 | Forb |
| Potentilla_fragarioides | 0.219 | 258 | 0.288372 | Forb |
| Potentilla_fragarioides | 0.33 | 777 | 0.237066 | Forb |
| Potentilla_fragarioides | 0.1664 | 367 | 0.233515 | Forb |
| Potentilla_fragarioides | 0.4743 | 1089 | 0.196143 | Forb |
| Potentilla_fragarioides | 0.3533 | 755 | 0.260795 | Forb |
| Potentilla_fragarioides | 0.5403 | 1076 | 0.216357 | Forb |
| Koeleria_cristata | 0.0264 | 1024 | 0.100391 | Graminoid |
| Koeleria_cristata | 0.0829 | 1424 | 0.133708 | Graminoid |
| Koeleria_cristata | 0.0356 | 832 | 0.145673 | Graminoid |
| Koeleria_cristata | 0.0472 | 584 | 0.128767 | Graminoid |
| Koeleria_cristata | 0.0177 | 276 | 0.162319 | Graminoid |
| Koeleria_cristata | 0.0223 | 288 | 0.126389 | Graminoid |
| Koeleria_cristata | 0.0282 | 252 | 0.11746 | Graminoid |
| Koeleria_cristata | 0.0516 | 384 | 0.146875 | Graminoid |
| Koeleria_cristata | 0.0191 | 140 | 0.165714 | Graminoid |
| Koeleria_cristata | 0.0627 | 524 | 0.135878 | Graminoid |
| Koeleria_cristata | 0.0364 | 196 | 0.112245 | Graminoid |
| Stipa_purpurea | 0.1452 | 69 | 2.886957 | Graminoid |
| Stipa_purpurea | 0.0528 | 15 | 2.88 | Graminoid |
| Stipa_purpurea | 0.3012 | 171 | 2.722807 | Graminoid |
| Stipa_purpurea | 0.092 | 36 | 2.666667 | Graminoid |
| Stipa_purpurea | 0.1299 | 45 | 2.62 | Graminoid |
| Stipa_purpurea | 0.1225 | 60 | 2.765 | Graminoid |
| Stipa_purpurea | 0.0412 | 24 | 2.5875 | Graminoid |
| Stipa_purpurea | 0.2816 | 216 | 2.1 | Graminoid |
| Stipa_purpurea | 0.1076 | 99 | 2.390909 | Graminoid |
| Stipa_purpurea | 0.1947 | 99 | 2.769697 | Graminoid |
| Agropyron_cristatum | 0.0831 | 45 | 1.048889 | Graminoid |
| Agropyron_cristatum | 0.1029 | 55 | 1.378182 | Graminoid |
| Agropyron_cristatum | 0.0646 | 47 | 1.002128 | Graminoid |
| Agropyron_cristatum | 0.0348 | 25 | 1.112 | Graminoid |
| Agropyron_cristatum | 0.0243 | 8 | 0.825 | Graminoid |
| Agropyron_cristatum | 0.0586 | 46 | 0.865217 | Graminoid |
| Agropyron_cristatum | 0.0564 | 6 | 1.2 | Graminoid |
| Agropyron_cristatum | 0.0358 | 25 | 1.08 | Graminoid |
| Agropyron_cristatum | 0.0465 | 20 | 1.04 | Graminoid |
| Agropyron_cristatum | 0.0909 | 63 | 0.939683 | Graminoid |
| Leontopodium_leontopodioides | 0.2242 | 13 | 0.053846 | Forb |
| Leontopodium_leontopodioides | 0.0638 | 174 | 0.035057 | Forb |
| Leontopodium_leontopodioides | 0.8468 | 71 | 0.076056 | Forb |
| Leontopodium_leontopodioides | 0.0672 | 6 | 0.066667 | Forb |
| Leontopodium_leontopodioides | 0.4459 | 59 | 0.052542 | Forb |
| Leontopodium_leontopodioides | 0.1065 | 86 | 0.053488 | Forb |
| Leontopodium_leontopodioides | 0.3173 | 53 | 0.060377 | Forb |
| Leontopodium_leontopodioides | 0.1509 | 109 | 0.055046 | Forb |
| Leontopodium_leontopodioides | 0.0871 | 6 | 0.016667 | Forb |
| Potentilla_bifurca | 0.0341 | 63 | 0.304762 | Forb |
| Potentilla_bifurca | 0.027 | 49 | 0.312245 | Forb |
| Potentilla_bifurca | 0.0129 | 13 | 0.476923 | Forb |
| Potentilla_bifurca | 0.0192 | 41 | 0.302439 | Forb |
| Potentilla_bifurca | 0.0197 | 40 | 0.31 | Forb |
| Potentilla_bifurca | 0.0215 | 20 | 0.32 | Forb |
| Potentilla_bifurca | 0.0168 | 23 | 0.413043 | Forb |
| Potentilla_bifurca | 0.0178 | 36 | 0.305556 | Forb |
Appendix B
Figure A1.
The phylogenetic tree based on nuclear ITS sequences of species.
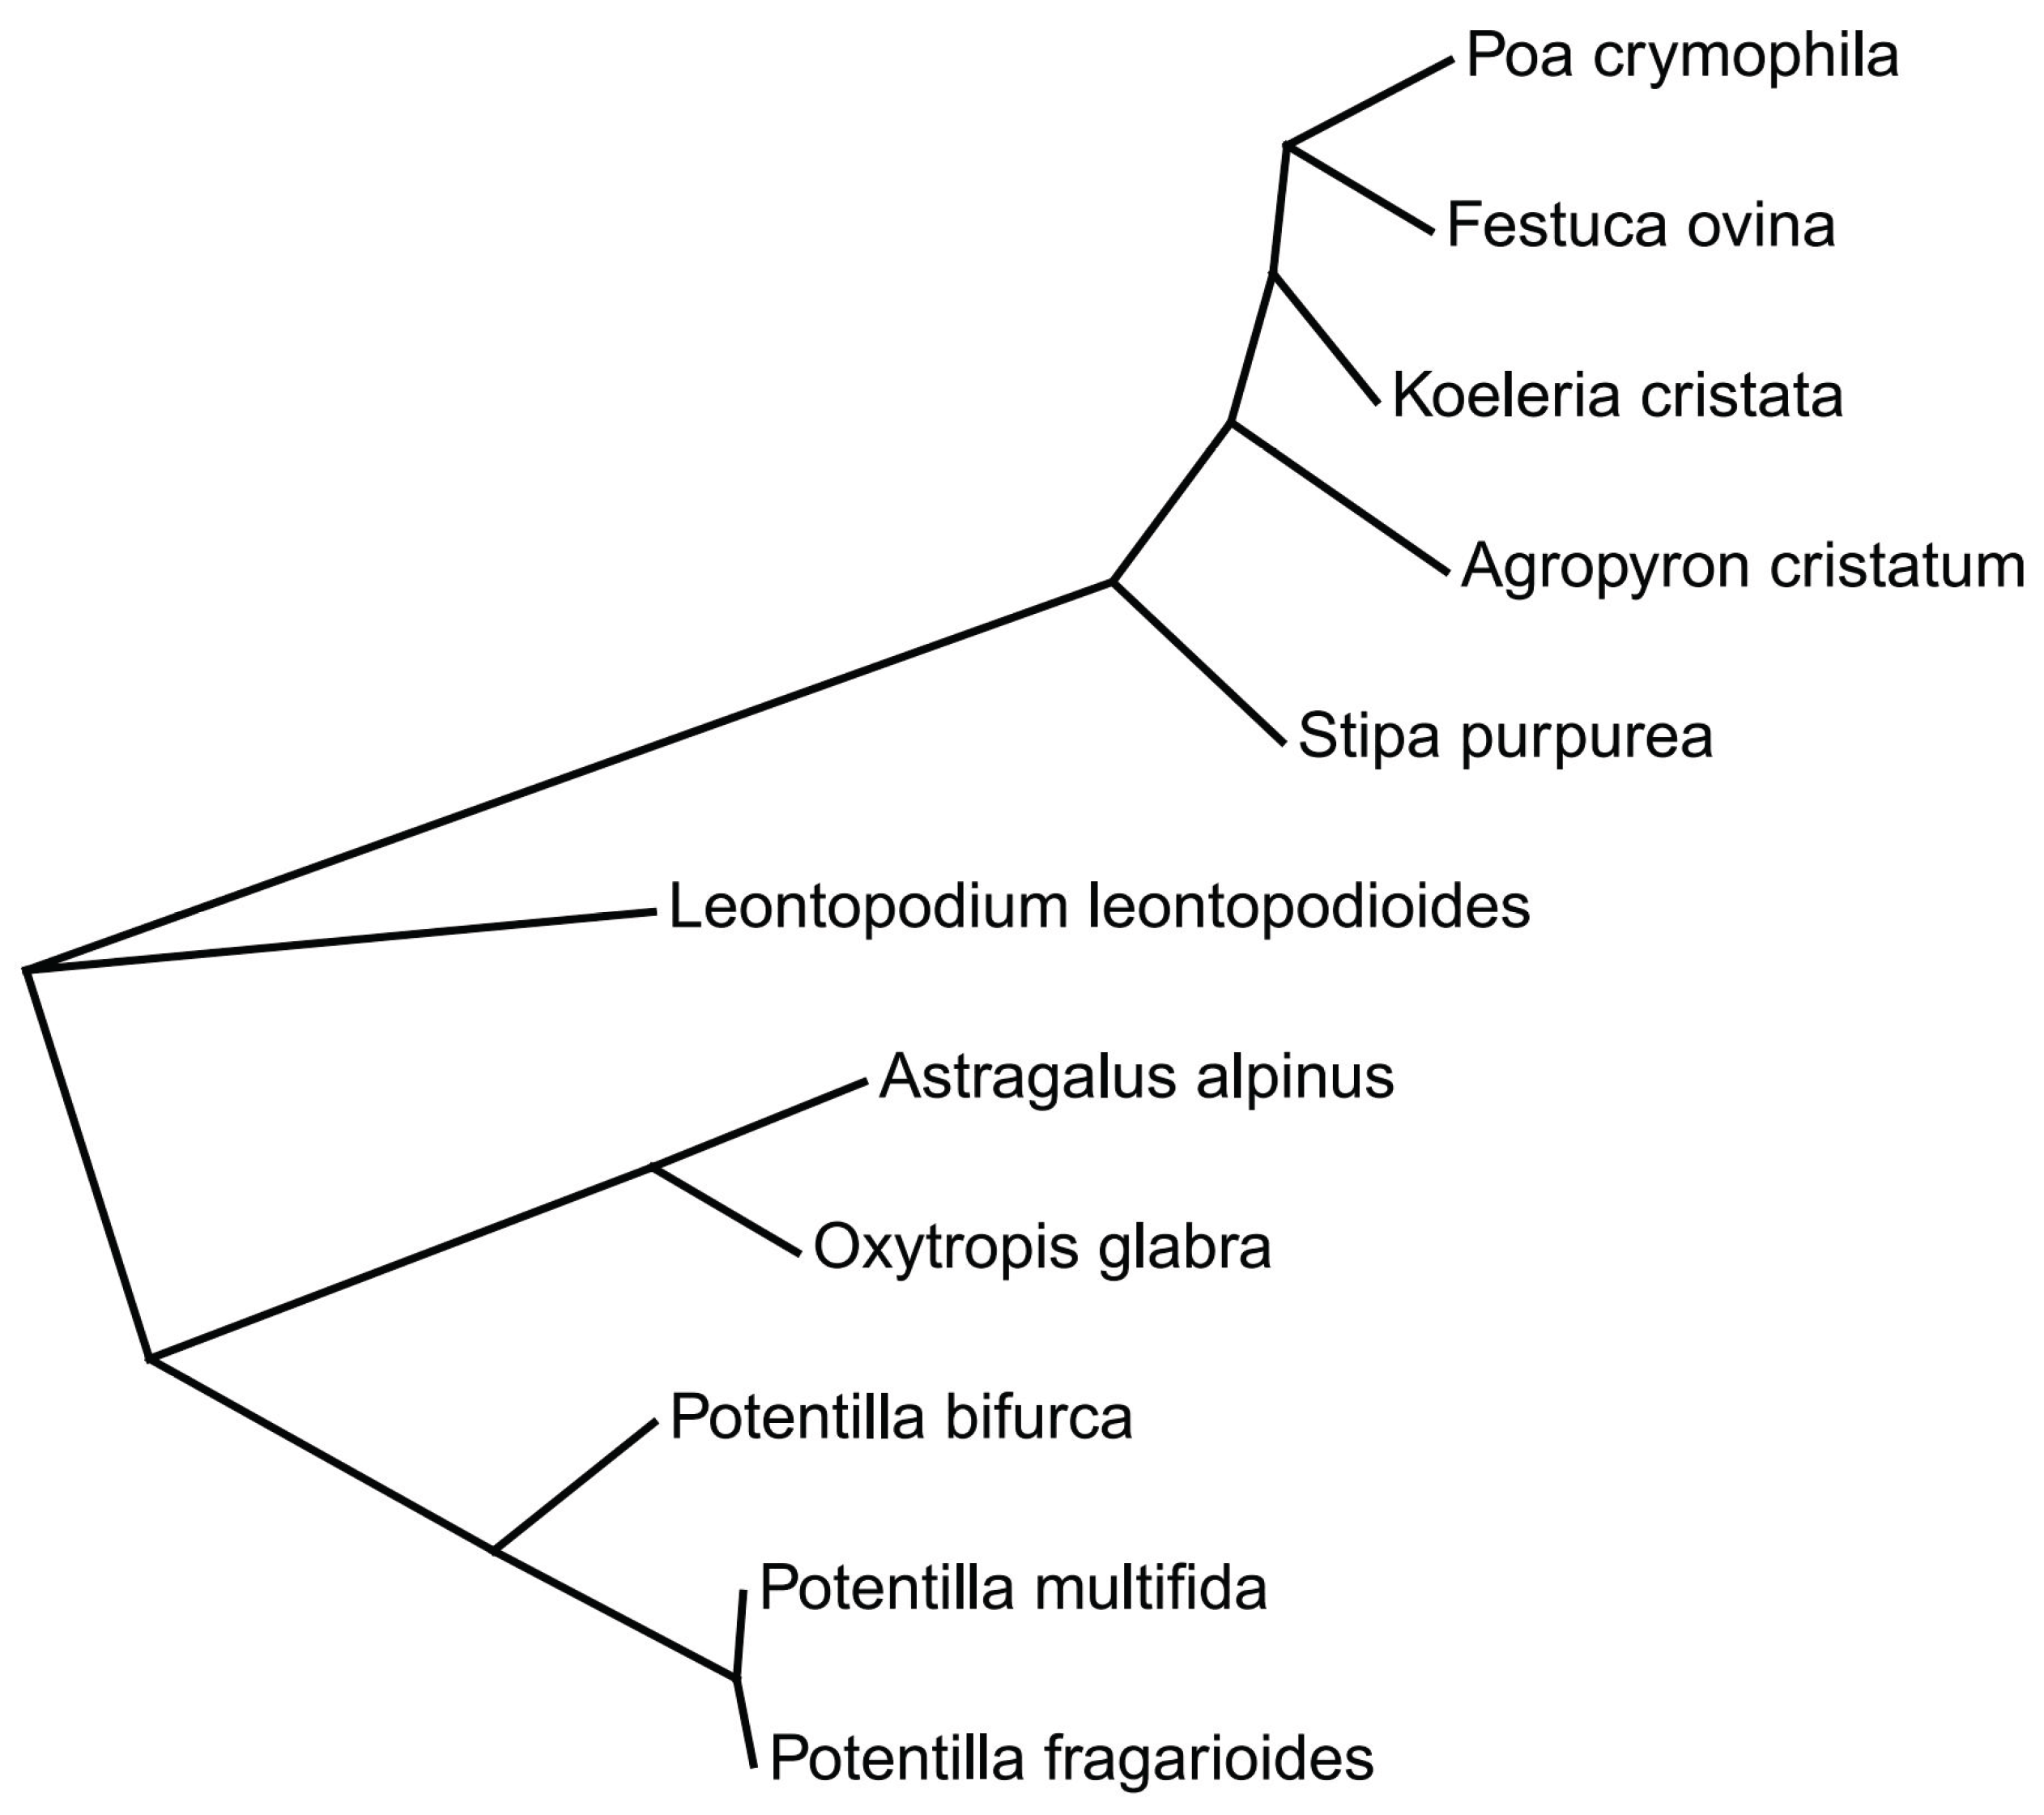
Figure A2.
The relationship between seed size and seed number of different species in commu nity. Each points represent a species’ mean value.
Figure A2.
The relationship between seed size and seed number of different species in commu nity. Each points represent a species’ mean value.
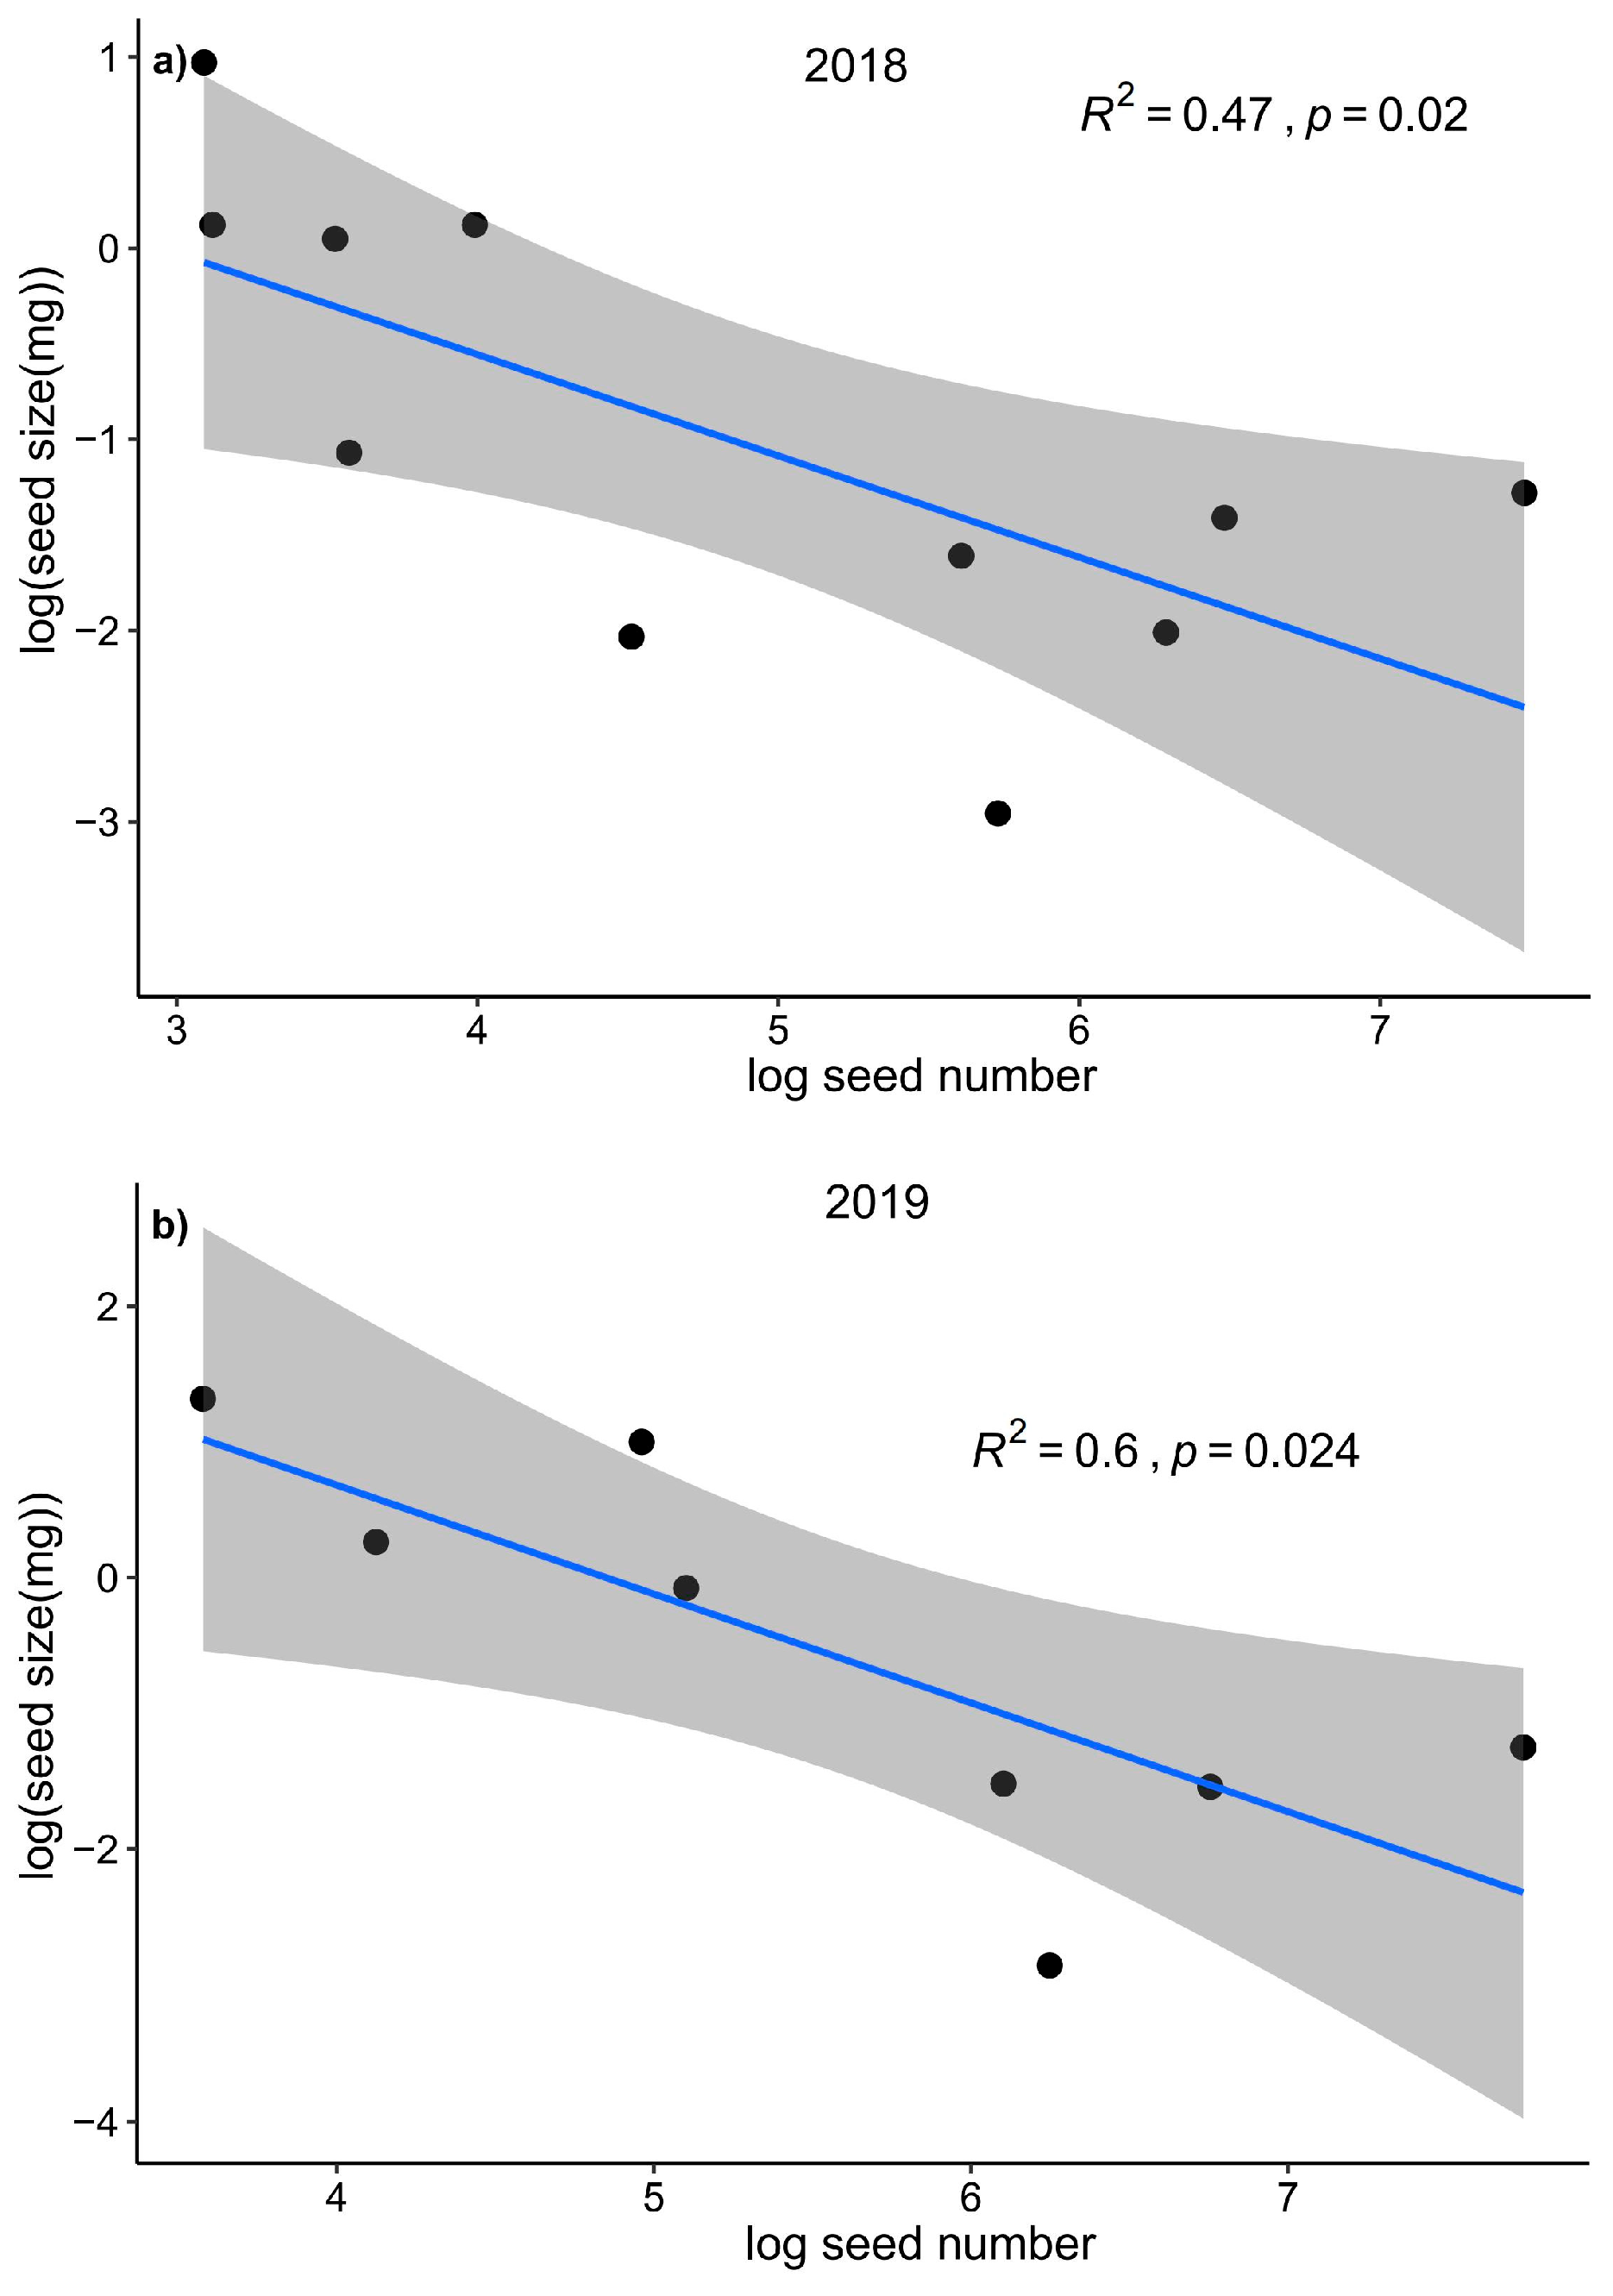
Figure A3.
The principal components analysis (PCA) of common species based on eight seed traits.
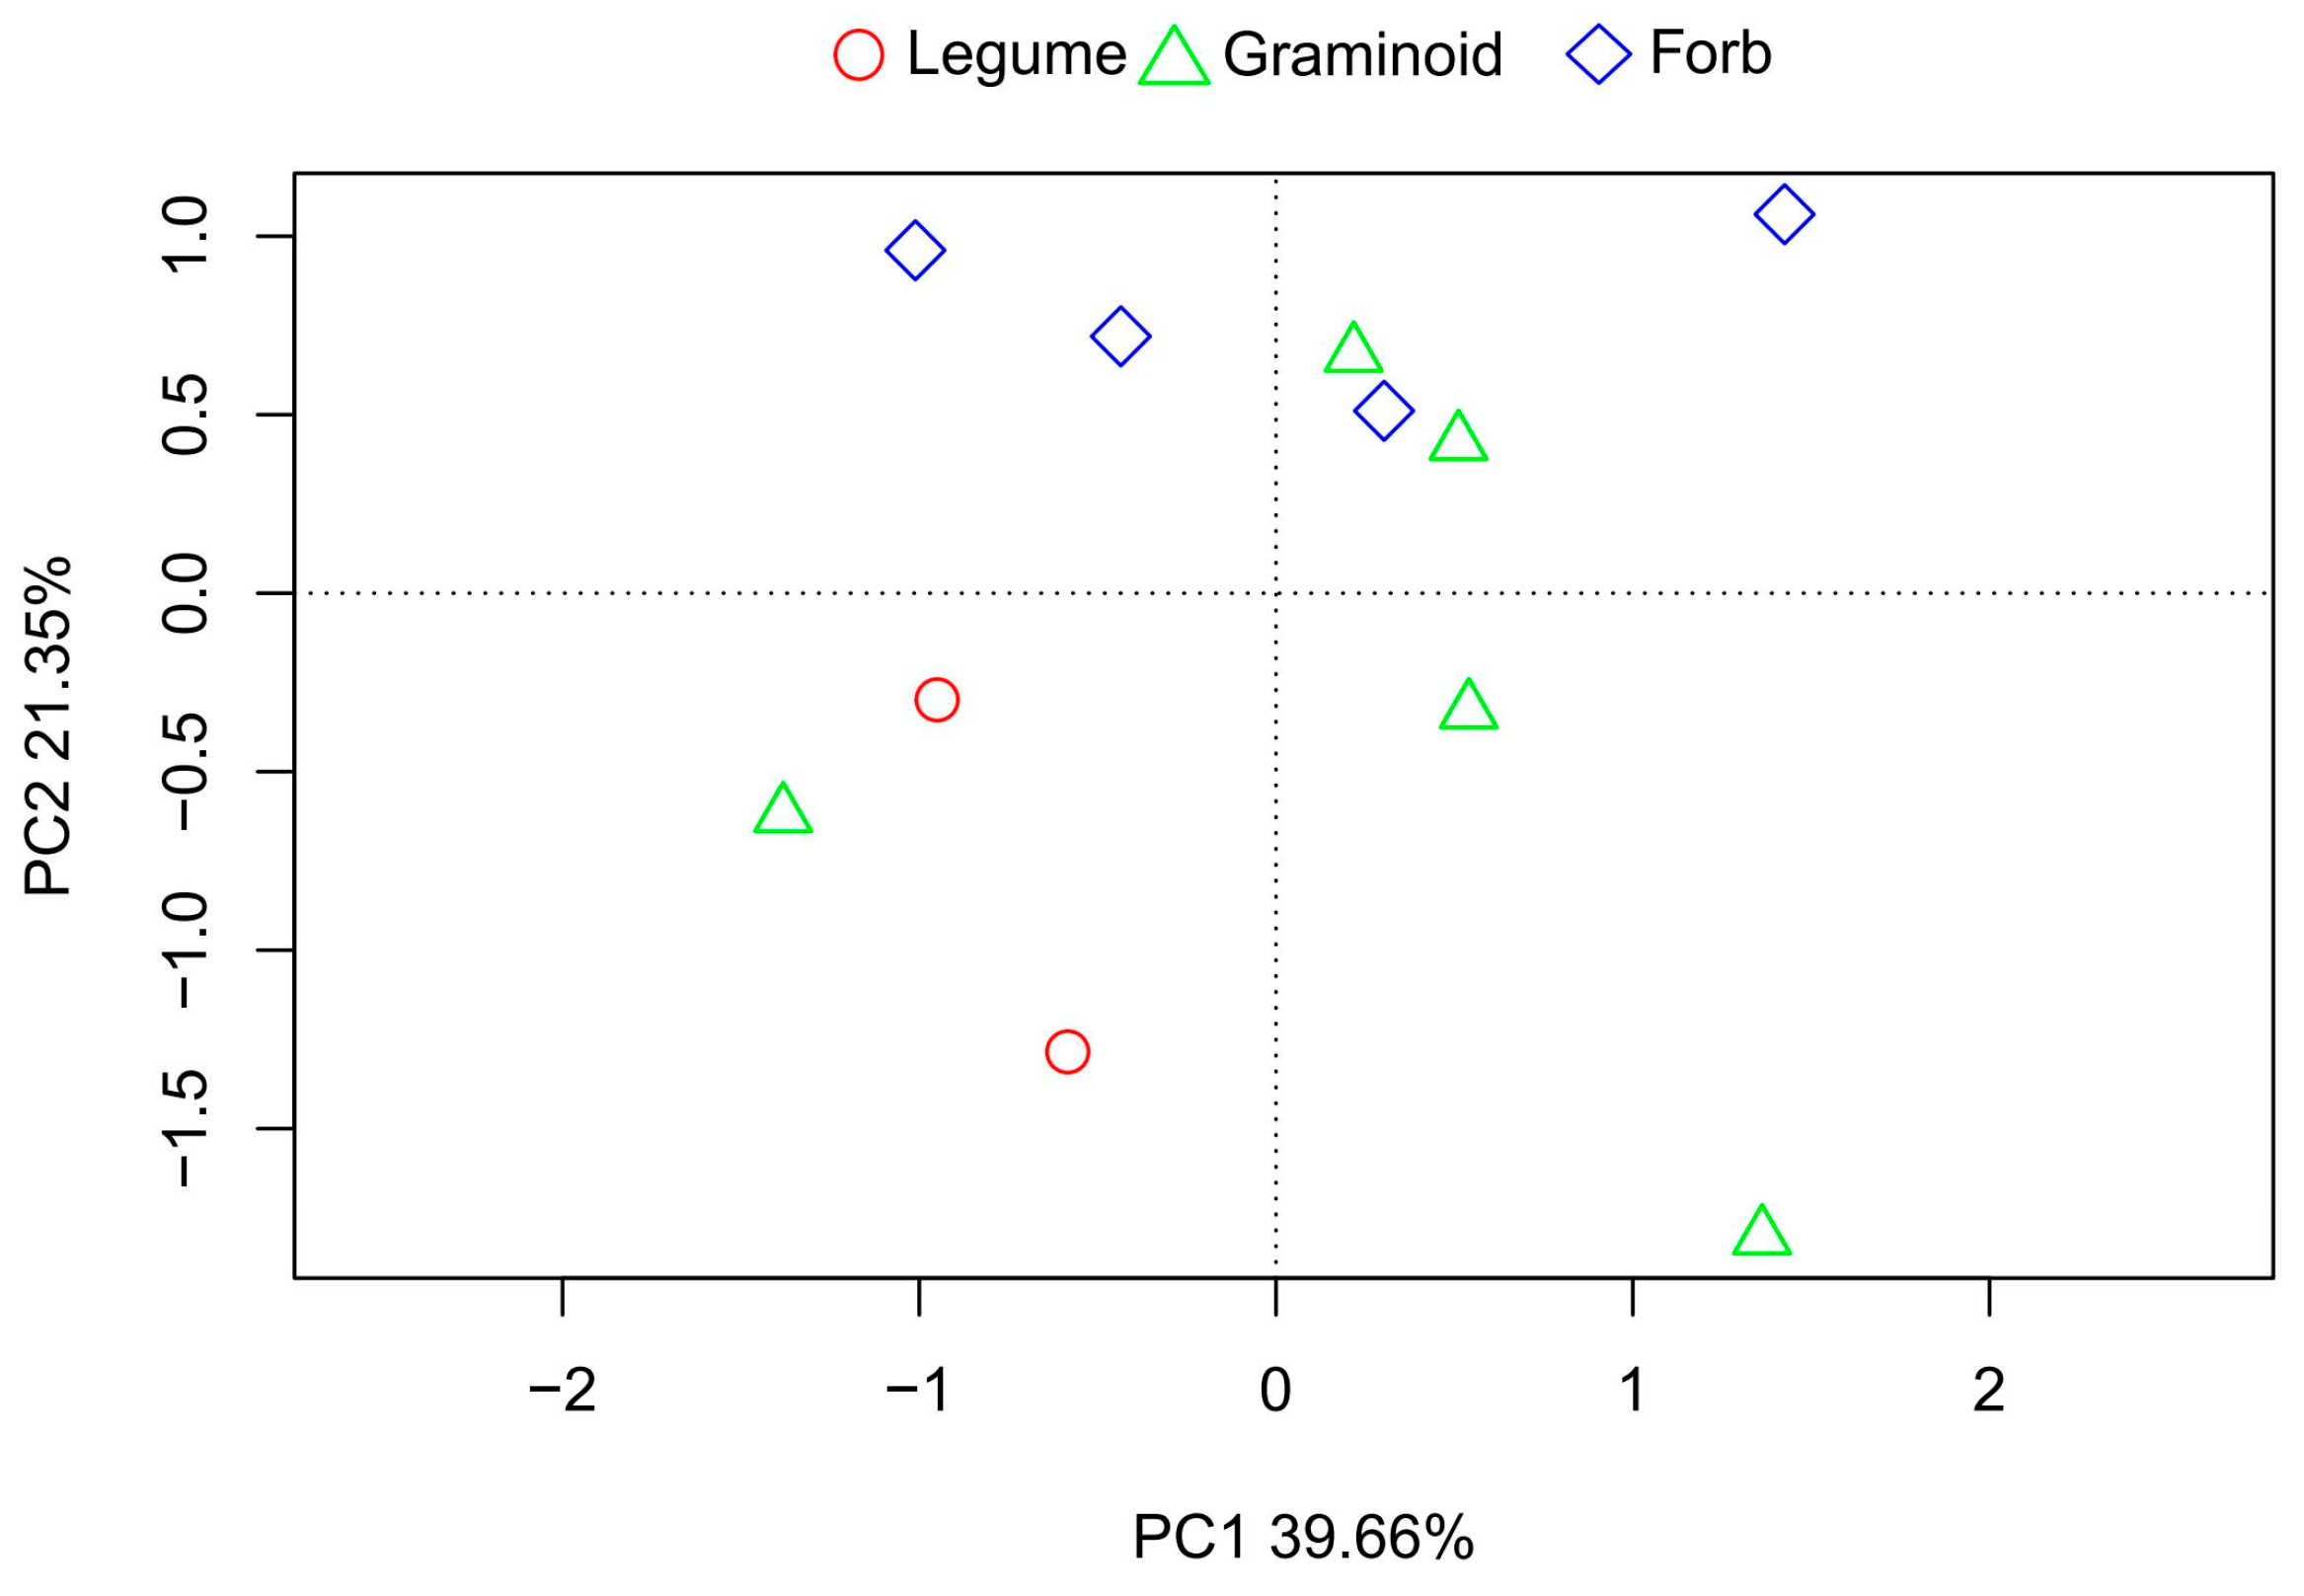
Figure A4.
Relationships between seed size and seed number at the community level a) and c) and at the functional group level b) and d) after two years data pooled. The seed size and seed number data were log transformed.
Figure A4.
Relationships between seed size and seed number at the community level a) and c) and at the functional group level b) and d) after two years data pooled. The seed size and seed number data were log transformed.
References
- Bostock SJ, Benton RA. The reproductive strategies of five perennial compositae. J Ecol. 1979, 67:91-107. [CrossRef]
- Chen R et al. Potential role of kin selection in the transition from vegetative to reproductive allocation in plants. J Plant Ecol. 2023 16:rtad025. [CrossRef]
- Mironchenko A, Kozłowski J. Optimal allocation patterns and optimal seed mass of a perennial plant. J Theor Biol. 2014, 354:12-24. [CrossRef]
- Roach DA. Plant life histories: ecology, phylogeny, and evolution. Pp. 313. 1999, Cambridge, UK: Cambridge University Press. ISBN 0 521 57495 1.
- Adler PB et al. Functional traits explain variation in plant life history strategies. Proc Natl Acad Sci U S A. 2014, 111:740-745. [CrossRef]
- Grotkopp E et al. Toward a causal explanation of plant invasiveness: seedling growth and life-history strategies of 29 pine (Pinus) species. Am Nat. 2002, 159:396-419. [CrossRef]
- Saatkamp A et al. A research agenda for seed-trait functional ecology. New Phytol. 2019, 221:1764-1775. [CrossRef]
- Zhou X et al. The competition–dispersal trade-off exists in forbs but not in graminoids: A case study from multispecies alpine grassland communities. Ecol Evol. 2019, 9:1403-1409. [CrossRef]
- Geritz SAH. Evolutionarily Stable Seed Polymorphism and Small-Scale Spatial Variation in Seedling Density. Am Nat. 1995, 146:685-707. [CrossRef]
- Kirkby MJ. The theory of island biogeography. Geogr J. 1968, 134:592-592. [CrossRef]
- Westoby M. A leaf-height-seed (LHS) plant ecology strategy scheme. Plant Soil. 1998, 199:213-227. [CrossRef]
- Barthlott W. Epidermal and seed surface characters of plants: systematic applicability and some evolutionary aspects. Nord J Bot. 1981, 1:345-355. [CrossRef]
- Metz J et al. Plant survival in relation to seed size along environmental gradients: a long-term study from semi-arid and Mediterranean annual plant communities. J Ecol. 2010,98:697-704. [CrossRef]
- Agren J. Seed Size and Number in Rubus Chamaemorus: Between-Habitat Variation, and Effects of Defoliation and Supplemental Pollination. J Ecol. 1989, 77:1080-1092. [CrossRef]
- Bogdziewicz M et al. Linking seed size and number to trait syndromes in trees. Glob Ecol Biogeogr. 2023, 32:683-694. [CrossRef]
- Bufford JL, Hulme PE. Seed size–number trade-offs are absent in the introduced range for three congeneric plant invaders. J Ecol. 2021, 109:3849-3860. [CrossRef]
- Qiu T et al. Limits to reproduction and seed size-number trade-offs that shape forest dominance and future recovery. Nat Commun. 2022, 13:2381. [CrossRef]
- Leishman MR, Wright IJ, Moles AT and Westoby, M. The evolutionary ecology of seed size. In Seeds: the ecology of regeneration in plant communities. Wallingford UK: CABI, 2000, pp 31-57. [CrossRef]
- Moles AT et al. Factors that shape seed mass evolution. Proc. Natl. Acad. Sci. U.S.A. 2005, 102 30:10540-10544. [CrossRef]
- Moles AT, Westoby M. Seed size and plant strategy across the whole life cycle. Oikos. 2006, 113:91-105. [CrossRef]
- Schupp EW et al. Arrival and survival in tropical treefall gaps. Ecology. 1989, 70:562-564. [CrossRef]
- Venable DL, Rees M. The scaling of seed size. J Ecol. 2009, 97:27-31. [CrossRef]
- Han T et al. Are reproductive traits of dominant species associated with specific resource allocation strategies during forest succession in southern China? Ecol. Indic. 2019, 102:538-546. [CrossRef]
- Westoby M, Leishman M, Lord J, Poorter H, Schoen DJ. Comparative ecology of seed size and dispersal. Phil Trans R Soc Lond B. 1996, 351:1309-1318. [CrossRef]
- Venable DL, Brown JS. The selective interactions of dispersal, dormancy, and seed size as adaptations for reducing risk in variable environments. Am Nat. 1988, 131:360-384. [CrossRef]
- Moles AT et al. Global patterns in seed size. Global Ecol Biogeogr. 2006, 16:109-116. [CrossRef]
- Parciak W. Environmental variation in seed number, size, and dispersal of a fleshy-fruited plant. Ecology. 2002, 83:780-793. [CrossRef]
- Venable DL, Lawlor L. Delayed germination and dispersal in desert annuals: Escape in space and time. Oecologia. 1980, 46:272-282. [CrossRef]
- Ashman T-L et al. Pollen limitation of plant reproduction: ecological and evolutionary causes and consequences. Ecology. 2004, 85:2408-2421. [CrossRef]
- Madsen JD. Resource allocation at the individual plant level. Aquat Bot. 1991, 41:67-86. [CrossRef]
- Germain RM, Gilbert B. Hidden responses to environmental variation: maternal effects reveal species niche dimensions. Ecol Lett. 2014, 17:662-669. [CrossRef]
- Lebrija-Trejos E et al. Reproductive traits and seed dynamics at two environmentally contrasting annual plant communities: From fieldwork to theoretical expectations. Isr J Ecol Evol. 2011, 57:73-90. [CrossRef]
- Catling AA et al. Individual vital rates respond differently to local-scale environmental variation and neighbour removal. J Ecol. 2024, 112:1369-1382. [CrossRef]
- Cheplick GP. Plasticity of seed number, mass, and allocation in clones of the perennial grass amphibromus scabrivalvis. Int J Plant Sci. 1995, 156:522-529. [CrossRef]
- Dong B et al. Context-Dependent Parental Effects on Clonal Offspring Performance. Front Plant Sci. 2018, 9:1824. [CrossRef]
- Jakobsson A, Eriksson O. A comparative study of seed number, seed size, seedling size and recruitment in grassland plants. Oikos. 2000, 88:494-502. [CrossRef]
- Wang X et al. Large and non-spherical seeds are less likely to form a persistent soil seed bank. Proc R Soc B. 2024, 291:2023-2764. [CrossRef]
- Thürig B et al. Seed production and seed quality in a calcareous grassland in elevated CO2. Global Change Biology. 2003, 9: 873-884. [CrossRef]
- Guo H et al. Geographic variation in seed mass within and among nine species of Pedicularis (Orobanchaceae): effects of elevation, plant size and seed number per fruit. J Ecol. 2010, 98:1232-1242. [CrossRef]
- Cochrane A et al. Will among-population variation in seed traits improve the chance of species persistence under climate change? Glob Ecol Biogeogr. 2015, 24:12-24. [CrossRef]
- Vandvik V et al. Seed banks are biodiversity reservoirs: species–area relationships above versus below ground. Oikos. 2016, 125:218-228. [CrossRef]
- Leishman MR, Murray BR. The relationship between seed size and abundance in plant communities: model predictions and observed patterns. Oikos. 2001, 94:151-161. [CrossRef]
- Parker VT, Ingalls SB. Seed size–seed number trade-offs: influence of seed size on the density of fire-stimulated persistent soil seed banks. Am J Bot. 2022, 109:486-493. [CrossRef]
- Baker R et al. A multi-level test of the seed number/size trade-off in two Scandinavian communities. PLoS One. 2018, 13:e0201175. [CrossRef]
- Smith CC, Fretwell SD. The optimal balance between size and number of offspring. Am Nat. 1974, 108:499-506. [CrossRef]
- Leishman MR. Does the seed size/number trade-off model determine plant community structure? An assessment of the model mechanisms and their generality. Oikos. 2001, 93:294-302. [CrossRef]
- Sadras VO. Evolutionary aspects of the trade-off between seed size and number in crops. Field Crop Res. 2007, 100:125-138. [CrossRef]
- Turnbull LA et al. Are plant populations seed-limited? A review of seed sowing experiments. Oikos. 2000, 88:225-238. [CrossRef]
- Dani KGS, Kodandaramaiah U. Plant and Animal Reproductive Strategies: Lessons from Offspring Size and Number Tradeoffs. Front Ecol Evol. 2017, 5:38. [CrossRef]
- Lönnberg K, Eriksson O. Rules of the seed size game: contests between large-seeded and small-seeded species. Oikos. 2013, 122:1080-1084. [CrossRef]
- Endara MJ, Coley PD. The resource availability hypothesis revisited: a meta-analysis. Funct Ecol. 2011, 25:389-398. [CrossRef]
- López-Goldar X et al. Resource availability drives microevolutionary patterns of plant defences. Funct Ecol. 2020, 34:1640-1652. [CrossRef]
- Ben-Hur E, Kadmon R. An experimental test of the relationship between seed size and competitive ability in annual plants. Oikos. 2015, 124:1346-1353. [CrossRef]
- Germain RM et al. Maternal provisioning is structured by species’ competitive neighborhoods. Oikos. 2019, 128:45-53. [CrossRef]
- Kang X et al. Regional gradients in intraspecific seed mass variation are associated with species biotic attributes and niche breadth. AoB Plants. 2022, 14:plac013. [CrossRef]
- Venable DL. Size-Number Trade-Offs and the Variation of Seed Size with Plant Resource Status. Am Nat. 1992, 140:287-304. [CrossRef]
- Yang YY, Kim JG. The optimal balance between sexual and asexual reproduction in variable environments: a systematic review. J Ecology Environ. 2016, 40. [CrossRef]
- Hutchings MJ. Differential foraging for resources, and structural plasticity in plants. Trends Ecol Evol. 1988, 3:200-204. [CrossRef]
- Xiao Y et al. Trade-offs among growth, clonal, and sexual reproduction in an invasive plant Spartina alterniflora responding to inundation and clonal integration. Hydrobiologia. 2011, 658:353-363. [CrossRef]
- Lei SA. Benefits and Costs of Vegetative and Sexual Reproduction in Perennial Plants: A Review of Literature. Journal of the Arizona-Nevada Academy of Science. 2010, 42:9-14. [CrossRef]
- Parvinen K. Metapopulation dynamics and the evolution of dispersal. In complex population dynamics: nonlinear modeling in ecology, epidemiology and genetics, 2007, pp 77-107. [CrossRef]
- Cook BI et al. Divergent responses to spring and winter warming drive community level flowering trends. Proc Natl Acad Sci USA. 2012, 109:9000-9005. [CrossRef]
- Wu L et al. Reduction of microbial diversity in grassland soil is driven by long-term climate warming. Nat Microbiol. 2022, 7:1054-1062. [CrossRef]
- Zhou X et al. Different categories of biodiversity explain productivity variation after fertilization in a Tibetan alpine meadow community. Ecol Evol. 2017, 7:3464-3474. [CrossRef]
- Li KH et al. Response of alpine grassland to elevated nitrogen deposition and water supply in China. Oecologia. 2015, 177(1): 65-72. https://doi:10.1007/s00442-014-3122-4.
- Reekie EG, Bazzaz FA. Reproductive Effort in Plants Effect of Reproduction on Vegetative Activity. Am Nat. 1987, 129:907-919. [CrossRef]
- Harper JL et al. The Shapes and Sizes of Seeds. Annu Rev Ecol Syst. 1970, 1:327-356. [CrossRef]
- Venable DL. Bet hedging in a guild of desert annuals. Ecology. 2007, 88:1086-1090. [CrossRef]
- Bellés-Sancho P et al. Nitrogen-Fixing Symbiotic Paraburkholderia Species: Current Knowledge and Future Perspectives. Nitrogen. 2023, 4:135-158. [CrossRef]
- Remigi P et al. Symbiosis within Symbiosis: Evolving Nitrogen-Fixing Legume Symbionts. Trends Microbiol. 2016, 24:63-75. [CrossRef]
- Webb CO et al. Phylogenies and Community Ecology. Annu Rev Ecol Syst. 2002, 33:475-505. [CrossRef]
- Tamura K et al. MEGA5: Molecular Evolutionary Genetics Analysis Using Maximum Likelihood, Evolutionary Distance, and Maximum Parsimony Methods. Mol Biol Evol. 2011, 28:2731-2739. [CrossRef]
Figure 1.
Seed size and seed number per ramet of 11 common species at our study site in 2018 and 2019.
Figure 1.
Seed size and seed number per ramet of 11 common species at our study site in 2018 and 2019.
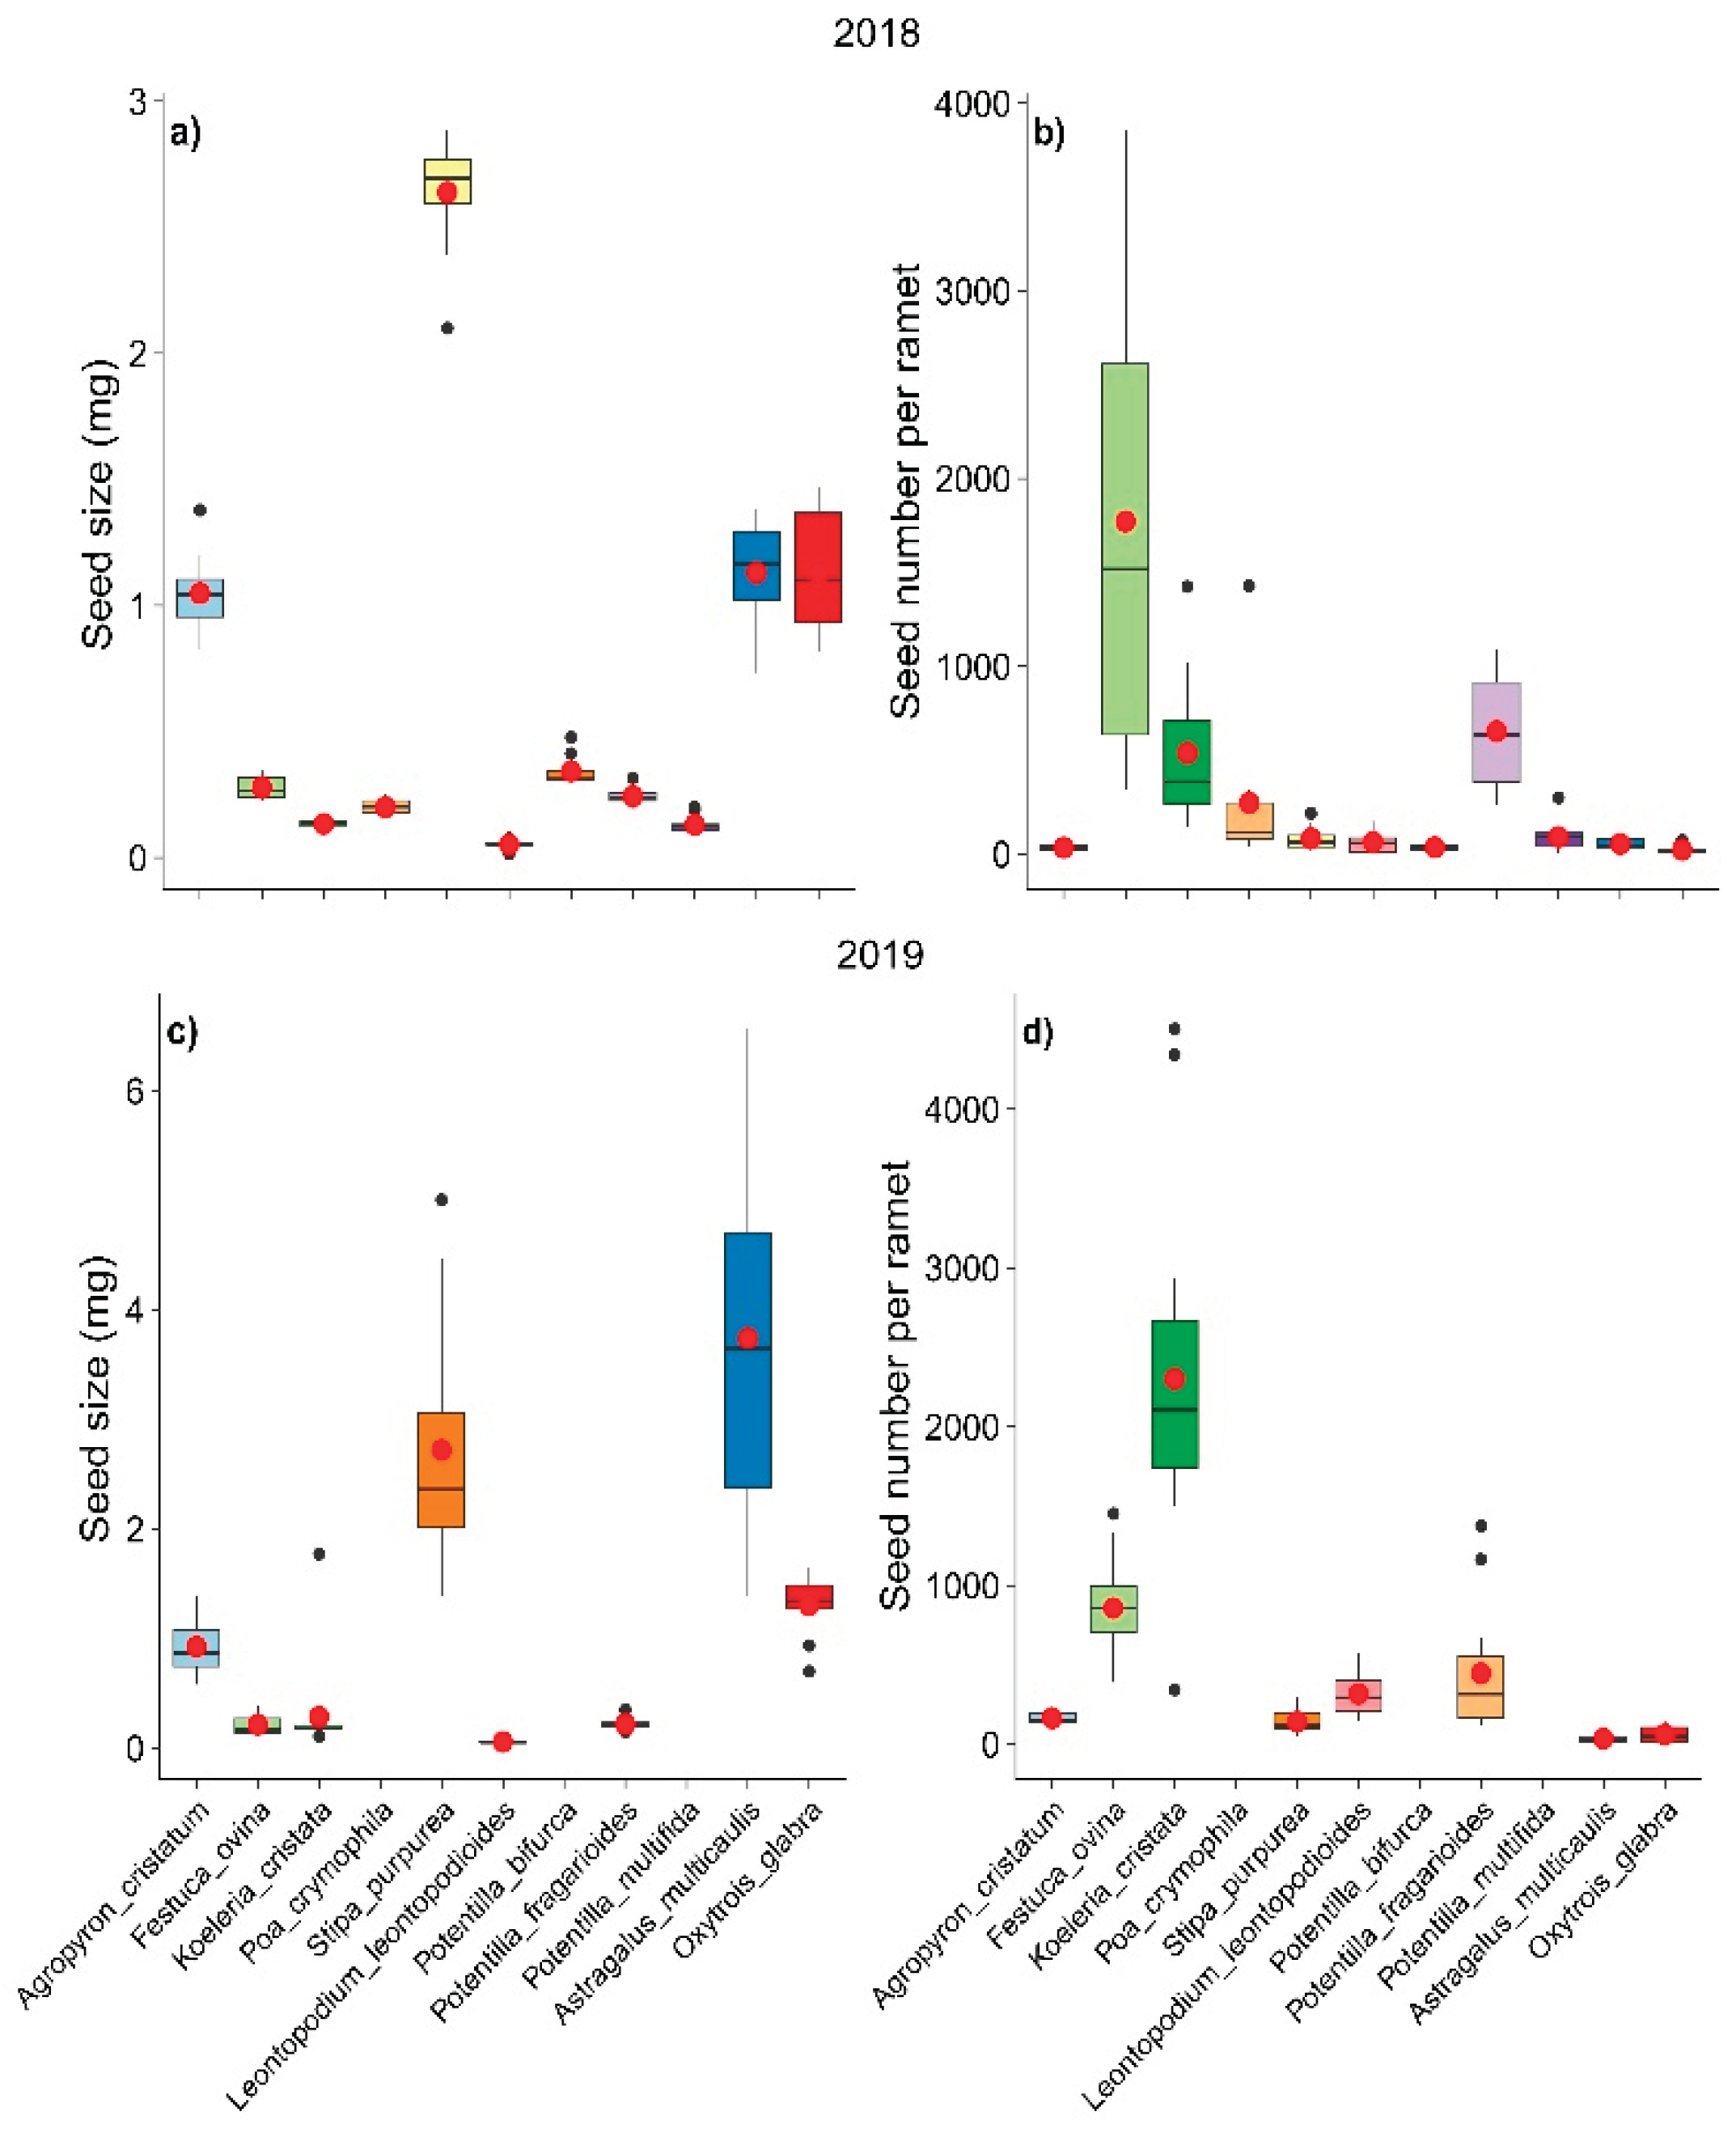
Figure 2.
Relationships between seed size and seed number at the community level a) and c) and at the functional group level b) and d) in 2018 and 2019. The seed size and seed number data were log transformed.
Figure 2.
Relationships between seed size and seed number at the community level a) and c) and at the functional group level b) and d) in 2018 and 2019. The seed size and seed number data were log transformed.
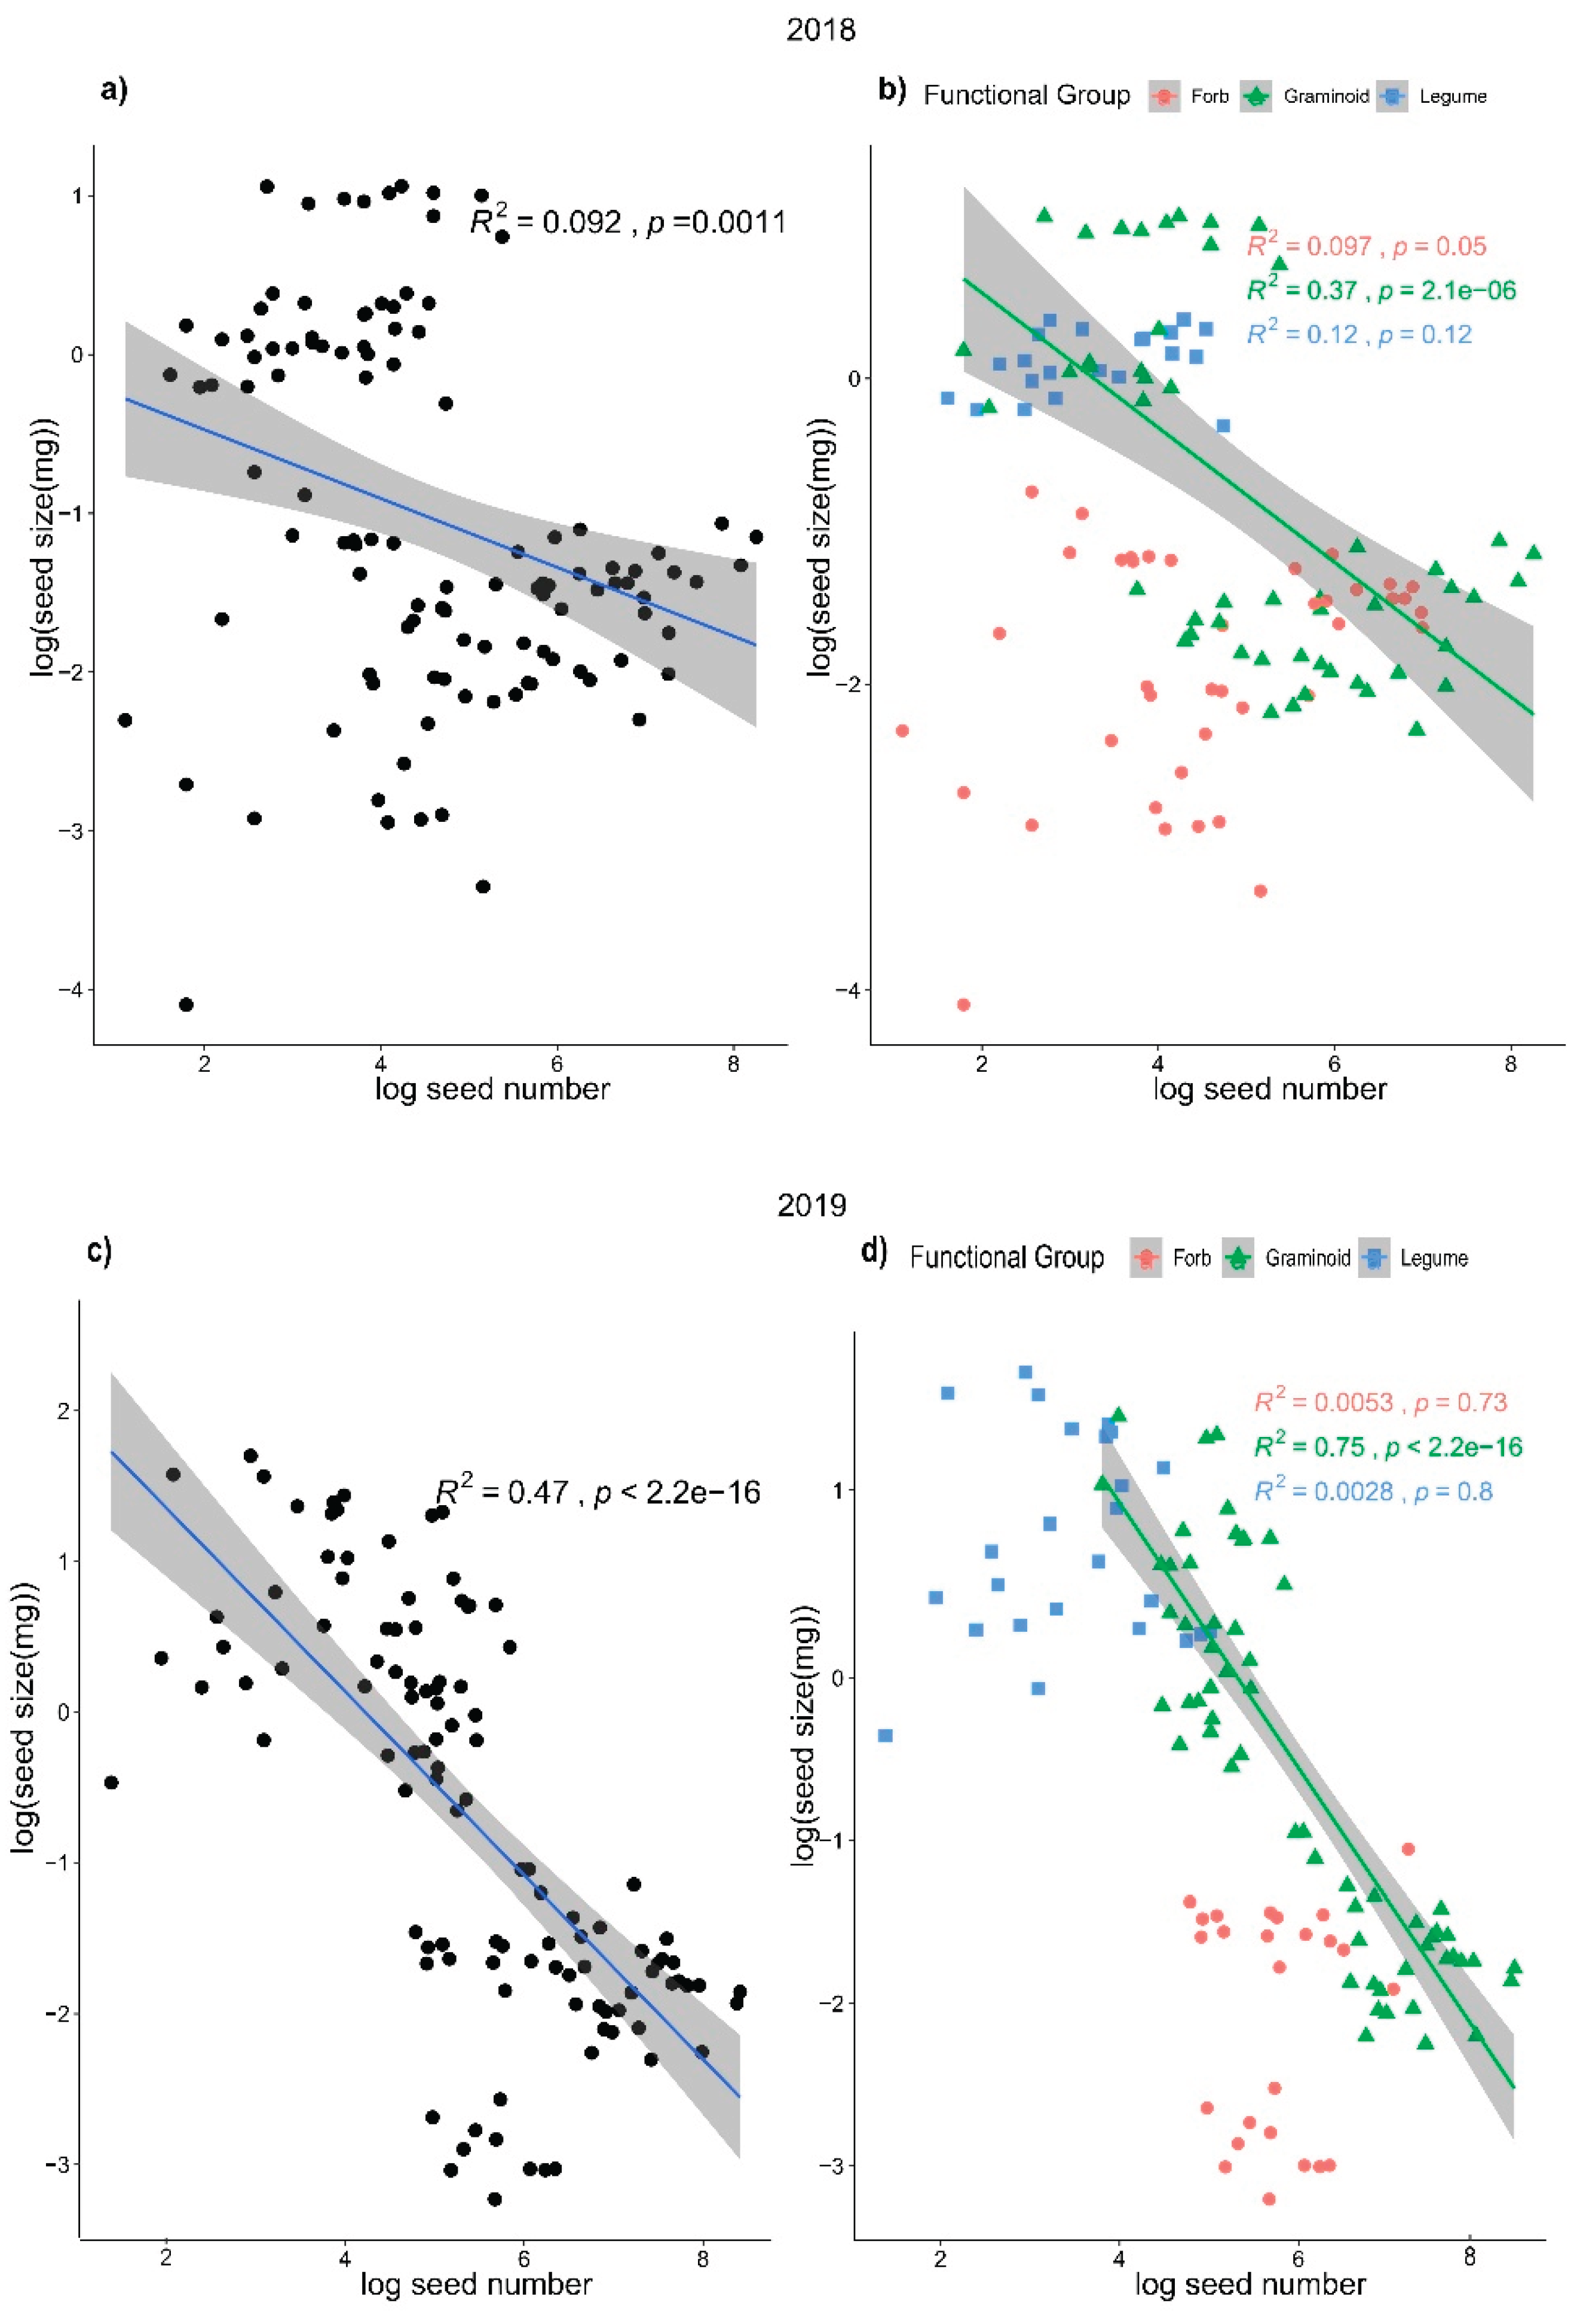
Figure 3.
Reproductive biomass and allocation of the three functional groups in 2018 and 2019.
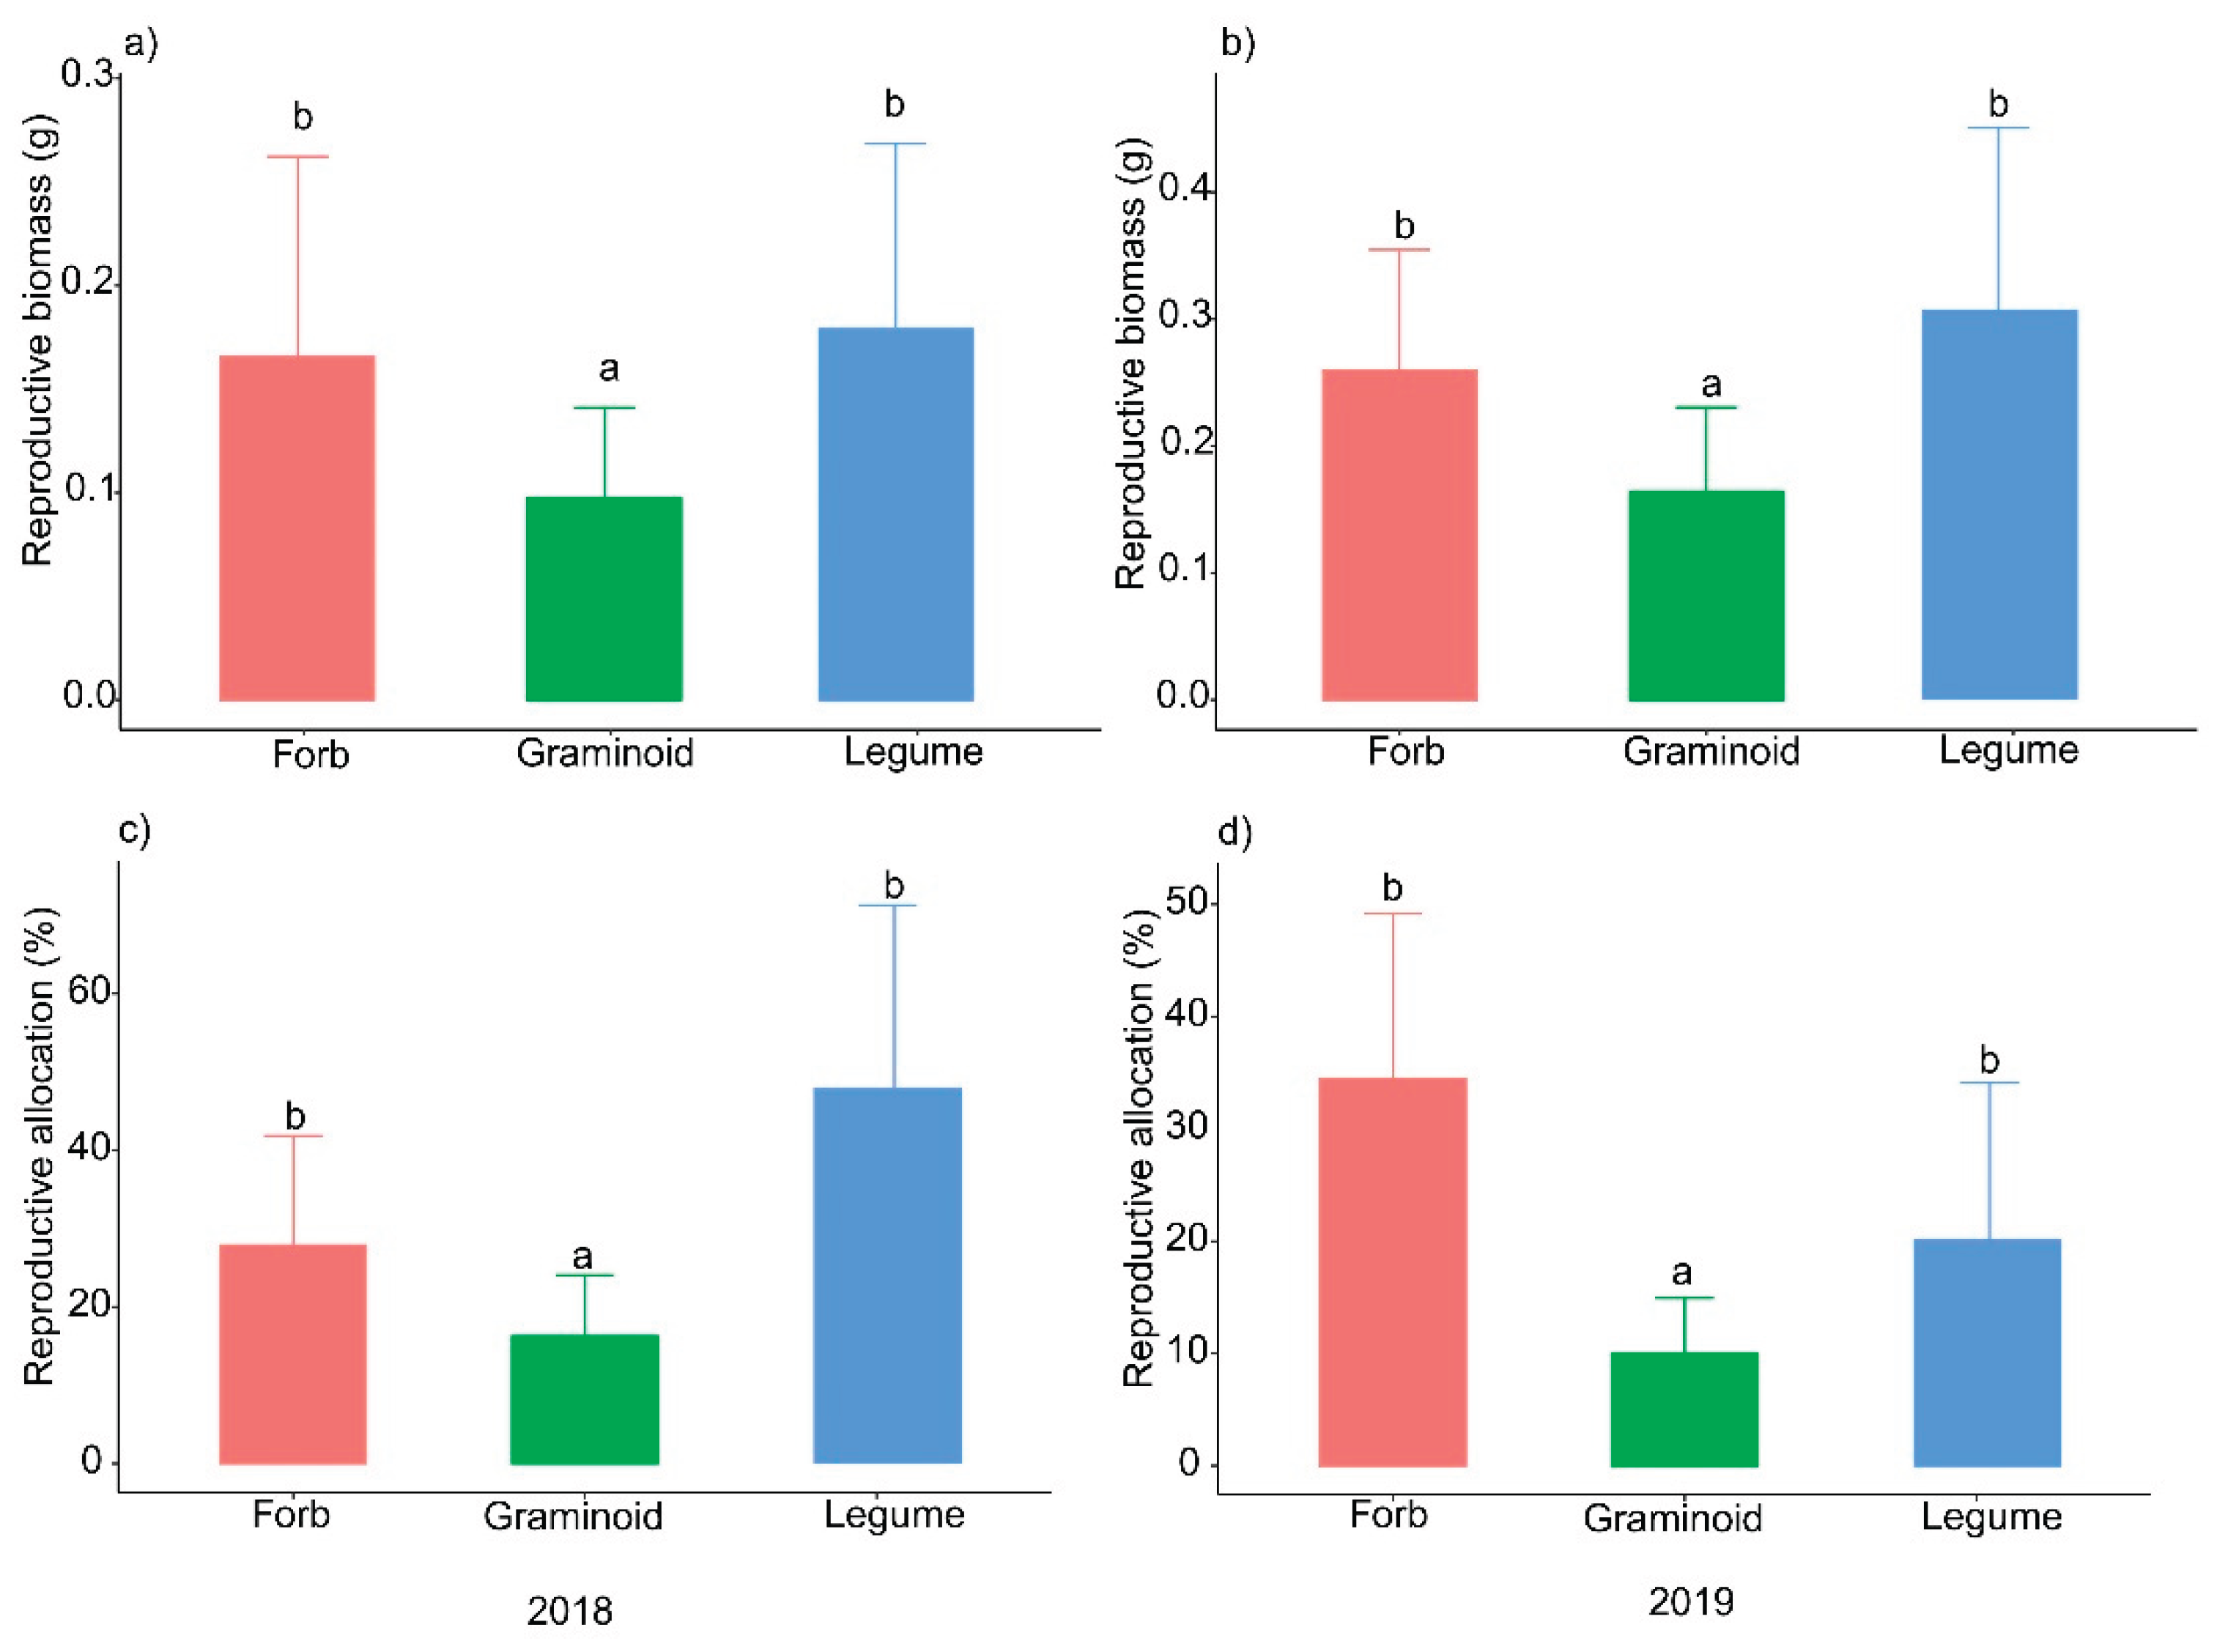
Figure 4.
The seed traits of three functional groups.
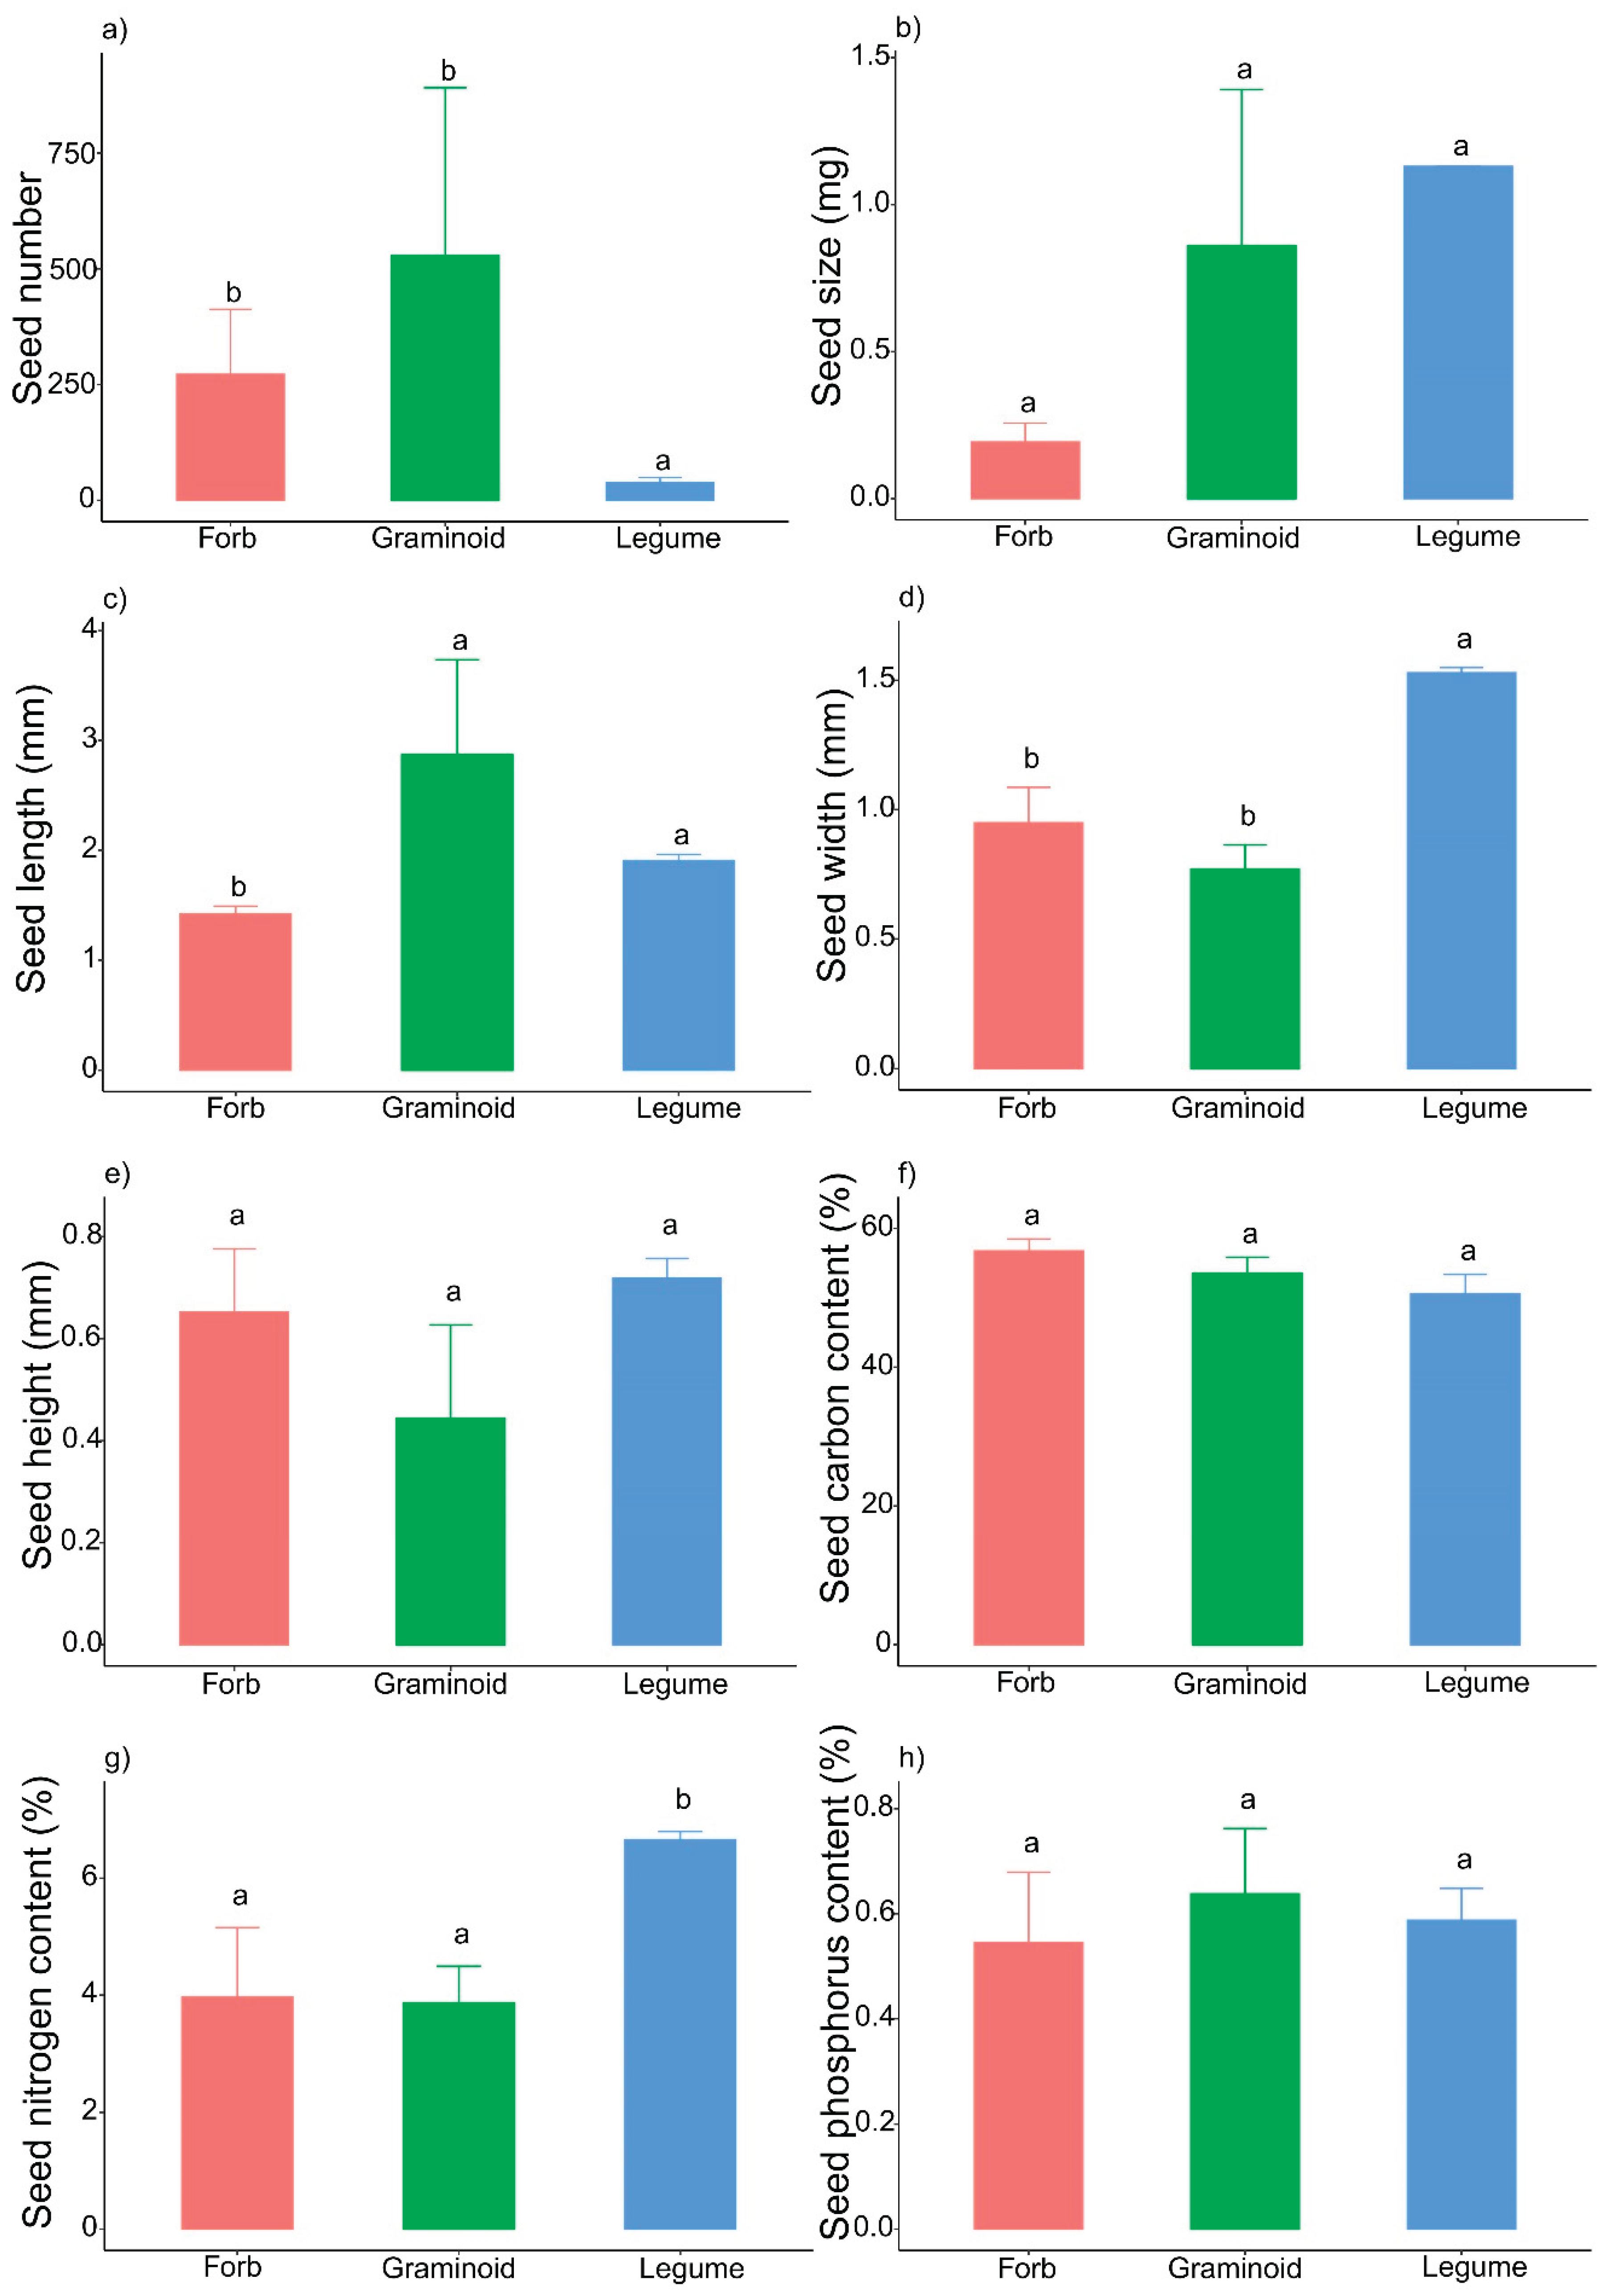
Table 1.
The seed size per grain, seed number per ramet and reproduction types of 11 common species in our study site (the mean value for 2018 and 2019).
Table 1.
The seed size per grain, seed number per ramet and reproduction types of 11 common species in our study site (the mean value for 2018 and 2019).
| Species | Functional group | Seed size (mg) | Seed number | Reproduction type |
|---|---|---|---|---|
| Agropyron cristatum | graminoid | 0.9879 | 98 | sexual+ clonal |
| Festuca ovina | graminoid | 0.2458 | 1315 | sexual+ clonal |
| Koeleria cristata | graminoid | 0.2102 | 1420 | sexual+ clonal |
| Poa crymophila | graminoid | 0.2 | 273 | sexual+ clonal |
| Stipa purpurea | graminoid | 2.68 | 113 | sexual+ clonal |
| Leontopodium leontopodioides | forb | 0.0547 | 191 | sexual |
| Potentilla bifurca | forb | 0.3431 | 36 | sexual |
| Potentilla fragarioides | forb | 0.2315 | 551 | sexual |
| Potentilla multifida | forb | 0.131 | 91 | sexual |
| Astragalus multicaulis | legume | 2.435 | 45 | sexual |
| Oxytrois glabra | legume | 1.216 | 42 | sexual |
Disclaimer/Publisher’s Note: The statements, opinions and data contained in all publications are solely those of the individual author(s) and contributor(s) and not of MDPI and/or the editor(s). MDPI and/or the editor(s) disclaim responsibility for any injury to people or property resulting from any ideas, methods, instructions or products referred to in the content. |
© 2025 by the authors. Licensee MDPI, Basel, Switzerland. This article is an open access article distributed under the terms and conditions of the Creative Commons Attribution (CC BY) license (http://creativecommons.org/licenses/by/4.0/).
Copyright: This open access article is published under a Creative Commons CC BY 4.0 license, which permit the free download, distribution, and reuse, provided that the author and preprint are cited in any reuse.


