Submitted:
19 July 2025
Posted:
23 July 2025
You are already at the latest version
Abstract
The effectiveness of fiscal and monetary policy in sustaining growth and facilitating recovery from economic crises is more and more considered as being influenced greatly by the quality of a country’s institutions. Strong institutions may determine how well macroeconomic policies perform under both stable and turbulent circumstances. This study examines how institutional quality moderates the effects of fiscal and monetary policies on economic growth in Thailand from Q1:2003 to Q4:2023. Using a combination method of BART and BASAD models, we identify voice and accountability and control of corruption as main institutional proxies, and among several input macroeconomic indicators, exports, household debt, gold prices and electricity generation are found to be important variables of growth performance during the study period. Our results show that institutional quality stabilizes and enhances the impact of policy interest rates and export growth while mitigating negative shocks from household debt and energy infrastructure challenges. Monetary policy effectiveness varies over time and depends on governance conditions. Fiscal policy effects are generally neutral but linked to institutional fluctuations. These findings highlight that strong institutions improve policy outcomes and support sustainable growth. This study empirically examines the moderating role of institutional quality in economic resilience and policy design in an emerging economy using microdata of Thailand as a focus based on the tvSURE model.
Keywords:
institutional quality
; fiscal policy
; monetary policy
; sustainable growth
1. Introduction
Sustained long-term economic growth remains a focal concern for both developed and developing economies especially small open and emerging markets, where structural vulnerabilities and external shocks encounter the efficacy of macroeconomic policies. Keynes (1936) argued that fiscal policy boosts aggregate demand especially during economic downturns through increased government spending or tax cuts. Similarly, Friedman and Schwartz (1963) presented that monetary policy influences output by adjusting policy rates and money supply to attract more investment and consumption. Nearly all countries implement fiscal and monetary policies and tools to manage market fluctuations and sustain economic stability. This raises a question “why do similar macroeconomic policies not return same outcomes in different nations?” Yet, these theories assume an institutional environment in which policies are effectively implemented. Visibly, growth is not driven by policy alone. Governments may increase public expenditure or cut rates but the success of these measures depends on the quality of institution and leadership.
North (1990) defined institutions as the formal and informal rules that govern political, economic and social relations. According to institutional economic theory (North, 1990), strong institutions create incentives for higher productivity and conquer public trust. In contrast, weak institutions can weaken public trust and distort incentives. As per result, it is difficult to attain the expected policy outcomes under weak institutional governance. For example, capital inflows and private investment tend to be discouraged in the absence of fundamental institutional elements such as freedom of expression and rule of law. Thus, strong institutions are essential for the economic resilience as they ratify fiscal spending reaches its targets and monetary adjustment meets its expectations. In addition, institutions become one of the main driving engines of the triumph of macroeconomic policies. These highlight that sustainable economic growth can be achieved when policies are implemented under strong institutions by trusted economic agents. A recent growing literature has supported these arguments including Acemoglu, Johnson and Robinson (2001), Rodrik, Subramanian and Trebbi (2004), Kirasanova, Le and Marco (2005), Keefer and Knack (2007), Acemoglu and Robinson (2012), Bon (2019), Radulović (2020), Khan, Raza and Vo (2020) and Kakar, Younas and Malik (2024). Still, empirical insights remain scattered, static, and overlooks short-term and country-specific dynamics.
This institutional breadth is vastly relevant to the case of Thailand. The country has implemented several fiscal and monetary policies over the two decades. However, the outcomes remain inconsistent. Thailand has experienced periods of effective economic stimulus followed by events of slow recovery and rising household debt (Sriring and Staporncharnchai, 2024; Wailerdsak and Suehiro, 2024). Recent empirical work confirms this uneven performance, showing that while monetary policy tends to be more consistent in sustaining growth, fiscal policy is more effective during recessions and when localized (Pastpipatkul and Ko, 2025). These mixed effects cannot be explained without looking at the institutional factors such as political instability and limited voice and accountability as well as corruption. Therefore, empirical analysis of how institutional quality influences the effectiveness of fiscal and monetary policies on economic growth is essential for explaining the growth dynamics in the Thai economy.
In this study, we use a two-step method to examine how institutional quality affects the link between macroeconomic policies and economic growth in Thailand, covering 84 quarters between Q1:2003 and Q4:2023. First, we apply Bayesian Additive Regression Trees (BART) and Bayesian Shrinking and Diffusing Priors (BASAD) models to choose the most important variables. They identify which input institutional and macroeconomic factors matter most for growth during studied periods. Next, we use the Time-varying Seemingly Unrelated Regression Equations (tvSURE) model to empirically explore how the effects of fiscal and monetary policies shift over time, with and without the inclusion of selected institutional quality indicators. This approach examines whether strong institutions improve the effectiveness of fiscal and monetary policies in sustaining growth.
2. Review of Relevant Studies
Institutions perform as a mediator between policy design and economic outcomes; consequently, sustainable growth depends not only on policy choices but also on the strength of the institutions that support them. Weak institutions increase corruption and inefficiency, while strong institutions cut transaction costs and lower uncertainty (Acemoglu, Johnson and Robinson, 2005). In developing countries, these effects have been obvious. In developing economies, FDI has positively correlated with economic growth only when institutional quality (IQ) has exceeded a certain threshold (Jude and Levieuge, 2016). They also concluded that institutional reforms have been necessary to unlock the growth benefits of FDI.
Fiscal policy influences long-term economic growth primarily through public spending and taxation. Keynes (1936) argued that government expenditure can stimulate demand during economic downturns. Marioli, Fatas and Vasishtha (2024) have supported this view but noted that fiscal policy is more volatile in emerging economies than in advanced ones. This reduces growth and clarifies part of the income gap across countries. However, Barro (1990) warned that excessive spending may force out private investment and potentially slow growth. Few empirical studies have been consistent with Barro’s (1990) concerns, emphasizing that the efficiency of government spending matters more than its size (Bléjer and Khan, 1984; Afonso and Furceri, 2010; Khan, Raza and Vo, 2024). In Thailand, public investment in electricity and infrastructure has raised GDP growth between 2003 and 2023. These effects have been stronger during periods of improved policy coordination and macroeconomic management (Pastpipatkul and Ko, 2025). While IQ has not been explicitly tested, the post-2003 reforms have highlighted a possible part of governmental improvements in enhancing fiscal policy outcomes.
On the other hand, monetary policy influences economic growth primarily through its channel of policy interest rates (Friedman and Schwartz, 1963). By adjusting these rates, central banks can stimulate investment and consumption or hold inflationary pressures. But then again, its effectiveness critically relies on institutional credibility because central bank independence is important for anchoring inflation expectations to stabilize output (Clarida, Gali and Gertler, 1999). Without strong institutions, monetary policy fails to deliver expected results. Evidently, Havi and Enu (2014) have validated that MP operation under weak governing institutions can lead to inflation without real economic gains. Rashid and Husain (2013) also stated the importance of good institutions to support effectiveness of MP in open and trade-dependent economies. For the case of Thailand, Pastpipatkul and Ko (2025) also found that MP has been more effective than FP in sustaining growth, especially during high-growth periods.
Given these points, the interaction between institutional quality and macroeconomic policy is fundamental to sustaining long-term economic stability and development. Institutions shape the design and outcomes of fiscal and monetary policies, while effective policy implementation, in turn, reinforces institutional strength and forms a condition that supports inclusive, resilient, and sustainable economic growth. But there has still been a clear gap in the existing literature. Few studies have focused on how IQ might affect the effects of fiscal and monetary policy on growth for different samples. Most of them have assumed institutions as fixed or secondary. This study takes a different approach. It uses quarterly time series dataset and advanced econometric methods to examine how IQ shapes policy outcomes in Thailand from Q1:2003 to Q4:2023. The findings offer new insights into how institutions shape the link between macroeconomic policy and economic growth for the case of a small open economy like Thailand.
3. Methods of Study
In this study, we have examined the role of institutional quality strengthening the effect of fiscal-monetary policy on the growth of Thai economy. For this primary objective, we have used the Time Varying Seemingly Unrelated Regression Equations (tvSURE) Model. Before this, we had first verified the reliability of variable inclusion for this analysis by employing a combination of Bayesian Additive Regression Trees (BART) and Bayesian Variable Selection with Shrinking and Diffusing Priors (BASAD) approach. We have employed BART and BASAD to detect the relative importance of institutional and macroeconomic covariates. The important variables have been selected based on the posterior inclusion probability exceeding 0.5 percentile to be consistent with Barbieri and Berger (2004). This methodological design has been chosen to not only address nonlinearity, model uncertainty but also temporal heterogeneity which are prominent in the analysis of policy efficacy.
3.1. Bayesian Additive Regression Trees (BART)
BART, a nonparametric Bayesian ensemble learning model, has approximated an unknown function by summing a set of regression trees. This model was originally proposed by Chipman et al. (2010), and it has been very useful particularly for nonlinear modeling, data-driven variable selection, and prediction under uncertainty. This model has been applied using the “bartMachine” R package developed by Kapelner and Bleich (2016). Assume a regression structure for continuous time series as:
where the unknown function f(.) is expressed as a sum of H trees with denoting the binary tree structure and the corresponding leaf parameters:
Unlike classical parametric regression models, BART has flexibly learned from the data without imposing a rigid functional form, and regularization has been achieved through the prior distributions on tree depth and leaf parameters which prevents overfitting. Posterior inference has been conducted based on a Metropolis within Gibbs algorithm, and variables with higher posterior inclusion probabilities have been retained from downstream modeling. In this way, BART has ensured that only the most influential covariates are selected in the subsequent structural analysis.
3.2. Bayesian Variable Selection with Shrinking and Diffusing Priors (BASAD)
Following the BART estimation, we apply BASAD model developed by Narisetty and He (2014) to determine the important input variables within a Bayesian framework. This model is well-suited for high-dimensional regression issues where the number of covariates is large relative to the sample size. The regression model (eq. 3) is specified with latent binary vector such that:
where is the coefficient vector. And, the prior on the inclusion vector is:
Shrinking and diffusing priors’ variances depend on the sample size n:
3.3. Time Varying Seemingly Unrelated Regression Equations (tvSURE)
As we have previously proposed, this study has used a tvSURE model to investigate the role of institutional quality influencing the dynamic effect of fiscal and monetary policies on economic growth in Thailand. This model is an extension of Zellner’s (1962) classical SURE model by allowing regression parameters to vary smoothly over time. The tvSURE has been applied using the “tvReg” R package developed by Casas and Fernandez-Casal (2022). This model has been a great fit for analyzing the dynamic relationships in macroeconomics and financial systems where the effects of explanatory variables such as fiscal, monetary and institutional proxies are expected to vary dynamically due to policy shifts, structural changes or economic crises. A tvSURE model has consisted of a system of M regression equations each with T observations.
where denotes the dependent variable for equation m at time t, denotes a vector of explanatory variables for equation m, denotes time-varying coefficients and denotes a zero-mean error term satisfying
The error terms are allowed to be contemporaneously correlated across equations but are uncorrelated across time. In a matrix form, the full system becomes:
where is the stacked M × 1 vector of dependent variables at time t, is a block-diagonal matrix of regressors for each of the M equations, is the full vector of time varying coefficients function, and the error vector has zero mean and time-varying covariance matrix .
We use a kernel-weighted local least squares specifically time-varying feasible generalized least squares (tvFGLS) estimator to estimate the coefficient function of the model which minimizes a smoothed sum of squared residuals across time.
where is a kernel function (e.g., Gaussian) and h is the bandwidth controlling the degree of smoothing. This method provides consistent and asymptotically normal estimates under standard regularity conditions.
In our empirical analysis, we have estimated a system of two equations: MPWIQ equation for the monetary policy and FPWIQ equation for the fiscal policy. Both equations have included interaction terms between institutional quality (IQ) and real GDP growth. This has helped us see how IQ changes the effects of monetary and fiscal policies on growth in Thailand from Q1:2003 to Q4:2023. Including these terms has let us capture how institutions and policies work together. The tvSURE model has estimated both equations at the same time. This has improved efficiency and accounted for links between monetary and fiscal policies.
4. Data and Findings
4.1. Data
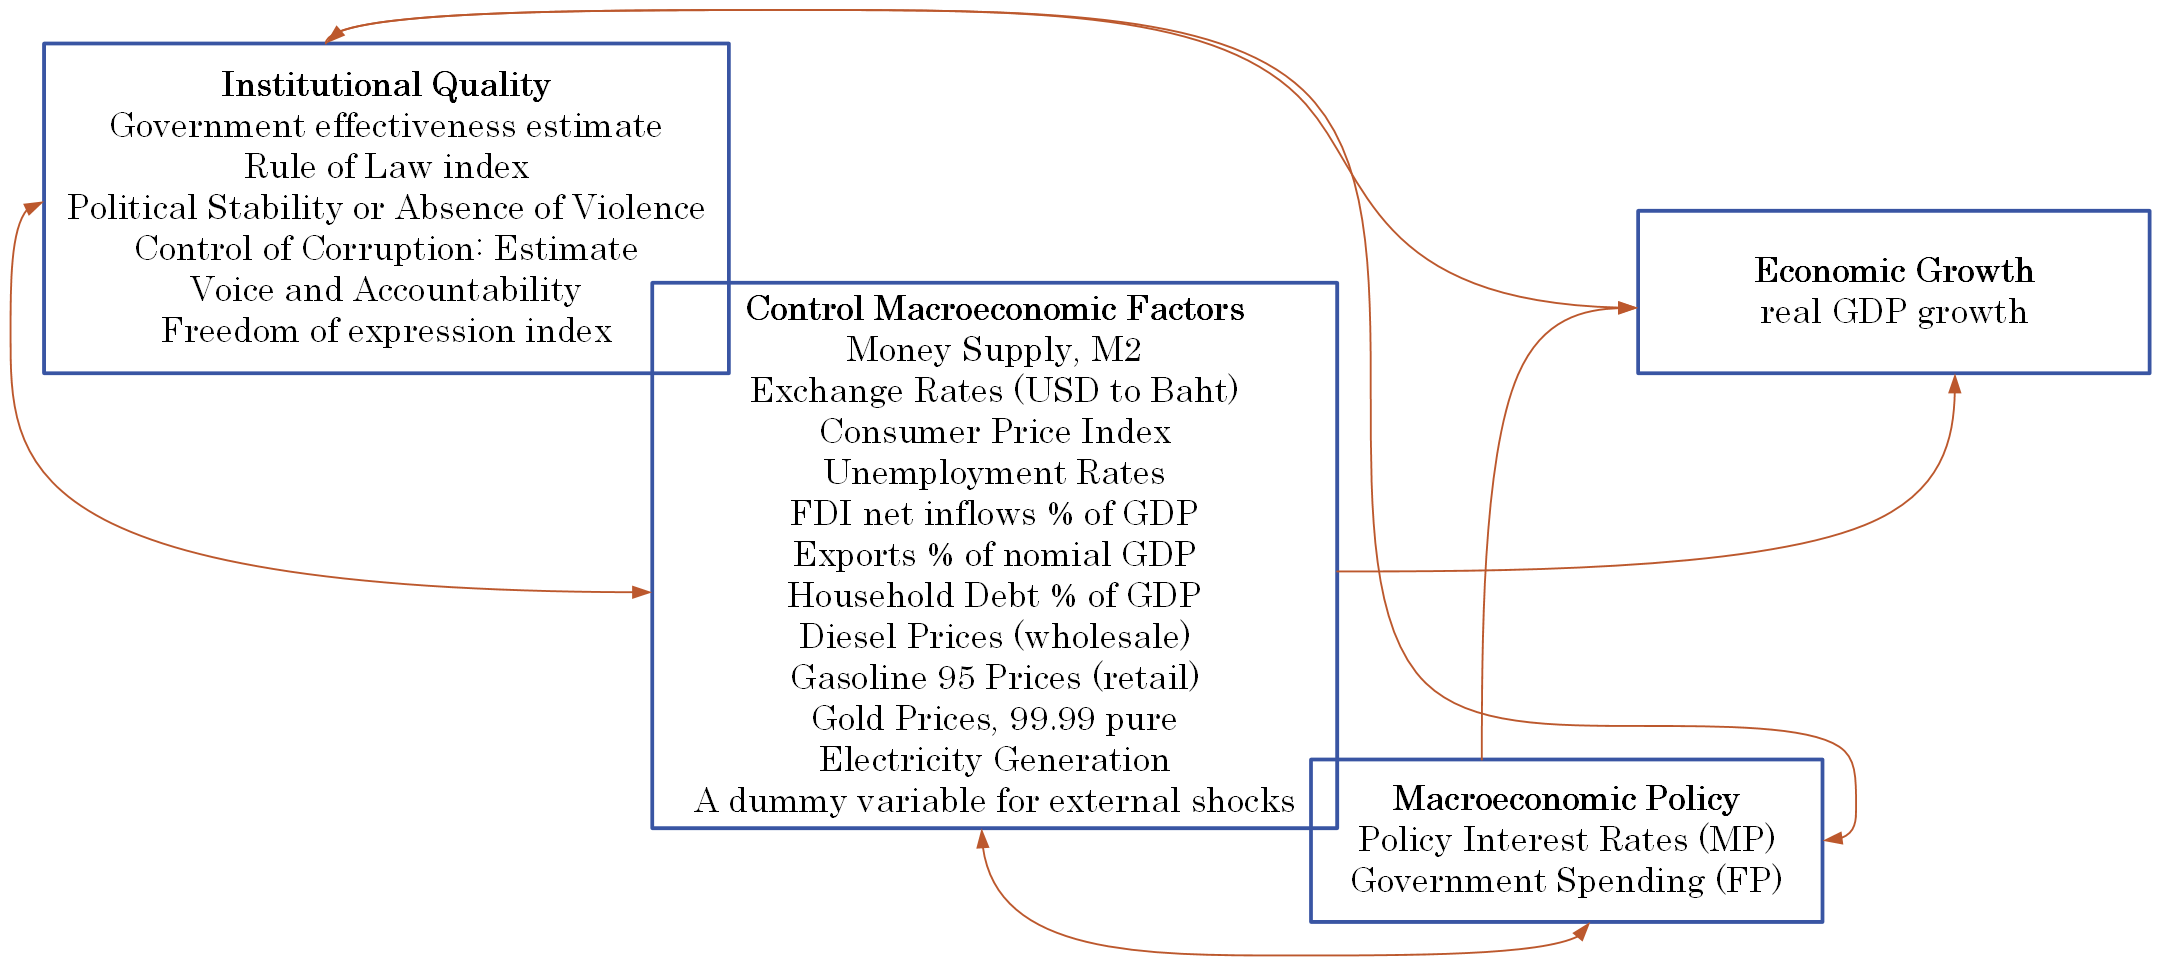
In this study, we use a quarterly dataset from Q1:2003 to Q4:2023 to assess the role of institutional quality influencing the effect of macroeconomic policies on economic growth in Thailand. We define real GDP growth rate as the dependent variable which is measured as the quarterly percentage change in real gross domestic product which reflects the inflation-adjusted quarterly shift in total economic output. We classify the independent variables into three main categories as institutional quality indicators, macroeconomic policy tools and control macroeconomic factors. We include six proxies namely government effectiveness, rule of law, political stability, control of corruption, voice and accountability, and freedom of expression to account for institutional quality. These proxies reflect the strength and inclusiveness of institutions and public trust, all of which have been linked to sustainable growth and policy effectiveness (Acemoglu and Robinson, 2012; Kaufmann, Kraay and Mastruzzi, 2011; Rodrik, Subramanian and Trebbi, 2004). We consider policy interest rates variable representing the primary monetary policy instrument and government expenditure serving as the main fiscal policy tool both of which influence aggregate demand and economic stability (Mishkin, 2016; Alesina et al., 2017). We also incorporate a wide set of macroeconomic control variables to account for the diverse drivers of Thai economy. Financial conditions are proxied by broad money (M2), exchange rates (USD/THB), consumer price index, unemployment rates which echo monetary transmission, inflation, currency stability and labor market performance (Bildirici et al., 2016; Rose, 1966; Mundell, 1997; Cottrell, 1997; Carvalho, Ribeiro and Marques, 2018). Additionally, we include household debt along with electricity generation to serve as financial vulnerability and infrastructure quality respectively (Mian and Sufi, 2014; Stern and Kander, 2012). We further control external sector dynamics and global volatility through foreign direct investment inflows, exports, gold prices, fuel (diesel and gasoline) prices, and a dummy variable accounting for Covid-19 pandemic and 2008 financial crisis (Fei and Adibe, 2010; Berk and Yetkiner, 2014; Poshakwale and Ganguly, 2015). In order to provide robust findings, we employ a combination of two Bayesian variable selection methods which of both identify the most variables with posterior probabilities exceeding 0.5 on the growth of Thai economy.
4.2. Findings
Bayesian variable selection methods were first applied to find which input variables were most important in explaining economic growth for the case of Thailand from 2003: Q1 to 2023: Q4. We determined which institutional quality indicators and macroeconomic control variables should be included for the econometric model computation based on the estimated results. The selected variables from both institutions and macroeconomic dimensions were incorporated into the tvSURE model to examine how institutional quality moderates the relationship between macroeconomic policies and economic growth. Table 1 and Table 2 list the most important variables identified by the BART model, BASAD model, and a combination approach.
4.2.1. Variable Selection Results by Using BART and BASAD Methods
This study identified voice and accountability and control of corruption as the most relevant and important institutional quality indicators (see Table 1, combination results). The importance of voice and accountability and control of corruption reveals the prominent role of governance in sustaining growth. These two IQ proxies directly influence the integrity of policies and regulations as well as sustainable growth for the period between 2003: Q1 and 2023: Q4. This finding discloses that improvements in securing political inclusiveness and lowering corruption are essential to promote the efficacy of macroeconomic policies for the Thai economy. On the macroeconomic side, the variables log exports, log gold prices, log household debt and log electricity generation emerged as key control factors for this study (see Table 2, combination results). The combination selection findings of the importance of exports reaffirm the status of Thailand as an open economy reliant on global trade. The finding of importance of gold prices on growth indicates the investor sentiment to commodity price fluctuations. The finding of importance of household debt emphasizes the dual role of credit conditions because excessive debt may weigh on financial instability while moderate household indebtedness fuels consumption resulting in growth in the short term. Lastly, the importance of electricity generation underscores the need for reliable energy supply to not only support the quality of daily life but also industrial and total productivity. In sum, these estimated results showed that institutional quality and macroeconomic fundamentals jointly associated with the performance of the Thai economy. The final selected IQ proxies were multiplied by real GDP growth for the robustness of their moderating effects on the policy-growth nexus.
4.2.3. tvSURE Estimation Results Without and With Institutional Quality Proxies
This section discusses the empirical findings of the study on how institutional quality (IQ) influenced macroeconomic policy-driven growth in Thailand over the period from Q1:2003 to Q4:2023, based on tvSURE model estimations. The results were visualized in Figures 1 to 16, and all figures incorporated 90 percent bootstrap confidence intervals based on 100 runs to ensure robust findings. The analysis was disaggregated into monetary policy (Figures 1–8), denoted MPWIQ, and fiscal policy (Figures 9–16), denoted FPWIQ. The final selected IQ proxies by the combination of BART and BASAD models were transformed into interaction terms (IQ proxies × real GDP growth). The inclusion of interaction terms explores their moderating effects on the growth–macroeconomic policy correction.
Policy interest rates (interest) positively affected economic growth especially during around Q2:2013 to Q4:2013 and again around Q4:2014 to Q1:2015 with effects between 0.1 and 0.2 (Figure 2). Outside these periods, their impact was mostly neutral. The interaction term of voice and accountability (fvocnacc) showed large fluctuations over the years, with some quarters sustaining growth and other times slowing it (Figure 3). The second interaction term of IQ proxy, control of corruption, generally had a negative effect on growth throughout the period except for a brief positive influence around Q1:2017 (Figure 4). Exports mostly supported growth except during around Q2:2014 to Q4:2014, Q4:2015 and late 2021 to 2023 when their effects weakened (Figure 5). Gold prices negatively affected growth in 2007, 2009, and again in late 2022 (Figure 6). Household debt increased its positive impact on growth until about Q1:2019 then stabilized, while electricity generation dipped mid-period but rose again by Q4:2023. This indicates increasing support for growth.
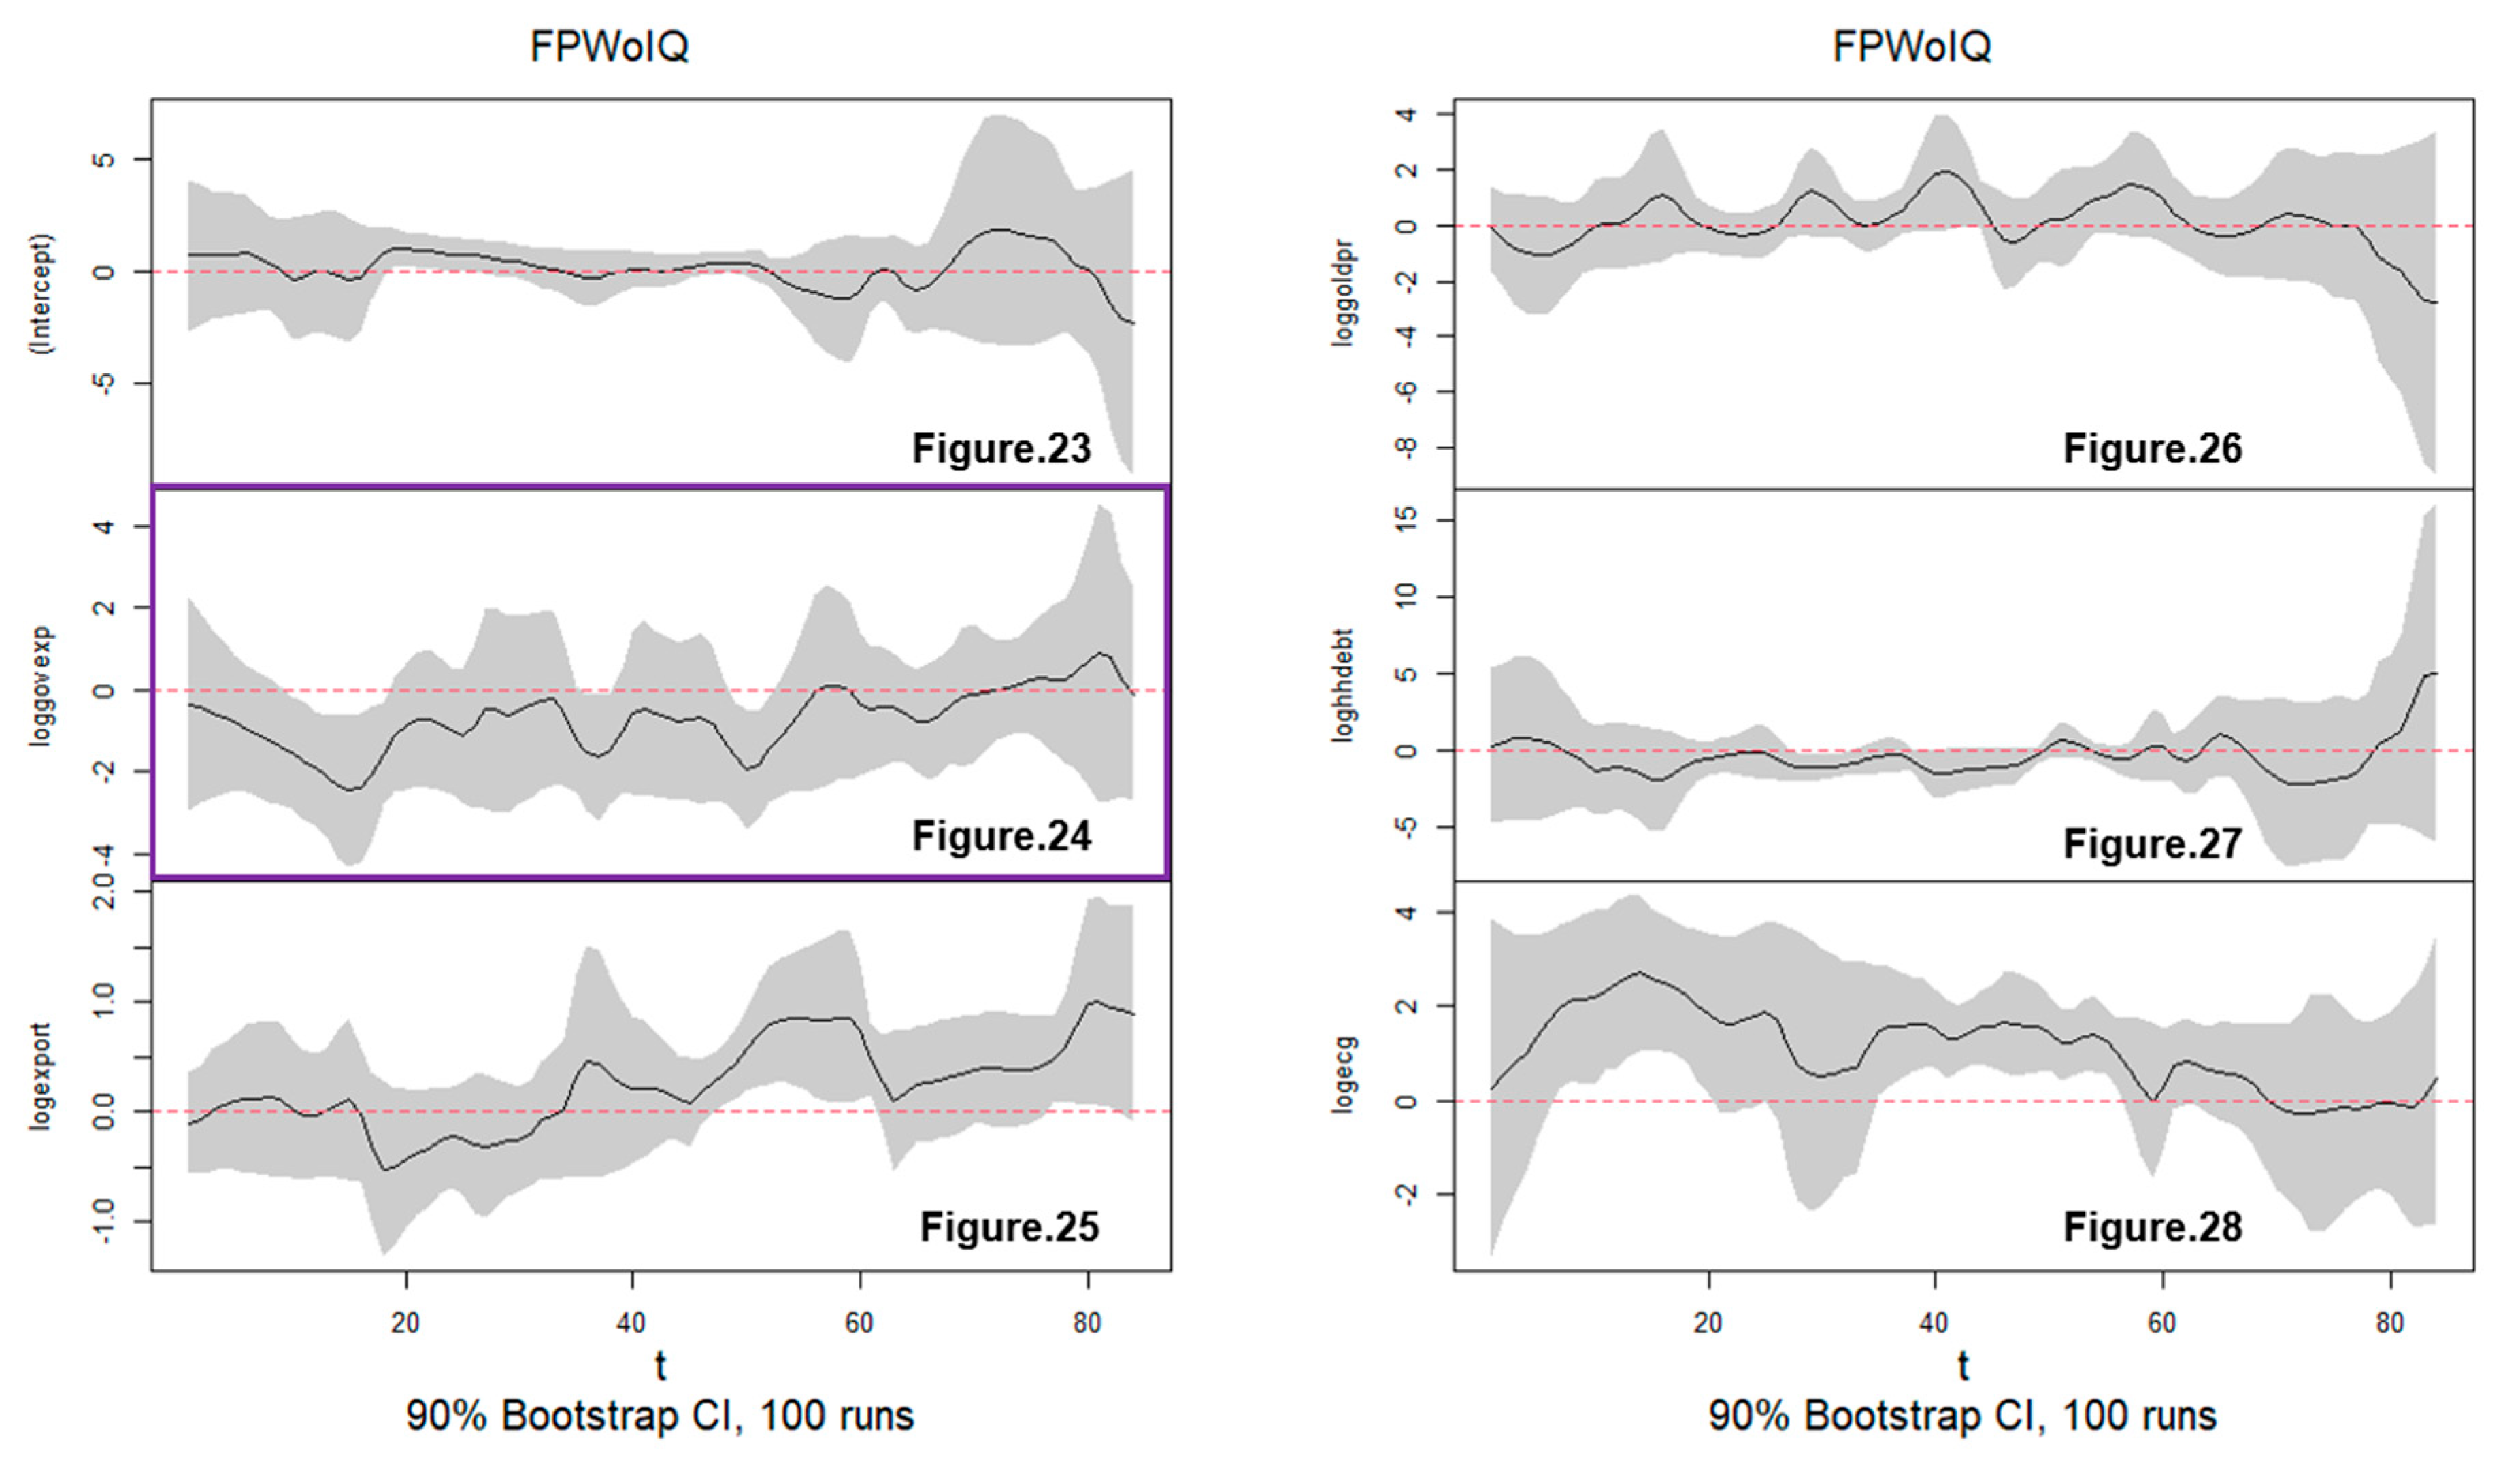
Fiscal policy (loggovexp) showed a different pattern. It remained frequently neutral in its effect on growth throughout the entire period from Q1:2003 to Q4:2023 with minimal fluctuations. The interaction term of IQ proxy (voice and accountability) displayed strong fluctuations with positive effects around Q4:2007 to Q2:2008, Q2:2012 to Q3:2012, and Q2:2022 to Q2:2023, while showing negative effects during other times. The other interaction term of IQ proxy, control of corruption, consistently showed a negative relationship with growth except for a brief positive effect around Q1:2017. Exports (Figure 13) mostly supported growth but weakened during Q1:2014 to Q4:2014, Q1:2017 to Q2:2017 and Q2:2022 to Q4:2023. Gold prices (Figure 14) also had a slight negative impact on growth with a more noticeable drop to about -0.3 in the last quarters of the study around Q2:2022 to Q4:2023.
In sum, these results showed monetary policy worked differently over time. Interest rates helped growth only in some periods. This shows changing policy effects. External shocks or local confidence may explain this. Institutions also shape policy results. Their effects are not stable. The effect of voice and accountability on growth changes over time. Control of corruption negatively affects economic growth. These may come from high costs without other reforms while they reveal the swings in public trust and political stability.
Besides, growth in exports improves growth but the effect is time varying. This shows risk from shocks of global trade. Gold prices fall when growth rises. During crises, this may show fear, while rising household debt tends to have a positive effect on growth. Electricity generation may reveal the quality of infrastructure. Its rise comes late but may promote long-term growth. Fiscal policy shows weak time effects. This may mean poor systems or slow results. Its link with institutions also changes. This may indicate a need for better governance institutions. Overall, stronger policy coordination is needed. Monetary, fiscal, and institutional tools must work together to support growth. These quarterly findings from Q1:2003 to Q4:2023 provide a broad understanding of the role of governance in economic resilience and effective policy design in Thailand for long-run and sustainable economic growth. This could be similar in emerging economies, as Thailand is an emerging economy.
In addition, the comparison between models with and without the moderating role of IQ proxies showed some changes in the estimated effects of macroeconomic policies and economic growth. The tvSURE model estimates without IQ proxies revealed that policy interest rates (Figure 18) had significant negative effects on growth around Q2:2013 to Q1:2015. The effect fluctuated throughout the study period. In the model with IQ proxies (Figure 2), this effect was flatter and remained close to zero throughout the sample quarters. In fact, it positively affected economic growth especially during around Q2:2013 to Q4:2013 and again around Q4:2014 to Q1:2015 with effects between 0.1 and 0.2 (Figure 2). Similarly, fiscal policy measured by government expenditure (Figure 24) in the model without IQ proxies had large and consistent negative effects especially from Q2:2010 to Q4:2018. When IQ proxies were included (Figure 10), the effects of government expenditure exposed a different pattern. It remained frequently neutral, exhibiting around zero in its effect on economic growth from Q1:2003 to Q4:2023 with very low fluctuations.
These findings support the importance of institutional quality in shaping the effectiveness of macroeconomic policies. Moreover, models that omit IQ proxies tend to exaggerate both the magnitude and stability of policy effects. These findings confirm that the inclusion of institutions leads to more realistic estimates. This study thus concludes that strong institutions are essential for effective public policy performance and sustainable growth for the Thai economy between 2003 and 2023.
Figure 1–8.
The Role of Institutional Quality on the Monetary Policy and Growth Correlation in Thailand (Q1:2003 – Q4:2023). Notes: Figure 1 is intercept term of the model; Figure 2 is monetary policy (policy interest rates) affecting growth; Figures 3 and 4 presents institutional quality proxies (IQ) × Growth terms affecting growth; Figure 5 is logged exports affecting growth; Figure 6 is logged gold prices affecting growth; Figure 7 is logged household debt, and Figure 8 is logged electricity generation affecting growth.
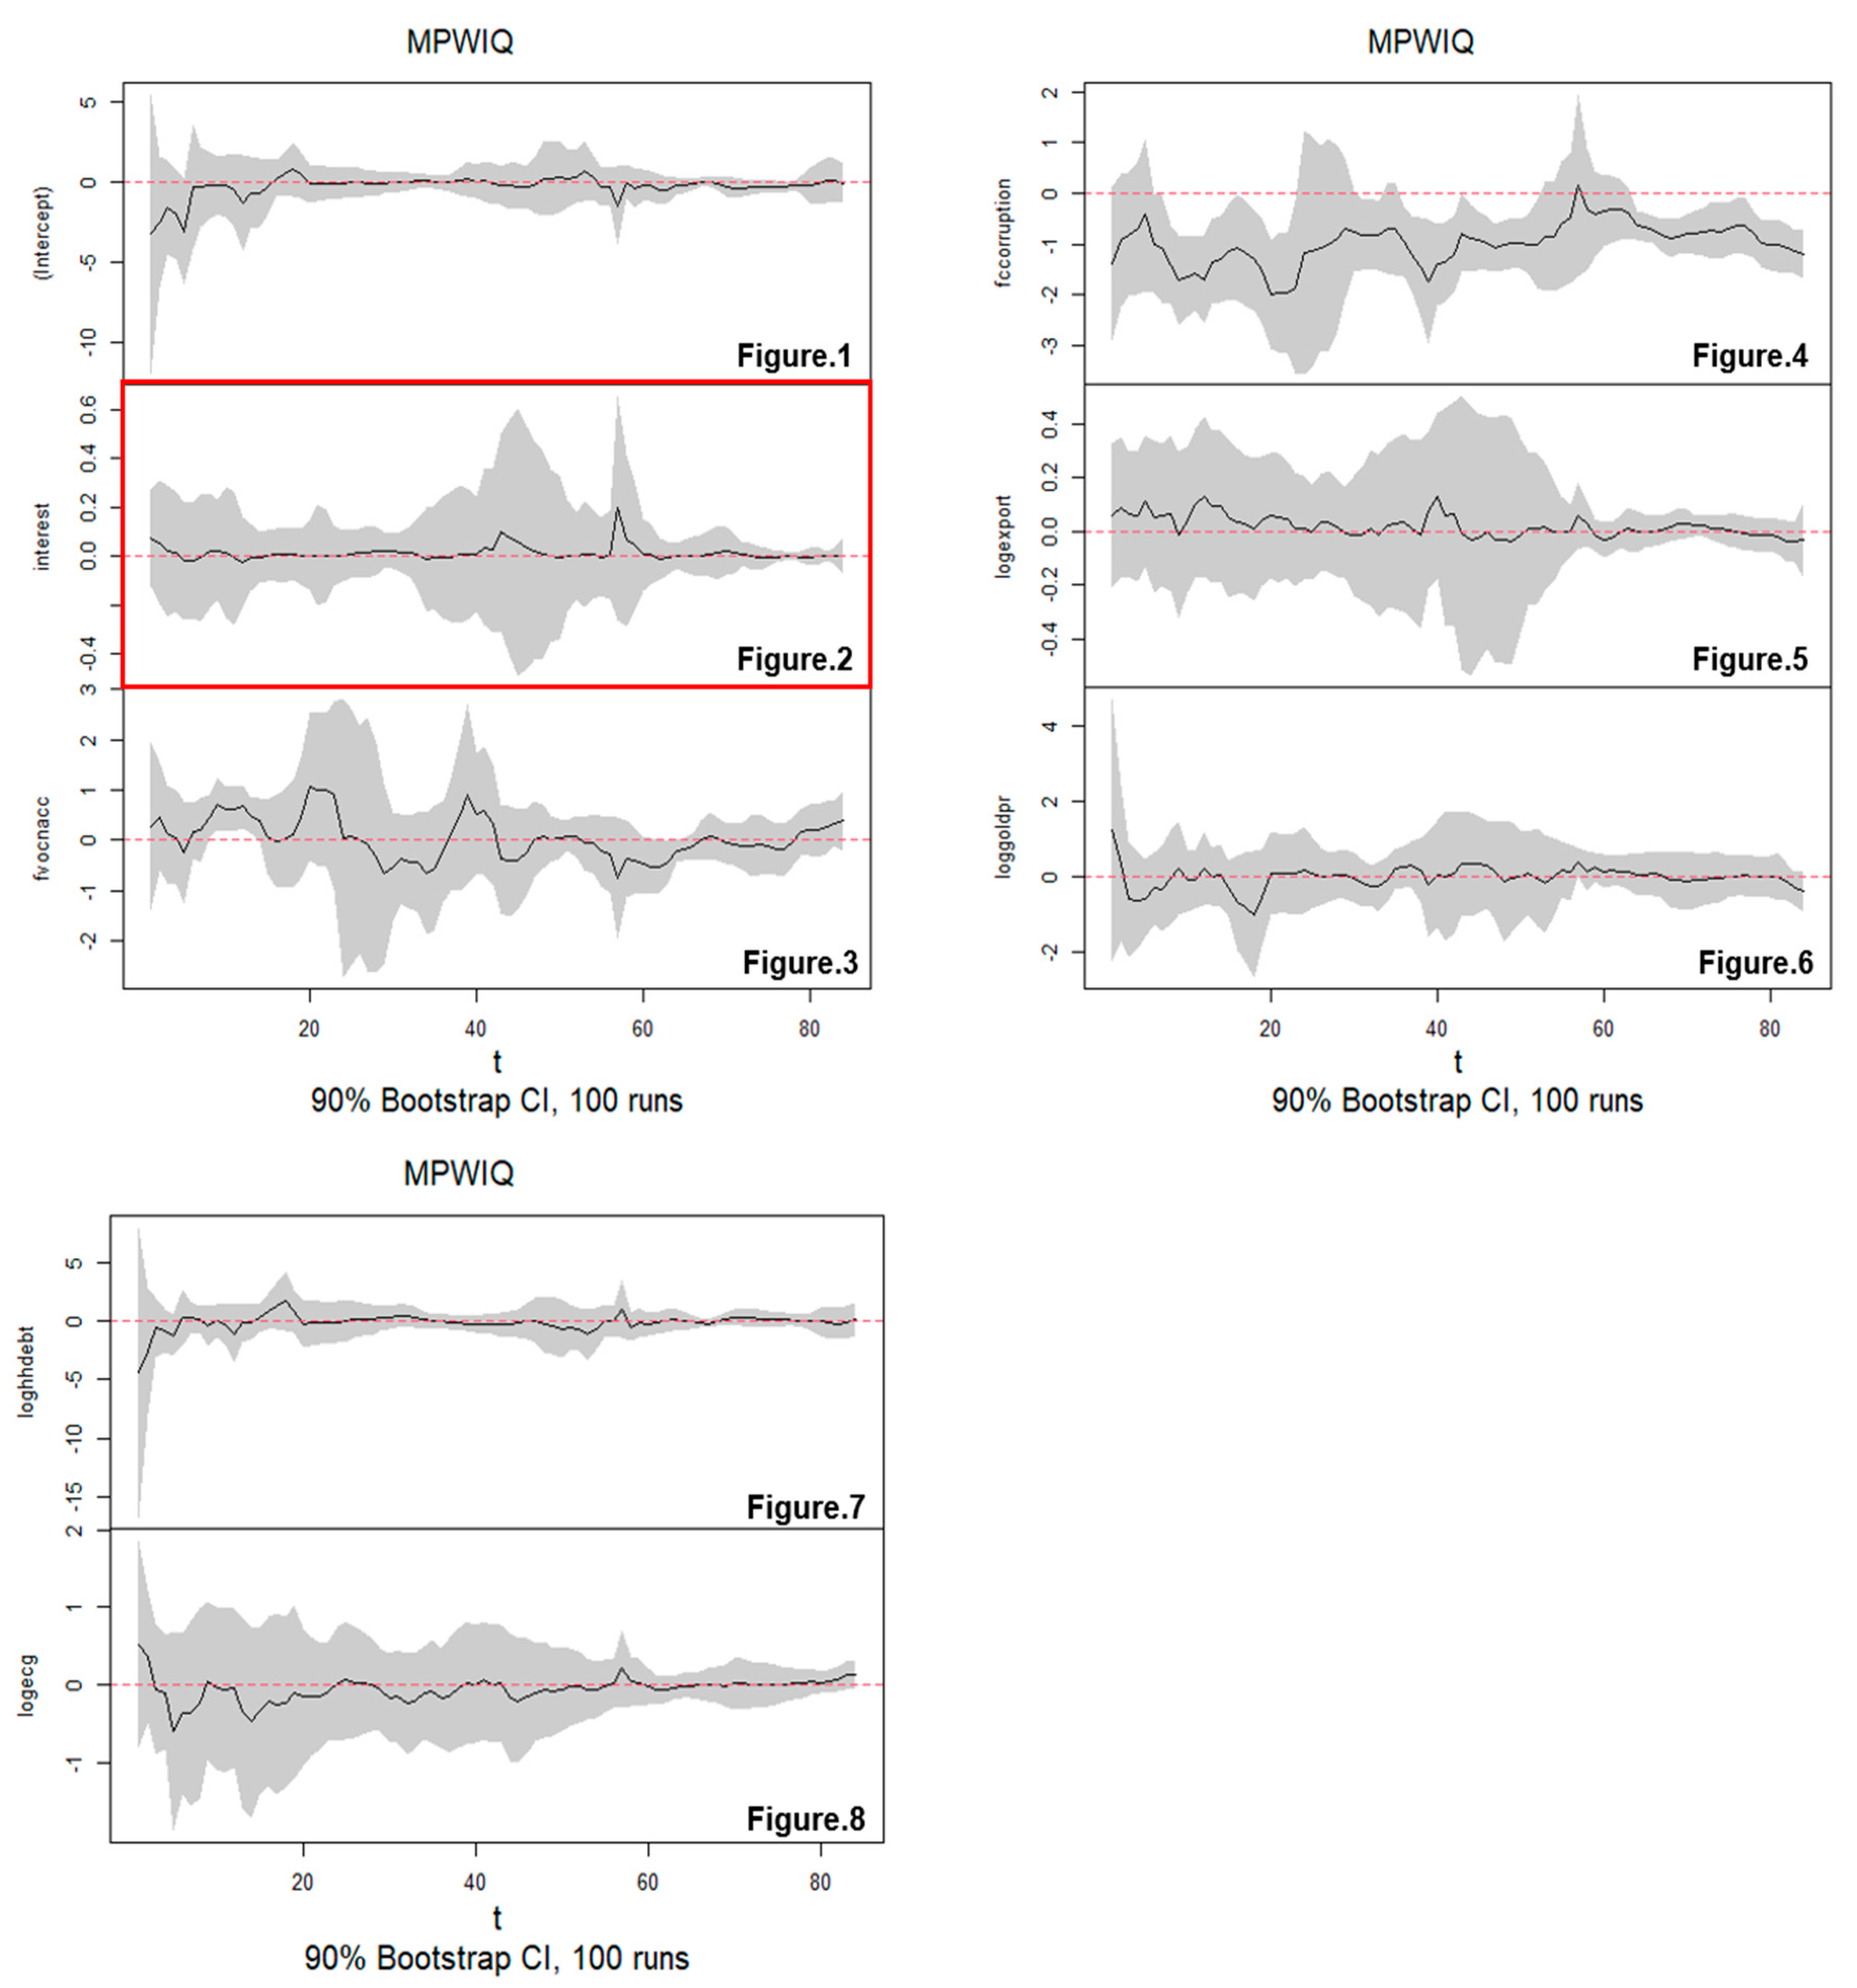
Figure 9–16.
The Role of Institutional Quality on the Fiscal Policy and Growth Correlation in Thailand (Q1:2003 – Q4:2023). Notes: Figure 9 is intercept term of the model; Figure 10 is fiscal policy (logged government expenditure) affecting growth; Figures 11 and 12 presents institutional quality proxies (IQ) × Growth terms affecting growth; Figure 13 is logged exports affecting growth; Figure 14 is logged gold prices affecting growth; Figure 15 is logged household debt, and Figure 16 is logged electricity generation affecting growth.
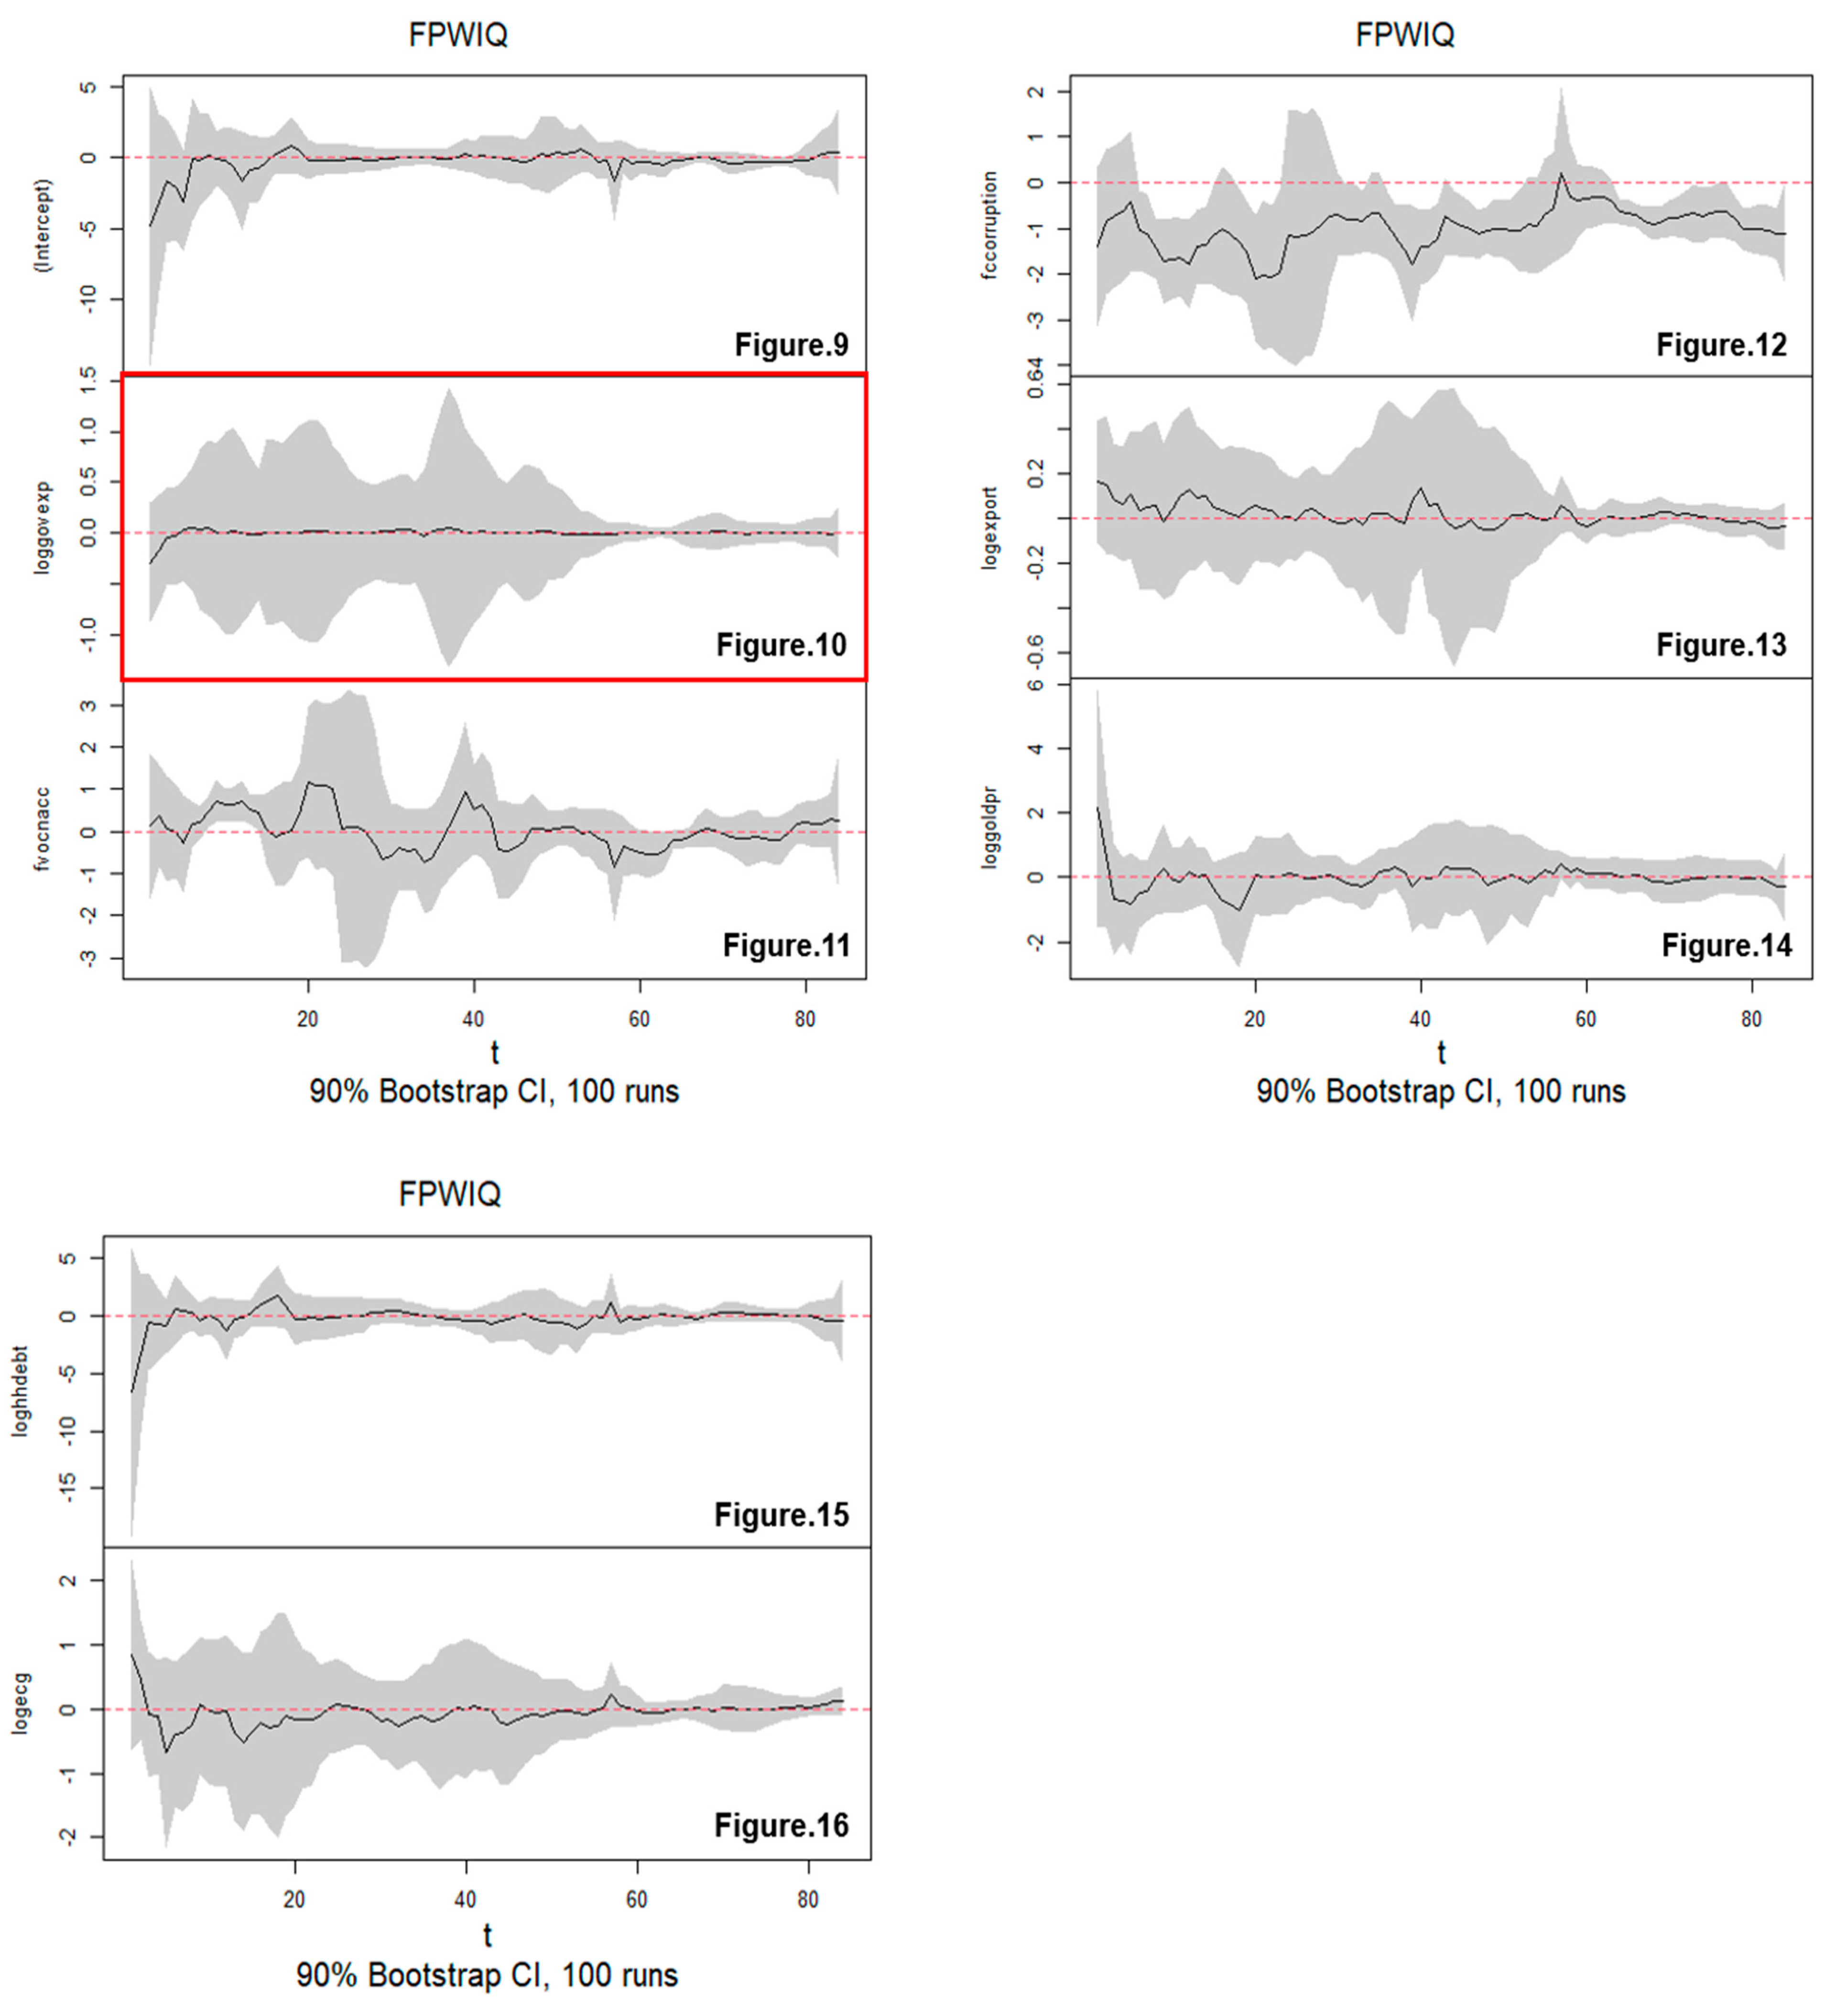
Figure 17–22.
The Monetary Policy and Growth Correlation in Thailand (Q1:2003 – Q4:2023). Notes: Figure 17 is intercept term of the model; Figure 18 is monetary policy (interest) affecting growth; Figures 19 is logged exports affecting growth; Figure 20 is logged gold prices affecting growth; Figure 21 is logged household debt, and Figure 22 is logged electricity generation affecting growth.
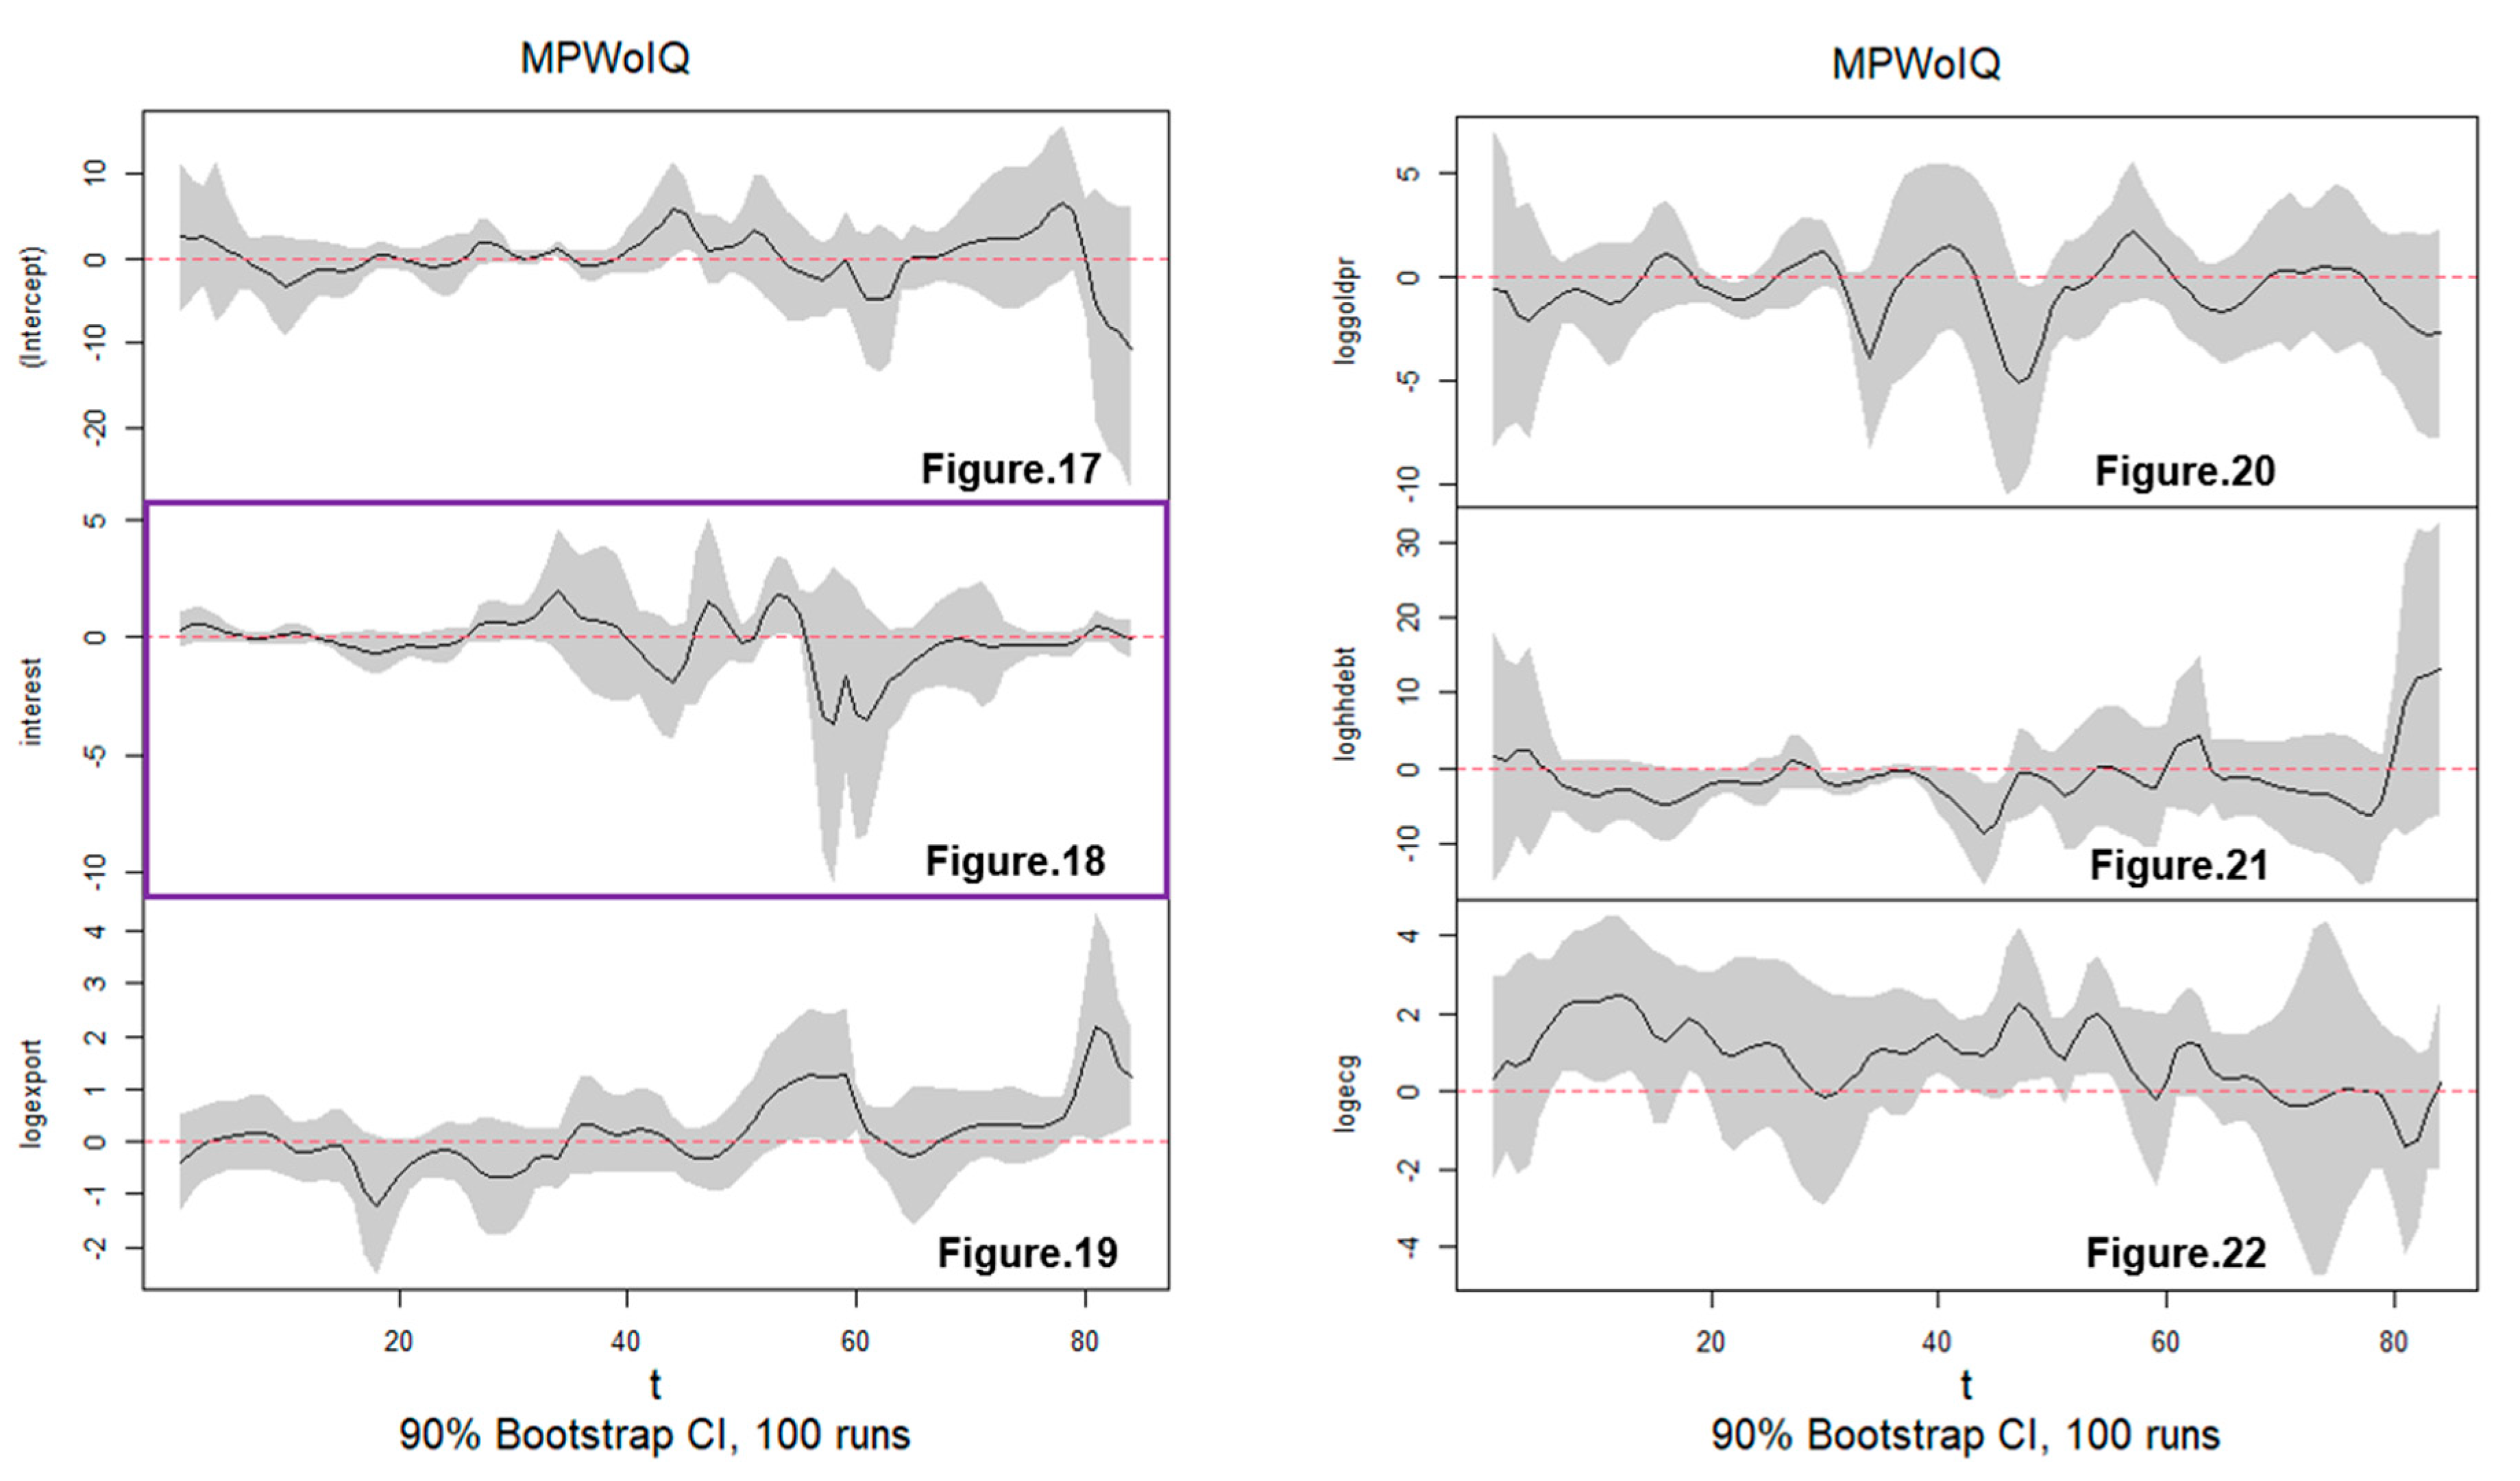
Figure 23–28.
The Fiscal Policy and Growth Correlation in Thailand (Q1:2003 – Q4:2023). Notes: Figure 23 is intercept term of the model; Figure 24 is monetary policy (interest) affecting growth; Figures 25 is logged exports affecting growth; Figure 26 is logged gold prices affecting growth; Figure 27 is logged household debt, and Figure 28 is logged electricity generation affecting growth.
5. Conclusions, Implications and Limitations
This study investigates the time-varying effects of fiscal and monetary policy on economic growth in Thailand for the period from Q1:2003 to Q4:2023. A system of two equations is estimated using the tvSURE model for the moderating role of IQ on the effectiveness of policy implementation on sustainable growth. This study shows that IQ proxies like voice and accountability, and control of corruption are key determinants of how well fiscal and monetary policies support economic growth in Thailand from 2003 to 2023. Using the Time-Varying Seemingly Unrelated Regression Equations (tvSURE) model with Bayesian variable selection methods (BART and BASAD), we find these institutional factors are the most important variables in strengthening and stabilizing the effect of monetary and fiscal policies on growth. Macroeconomic controls such as exports, gold prices, household debt, and electricity generation also play significant roles.
The main results show that policy impacts vary over time. Interest rates positively influence growth during specific periods (notably around 2013 and 2014–2015) but remain neutral at other times. Voice and accountability demonstrate fluctuating effects on growth, and control of corruption mostly exerts a negative influence except for a brief positive phase around early 2017. Exports consistently support growth though their impact weakens during certain quarters. Gold prices have a negative effect during global market shocks. Household debt boosts growth until around 2019 before stabilizing, while the positive effect of electricity supply rises at the end of the study period. Fiscal policy, measured by government expenditure, shows minimal direct impact on growth with effects remaining largely neutral throughout the study period. The negative and variable effects of corruption control highlight potential governance challenges. These findings emphasize the essential role of strong institutions in enhancing the efficacy of macroeconomic policies. Greater voice and accountability and strong control of corruption can stabilize policy impacts and support economic resilience. The comparison also reveals that excluding IQ proxies results in overstated and more volatile policy impacts. This study adds empirical evidence about strong IQ on the economic resilience in emerging markets.
he findings of this study have practical implications for the Thai government and policymakers. They highlight the need to adopt appropriate tools and frameworks to strengthen institutions. Improving political inclusiveness and enhancing efforts to control corruption can maximize the effectiveness of macroeconomic policies. Stabilizing the positive effects of interest rates and export growth depends on a strong governance framework. The negative trends related to household debt and electricity generation signal the importance of careful debt management and investment in energy infrastructure supported by robust institutions. Although these findings are specific to Thailand, they may also be relevant to other emerging economies with similar encounters.
In this study, the analysis only includes the selected variables from a mix-order approach of BART and BASAD for accounting institutional quality and macroeconomic fundamentals. This may not perfectly echo the theoretical constructs. Future research could benefit from considering other factors. Besides, using econometric alternatives to the tvSURE model in exploring the nonlinear relationships may provide further insights into the policy-growth nexus, as the performance of this model may depend on the chosen variables and its specification. This study does not confirm causal direction but time-varying associations. Even though the use of quarterly data studies the short-run dynamics effectively, future research may benefit from particularly applying models which are capable of capturing both short-/long-run relationships such as nonlinear ARDL. These findings are limited to the case of the Thai economy for the specific periods. The complex effects involving electricity generation suggest that policies must fit each country’s governance strengths and weaknesses. Future studies should test this model in other Southeast ASEAN countries by adding more institutional factors and look at possible nonlinear effects using advanced methods. The negative trend in electricity generation’s impact after 2017 needs further study to conduct, including energy policies and green technologies.
Appendix A

Table A1.
Symbols, Units of Measurement and Sources of Data Used in This Study.
| Symbols | Variables | Units | Sources |
|---|---|---|---|
| gdpr | Real GDP Growth Rates | % | CEIC |
| interest | Policy Interest Rates | % | CEIC |
| loggovexp | Log Government Expenditure | USD million | CEIC |
| geffect | Government Effectiveness: Estimate | (-)2.5 to (+)2.5 | CEIC |
| rulenlaw | Rule of Law Index | 0 to 1 | OWID |
| polstable | Political Stability or Absence of Violence | (-)2.5 to (+)2.5 | CEIC |
| ccorruption | Control of Corruption: Estimate | (-)2.5 to (+)2.5 | OWID |
| vocnacc | Voice and Accountability | 0 to 1 | OWID |
| freenexpr | Freedom of Expression Index | 0 to 1 | OWID |
| logmsupply2 | Log Money Supply, M2 (broad money) | USD million | CEIC |
| logexr | Log Exchange Rates (1 USD to Baht) | USD to Baht | CEIC |
| loggovrev | Log Government Revenue | USD million | CEIC |
| loggovdebt | Log Government Debt | USD million | CEIC |
| logcpi | Log Consumer Price Index | 2019=100 | CEIC |
| unemp | Unemployment Rates % of Total Population | % | CEIC |
| fdi | Foreign Direct Investment, net inflows % of Nominal GDP | % | CEIC |
| logexport | Log Exports % of Nominal GDP | % | CEIC |
| loghhdebt | Log Household Debt % of GDP | % | CEIC |
| dieselpr | Diesel Price, wholesale price | USD | CEIC |
| gasolinepr | Gasoline 95 price, retail price | USD | CEIC |
| loggoldpr | Log Gold Price, 99.99 % pure | USD | CEIC |
| logecg | Log Electricity Generation, Gwh Total | Gwh | CEIC |
| dummy | Dummy variable accounting for external shocks | 0 and 1 | CEIC |
| fcovnacc | vocnacc multiply by gdpr | multiplication | Own**** |
| fccorruption | fccorruption multiply by gdpr | multiplication | Own**** |
Notes: The dummy variable accounts for major external shocks namely Covid-19 pandemic and 2007-08 Global Financial Crisis. We log-transformed variables where appropriate to stabilize variance and ensure robust findings of the results, and the dataset contains no missing values. CEIC refers to data from https://ceicdata.com and OWID refers to data from https://ourworldindata.org, both of which are publicly accessible open data sources. The interaction term GDP growth × IQ proxies is calculated by authors using raw data from CEIC and OWID.
Table A2.
Summary Statistics of Variables of This Study.
| Variable | Mean | Median | Minimum | Maximum | Std. Dev. | Skewness | Ex. Kurtosis | Interquartile Range |
|---|---|---|---|---|---|---|---|---|
| gdpr | 3.1317 | 3.3750 | -12.180 | 15.470 | 3.7424 | -0.68020 | 3.7818 | 3.2450 |
| interest | 2.0264 | 1.6700 | 0.50000 | 5.0000 | 1.0970 | 0.87770 | 0.32718 | 1.4800 |
| loggovexp | 4.1407 | 4.2176 | 3.6418 | 4.3875 | 0.20703 | -0.86513 | -0.46971 | 0.30756 |
| geffect | 0.22220 | 0.22571 | 0.083291 | 0.41795 | 0.080061 | 0.32584 | 0.0025832 | 0.097674 |
| rulenlaw | -0.048348 | -0.028231 | -0.26005 | 0.24487 | 0.14398 | 0.19233 | -1.0860 | 0.23812 |
| polstable | -0.88267 | -0.90639 | -1.4428 | -0.14508 | 0.36721 | 0.30087 | -0.87428 | 0.55526 |
| ccorruption | -0.40417 | -0.44063 | -0.55597 | -0.19602 | 0.093529 | 0.89030 | 0.060720 | 0.11166 |
| vocnacc | -0.57801 | -0.56250 | -1.0455 | 0.21820 | 0.35175 | 0.65563 | -0.21631 | 0.41610 |
| freenexpr | 0.49838 | 0.52100 | 0.26100 | 0.68500 | 0.14195 | -0.38345 | -1.2007 | 0.17200 |
| logmsupply2 | 5.6149 | 5.6905 | 5.1982 | 5.8835 | 0.20749 | -0.53989 | -0.98156 | 0.34426 |
| logexr | 1.5322 | 1.5228 | 1.4744 | 1.6309 | 0.040790 | 0.74422 | -0.33087 | 0.052484 |
| loggovrev | 3.6805 | 3.7303 | 3.2643 | 3.9296 | 0.17146 | -0.74824 | -0.49060 | 0.25433 |
| loggovdebt | 5.0275 | 5.0733 | 4.5867 | 5.4440 | 0.25699 | -0.10255 | -1.0399 | 0.41024 |
| logcpi | 1.9711 | 1.9775 | 1.9159 | 2.0192 | 0.031571 | -0.33466 | -1.1671 | 0.053644 |
| unemp | 1.2770 | 1.1400 | 0.47000 | 2.8700 | 0.52894 | 1.0711 | 0.75480 | 0.67250 |
| fdi | 2.4508 | 2.8750 | -7.9900 | 6.4700 | 2.2625 | -1.7669 | 5.8991 | 2.1775 |
| logexport | 1.8154 | 1.8232 | 1.6746 | 1.8942 | 0.037011 | -1.3750 | 3.2059 | 0.036898 |
| loghhdebt | 1.8295 | 1.8939 | 1.6085 | 1.9800 | 0.12401 | -0.47461 | -1.3523 | 0.21401 |
| dieselpr | 0.78095 | 0.84500 | 0.33000 | 1.1200 | 0.19798 | -0.89891 | -0.013304 | 0.24750 |
| gasolinepr | 1.0676 | 1.1150 | 0.38000 | 1.6100 | 0.32350 | -0.44085 | -0.49876 | 0.37000 |
| loggoldpr | 2.7101 | 2.7759 | 2.2178 | 2.9717 | 0.21674 | -0.93265 | -0.26300 | 0.27617 |
| logecg | 4.6370 | 4.6550 | 4.4474 | 4.7797 | 0.083159 | -0.42647 | -0.96905 | 0.14250 |
| dummy | 0.22619 | 0.0000 | 0.0000 | 1.0000 | 0.42088 | 1.3090 | -0.28664 | 0.0000 |
| fcovnacc | -1.4169 | -1.5195 | -6.0942 | 9.8573 | 2.5120 | 1.1678 | 3.5949 | 3.1292 |
| fccorruption | -1.1465 | -1.3657 | -6.1478 | 5.8928 | 1.4947 | 1.2009 | 6.4203 | 1.0301 |
Notes: Mean shows average; median indicates central value. Minimum and maximum define the range. Standard deviation measures spread. Skewness reflects asymmetry; kurtosis indicates tail weight. Interquartile range represents the middle 50% spread.
Appendix B
Figure A1.
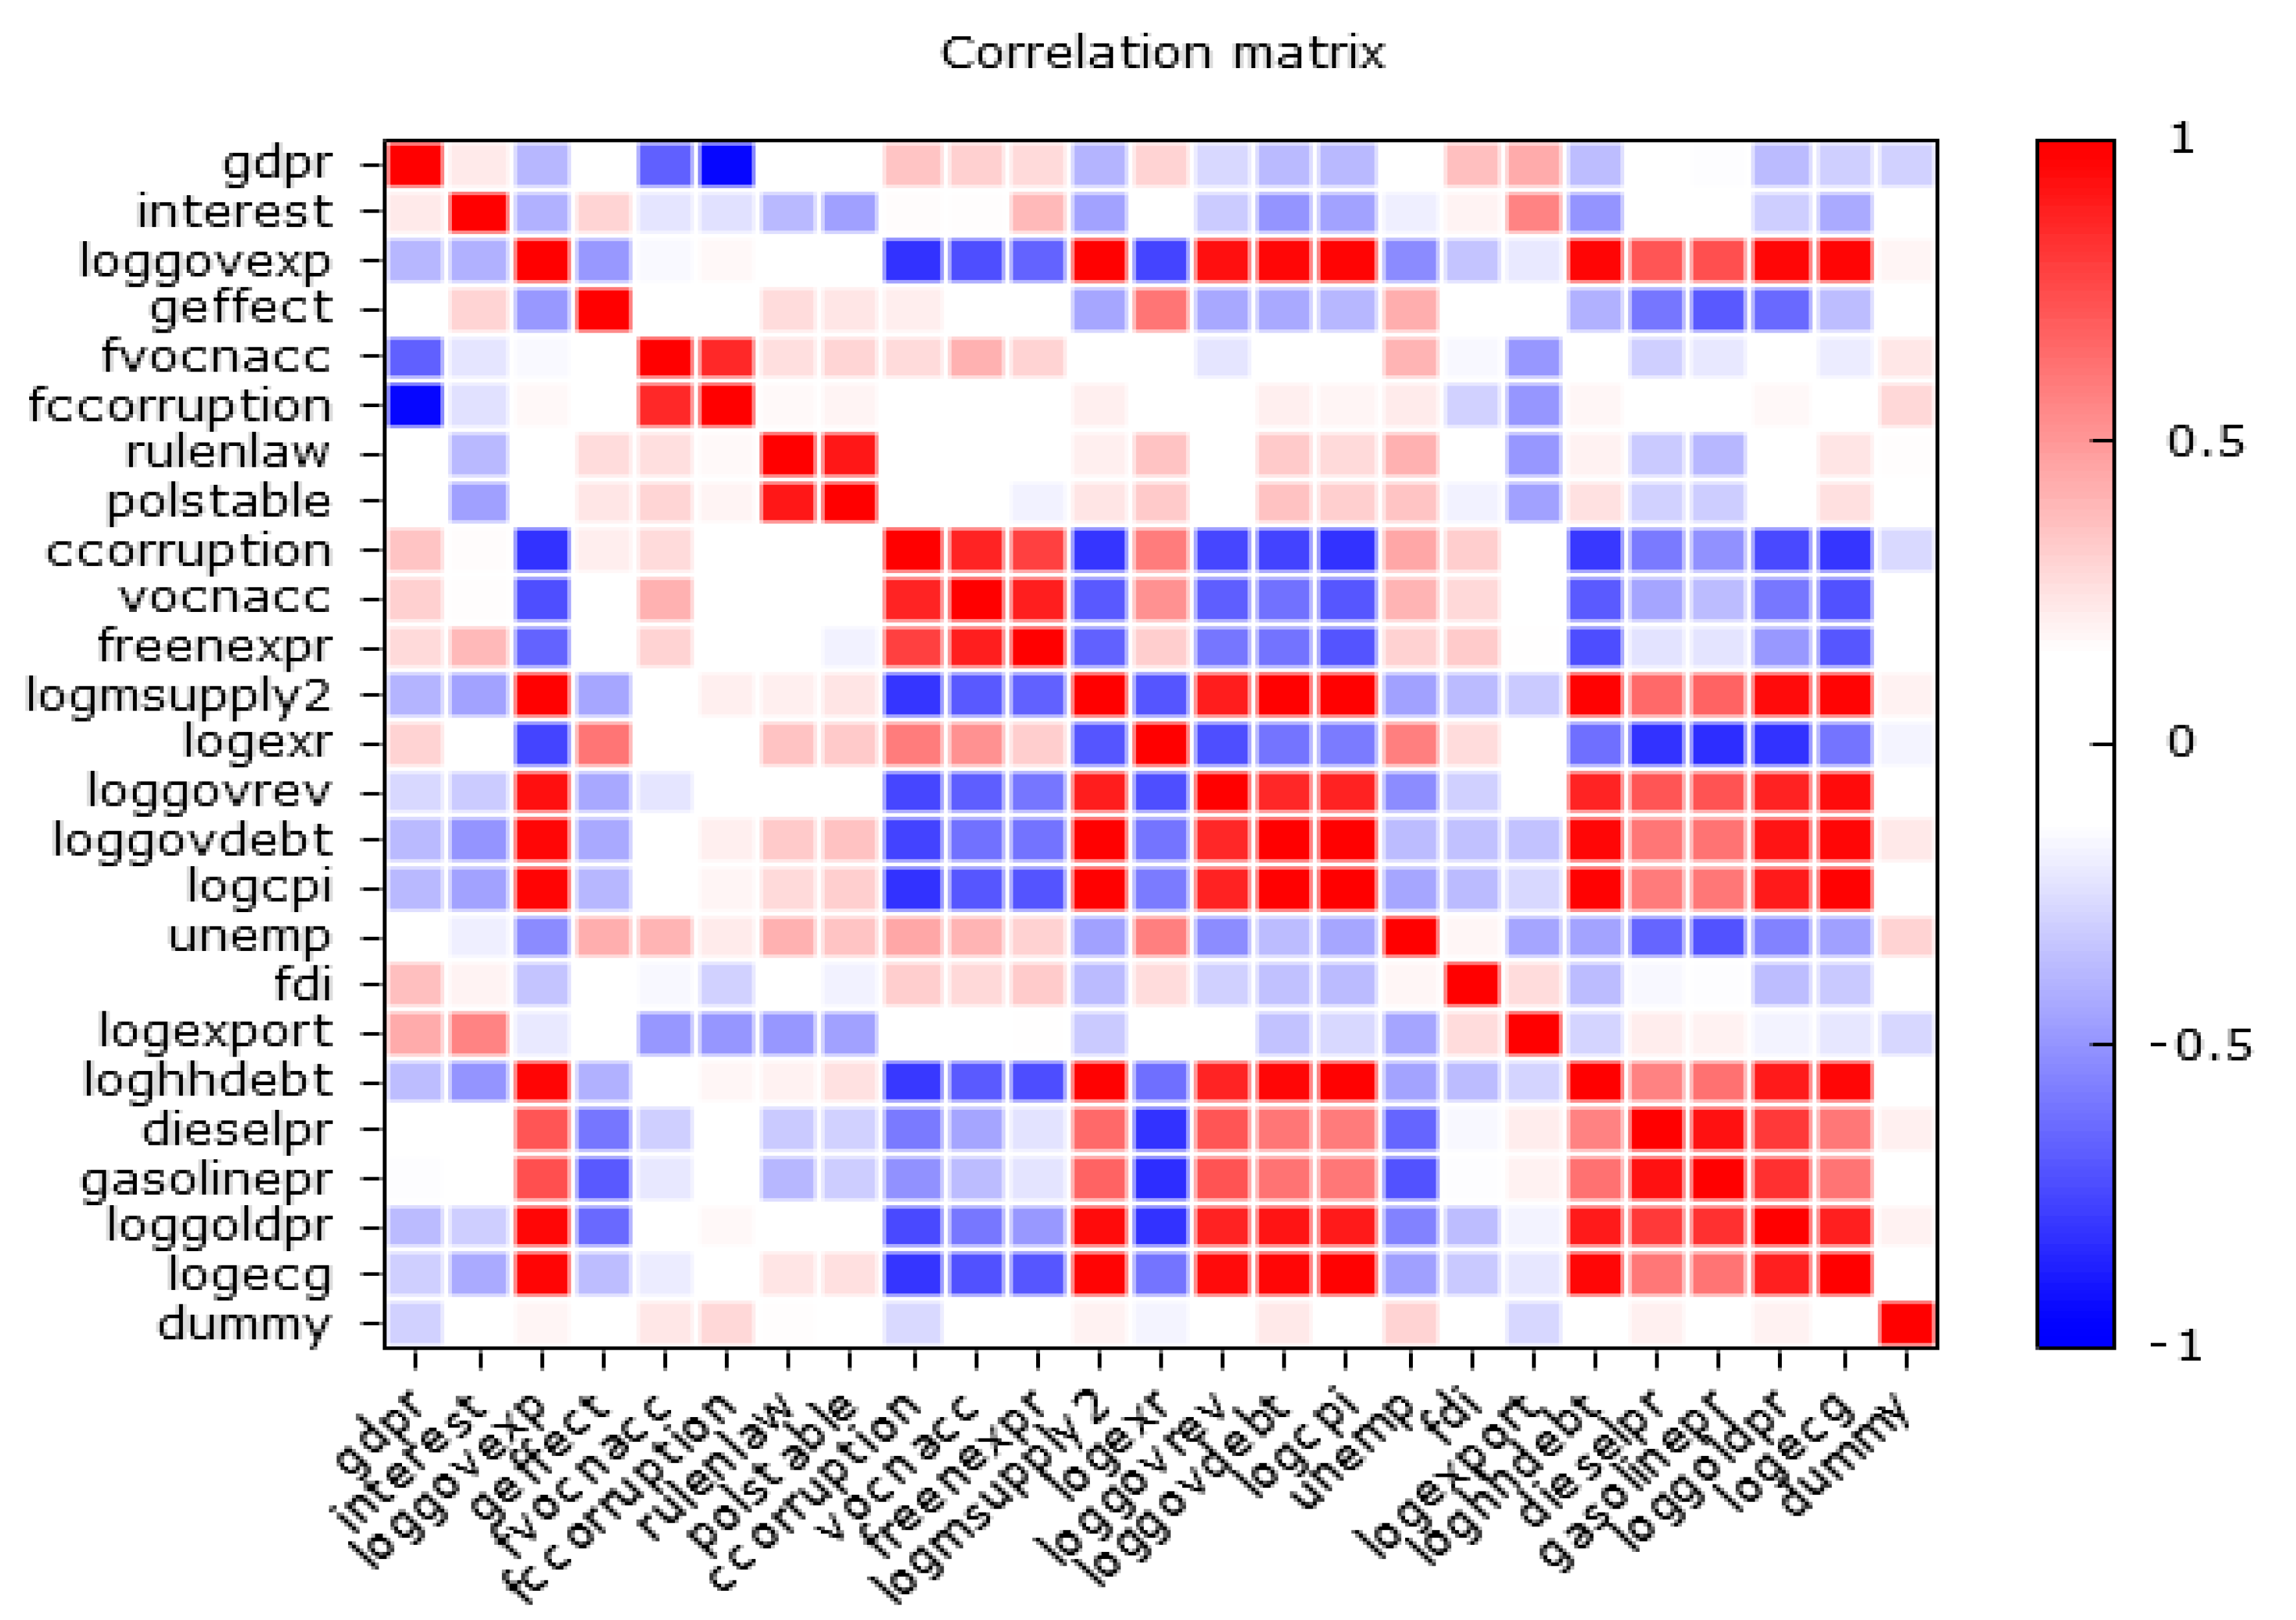
Pairwise correlation matrix among variables used in this study. Notes: The correlation matrix highlights key relationships among variables from Q1:2003 to Q4:2023. Positive correlations with GDP growth include exports and government expenditure, while household debt and electricity generation show negative links. Institutional quality proxies (voice and accountability, corruption) exhibit strong inverse relations and moderate growth correlations. Notable interdependencies exist between trade and energy variables, as well as between household debt and fiscal/monetary policy indicators. These patterns support the tvSURE findings on growth drivers and policy effects.
Figure A1.
Pairwise correlation matrix among variables used in this study. Notes: The correlation matrix highlights key relationships among variables from Q1:2003 to Q4:2023. Positive correlations with GDP growth include exports and government expenditure, while household debt and electricity generation show negative links. Institutional quality proxies (voice and accountability, corruption) exhibit strong inverse relations and moderate growth correlations. Notable interdependencies exist between trade and energy variables, as well as between household debt and fiscal/monetary policy indicators. These patterns support the tvSURE findings on growth drivers and policy effects.
References
- Acemoglu, D., Johnson, S., and Robinson, J. A. (2001). The Colonial Origins of Comparative Development: An Empirical Investigation. American Economic Review, 91(5), 1369–1401. [CrossRef]
- Acemoglu, D., Johnson, S., and Robinson, J. A. (2005). Institutions as a fundamental cause of long-run growth. In P. Aghion & S. N. Durlauf (Eds.), Handbook of Economic Growth, 1(A), 385–472. [CrossRef]
- Acemoglu, D., and Robinson, J. A. (2012). Why nations fail: The origins of power, prosperity, and poverty. Crown Business.
- Alesina, A., Barbiero, O., Favero, C., Giavazzi, F., & Paradisi, M. (2017). The effects of fiscal consolidations: Theory and evidence. NBER Working Paper, No. 23385. [CrossRef]
- Afonso, A., and Furceri, D. (2010). Government size, composition, volatility and economic growth. European Journal of Political Economy, 26(4), 517–532. [CrossRef]
- Bléjer, M. I., and Khan, M. S. (1984). Government Policy and Private Investment in Developing Countries. IMF Staff Papers, 1984(002), A004. Retrieved Jul 15, 2025. [CrossRef]
- Bon, N. (2019). Institutional Quality and the Public Investment-Growth Relationship in Vietnam. Theoretical Economics Letters, 9, 691-708. [CrossRef]
- Berk, I., and Yetkiner, H. (2014). Energy prices and economic growth in the long run: Theory and evidence. Renewable and Sustainable Energy Reviews, 36, 228–235. [CrossRef]
- Bildirici, M., Kayikci, F., and Onat, I. S. (2016). BDI, gold price and economic growth. Procedia Economics and Finance, 38, 280–286. [CrossRef]
- Barbieri, M. M., and Berger, J. O. (2004). Optimal predictive model selection. The Annals of Statistics, 32(3), 870–897. [CrossRef]
- Carvalho, A. R. D., Ribeiro, R. S. M., and Marques, A. M. (2018). Economic development and inflation: A theoretical and empirical analysis. International Review of Applied Economics, 32(4), 546–565. [CrossRef]
- Clarida, R., Gali, J., and Gertler, M. (1999). The science of monetary policy: A New Keynesian perspective. Journal of Economic Literature, 37(4), 1661–1707. [CrossRef]
- Cottrell, A. (1997). Monetary endogeneity and the quantity of theory: The case of commodity money. Available at https://users.wfu.edu/cottrell/commodit.pdf.
- Chipman, H. A., George, E. I. and McCulloch, R. E. (2010). BART: Bayesian additive regression trees. Ann. Appl. Stat. 4(1), 266-298. [CrossRef]
- Casas, I. and Fernandez-Casal, R. (2022). tvReg: Time-varying Coefficients in Multi-Equation Regression in R. The R Journal. https://cran.r-project.org/web/packages/tvReg/tvReg.pdf.
- Casas, I., Ferreira, E. and Orbe, S. (2017). Time-Varying Coefficient Estimation in SURE Models: Application to Portfolio Management. CREATES RESEARCH Papers (33),. [CrossRef]
- Friedman, M., and Schwartz, A. J. (1963). A Monetary History of the United States, 1867–1960. Princeton University Press.
- Fei, F., and Adibe, K. (2010). Theories of gold price movements: Common wisdom or myths? Undergraduate Economic Review, 6(1). https://digitalcommons.iwu.edu/uer/vol6/iss1/5.
- Havi, E. D. K., & Enu, P. (2014). The Effect of Fiscal Policy and Monetary Policy on Ghana’s Economic Growth: Which Policy Is More Potent? International Journal of Empirical Finance, 3, 61-75.
- Jude, C., and Levieuge, G. (2016). Growth effect of foreign direct investment in developing economies: The role of institutional quality. The World Economy, 40(4), 715–742. [CrossRef]
- Kapelner, A. and Bleich, J. (2016). bartMachine: Machine Learning with Bayesian Additive Regression Trees. Journal of Statistical Software, 70(4), 1-40. [CrossRef]
- Kaufmann, D., Kraay, A., and Mastruzzi, M. (2011). The Worldwide Governance Indicators: Methodology and analytical issues. Hague Journal on the Rule of Law, 3, 220–246. [CrossRef]
- Keynes, J. M. (1936). The General Theory of Employment, Interest and Money. Macmillan.
- Keefer, P. and Knack, S. (2007) Boondoggles, Rent-Seeking, and Political Checks and Balances: Public Investment under Unaccountable Governments. The Review of Economics and Statistics, 89, 566-572. [CrossRef]
- KIRSANOVA, T., STEHN, S. J., and VINES, D. (2005). THE INTERACTIONS BETWEEN FISCAL POLICY AND MONETARY POLICY. Oxford Review of Economic Policy, 21(4), 532–564. http://www.jstor.org/stable/23606847.
- Kakar, A. K., Younas, M. Z., and Malik, W. S. (2024). The impact of institutional quality on monetary policy response function: Evidence from developed and developing economies. Singapore Economic Review, 69(8), 2419–2443. [CrossRef]
- Khan, M., Raza, S., and Vo, X. V. (2020). Government spending and economic growth relationship: Can a better institutional quality fix the outcomes? Singapore Economic Review, 69(1). [CrossRef]
- Khan, M., Raza, S., and Vo, X. V. (2024). Government spending and economic growth relationship: Can a better institutional quality fix the outcomes? The Singapore Economic Review, 69(1), 227–249. [CrossRef]
- Mian, A., and Sufi, A. (2014). What explains the 2007–2009 drop in employment? Econometrica, 82(6), 2197–2223. [CrossRef]
- Mishkin, F. S. (2016). The economics of money, banking, and financial markets (11th ed.). Pearson.
- Mundell, R. A. (1977). Exchange-rate systems and economic growth. In M. C. Marcuzzo, L. H. Officer, & A. Rosselli (Eds.), Monetary standards and exchange rates (1st ed.). Routledge. [CrossRef]
- Marioli, F. A., Fatas, A. and Vasishtha, G. (2024). Fiscal policy volatility and growth in emerging markets and developing economies. International Review of Economics & Finance, 92(140), 758-777, 10298. [CrossRef]
- Narisetty, N. and He, H. (2014). Bayesian variable selection with shrinking and diffusing priors. The Annals of Statistics, 42(2). [CrossRef]
- North, D. C. (1990). Institutions, Institutional Change and Economic Performance. Washinton University, St Louis. [CrossRef]
- Poshakwale, S., and Ganguly, G. (2015). International shocks and growth in emerging markets. Global Finance Journal, 26, 29–46. [CrossRef]
- Pastpipatkul, P. and Ko, H. (2025). The Efficacy of Monetary and Fiscal Policies on Economic Growth: Evidence from Thailand. Economies, 13(1), 19. [CrossRef]
- Rodrik, D., Subramanian, A., & Trebbi, F. (2004). Institutions rule: The primacy of institutions over geography and integration in economic development. Journal of Economic Growth, 9, 131–165. [CrossRef]
- Rose, H. (1966). Unemployment in a theory of growth. International Economic Review, 7(3), 260–282. [CrossRef]
- Radulović, M. (2020). The Impact Of Institutional Quality on Economic Growth: A Comparative analysis Of The Eu And Non-eu countries Of Southeast Europe. Economic Annals, 65(225), 163–181. [CrossRef]
- Rodrik, D., Subramanian, A. and Trebbi, F. (2004). Institutions Rule: The Primacy of Institutions Over Geography and Integration in Economic Development. Journal of Economic Growth, 9, 131–165. [CrossRef]
- 41. Rashid, A., and Husain, F. (2013). Capital Inflows, Inflation, and the Exchange Rate Volatility: An Investigation for Linear and Nonlinear Causal Linkages. The Pakistan Development Review, 52(3), 183–206. http://www.jstor.org/stable/24397864.
- Stern, D. I., and Kander, A. (2012). The role of energy in the Industrial Revolution and modern economic growth. The Energy Journal, 33(3), 125–152. http://www.jstor.org/stable/23268096.
- Sriring, O. and Staporncharnchai, S. (2024, September). Thai household debt at record high amid sluggish economy, survey shows. In Reuters. Retrieved on 14 July 2025 from https://www.reuters.com/world/asia-pacific/thai-household-debt-record-high-amid-sluggish-economy-survey-shows-2024-09-10/.
- Wailerdsak, N., and Suehiro, A. (2024). Impacts of external shocks and domestic change on Thailand’s economy and social policies. Journal of Contemporary East Asia Studies, 13(1), 240–261. [CrossRef]
- Zellner, A. (1962). An Efficient Method of Estimating Seemingly Unrelated Regressions and Tests for Aggregation Bias. Journal of the American Statistical Association, 57(298), 348–368. [CrossRef]
Table 1.
Bayesian variable selection results for Institutional Quality (IQ) indicators using BART (Chipman, George & McCulloch, 2010; Kapelner & Bleich, 2016) and BASAD (Narisetty & He, 2014) methods.
Table 1.
Bayesian variable selection results for Institutional Quality (IQ) indicators using BART (Chipman, George & McCulloch, 2010; Kapelner & Bleich, 2016) and BASAD (Narisetty & He, 2014) methods.
| IQ Determinants | Posterior Probability | BART Selection | IQ Determinants | Posterior Probability | BASAD Selection | Combination* |
|---|---|---|---|---|---|---|
| geffect | 0.1775 | geffect | vocnacc | 0.49 | vocnacc | vocnacc |
| ccorruption | 0.177 | ccorruption | ccorruption | 0.473 | ccorruption | ccorruption |
| vocnacc | 0.1628 | vocnacc | geffect | 0.469 | ||
| freenexpr | 0.1627 | freenexpr | 0.426 | |||
| polstable | 0.1601 | rulenlaw | 0.318 | |||
| rulenlaw | 0.16 | polstable | 0.249 |
Notes: To ensure robustness, we ran BART model 30 times (replicates) and BASAD model based on 1000 iterations with 500 burn-in and 4 degrees of freedom. Variable with posterior probabilities greater than 0.5 are considered selected at the 95th percentile. * The combination presents a mixed selection method between these two models.
Table 2.
Bayesian variable selection results for macroeconomic control indicators using BART (Chipman, George & McCulloch, 2010; Kapelner & Bleich, 2016) and BASAD (Narisetty & He, 2014) methods.
Table 2.
Bayesian variable selection results for macroeconomic control indicators using BART (Chipman, George & McCulloch, 2010; Kapelner & Bleich, 2016) and BASAD (Narisetty & He, 2014) methods.
| Control Factors | Posterior Probability | BART Selection | Control Factors | Posterior Probability | BASAD Selection | Combination* |
|---|---|---|---|---|---|---|
| logcpi | 0.0935 | logcpi | logexport | 0.641 | logexport | logexport |
| logexport | 0.0932 | logexport | exts | 0.48 | exts | loggoldpr |
| unemp | 0.0871 | unemp | loggoldpr | 0.459 | loggoldpr | loghhdebt |
| loggoldpr | 0.0846 | loggoldpr | logexr | 0.429 | logexr | logecg |
| loggovdebt | 0.0821 | loggovdebt | loghhdebt | 0.424 | loghhdebt | |
| loghhdebt | 0.0789 | loghhdebt | logecg | 0.397 | logecg | |
| logecg | 0.0757 | logecg | loggovdebt | 0.362 | loggovdebt | |
| logmsupply2 | 0.0709 | logmsupply2 | 0.361 | |||
| gasolinepr | 0.068 | logcpi | 0.339 | |||
| dieselpr | 0.0657 | dieselpr | 0.304 | |||
| logexr | 0.0558 | loggovrev | 0.287 | |||
| fdi | 0.051 | gasolinepr | 0.239 | |||
| exts | 0.0505 | unemp | 0.23 | |||
| loggovrev | 0.043 | fdi | 0.138 |
Notes: To ensure robustness, we ran BART model 30 times (replicates) and BASAD model based on 1000 iterations with 500 burn-in and 4 degrees of freedom. Variable with posterior probabilities greater than 0.5 are considered selected at the 95th percentile. * The combination presents a mixed selection method between these two models.
Disclaimer/Publisher’s Note: The statements, opinions and data contained in all publications are solely those of the individual author(s) and contributor(s) and not of MDPI and/or the editor(s). MDPI and/or the editor(s) disclaim responsibility for any injury to people or property resulting from any ideas, methods, instructions or products referred to in the content. |
© 2025 by the authors. Licensee MDPI, Basel, Switzerland. This article is an open access article distributed under the terms and conditions of the Creative Commons Attribution (CC BY) license (http://creativecommons.org/licenses/by/4.0/).
Copyright: This open access article is published under a Creative Commons CC BY 4.0 license, which permit the free download, distribution, and reuse, provided that the author and preprint are cited in any reuse.


