Submitted:
14 June 2025
Posted:
16 June 2025
You are already at the latest version
Abstract
Debt levels among Asian countries differ significantly, shaped by government expenditures aimed at stimulating growth and responding to challenges such as the COVID-19 pandemic. While integrating Environmental, Social, and Governance (ESG) factors into fiscal planning can initially widen deficits due to higher expenditures, these investments often lead to fiscal sustainability. The purpose of this work is to investigate the impact of Environmental, Social, and Governance (ESG) performance on fiscal sustainability through the fiscal reaction function to the level of debt. The analysis is based on Asian economies, as this region is experiencing a higher level of indebtedness and deficit. This study utilizes the data from 2003-2022 on 23 Asian economies. Three composite indexes are constructed Environmental Index, Social Index, and Governance Index. The study combines all three ESG index and forms a composite ESG index through Principal component analysis(PCA). For Fiscal sustainability, primary balance and the role of government debt are utilized. By applying the fixed effect model, random effect model, and Generalized methods of moments(GMM). The results find that the primary balance is sensitive to debt. Cubic specification of debt has a negative and significant association with the primary balance that shows the fiscal fatigue phenomenon in Asian countries. There is a negative association between the ESG performance index and primary balance. For policy implications, higher transparency and a better enabling environment for investors to foster ESG performance will further enhance ESG performance, resulting in long-term fiscal sustainability.
Keywords:
ESG
; Fiscal Sustainability
; Asia
; GMM
1. Introduction& Background
The macroeconomic policy, especially the fiscal stance, is very central to the development process (Randall & Theodore, 2009). Effective macroeconomic policies especially fiscal measures go hand in hand with the ability of the country to secure the requirements of future generations by assuring the protection of the environment and promotion of a wider spectrum of goals generally termed in country ESG performance. To a greater degree, countries with strong ESG Performance are deemed to be witnessing improved economic growth flowing from more efficient use of natural resources and a quicker process of rolling out social and economic policies that boost productivity (Diaye et al., 2022).
The fiscal imbalance arises when there is an inequality between the expenditure and revenue of a government. A deficit accumulates over time; over the years, therefore, it morphs and becomes a debt. The nation's debt situation becomes chronic and unsustainable if the debt overtakes its GDP (Ferrarini & Ramayandi, 2012). The primary balance is a key tool for analyzing fiscal policy. Essentially, it helps us understand the specific impact of deliberate government financial decisions separate from economic fluctuations. This distinction is crucial because it lets automatic stabilizers, like tax revenues that naturally rise and fall with the economy, function without interference. Additionally, the primary balance aids in evaluating the push or pull of fiscal measures on the economy and in determining whether a government's fiscal strategy is viable over the long term(Jalles, 2024). Particularly, when there's an improvement in the primary balance, it often leads to a noticeable decrease in the costs associated with servicing debt. This reduction amplifies the positive impact of fiscal adjustments, enhancing the overall health of public finances. Essentially, better management of the primary balance can make it easier and more cost-effective for governments to handle their financial obligations, leading to a more stable economic environment (Izák, 2009).
Concepts of fiscal sustainability vary in complexity from straightforward to intricate methodologies. For instance, basic approaches involve metrics like the debt-stabilizing primary balance, while more sophisticated methods seek to ascertain optimal debt levels through frameworks that maximize welfare (Nicholls & Peter, 2014). Fiscal sustainability is the capacity of government financing to meet the budget over some long period without overly accumulating public debt. It is a requirement for the solvency of the government and to be able to service debts at some future point in time (Camarero et al., 2015; Adams et al., 2010).
Leeper (2013) describes fiscal fatigue as a condition where governments cease to make additional adjustments in response to rising debt levels. This cessation may occur because markets no longer view these adjustments as credible, or because the economic conditions have degraded to a point where further budget cuts do not yield additional revenue. This concept aligns closely with the definition by Ghosh et al. (2013), who characterize fiscal fatigue as the presence of mean reversion tendencies in the primary balance, particularly at high public debt levels.
A fiscal reaction function is a rule derived from an inter-temporal government budget constraint showing the government's response toward an increase in the public debt stock. In general, the correct fiscal reaction function, as a rule, supports sound and stable fiscal policy and public finance (Mutuku, 2015). The presence of mean reversion properties in primary balance in response to a higher level of debt leads to fiscal fatigue (Gosh et al., 2013). when gross debt exceeds a threshold of 55-56% of GDP, it correlates with diminished economic growth. This relationship between debt and growth is nonlinear. High levels of public debt can limit private-sector investment and reduce economic expansion; moreover, higher debt levels necessitate increased taxes for debt servicing, which in turn, can depress investment and growth. Additional rises in government spending, funded by increased debt from already high levels, are likely to be counterproductive, resulting in reduced long-term growth as public sector debt displaces private investment (Greenidge et al., 2012)
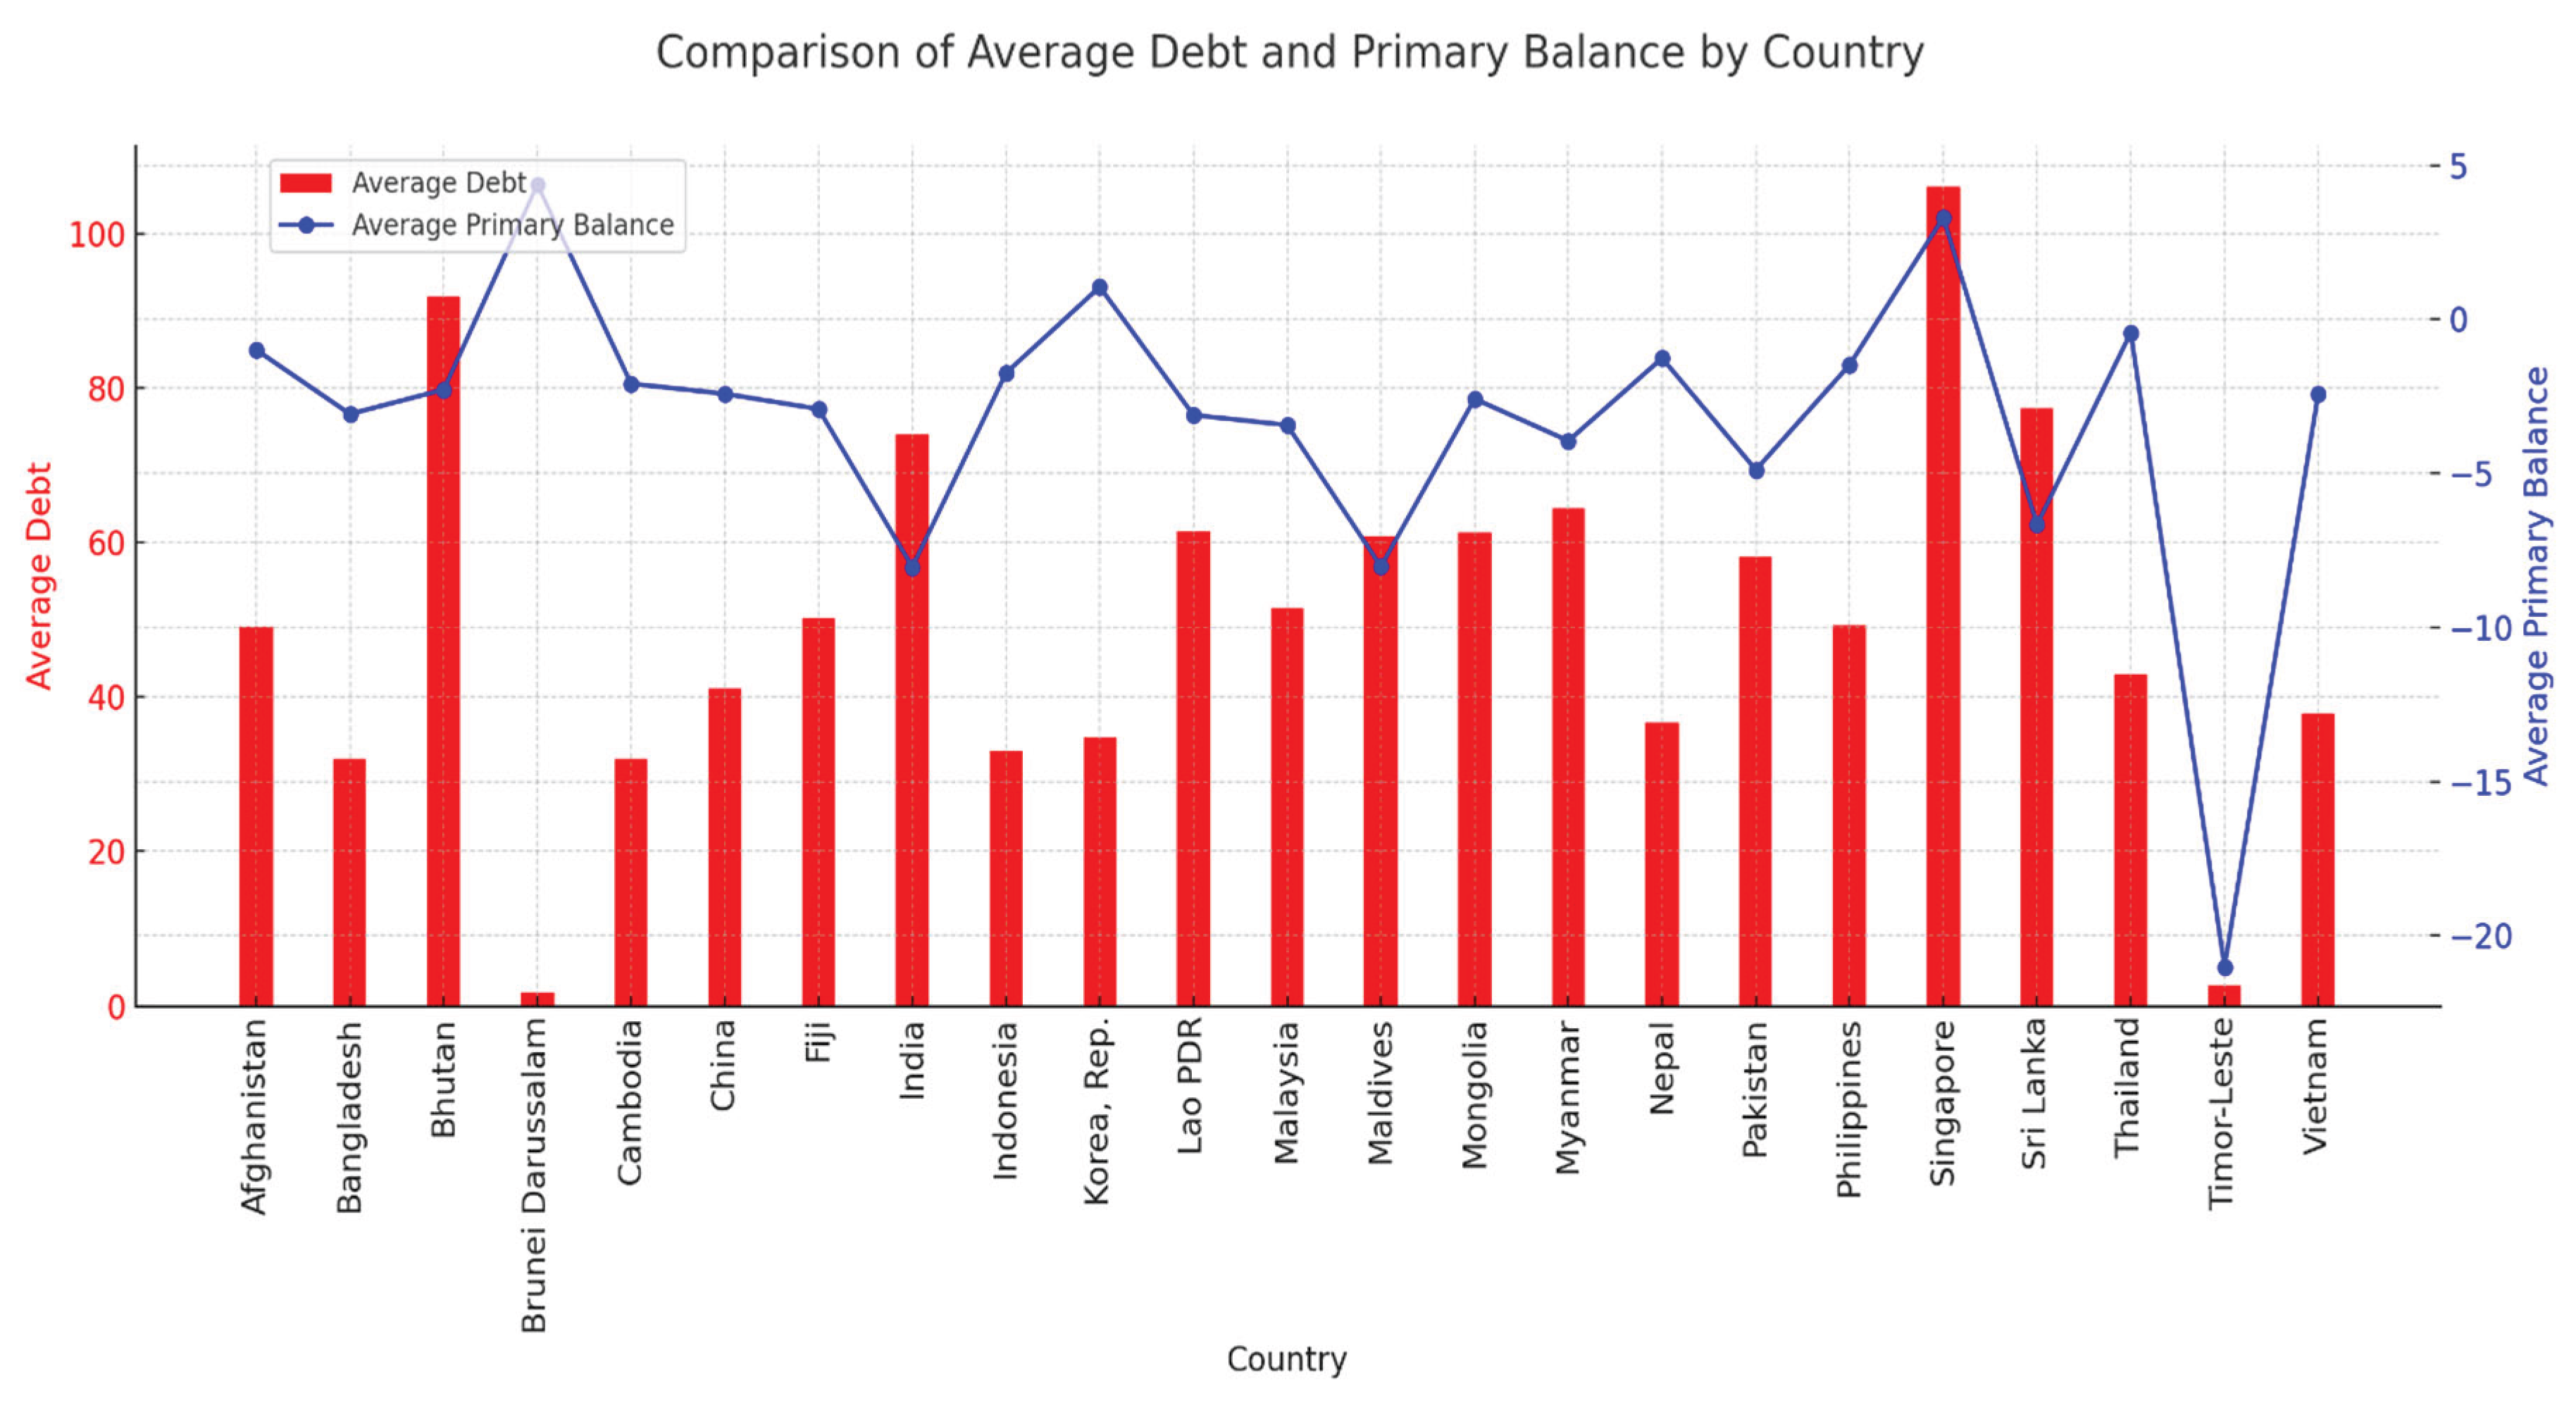
Figure 1.
Average Debt& Primary Balance (2003-2021).
The ESG index offers a more comprehensive view of economic performance and growth potential without solely depending on traditional financial metrics. It serves as a tool for transparency in assessing an economy's health, providing insights into the quality of investments, particularly in terms of environmental and social factors(Jaber, 2023). Lower ESG numbers result in an increased probability of sovereign default, which translates into higher interest costs paid by nations raising funds in the debt markets. Specifically, these ESG measures may be of great value in mitigating fiscal exhaustion and even contributing to enhancing fiscal balance after the country has reached the debt threshold (Capelle-Blancard et al., 2016).
Many other problems remain in many of the Asian economies, including several economic, social, and environmental ones. The majority of South Asia lives in pervasive poverty, with around 40% of the regional population. Almost 20% of the people within it lack safe drinking water, and South Asia is the least per capita energy-consuming region of the entire world. (Younis & Chaudhary, 2017). At the same time, the debt ratio of the public sector to GDP was increasing steadily—from about 40% in 2008 to approximately 47% in 2019—and an estimation of 65% in 2022. This is a progressive accumulation since 2019, estimated at 18 percentage points. (Islamaj & Samano, 2022).
South Asia is the world's fastest-growing region, and poorer countries in this region have the most room to expand expenditures on health, education, and social assistance. This has to be expanded with the sustainability of fund allocation to avoid any interruption of service. Efforts have been made to raise social spending but remains the least used financing mechanism in the region. Growing fiscal deficits have, however, impeded government borrowing. Yet, there is plenty of room for raising social spending if it were to increase. The efforts should, therefore, be complemented with measures to strengthen governance and accountability in public resources management (Bloch, 2020).
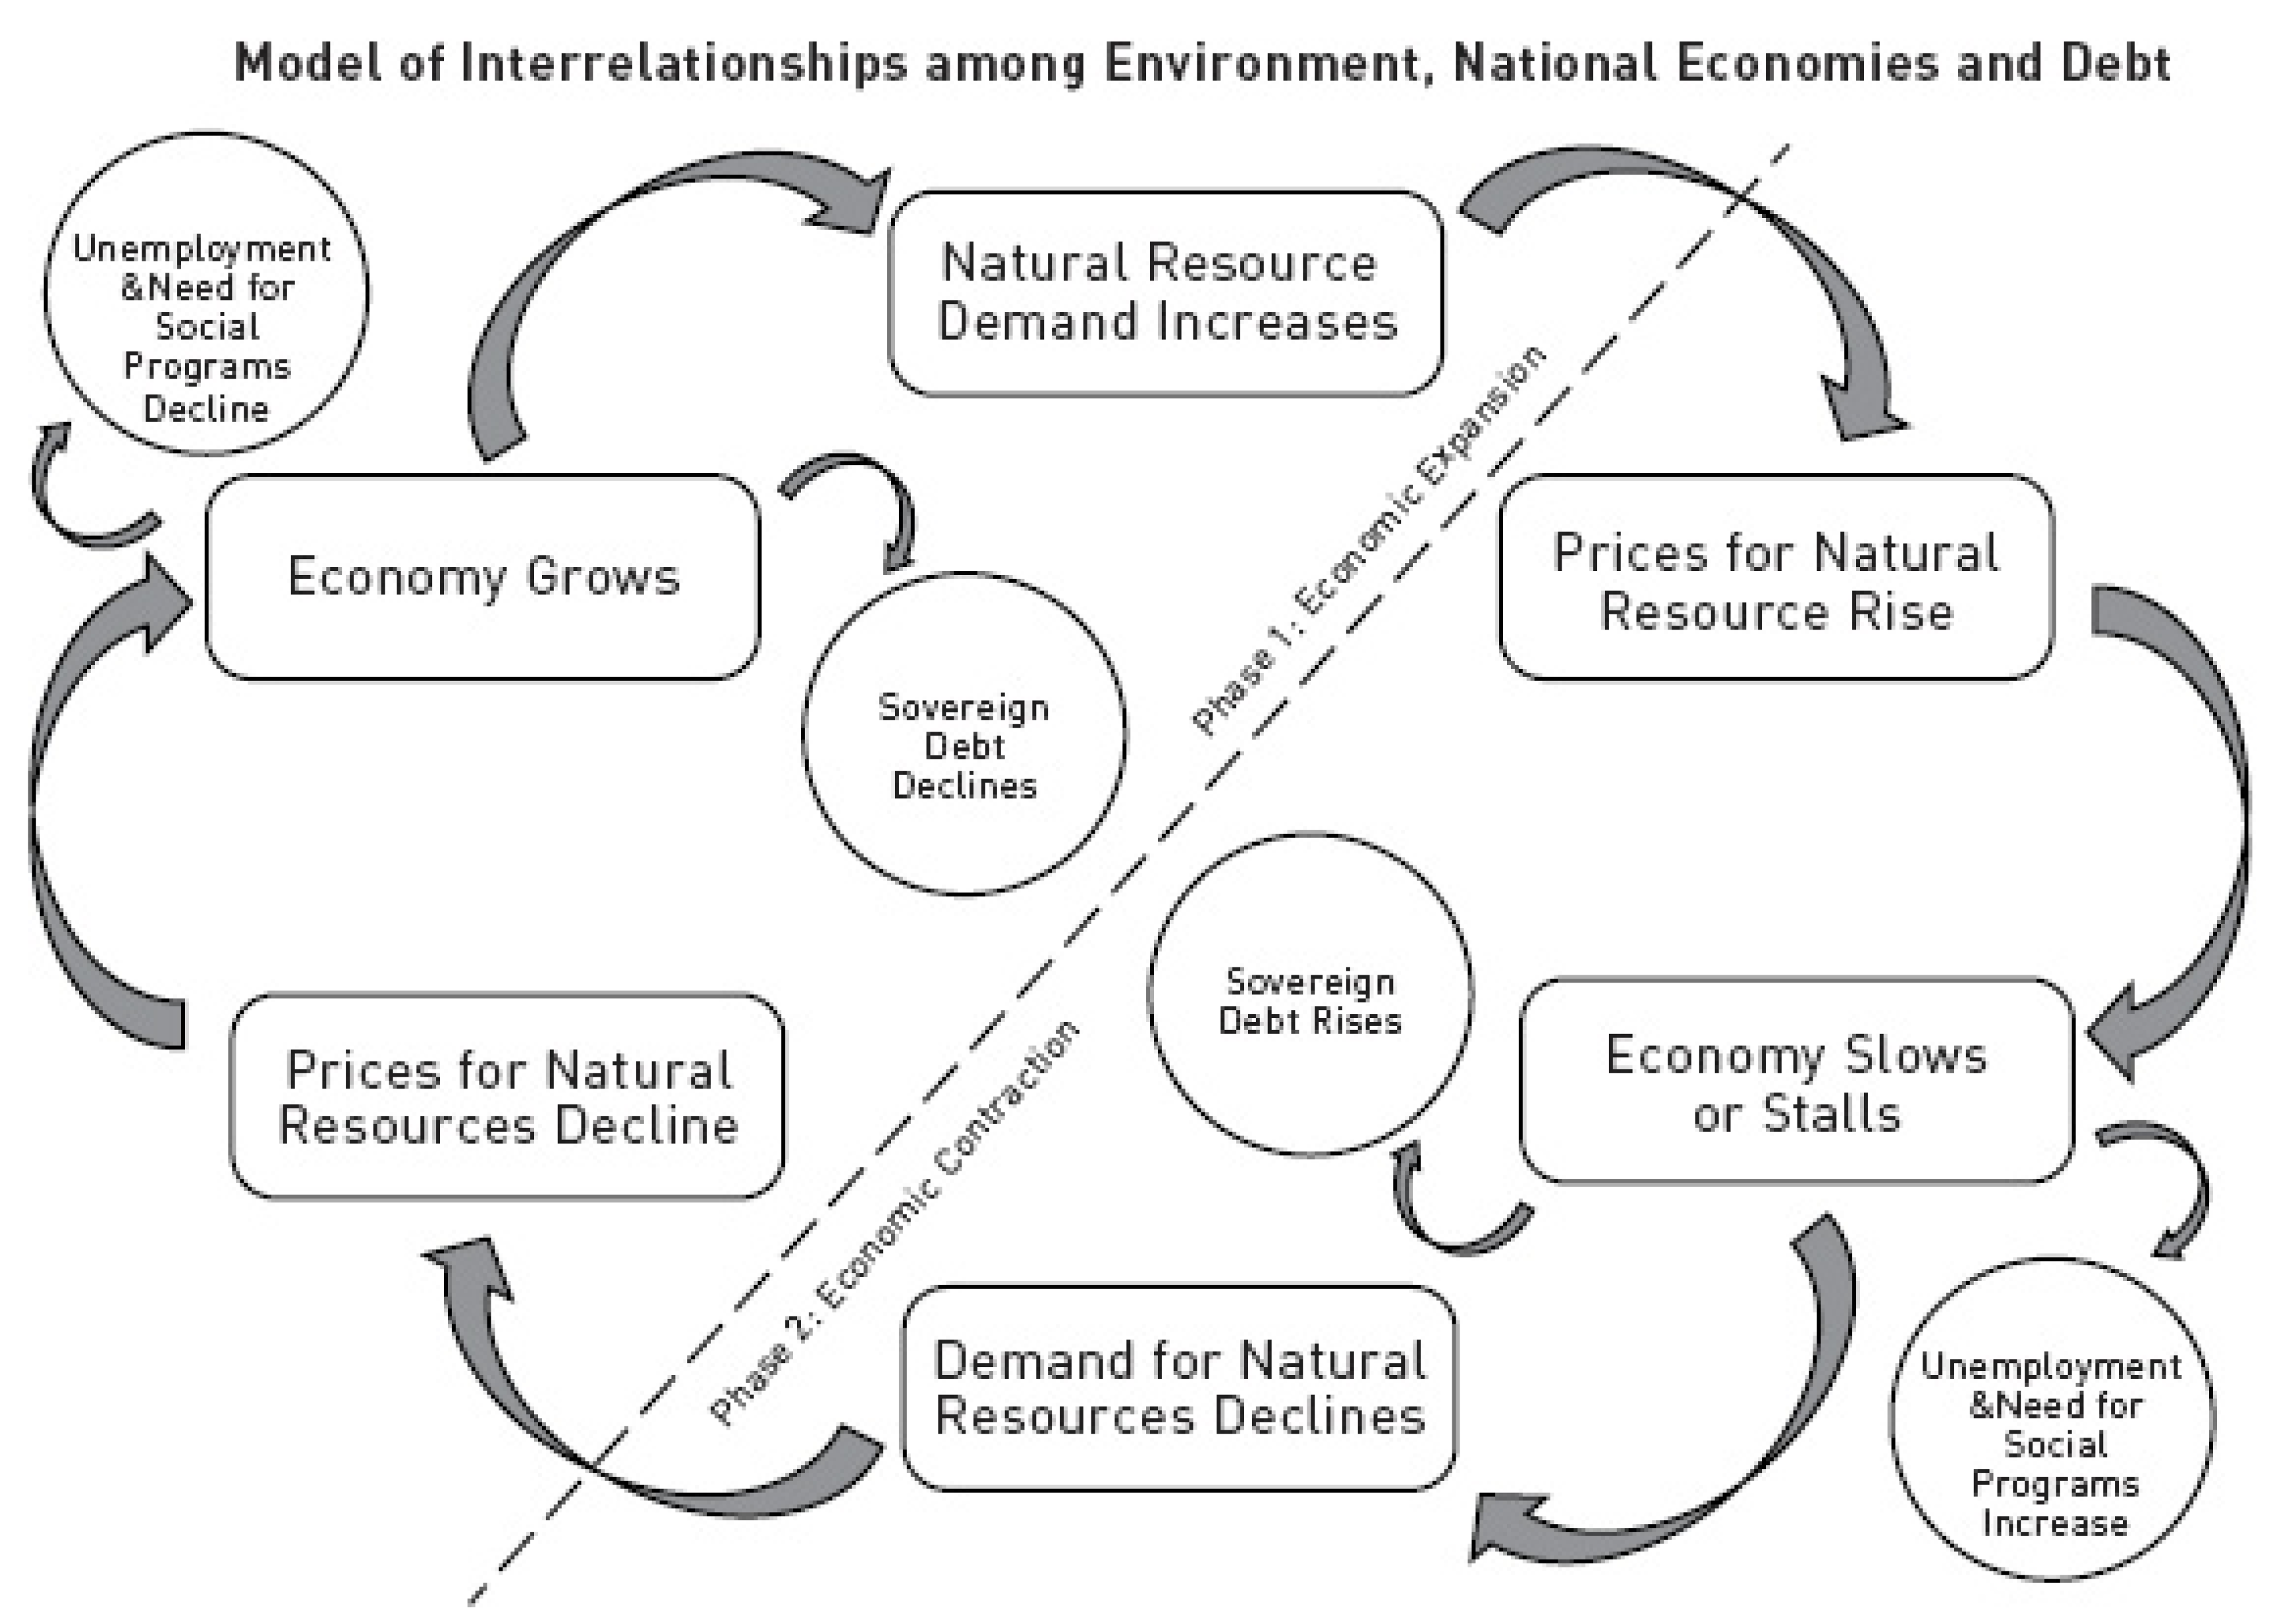
Figure 2.
Relationship between ESG & Fiscal sustainability Source: (2011).
Two important channels through which sustainable development may be linked to debt sustainability. The first, studied by Capelle-Blancard and Petit (2019), determines the spreads from economic growth, while the second, examined by Diaye et al. (2021), determines the spread effect regarding public debts. However, the outcome of solvency was not taken into account in these studies. This paper intends to plug in this gap by directly incorporating the role of sustainable development on solvency and examining the impact on the fiscal reaction function towards debt in Asian economies. Moreover, this paper seeks to explore the impact of sustainable development, as measured by Environmental, Social, and Governance (ESG) performance, on the primary balance.
In this paper, we use a country-level ESG dataset and, therefore, come up with an ESG composite index that includes three sub-indices—namely, environmental, social, and governance. Index—respectively, by using PCA. ESG comprises the framework of long-term sustainable growth and studies its impact on the primary fiscal balance and government indebtedness through 18 years via different estimation techniques.
2. Literature Review
The expansionary fiscal policy after the global financial crisis was conducted in many countries in the Asian regions and could lead to higher levels of public debt and short-term refinancing costs. Furthermore, rising the burden of debt may carry some mid- to long-term adverse impacts on the government budget balance. On average, fiscal policy in the region appears not to be sustainable. This result also confirms the nonlinearity in the response of the primary balance to public debt rejection. Moreover, it is established that the fiscal policy is unsustainable in the episode after the recent global financial crisis (Bui, 2020). Bohn (1995) furnishes a model wherein the share of GDP and the primary surplus both would respond positively to increases in public debt as a sufficient condition for public debt sustainability.
Shastri et al. (2018) have very recently examined the fiscal sustainability in South Asian countries. This study concludes that fiscal sustainability exists in the five South Asian economies, though it is weak. The other results on fiscal sustainability in the region come from Adams et al. (2010) and Ferrarini and Ramayandi (2016). They concluded very differently from prior studies, the regression results on public finance show that it is sustainable in Asia. Adams et al. (2010) also advocate the sustainability situation in Asia, but the work is biased and inconsistent since it fails to consider the sizable heterogeneity within the region and the cross-correlation among the members of the panel.
Medeiros (2012) finds that emerging countries of the EU exhibit such fiscal fatigue appearing at a debt ratio of 80–90% in a set of EU countries. However, such results could be highly sensitive to the existence of a few countries with very high levels of debt. A study in OECD countries by Fournier and Fall (2017) quantifies that the primary balance would respond non-linearly to rising debt and support the fiscal fatigue hypothesis for OECD countries. The estimations indicate that governments react strongly to rising debt of up to 120% of GDP.
The phrase "Environmental, Social, and Governance (ESG)" reflects a form of accounting concept that has been increasingly gaining weightier exposure due to due diligence aspects by institutional investors towards the environment and other forms of social responsibility. Equally, it ensures strong corporate governance (Eliwa et al., 2021). The better the ESG performance, the more a country would have at stake to influence repayments. Hence, this would also put at risk a larger loss in case of default. In other words, during the improvement in ESG performance, ESG issues in the host country and cooperation with other partners (companies and international organizations) would build up their confidence and reduce the asymmetry of information through communication. This way, failure to service the debt would impair the country's reputation, thus foreclosing any borrowing opportunities in the future (Margaretic & Pouget, 2018). Environmental protection has been witnessed in the form of government spending, and fiscal policy has played its role in the promotion of green innovation through two broad channels: first, financial support to the government to fulfill its national ESG responsibilities (Sadiq et al., 2022). Second, it signals society into green innovation and attracts other funds in this area for investment, therefore promoting corporate social responsibility (Wang et al., 2023).
ESG impacts fiscal sustainability through several mechanisms, one of which is the effect on interest rates. Investors increasingly prioritize ESG factors in their portfolios for ethical or moral reasons. As a result, nations demonstrating strong ESG performance often benefit from lower interest rates on their sovereign bonds, thereby enhancing fiscal sustainability. This correlation is supported by studies indicating that countries with robust ESG scores are linked to lower default risks and reduced spreads on sovereign bond yields. Specifically, Capelle-Blancard et al. (2019) found that social and governance aspects significantly reduce sovereign bond yield spreads, although the environmental component shows no significant effect on yields. Furthermore, Hübel (2022) suggests that high ESG standards can enable a country to maintain a steady tax revenue stream, thus diminishing its ESG risk exposure.
The second way ESG influences fiscal sustainability pertains to its impact on economic growth, although the effects are debated with no definitive consensus on whether it promotes or inhibits growth. The "degrowth" theory, endorsed by scholars like Schneider et al. (2010) and Howarth (2012), argues that achieving ESG goals may lead to a reduction in consumption and production, potentially shrinking economic growth. In contrast, other research highlights the positive role of ESG factors in fostering long-term economic growth. For instance, Diaye et al. (2022) contend that superior ESG performance by a country correlates with better prospects for long-term economic expansion.
The third way in which ESG impacts fiscal sustainability is through its influence on debt responses, which can affect government expenditures, revenues, and the debt itself. ESG factors, such as strong institutions and stable macroeconomic conditions, can help prevent fiscal fatigue, thereby improving fiscal balance when debt limits are reached, as noted by Echevarria-Icaza (2016). Additionally, how a country manages and accesses its natural resources, along with a government's capability to enact economic policies that generate adequate revenues for debt servicing, significantly shapes its overall risk profile. This, in turn, impacts its capacity to meet sovereign debt obligations in both the short and long term, as discussed by Crifo et al. (2017).
Furthermore, Cevik and Jalles (2022) expose the relationship between variations in climate and country resilience with borrowing costs. It has been found that strong ESG credentials could, therefore, drive down the South and East Asian sovereign debt interest rate. Sustainability may be equated with financial sustainability in cases where the government would like to keep the present level of spending, tax policies, and other fiscal activities without getting into insolvency risk whereby, in the future, require sudden, damaging adjustments to these policies. ESG (Environmental, Social, and Governance) performance measures include how companies and their economies negotiate the management balance of all the constituent elements: environmental impacts, social responsibilities, and governance practices (Fallah-Shayan et al., 2022).
Theoretical Background
Freeman's Stakeholder Theory (1984) identifies stakeholders as individuals or groups who have significant stakes in an institution and profoundly influence its goals. Extending this concept within the framework of legitimacy theory, research shows that lending institutions prioritize Environmental, Social, and Governance (ESG) performance and transparency, integrating this information into their credit decision-making processes. Countries demonstrating strong ESG practices often enjoy lower borrowing costs. Additionally, the impact of ESG disclosure on the cost of debt is found to be equivalent to that of actual ESG performance. It is argued that lending institutions consider a country's ESG data in their credit evaluations to assess two primary types of risks: default risk and reputational risk (Eliwa et al., 2021).
The endogenous growth model emphasizes compensating for environmental or social issues through investments in human capital. In this approach, technology evolves as an endogenous factor driven by educational investments, unlike the exogenous approach where technology is seen as an external factor. Barro and Romer's theory integrates technological changes into the production function, viewing them as crucial for growth due to their role in enhancing capital productivity. This model suggests that sustainable growth is not solely reliant on accumulating physical capital but also on developing human capital through education. Additionally, it posits that governments can sustain budget deficits to fund public debt as long as such spending contributes to human capital formation, which in turn supports long-term fiscal sustainability (Soegiarto et al., 2022).
Based on the above literature following hypothesis can be developed.
H1: There is a significant negative relationship between the ESG index and primary balance in Asia.
H1a: There is a significant relationship between the Environmental index and primary balance in Asia.
H1b: There is a significant relationship between the Social index and primary balance in Asia.
H1c: There is a significant relationship between the Governance index and primary balance in Asia.
H2: There exists a fiscal fatigue phenomenon in Asia.
3. Data and Methodology
3.1. Data
To check the association among sustainable development measured by the ESG index, fiscal sustainability measured by fiscal reaction function toward debt and primary balance in 23 Asian countries, estimation is done from 2003 to 2022. Data gathered from the World Bank and OECD databases. the variable description is explained in Table 1.
3.2. Methodology
Model Specification
FBi,t=α0+ β1GDi,t-1 + β2GD2 i,t-1 + β3GD3 i,t-1 + µit (1)
Equation 1 describes the fiscal fatigue with the nonlinear specification of debt that depicts the fiscal reaction function where cubic specification represents the fiscal fatigue. If β3< 0, confirms the fiscal fatigue phenomenon (Gosh et al., 2013).
Following equations for empirical estimation
FBi,t=α0+ Σj3=1 αjGDi,jt-1 + α1EIi,t +β0Xi,t+µi,t (2a)
FBi,t=α0+ Σj3=1 αjGDi,jt-1 +α1SIi,t+β0Xi,t+µi,t (2b)
FBi,t=α0+ Σj3=1 αjGDi,jt-1 + α1GIi,t+β0Xi,t+µi,t (2c)
FBi,t=α0+ Σj3=1 αjGDi,jt-1 + α1ESGIi,t+β0Xi,t+µi,t (3)
FB denotes the primary fiscal balance where i shows the country and t shows the year, Σj3=1GDi,jt-1 shows the cubic form of lagged debt for measuring the fiscal fatigue. ESGI is the ESG index,. Xi,t shows the control variable. Equation 2 shows the dissociated E, S, and G index association with FB, while equation 3 shows the ESG index relation with FB.

Table 2.
Descriptive Statistics &Correlation table.
| Mean | Std. dev. | Minimum | Maximum | ||||||||||
| FB | 3.21 | 7.30 | -41.03 | 55.40 | |||||||||
| ESGI | -0.19 | 0.83 | -1.81 | 2.07 | |||||||||
| EI | -0.15 | 0.78 | -0.57 | 3.65 | |||||||||
| SI | 0.11 | 0.97 | -1.31 | 2.55 | |||||||||
| GI | -0.22 | 0.82 | -1.64 | 1.80 | |||||||||
| INF | 5.01 | 4.86 | -6.81 | 36.58 | |||||||||
| OilP | 4.19 | 0.37 | 3.34 | 4.72 | |||||||||
| TOP | 99.49 | 73.65 | 24.65 | 437.32 | |||||||||
| GDPG | 5.16 | 5.28 | -32.90 | 37.68 | |||||||||
| FB | ESGI | EI | SI | GI | INF | OilP | TOP | GDPG | |||||
| FB | 1.00 | ||||||||||||
| ESGI | -0.33 | 1.00 | |||||||||||
| EI | -0.01 | 0.10 | 1.00 | ||||||||||
| SI | 0.07 | -0.71 | -0.29 | 1.00 | |||||||||
| GI | -0.33 | 0.63 | 0.10 | -0.71 | 1.00 | ||||||||
| INF | 0.26 | -0.40 | 0.21 | 0.34 | -0.51 | 1.00 | |||||||
| OilP | -0.09 | -0.12 | 0.01 | 0.15 | -0.12 | 0.27 | 1.00 | ||||||
| TOP | -0.20 | 0.45 | 0.28 | -0.28 | 0.45 | -0.18 | 0.06 | 1.00 | |||||
| GDPG | 0.02 | -0.38 | 0.16 | 0.12 | -0.38 | 0.15 | 0.17 | -0.01 | 1.00 | ||||
4. Estimation & Results
Firstly, we applied Principal Component Analysis (PCA) to construct the individual Environmental, social, and governance indices then in the second step, we combined all individual indices to make a composite ESG index.
4.1. GMM Results
Table 3 presents the Generalized method of moments (GMM) findings between fiscal sustainability and ESG performance in Asia. GMM is utilized in panel data having issues of endogeneity and heterogeneity. Four equations are estimated, the first equation contains the main ESG index and debt with primary balance rest of the three equations contain individual ESG index. In all equations, there appears negative and significant association between debt and primary balance. Diagnostic test proved the validity of GMM for estimation.
This inverse relationship between the lag of public debt and primary balance, is advocated by (Afonso et al., 2023). Cubic specification of debt shows a significant relation with primary balance, hence proving the fiscal fatigue phenomenon exists in Asian economies result is supported by Icaza (2018) & Gosh et al.(2013), in the sense that the higher the level of debt, at the margin, the fiscal adjustment will be lower. Fiscal fatigue occurs when a government finds it increasingly difficult or politically impractical to manage or decrease its debt levels through austerity measures, especially as these debt levels continue to rise. This phenomenon reflects a diminishing effectiveness or willingness to engage in fiscal consolidation when faced with high debt burdens.
The estimated coefficients of β1, and β3 are negative, and β2 has a positive sign. All of these coefficients are statistically significant which confirms the presence of the fiscal fatigue phenomenon in Asian Economies. A negative β1, suggests that as debt increases, the primary fiscal balance worsens, indicating initial fiscal easing or ineffective tightening. A positive β2 indicates that as debt grows further, there's a nonlinear attempt to improve the fiscal balance, perhaps as the risks of high debt become more apparent and demand more aggressive responses. A negative β3, at very high levels of debt, implies that despite efforts, the fiscal balance deteriorates rapidly, a classic sign of fiscal fatigue where further adjustments either become too harsh or politically unsustainable.
Similar result by Sevda (2019), the author checks fiscal sustainability in the case of Turkey. This confirms the presence of hypothesis 2. Our results support hypothesis 1 that there is a negative association between ESG performance and primary balance. Similar results were obtained by (Jaber, 2023) when taking into account Advanced countries to study ESG and fiscal policy. Specifically, on one hand, increasing the ESG performance index needs an increase in spending which will impact negatively the primary surplus. On the other hand, a high ESG performance is observed when there is less pressure on fiscal balance (i.e. high growth, low interest rate, and low level of debt). The result is consistent (Flavin, 2019; Caglar & Yavuz, 2023) that Government spending on environmental protection can promote sustainable development, reduce pollution and environmental damage, and improve ecosystem health and stability. Regarding individual ESG indicators, all three indices have a negative and significant relationship with primary balance but the magnitude of social and environmental indicators is higher compared to the governance index. Regarding control variables, there exists an inverse relationship between GDP growth, oil price, and inflation with primary balance. Regarding GDP growth inverse relationship can be explained as when government spending exceeds the revenue, it opts for borrowing that harms the investment by upswinging the interest rate. As a result, consumption and investment both decrease decreases the overall economic activity (Sharma & Mittal, 2019). Oil price is negatively related to the primary balance advocated by (Abubakar et al., 2023), If a country is oil-exporting, a decrease in oil price causes a fall in revenue that further worsens the deficit the other hand if the country is oil importing excessive price cause increase in government spending that further negative influence the primary balance. the openness of the economy and the Inflation rate differential does not show any impact on the dependent variable.
4.2. Random & Fixed Effects Results
Table 4 and Table 5 show the Random effect model and Fixed effect model, with similar results just like GMM. The primary balance exhibits a strong negative correlation with government debt and ESG performance, confirming the fiscal fatigue phenomenon in Asia. Specifically, the individual impacts of environmental, social, and governance factors on the primary balance are significant and negative. Regarding control variables trade openness and oil prices are mostly insignificant.
5. Conclusions and Policy Implications
Public debt levels across Asia show significant variation, influenced largely by government expenditures aimed at stimulating growth. More recently, these expenditures have increased as governments have sought to counteract the effects of global challenges like the COVID-19 pandemic. When governments integrate Environmental, Social, and Governance (ESG) considerations into their budget planning, it can initially lead to wider budget deficits due to the upfront costs of such investments. However, these expenses are typically offset over time by the benefits they bring. These benefits include stronger economic growth fueled by more sustainable and inclusive practices, higher tax revenues generated from these healthier economic activities, and lower long-term costs as a result of less environmental damage and reduced social disparities. This strategic approach not only addresses immediate financial strains but also lays the groundwork for a more resilient and equitable economic future
The majority of the countries in Asia are facing economic obstacles that include high public debt levels, structural imbalances, and slow growth. If economic difficulties were drawn out, this would serve to further put a strain on fiscal resources. As for ESG performance, Asia—with part of the world's most biodiverse ecosystems—hosts some key contributors to global environmental issues, including air and water pollution, deforestation, and greenhouse gas emissions. This study finds the strong negative relationship of the primary balance with government debt and ESG performance echoing the notion of such a fiscal reaction function in Asia. Regarding individual impacts of E, S, and G with a primary balance is significant and negative, where social indicators are higher in magnitude compared to environmental and governance indicators. This confirms hypothesis that there is significant relationship between individually as well in form of composite ESG with primary balance. Moreover, hypothesis 2 is also validated as there exist Fiscal fatigue phenomenon in Asian countries.
Regarding policymakers, the Rejuvenation of ESG within fiscal policies will further add to sustainability and resilience between the governments of Asia. Governments rationalize expenditure and improve efficiency to attain sustainable primary balance. Fiscal authorities may develop and adopt strategies for the management of debt that balance financing needs with those of debt sustainability. Effective management of government spending is crucial for maintaining a healthy economy and fostering societal progress. Excessive deficits, often resulting from uncontrolled spending, can lead to significant borrowing. Investing in human capital—namely education, healthcare, and skills development—is not just a necessity but a smart economic strategy. By nurturing a well-educated, healthy, and skilled workforce, governments can unlock productivity gains and catalyze economic growth. Moreover, the role of strong, transparent, and accountable institutions cannot be overstated. These institutions are the guardians of public trust and fiscal responsibility, ensuring that every dollar spent achieves its intended purpose and contributes to the common good, while also combating corruption at all levels. Initiatives aimed at pollution reduction, sustainable resource management, and the adoption of renewable energy sources are vital. These efforts not only safeguard the planet for future generations but also secure economic stability by preempting the extensive costs and disruptions associated with environmental damage.
Author Contributions
Conceptualization, Shomaila Habib; Funding acquisition, Josephine Yau and Alvaro Rocha; Methodology, Shomaila Habib; Resources, Josephine Yau and Alvaro Rocha; Software, Shomaila Habib; Writing – original draft, Shomaila Habib.
Conflicts of Interest
The authors declare no conflict of interest.
References
- Abubakar, A. B., M. Muhammad, and S. Mensah. 2023. Response of fiscal efforts to oil price dynamics. Resources Policy 81: 103353. [Google Scholar] [CrossRef]
- Adams, C., B. Ferrarini, and D. Park. 2010. Fiscal sustainability in developing Asia. Asian Development Bank Economics Working Paper Series No. 205, available at: https://ssrn.com/ abstract=1640264.
- Afonso, A., J. Alves, and J. C. Coelho. 2023. Determinants of the degree of fiscal sustainability. [Google Scholar]
- Bloch, C. 2020. Social spending in South Asia-an overview of government expenditure on health, education and social assistance. [Google Scholar]
- Bohn, H. 1995. The sustainability of budget deficits in a stochastic economy. Journal of Money, credit and banking 27, 1: 257–271. [Google Scholar] [CrossRef]
- Bui, D. T. 2020. Fiscal sustainability in developing Asia–new evidence from panel correlated common effect model. Journal of Asian Business and Economic Studies 27, 1: 66–80. [Google Scholar] [CrossRef]
- Caglar, A. E., and E. Yavuz. 2023. The role of environmental protection expenditures and renewable energy consumption in the context of ecological challenges: Insights from the European Union with the novel panel econometric approach. Journal of Environmental Management 331: 117317. [Google Scholar] [CrossRef]
- Camarero, M., J. L. Carrion-i-Silvestre, and C. Tamarit. 2015. The relationship between debt level and fiscal sustainability in organization for economic cooperation and development countries. Economic Inquiry 53, 1: 129–149. [Google Scholar] [CrossRef]
- Capelle-Blancard, G., and A. Petit. 2017. The weighting of CSR dimensions: One size does not fit all. Business & Society 56, 6: 919–943. [Google Scholar]
- Capelle-Blancard, G., P. Crifo, M. A. Diaye, R. Oueghlissi, and B. Scholtens. 2019. Sovereign bond yield spreads and sustainability: An empirical analysis of OECD countries. Journal of Banking & Finance 98: 156–169. [Google Scholar]
- Capelle-Blancard, G., P. Crifo, M. A. Diaye, B. Scholtens, and R. Oueghlissi. 2016. Environmental, Social and Governance (ESG) performance and sovereign bond spreads: an empirical analysis of OECD countries. Available at SSRN 2874262. [Google Scholar]
- Cevik, S., and J. T. Jalles. 2022. This changes everything: Climate shocks and sovereign bonds⁎. Energy Economics 107: 105856. [Google Scholar] [CrossRef]
- Crifo, P., M. A. Diaye, and R. Oueghlissi. 2017. The effect of countries’ ESG ratings on their sovereign borrowing costs. The Quarterly Review of Economics and Finance 66: 13–20. [Google Scholar] [CrossRef]
- Diaye, M. A., S. H. Ho, and R. Oueghlissi. 2022. ESG performance and economic growth: A panel co-integration analysis. Empirica 49, 1: 99–122. [Google Scholar] [CrossRef]
- Echevarria-Icaza, V. 2016. Fiscal fatigue and debt sustainability: Empirical evidence from the Eurozone 1980–2013. Available at SSRN 2727649.
- Eliwa, Y., A. Aboud, and A. Saleh. 2021. ESG practices and the cost of debt: Evidence from EU countries. Critical Perspectives on Accounting 79: 102097. [Google Scholar] [CrossRef]
- Fallah Shayan, N., N. Mohabbati-Kalejahi, S. Alavi, and M. A. Zahed. 2022. Sustainable development goals (SDGs) as a framework for corporate social responsibility (CSR). Sustainability 14, 3: 1222. [Google Scholar] [CrossRef]
- Ferrarini, B., and A. Ramayandi. 2016. Public debt sustainability assessments for developing Asia. In Public Debt Management, India Studies in Business and Economics. Edited by R. Jha and A. Ramayandi. Springer: New Delhi: pp. 131–192. [Google Scholar]
- Ferrarini, B., and A. Ramayandi. 2012. Public debt sustainability assessments for developing Asia. In Public debt sustainability in developing Asia. Routledge: pp. 61–123. [Google Scholar]
- Flavin, P. 2019. State government public goods spending and citizens' quality of life. Social science research 78: 28–40. [Google Scholar] [CrossRef]
- Fournier, J. M., and F. Fall. 2017. Limits to government debt sustainability in OECD countries. Economic Modelling 66: 30–41. [Google Scholar] [CrossRef]
- Gervich, C. D. 2011. Precarious economies: Exploring the use of environmental indicators to predict economic instability. SAPI EN. S. Surveys and Perspectives Integrating Environment and Society, (4.1). [Google Scholar]
- Ghosh, A. R., J. I. Kim, E. G. Mendoza, J. D. Ostry, and M. S. Qureshi. 2013. Fiscal fatigue, fiscal space and debt sustainability in advanced economies. The Economic Journal 123, 566: F4–F30. [Google Scholar] [CrossRef]
- Greenidge, K., R. Craigwell, M. C. Thomas, and M. L. Drakes. 2012. Threshold effects of sovereign debt: Evidence from the Caribbean. International Monetary Fund. [Google Scholar]
- Howarth, R. B. 2012. Sustainability, well-being, and economic growth. Minding Nature 5, 2: 32–39. [Google Scholar]
- Hübel, B. 2022. Do markets value ESG risks in sovereign credit curves? The quarterly review of economics and finance 85: 134–148. [Google Scholar] [CrossRef]
- Icaza, V. E. 2016. DOCUMENTOS DE ECONOMÍA Y FINANZAS INTERNACIONALES. [Google Scholar]
- Icaza, V. E. 2018. Fiscal fatigue and debt sustainability: Empirical evidence from the Eurozone 1980–2013. Cuadernos de economía 41, 115: 69–78. [Google Scholar] [CrossRef]
- Islamaj, E., and A. Samano. 2022. Drivers of Public Debt in East Asia and Pacific Economies. [Google Scholar]
- Izák, V. 2009. Primary balance, public debt and fiscal variables in postsocialist members of the european union. Prague economic papers 18, 2: 114–130. [Google Scholar] [CrossRef]
- Jaber, A. ESG performance and fiscal sustainability: an empirical assessment in advanced economies.
- Jalles, J. T. 2024. Estimating Structural Budget Balances in Developing Asia. Asian Development Bank Economics Working Paper Series, (719). [Google Scholar]
- Kawai, M., and P. Morgan. 2013. Long-term issues for fiscal sustainability in emerging Asia. [Google Scholar]
- Leeper, E. M. 2013. Fiscal limits and monetary policy (No. w18877). National Bureau of Economic Research. [Google Scholar]
- Liu, J., J. Zhu, and J. Zhang. 2018. A DEA-based approach for competitive environment analysis in global operations strategies. International Journal of Production Economics 203: 110–123. [Google Scholar] [CrossRef]
- Margaretic, P., and S. Pouget. 2018. Sovereign bond spreads and extra-financial performance: An empirical analysis of emerging markets. International Review of Economics & Finance 58: 340–355. [Google Scholar]
- Medeiros, J. 2012. Stochastic debt simulation using VAR models and a panel fiscal reaction function–results for a selected number of countries. No. 459; Directorate General Economic and Financial Affairs (DG ECFIN), European Commission. [Google Scholar]
- Murphy, D. J., and C. A. Hall. 2011. Energy return on investment, peak oil, and the end of economic growth. Annals of the New York Academy of Sciences 1219, 1: 52–72. [Google Scholar] [CrossRef] [PubMed]
- Mutuku, C. 2015. Assessing fiscal policy cyclicality and sustainability: A fiscal reaction function for Kenya. Journal of Economics Library 2, 3: 173–191. [Google Scholar]
- Nicholls, G. P., and A. Peter. 2014. Fiscal sustainability and public debt limits in the Caribbean: an illustrative analysis. Caribbean Renewal. [Google Scholar]
- Randall, W. S., and M. Theodore Farris. 2009. Utilizing cash-to-cash to benchmark company performance. Benchmarking: An International Journal 16, 4: 449–461. [Google Scholar] [CrossRef]
- Sadiq, M., R. Shinwari, M. Usman, I. Ozturk, and A. I. Maghyereh. 2022. Linking nuclear energy, human development and carbon emission in BRICS region: do external debt and financial globalization protect the environment? Nuclear Engineering and Technology 54, 9: 3299–3309. [Google Scholar] [CrossRef]
- Schneider, F., G. Kallis, and J. Martinez-Alier. 2010. Crisis or opportunity? Economic degrowth for social equity and ecological sustainability. Introduction to this special issue. Journal of cleaner production 18, 6: 511–518. [Google Scholar] [CrossRef]
- Sevda, A. K. A. R. 2019. Testing the fiscal fatigue phenomenon in Turkey using a long-run non-linear fiscal reaction function approach. Quantitative Finance and Economics 3, 4: 645–660. [Google Scholar]
- Sharma, V., and A. Mittal. 2019. Fiscal deficit, capital formation, and economic growth in India: a nonlinear ARDL model. Decision 46, 4: 353–363. [Google Scholar] [CrossRef]
- Shastri, S., A. K. Giri, and G. Mohapatra. 2018. Fiscal sustainability in major South Asian economies: Evidences from panel data analysis. Journal of Economic Cooperation & Development 39, 2: 69–93. [Google Scholar]
- Soegiarto, E., Y. Palinggi, F. Reza, and S. Purwanti. 2022. Human Capital, Difussion Model, And Endogenous Growth: Evidence From Arellano-Bond Specification. Webology 19, 2. [Google Scholar]
- Velinov, A. 2015. Assessing fiscal-policy sustainability: on the different states of the Debt-To-GDP process. FinanzArchiv/Public Finance Analysis, 415–439. [Google Scholar] [CrossRef]
- Wang, Q. J., H. J. Wang, G. F. Feng, and C. P. Chang. 2023. Impact of digital transformation on performance of environment, social, and governance: Empirical evidence from China. Business Ethics, the Environment & Responsibility 32, 4: 1373–1388. [Google Scholar]
- Younis, F., and M. A. Chaudhary. 2017. Sustainable development: Economic, social, and environmental sustainability in Asian economies. [Google Scholar]
Table 1.
Variable description.
| Variables | Measurement | abbreviation | Source |
| Independent Variables | |||
| Environmental Index | EI | ||
| Water |
|
ST FW |
ESG Data, World Bank |
| Energy |
|
FF RE |
ESG Data, World Bank |
| Biodiversity |
|
AL FA |
ESG Data, World Bank |
| Pollution |
|
CO2 | ESG Data, World Bank |
| Social Index | SI | ||
| Human development |
|
SE IU ES |
ESG Data, World Bank |
| Social development |
|
SE HE WP LF |
ESG Data, World Bank |
| Governance Index | GI | ||
| Political governance |
|
PS VAA |
WGI, World Bank |
| Legal governance |
|
GE ROL |
WGI, World Bank |
| Regulatory governance |
|
COC RQ |
WGI, World Bank |
| Government debt | Government debt percent of GDP | GD | IMF |
| Dependent Variable | |||
| Primary Fiscal balance | Government primary balance, percent of GDP | FB | IMF |
| Control Variables | |||
| Trade openness | The sum of exports and imports relative to GDP | TOP | WDI, World Bank |
| Oil price | Brent oil | OilP | Investing.com |
| GDP growth | GDP growth (annual %) | GDPG | WDI, World Bank |
| Inflation | Consumer price index | INF | WDI, World Bank |
Table 3.
GMM results.
| Primary Fiscal balance | ||||||||
| Dissociated E, S, G | ||||||||
| Main | T-Value | E | T-Value | S | T-Value | G | T-Value | |
| Debtt−1 | -0.20*** | -7.22 | -0.38*** | -10.19 | -0.11** | -2.91 | -0.13*** | -6.09 |
| Debt2t−1 | 0.002*** | 6.15 | 0.003*** | 6.80 | 0.001** | 2.30 | 0.009*** | 3.36 |
| Debt3t−1 | -0.005** | -2.14 | -0.004*** | -3.12 | -0.005*** | -4.01 | -0.001* | -1.96 |
| ESG Index | -0.83*** | -3.12 | ||||||
| Environment Index | -0.96** | -2.46 | ||||||
| Social Index | -0.14* | -1.96 | ||||||
| Governance Index | -0.99* | -1.97 | ||||||
| Control variables | ||||||||
| Trade openness | -0.002* | -1.96 | -0.01 | -0.56 | -0.01** | -2.12 | -0.005 | -1.30 |
| Oil price | -0.031* | -1.93 | -0.09* | -1.92 | -0.003 | -0.21 | -0.047* | -1.93 |
| GDP Growth | -0.064* | -1.98 | -0.03* | -1.99 | -0.28*** | -7.05 | -0.094* | -1.95 |
| Inflation | 0.41*** | 8.01 | 0.66*** | 6.59 | 0.192*** | 4.33 | 0.03*** | 2.84 |
| Diagnostic tests | ||||||||
| AR(1) | 0.004 | 0.03 | 0.04 | 0.01 | ||||
| AR(2) | 0.31 | 0.71 | 0.38 | 0.11 | ||||
| Sargan Test | 0.001 | 0.000 | 0.000 | 0.000 | ||||
Note: *,**,*** shows 10%, 5%, and 1 % level of significance.
Table 4.
Random Effect Results.
| Primary Fiscal balance | ||||||||
| Dissociated E, S, G | ||||||||
| Main | T-Value | E | T-Value | S | T-Value | G | T-Value | |
| Debtt−1 | -0.01*** | -3.62 | -0.16** | -2.39 | -0.11** | -2.43 | -0.12* | -1.91 |
| Debt2t−1 | 0.002*** | 3.43 | 0.001* | 1.99 | 0.001** | 2.40 | 0.001** | 2.36 |
| Debt3t−1 | -0.001** | -2.21 | -0.001* | -1.73 | -0.002* | -1.84 | -0.001* | -1.90 |
| ESG Index | -0.13** | -2.29 | ||||||
| Environment Index | -0.36** | -2.29 | ||||||
| Social Index | -0.20* | -1.93 | ||||||
| Governance Index | -0.19* | -1.97 | ||||||
| Control variables | ||||||||
| Trade openness | -0.002 | -1.46 | -0.01 | -0.36 | -0.01 | -1.12 | -0.005* | -1.80 |
| Oil price | -0.021** | -2.33 | -0.01* | -1.92 | -0.001 | -1.21 | -0.02** | -2.23 |
| GDP Growth | -0.024** | -2.38 | -0.01 | -1.29 | -0.18** | -2.05 | -0.03* | -1.95 |
| Inflation | 0.21*** | 3.01 | 0.26*** | 4.11 | 0.29** | 2.23 | 0.11** | 2.44 |
Note: *,**,*** shows 10%, 5%, and 1 % level of significance.
Table 5.
Fixed Effect Results.
| Primary Fiscal balance | ||||||||
| Dissociated E, S, G | ||||||||
| Main | T-Value | E | T-Value | S | T-Value | G | T-Value | |
| Debtt−1 | -0.01** | -2.23 | -0.16* | -1.99 | -0.11** | -2.13 | -0.23** | -2.31 |
| Debt2t−1 | 0.001** | 2.17 | 0.001* | 1.90 | 0.003** | 2.50 | 0.001** | 2.29 |
| Debt3t−1 | -0.002*** | -3.33 | -0.001* | -1.73 | -0.001** | -2.35 | -0.002** | -2.12 |
| ESG Index | -0.23*** | -3.42 | ||||||
| Environment Index | -0.36** | -2.12 | ||||||
| Social Index | -0.39* | -1.99 | ||||||
| Governance Index | -0.29** | -2.33 | ||||||
| Control variables | ||||||||
| Trade openness | 0.002 | 1.36 | -0.001 | -0.13 | -0.03 | -0.22 | -0.001 | -0.003 |
| Oil price | -0.011* | -1.80 | -0.01 | -1.57 | -0.01 | -1.31 | -0.01 | -1.46 |
| GDP Growth | -0.02*** | -3.37 | -0.01* | -1.69 | -0.22*** | -6.21 | -0.23* | -1.95 |
| Inflation | 0.41*** | 6.21 | 0.23*** | 3.21 | 0.39* | 1.93 | 0.21*** | 4.34 |
Note: *, **,*** shows 10%, 5%, and 1 % level of significance.
Disclaimer/Publisher’s Note: The statements, opinions and data contained in all publications are solely those of the individual author(s) and contributor(s) and not of MDPI and/or the editor(s). MDPI and/or the editor(s) disclaim responsibility for any injury to people or property resulting from any ideas, methods, instructions or products referred to in the content. |
© 2025 by the authors. Licensee MDPI, Basel, Switzerland. This article is an open access article distributed under the terms and conditions of the Creative Commons Attribution (CC BY) license (http://creativecommons.org/licenses/by/4.0/).
Copyright: This open access article is published under a Creative Commons CC BY 4.0 license, which permit the free download, distribution, and reuse, provided that the author and preprint are cited in any reuse.


