
Submitted:
21 July 2025
Posted:
23 July 2025
You are already at the latest version
Abstract
Objective: This study aimed to identify baseline demographic, clinical, and psychosocial predictors of treatment response in adolescents with anorexia nervosa (AN) undergoing an intensive 20-week enhanced cognitive behavioral therapy (CBT-E) program, which included inpatient and day patient phases. Treatment outcomes were assessed at the end of intensive treatment (EOIT) and at a 20-week follow-up.
Method: A prospective cohort of 68 adolescents under the age of 16 consecutively admitted to intensive CBT-E was evaluated. Baseline measures included body mass index (BMI)-for-age percentiles, percentage of expected body weight (%EBW), eating disorder psychopathology (EDE-Q), general psychopathology, and functional impairment.
Results: Of those who began treatment, 83.4% completed the program and 70.2% were available for follow-up assessment. Based on intent-to-treat analysis, 94.1% achieved a "good BMI outcome" and 73.5% met criteria for “full response” at EOIT. At follow-up, 64.7% maintained a good BMI and 55.9% sustained a full response. No baseline demographic or clinical variables predicted treatment completion or outcome at either time point. The only significant association was between younger age at admission and higher levels eating disorder psychopathology at follow-up.
Conclusions: The lack of reliable predictors of treatment outcome suggests that CBT-E can be potentially effective for all adolescents aged 11–15 with AN. However, the observed association between younger age and elevated psychopathology at follow-up may indicate the need for age-tailored treatment strategies to enhance long-term psychological recovery.
Keywords:
anorexia nervosa
; adolescents
; cognitive behavior therapy
; predictors
; full response
; inpatient treatment
; cohort study
; prospective study
1. Introduction
Anorexia nervosa (AN) typically emerges during adolescence and is associated with severe functional impairment, significant medical complications, reduced quality of life, and an elevated risk of mortality (Solmi et al., 2022; van Hoeken & Hoek, 2020). Retrospective studies suggest that a longer duration of untreated AN is a strong predictor of poorer outcomes (Austin et al., 2021). These findings underscore the urgent need for timely and effective interventions tailored specifically to adolescents with AN, as well as the importance of identifying key predictors of treatment response in this population.
Nevertheless, research investigating factors that predict treatment outcomes in adolescents with AN has produced inconsistent results. Some studies have identified associations between poorer outcomes and factors such as low body weight at admission, heightened symptom severity (Brown et al., 2020; Delinsky et al., 2010; Grewal et al., 2014; Martin-Wagar et al., 2019; Ornstein et al., 2012; Reilly et al., 2024; Rienecke & Ebeling, 2019; Rienecke et al., 2016; Schlegl et al., 2016), younger age (Hayes et al., 2019; Reilly et al., 2024) or older age (Bentz et al., 2025), co-occurring psychiatric conditions (Reilly et al., 2024; Schlegl et al., 2016), elevated parental expressed emotion (Berona et al., 2018), low perceived parental control (Goddard et al., 2013), and early weight gain or other symptom improvement or weak therapeutic alliance (Accurso et al., 2014; Brown et al., 2020; Le Grange et al., 2014; Madden et al., 2015; Martin-Wagar et al., 2019; Rienecke et al., 2016; Van Huysse et al., 2020).
In contrast, other investigations have reported no significant associations between outcomes and variables such as baseline weight, symptom severity, family dynamics, or comorbid psychopathology (Dancyger et al., 2003; Delinsky et al., 2010; Ngo & Isserlin, 2014; Ornstein et al., 2012). Findings related to depression and anxiety have also been inconclusive: while some research indicates that lower baseline levels predict more favorable outcomes (Fewell et al., 2017; Schlegl et al., 2016), other studies have shown that higher initial levels may correspond to better results in certain patient subgroups (Hayes et al., 2019; Homan et al., 2021; Schlegl et al., 2016).
Notably, these studies primarily focus on usual care in inpatient or day-patient settings, or on family-based treatment (FBT). In contrast, research investigating predictors of treatment response in adolescents receiving enhanced cognitive behavioral therapy for anorexia nervosa (CBT-E)—a treatment recommended by the National Institute for Health and Care Excellence (National Institute for Health and Care and Clinical Excellence, 2017) when FBT is unacceptable, contraindicated, or ineffective—remains scarce. To date, only one study has examined predictors of outpatient CBT-E outcomes in adolescent outpatients (Dalle Grave et al., 2019), reporting no baseline variables as significant predictors of treatment response or dropout. Similarly, the sole investigation of predictors of outcome in inpatient CBT-E for adolescents considered only a single factor—duration of illness—and found no association between illness duration (≤ or >3 years) and either body weight or eating disorder psychopathology at end of treatment or follow-up (Calugi et al., 2024). Finally, a recent study found significant predictors in patients with anorexia nervosa treated in intensive CBT-E, but including only patients over 16 years (Calugi et al., 2025).
Given this significant gap in the literature, the primary aim of the present study is to evaluate predictors of treatment outcomes in adolescents aged 16 years or younger with AN who received intensive CBT-E.
2. Materials and Methods
2.1. Design
This prospective cohort study enrolled adolescents under the age of 16 years who were consecutively admitted to the Department of Eating and Weight Disorders at Villa Garda Hospital (Italy) between January 2016 and March 2024. The study received ethical approval from the GHC Institutional Review Board (Protocol No. 0022GHCIRB). Written informed consent was obtained from each participant and their parent(s) or legal guardian(s), authorizing the collection and anonymized use of clinical data for research purposes.
2.2. Participants
Patients were referred to the unit by general practitioners or secondary care providers. All were first-time admissions to the Villa Garda Eating Disorder Unit, except for two individuals who had previously been treated at the same facility. Half of the sample (50%) had prior hospitalizations for medical stabilization in general pediatric or medical wards, and 56.3% had received treatment in other inpatient eating disorder facilities.
Eligibility criteria for admission included: (i) age between 13 and 65 years; (ii) meeting all DSM-5 diagnostic criteria for an eating disorder (American Psychiatric Association, 2013); (iii) inability to manage the disorder safely in an outpatient setting; and (iv) at least one unsuccessful attempt at outpatient treatment. Exclusion criteria were: (i) current substance abuse; and (ii) active psychotic or bipolar disorders.
Over the study period, 655 patients were admitted to the department. Of these, 68 adolescents (10.4%) met the inclusion criteria of being under 16 years of age with a DSM-5 diagnosis of anorexia nervosa. Among them, 57 patients (83.8%) completed the full treatment program, while 11 (16.2%) discontinued prematurely. Treatment drop-out was defined as ending therapy before completing the scheduled course, due to factors such as low motivation, dissatisfaction with treatment, perceived lack of progress, or ambivalence toward recovery.
At the 20-week post-treatment follow-up, 40 of the 57 treatment completers (70.2%) participated in the follow-up assessment (see Figure 1).Interventionary studies involving animals or humans, and other studies that require ethical approval, must list the authority that provided approval and the corresponding ethical approval code.
2.3. The Treatment
The intervention implemented in this study was based on CBT-E, specifically adapted for adolescent patients in accordance with evidence-based protocols developed at Villa Garda (Dalle Grave et al., 2014).
The program consisted of a 13-week inpatient phase followed by 7 weeks of day-hospital treatment, totaling 20 weeks. Both components were delivered at Villa Garda Hospital in northern Italy, a publicly funded facility affiliated with the National Health Service.
Admission was voluntary and preceded by four preparatory sessions led by a psychologist trained in CBT-E. These sessions aimed to present the treatment model, distinguish between medical and CBT-E psychological approach, build motivation for recovery, and secure the patient’s commitment to begin weight restoration from the first day of hospitalization.
Treatment was delivered in an open-unit setting, enabling patients to confront real-life environmental challenges with the support of a specialized, non-eclectic multidisciplinary team. This team—comprising psychologists, physicians, nurses, dietitians, and physical therapists—was uniformly trained and supervised in CBT-E (Calugi et al., 2024; Dalle Grave & Calugi, 2020), and participated in weekly case-management meetings to ensure individualized, coherent care.
CBT-E was delivered through a combination of individual and group sessions. Individual sessions were conducted twice weekly for the first four weeks and weekly thereafter. Group CBT-E sessions occurred four times per week. A CBT-E-trained dietitian supported patients during meals in the early treatment phase, while medical and nursing staff monitored physical health, conducted collaborative weigh-ins, and provided crisis support.
Following the transdiagnostic model, the treatment targeted both the core psychopathology of eating disorders—namely, the overvaluation of shape, weight, and eating control—and maintaining mechanisms such as low body weight, dietary restriction, dietary restraint, and events and associated change of mood influencing eating, using structured CBT-E modules.
The main focus of the initial phase of CBT-E (Step One) is to work on engagement, motivation-building, and helping patients understand their eating disorder using a personalized cognitive-behavioral formulation. Addressing weight regain, dietary restriction, and other extreme weight control behavior, in-session weighing, and psychoeducation are also introduced in this early phase. In the middle phase (Step Two), treatment addresses the key maintaining mechanisms of the disorder—such as overvaluation of shape and weight, dietary restraint, events and associated change of mood influencing eating. In the final phase (Step Three), the focus is on consolidating the changes achieved and minimizing the risk of relapse after discharge. This plan includes strategies to respond effectively to potential setbacks, maintain new habits, recognize early warning signs of relapse. In addition, the team dietician assists with meal planning at home.
With adolescent patients, parents and/or legal guardians are also involved in joint and separate sessions, as indicated by the CBT-E for adolescent, to enhance family support, to promote a positive home environment, to facilitate adherence to treatment goals and to assist with relapse prevention planning, particularly toward the end of treatment. This is an opportunity for the family to improve communication between its members and to codevelop functional strategies for managing dysfunctional eating behaviors and crises.
At the end of the intensive program, patients are offered 20 optional outpatient CBT-E sessions over a period of 20 weeks. These sessions are designed to consolidate progress, address residual psychopathology, and reinforce relapse-prevention skills.
Overall, intensive CBT-E offers a structured, individualized, and evidence-based intervention for adolescents with anorexia nervosa who have not responded adequately to outpatient treatment. It emphasizes active patient engagement, a collaborative therapeutic relationship, and constructive family environment, to achieve a complete and sustained recovery.
2.4. Assessment
Validated, standardized instruments were used to assess treatment outcomes at three time points: admission (baseline), end of intensive treatment (EOIT), and 20-week follow-up (20-week FU).
- •
- Demographic and clinical characteristics were collected via interview, including age of onset. Weight and height were measured using calibrated equipment (floor scale and wall-mounted stadiometer) on the first day of admission, with patients wearing only underwear. BMI-for-age percentiles were calculated using CDC growth charts (Kuczmarski et al., 2002) (http://www.cdc.gov/growthcharts/percentile_data_files.html) Percentiles below 1 were recorded as 0.5. Expected body weight (EBW) was calculated using the BMI method (Le Grange et al., 2012).
- •
- Eating disorder psychopathology was assessed using the Italian version of the Eating Disorder Examination Questionnaire (EDE-Q, 6th edition) (Calugi et al., 2017; Fairburn, 2008). The internal consistency in our sample was 0.92.
- •
- General psychopathology was measured using the Italian version of the Brief Symptom Inventory (BSI) (De Leo et al., 1993; Derogatis, 1992), for which the Cronbach alpha in our sample was 0.97.
- •
- Functional impairment related to eating disorder symptoms was assessed using the Italian version of the Clinical Impairment Assessment (CIA) (Bohn et al., 2008; Calugi et al., 2018), which also demonstrated strong internal consistency (Cronbach’s α = 0.92).
2.5. Outcome Categories
Two operational outcome categories were adopted:
- 1.
- “Good BMI outcome”: Achieving a BMI-for-age percentile equivalent to an adult BMI of ≥18.5 kg/m², representing the lower threshold of a healthy BMI range (Cole et al., 2007; World Health Organization, 2000).
- 2.
- “Full response”: Meeting both the Good BMI Outcome criteria and having a global EDE-Q score below 2.77, which is less than one standard deviation above the community mean (Mond et al., 2006).
2.6. Statistical Analysis
To address missing data on BMI-for-age percentile, EDE-Q (global and subscale scores), BSI, and CIA scores at both the end of intensive treatment (EOIT) and 20-week follow-up (FU), a multiple imputation approach was employed using fully conditional specification (FCS). This method, appropriate for arbitrary patterns of missingness, was combined with Predictive Mean Matching to preserve the distributional properties of the data (Takahashi, 2017). The proportion of missing data was 16% at EOIT and 41.1% at follow-up.
To evaluate the missing-at-random (MAR) assumption, a multivariable logistic regression was conducted using “missingness” (yes/no) at EOIT as the dependent variable. Baseline predictors included age, duration of illness, BMI-for-age percentile, and global scores on the EDE-Q, BSI, and CIA. No significant associations were found, suggesting that missingness was unrelated to observed baseline characteristics. Similarly, no significant differences were found between participants who completed the follow-up and those who did not (all p-values > .05). Based on this, five imputed datasets were generated, and pooled estimates were used for all subsequent analyses.
To assess changes in clinical outcomes over time, mixed-effects models were used for each primary outcome measure: BMI-for-age percentile, percentage of EBW, EDE-Q global and subscale scores, BSI global score, and CIA global score. Time was modeled as a fixed effect, while participant-level random effects accounted for individual variability, assuming participants were a random sample from a broader treatment-seeking adolescent AN population. A two-level hierarchical structure was specified, with repeated measurements nested within individuals. Maximum likelihood estimation was applied (Raudenbush & Bryk, 2002). To capture potential nonlinear trajectories, quadratic time trends were tested (Shek & Ma, 2011; Singer & Willett, 2003).
Multivariable logistic regression models were employed to identify predictors of treatment drop-out, “good BMI outcome,” and “full response” at EOIT and 20-week follow-up. Predictor variables included baseline characteristics (age, duration of illness, baseline BMI-for-age percentile, EDE-Q, BSI, and CIA global scores) as well as changes from baseline to EOIT in BMI, EDE-Q, BSI, and CIA scores.
In addition, linear regression analyses were conducted to explore which baseline or change variables predicted BMI-for-age percentile and eating disorder psychopathology (EDE-Q global score) at EOIT and follow-up.
Descriptive statistics are reported as means and standard deviations (SD) or frequencies and percentages, as appropriate. All analyses were performed using IBM SPSS Statistics, Version 29.0 (Released 2024; Armonk, NY: IBM Corp.).
3. Results
3.1. The Sample
The sample included 68 female adolescent patients with AN. Table 1 shows the main demographic and clinical characteristics of the sample: mean age = 14.6 years (SD = 1.0, range 11-15.99 years), mean BMI-for-age percentile = 5.0 (SD = 7.6; range 0.4-40.5), and mean duration of illness = 1.8 years (SD = 1.3; range: 0–8 years).
3.2. Intent-to-Treat Findings at EOIT and 20-Week FU
Treatment completion and follow-up
Fifty-seven (83.8%) completed the intensive CBT-E program. Of those, 40 (70.2%) attended follow-up interviews at 20 weeks. About 97.5% of follow-up responders received some form of post-discharge treatment, with 89.7% of those patients receiving a 20-week CBT-E-based treatment by trained therapists living close to their place of residence.
Linear mixed models indicated an initial significant increase in BMI-for-age percentile and EBW (linear growth) over treatment, and a subsequent deceleration in the rate of change (quadratic growth) during the follow-up. Both EDE-Q subscale and global scores and CIA global scores mirrored this pattern, all significantly decreasing over treatment and then displaying a deceleration in the rate of change at 20-week FU. BSI global score showed a significant linear improvement from baseline to 20-week FU (Table 2).
Among the 68 patients assessed at baseline, 94.1% achieved a “good BMI outcome”, while 73.5% experienced both a “full response” at EOIT. At the 20-week FU, 64.7% maintained a “good BMI outcome” and 55.9% remained in “full response”.
3.3. Predictors of Treatment Outcome
Table 3a and Table 3b present the results of multivariable logistic and linear regression analyses examining drop-out rates and treatment outcomes at EOIT and 20-week FU, including all 68 adolescent patients (intention-to-treat analysis). The multivariable logistic regression analysis revealed that none of the demographic or baseline clinical variables were significantly associated with the drop-out rate, with “good BMI outcome” and with “full response” both at EOIT and at 20-week FU.
The findings of the linear regression analysis confirmed the absence of predictive variables of treatment outcomes, except age, which was a significant predictor of eating-disorder psychopathology at 20-week FU: lower age predicted higher EDE-Q global score at follow-up.
4. Discussion
This study investigated whether baseline demographic, clinical, and psychosocial variables could predict treatment outcomes or drop-out in a cohort of female adolescents under 16 years of age with anorexia nervosa (AN) who received an intensive 20-week course of enhanced cognitive behavioral therapy (CBT-E). Three main findings emerged.
First, no baseline variables were found to predict treatment drop-out. This finding is consistent with prior research on CBT-E in both adolescent and adult populations (Calugi et al., 2015; Craig et al., 2019; Dalle Grave et al., 2019). While previous meta-analyses identified motivation to change as a significant predictor of attrition (Gregertsen et al., 2019), motivation was not formally assessed in the present study. Nevertheless, our treatment model includes a structured pre-admission process comprising motivational enhancement and informed commitment to weight restoration. This may have contributed to the low drop-out rate (16.2%) and may help explain the absence of predictors.
Second, no baseline demographic or clinical characteristics were associated with treatment outcome at EOIT or 20-week follow-up, in line with prior studies evaluating CBT-E in adolescents (Craig et al., 2019; Dalle Grave et al., 2019). The sole exception was age: younger adolescents (particularly those aged 11–13) exhibited higher levels of eating disorder psychopathology at follow-up, although their weight outcomes were comparable to older participants. This finding, not previously reported, raises the possibility that early adolescent patients may benefit from tailored enhancements to standard CBT-E—especially with regard to addressing the overvaluation of weight and shape, body image concerns, and dietary restraint. Additional strategies may also be needed during the final treatment phase to support transition and prevent relapse.
Third, treatment outcomes were positive and sustained. Among those who completed treatment, substantial improvements were observed in weight restoration, eating disorder psychopathology, general psychological distress, and functional impairment. These gains were largely maintained at follow-up, even in the absence of extensive additional care. Mixed-effects models confirmed a stable trajectory of improvement across time points. Over 90% of patients achieved a “good BMI outcome” and more than 70% met full response criteria at the end of treatment; at follow-up, these figures remained relatively high, at 64.7% and 55.9%, respectively. These outcomes are comparable to those reported in earlier studies involving older adolescents or mixed-age cohorts treated with CBT-E in both outpatient and intensive settings (Calugi et al., 2023; Dalle Grave et al., 2020; Dalle Grave et al., 2023).
To our knowledge, this is the first study to evaluate outcomes of intensive CBT-E in a sample consisting exclusively of younger adolescent females with AN. Despite its strengths—including a real-world clinical setting, a manualized treatment approach, and validated outcome measures—some limitations warrant consideration. First, the modest sample size limited statistical power to detect subtle predictor effects. Second, the relatively short follow-up period precludes conclusions about long-term outcomes and durability of treatment effects. Third, relevant psychological predictors such as motivation to change and personality traits were not assessed. Finally, the influence of post-discharge outpatient CBT-E sessions on follow-up outcomes could not be evaluated due to resource constraints.
In conclusion, intensive CBT-E appears to be a highly effective treatment for younger adolescents with AN, producing robust improvements in weight and psychopathology that are largely sustained over time. While treatment outcomes do not seem to be influenced by baseline clinical variables, younger age may be associated with greater residual psychopathology at follow-up, underscoring the need for potential adaptations to the standard CBT-E model in early adolescence. Further research using larger samples and extended follow-up is needed to replicate and expand upon these findings, especially given the clinical importance of optimizing treatment for this vulnerable age group.
Author Contributions
Conceptualization, R.D.G. and S.C.; methodology, S.C.; software, S.C., M.C., A.D.G., G.C.; formal analysis, S.C., M.C., A.D.G., G.C.; data curation, M.C., A.D.G., G.C.; writing—original draft preparation, S.C., M.C., A.D.G., G.C.; writing—review and editing, R.D.G. and S.C. All authors have read and agreed to the published version of the manuscript.
Funding
This research received no external funding.
Informed Consent Statement
Each participant and their parent(s) and/or legal guardian(s) provided informed written consent to collect and process their anonymized clinical data for research purposes.
Data Availability Statement
The data supporting this study's findings are available from the corresponding author, SC, upon reasonable request.
Conflicts of Interest
The authors declare no conflicts of interest.
References
- Accurso, E. C., Ciao, A. C., Fitzsimmons-Craft, E. E., Lock, J. D., & Le Grange, D. (2014). Is weight gain really a catalyst for broader recovery?: The impact of weight gain on psychological symptoms in the treatment of adolescent anorexia nervosa. Behav Res Ther, 56, 1-6. [CrossRef]
- Austin, A., Flynn, M., Richards, K., Hodsoll, J., Duarte, T. A., Robinson, P., Kelly, J., & Schmidt, U. (2021). Duration of untreated eating disorder and relationship to outcomes: A systematic review of the literature. Eur Eat Disord Rev, 29(3), 329-345. [CrossRef]
- Bentz, M., Pedersen, S. H., Moslet, U., Petersen, N., & Pagsberg, A. K. (2025). Predictors of response to family-based treatment for anorexia nervosa in youth: insights from the VIBUS project. Eur Child Adolesc Psychiatry. [CrossRef]
- Berona, J., Richmond, R., & Rienecke, R. D. (2018). Heterogeneous weight restoration trajectories during partial hospitalization treatment for anorexia nervosa. Int J Eat Disord, 51(8), 914-920. [CrossRef]
- Bohn, K., Doll, H. A., Cooper, Z., O'Connor, M., Palmer, R. L., & Fairburn, C. G. (2008). The measurement of impairment due to eating disorder psychopathology. Behav Res Ther, 46(10), 1105-1110. [CrossRef]
- Brown, T. A., Murray, S. B., Anderson, L. K., & Kaye, W. H. (2020). Early predictors of treatment outcome in a partial hospital program for adolescent anorexia nervosa. Int J Eat Disord, 53(9), 1550-1555. [CrossRef]
- Calugi, S., Cattaneo, G., Chimini, M., Dalle Grave, A., Conti, M., & Dalle Grave, R. (2025). Predictors of Intensive Enhanced Cognitive Behavioral Therapy for Anorexia Nervosa. Prospective Cohort Study. Int J Eat Disord. [CrossRef]
- Calugi, S., Dalle Grave, A., Chimini, M., Lorusso, A., & Dalle Grave, R. (2024). Illness duration and treatment outcome of intensive cognitive-behavioral therapy in adolescents with anorexia nervosa. Int J Eat Disord, 57(7), 1566-1575. [CrossRef]
- Calugi, S., Dalle Grave, A., Conti, M., Dametti, L., Chimini, M., & Dalle Grave, R. (2023). The Role of Weight Suppression in Intensive Enhanced Cognitive Behavioral Therapy for Adolescents with Anorexia Nervosa: A Longitudinal Study. Int J Environ Res Public Health, 20(4). [CrossRef]
- Calugi, S., Dalle Grave, R., Sartirana, M., & Fairburn, C. G. (2015). Time to restore body weight in adults and adolescents receiving cognitive behaviour therapy for anorexia nervosa. J Eat Disord, 3, 21. [CrossRef]
- Calugi, S., Milanese, C., Sartirana, M., El Ghoch, M., Sartori, F., Geccherle, E., Coppini, A., Franchini, C., & Dalle Grave, R. (2017). The Eating Disorder Examination Questionnaire: reliability and validity of the Italian version. Eat Weight Disord, 22(3), 509-514. [CrossRef]
- Calugi, S., Sartirana, M., Milanese, C., El Ghoch, M., Riolfi, F., & Dalle Grave, R. (2018). The clinical impairment assessment questionnaire: validation in Italian patients with eating disorders. Eat Weight Disord, 23(5), 685-694. [CrossRef]
- Cole, T. J., Flegal, K. M., Nicholls, D., & Jackson, A. A. (2007). Body mass index cut offs to define thinness in children and adolescents: international survey. Bmj, 335(7612), 194. [CrossRef]
- Craig, M., Waine, J., Wilson, S., & Waller, G. (2019). Optimizing treatment outcomes in adolescents with eating disorders: The potential role of cognitive behavioral therapy. Int J Eat Disord. [CrossRef]
- Dalle Grave, R., & Calugi, S. (2020). Cognitive Behavior Therapy for Adolescents with Eating Disorders. Guilford Press.
- Dalle Grave, R., Calugi, S., El Ghoch, M., Conti, M., & Fairburn, C. G. (2014). Inpatient cognitive behavior therapy for adolescents with anorexia nervosa: immediate and longer-term effects. Front Psychiatry, 5, 14. [CrossRef]
- Dalle Grave, R., Conti, M., & Calugi, S. (2020). Effectiveness of intensive cognitive behavioral therapy in adolescents and adults with anorexia nervosa. Int J Eat Disord, 53(9), 1428-1438. [CrossRef]
- Dalle Grave, R., Sartirana, M., & Calugi, S. (2019). Enhanced cognitive behavioral therapy for adolescents with anorexia nervosa: Outcomes and predictors of change in a real-world setting. Int J Eat Disord, 52(9), 1042-1046. [CrossRef]
- Dalle Grave, R., Sartirana, M., Dalle Grave, A., & Calugi, S. (2023). Effectiveness of enhanced cognitive behaviour therapy for patients aged 14 to 25: A promising treatment for anorexia nervosa in transition-age youth. Eur Eat Disord Rev. [CrossRef]
- Dancyger, I., Fornari, V., Schneider, M., Fisher, M., Frank, S., Goodman, B., Sison, C., & Wisotsky, W. (2003). Adolescents and eating disorders: an examination of a day treatment program. Eat Weight Disord, 8(3), 242-248. [CrossRef]
- De Leo, D., Frisoni, G. B., Rozzini, R., & Trabucchi, M. (1993). Italian community norms for the Brief Symptom Inventory in the elderly. Br J Clin Psychol, 32 (Pt 2), 209-213.
- Delinsky, S. S., St Germain, S. A., Thomas, J. J., Craigen, K. E., Fagley, W. H., Weigel, T. J., Levendusky, P., & Becker, A. E. (2010). Naturalistic study of course, effectiveness, and predictors of outcome among female adolescents in residential treatment for eating disorders. Eat Weight Disord, 15(3), e127-135. [CrossRef]
- Derogatis, L. R. (1992). The brief symptom inventory (BSI): administration, scoring & procedures manual-II. Clinical Psychometric Research.
- Fairburn, C. G. (2008). Cognitive behavior therapy and eating disorders. Guilford Press.
- Fewell, L. K., Levinson, C. A., & Stark, L. (2017). Depression, worry, and psychosocial functioning predict eating disorder treatment outcomes in a residential and partial hospitalization setting. Eat Weight Disord, 22(2), 291-301. [CrossRef]
- Goddard, E., Hibbs, R., Raenker, S., Salerno, L., Arcelus, J., Boughton, N., Connan, F., Goss, K., Laszlo, B., Morgan, J., Moore, K., Robertson, D., S, S., Schreiber-Kounine, C., Sharma, S., Whitehead, L., Schmidt, U., & Treasure, J. (2013). A multi-centre cohort study of short term outcomes of hospital treatment for anorexia nervosa in the UK. BMC Psychiatry, 13, 287. [CrossRef]
- Gregertsen, E. C., Mandy, W., Kanakam, N., Armstrong, S., & Serpell, L. (2019). Pre-treatment patient characteristics as predictors of drop-out and treatment outcome in individual and family therapy for adolescents and adults with anorexia nervosa: A systematic review and meta-analysis. Psychiatry Res, 271, 484-501. [CrossRef]
- Grewal, S., Jasper, K., Steinegger, C., Yu, E., & Boachie, A. (2014). Factors associated with successful completion in an adolescent-only day hospital program for eating disorders. Eat Disord, 22(2), 152-162. [CrossRef]
- Hayes, N. A., Welty, L. J., Slesinger, N., & Washburn, J. J. (2019). Moderators of treatment outcomes in a partial hospitalization and intensive outpatient program for eating disorders. Eat Disord, 27(3), 305-320. [CrossRef]
- Homan, K. J., Crowley, S. L., & Rienecke, R. D. (2021). Predictors of improvement in a family-based partial hospitalization/intensive outpatient program for eating disorders. Eat Disord, 29(6), 644-660. [CrossRef]
- Kuczmarski, R. J., Ogden, C. L., Guo, S. S., Grummer-Strawn, L. M., Flegal, K. M., Mei, Z., Wei, R., Curtin, L. R., Roche, A. F., & Johnson, C. L. (2002). 2000 CDC Growth Charts for the United States: methods and development. Vital Health Stat 11(246), 1-190.
- Le Grange, D., Accurso, E. C., Lock, J., Agras, S., & Bryson, S. W. (2014). Early weight gain predicts outcome in two treatments for adolescent anorexia nervosa. Int J Eat Disord, 47(2), 124-129. [CrossRef]
- Le Grange, D., Doyle, P. M., Swanson, S. A., Ludwig, K., Glunz, C., & Kreipe, R. E. (2012). Calculation of expected body weight in adolescents with eating disorders. Pediatrics, 129(2), e438-446. [CrossRef]
- Madden, S., Miskovic-Wheatley, J., Wallis, A., Kohn, M., Hay, P., & Touyz, S. (2015). Early weight gain in family-based treatment predicts greater weight gain and remission at the end of treatment and remission at 12-month follow-up in adolescent anorexia nervosa. Int J Eat Disord, 48(7), 919-922. [CrossRef]
- Martin-Wagar, C. A., Holmes, S., & Bhatnagar, K. A. C. (2019). Predictors of Weight Restoration in a Day-Treatment Program that Supports Family-Based Treatment for Adolescents with Anorexia Nervosa. Eat Disord, 27(4), 400-417. [CrossRef]
- Mond, J. M., Hay, P. J., Rodgers, B., & Owen, C. (2006). Eating Disorder Examination Questionnaire (EDE-Q): norms for young adult women. Behav Res Ther, 44(1), 53-62. [CrossRef]
- National Institute for Health and Care and Clinical Excellence. (2017). Eating disorders: recognition and treatment | Guidance and guidelines | NICE. Retrieved from https://www.nice.org.uk/guidance/ng69. In.
- Ngo, M., & Isserlin, L. (2014). Body weight as a prognostic factor for day hospital success in adolescents with anorexia nervosa. Eat Disord, 22(1), 62-71. [CrossRef]
- Ornstein, R. M., Lane-Loney, S. E., & Hollenbeak, C. S. (2012). Clinical outcomes of a novel, family-centered partial hospitalization program for young patients with eating disorders. Eat Weight Disord, 17(3), e170-177. [CrossRef]
- Raudenbush, S. W., & Bryk, A. S. (2002). Hierarchical linear models: Applications and data analysis methods (2nd ed.). Sage.
- Reilly, E. E., Gorrell, S., Duffy, A., Blalock, D. V., Mehler, P., Brandt, H., McClanahan, S., Zucker, K., Lynch, N., Singh, S., Drury, C. R., Le Grange, D., & Rienecke, R. D. (2024). Predictors of treatment outcome in higher levels of care among a large sample of adolescents with heterogeneous eating disorders. Child Adolesc Psychiatry Ment Health, 18(1), 131. [CrossRef]
- Rienecke, R. D., & Ebeling, M. (2019). Desired weight and treatment outcome among adolescents in a novel family-based partial hospitalization program. Psychiatry Res, 273, 149-152. [CrossRef]
- Rienecke, R. D., Richmond, R., & Lebow, J. (2016). Therapeutic alliance, expressed emotion, and treatment outcome for anorexia nervosa in a family-based partial hospitalization program. Eat Behav, 22, 124-128. [CrossRef]
- Schlegl, S., Diedrich, A., Neumayr, C., Fumi, M., Naab, S., & Voderholzer, U. (2016). Inpatient Treatment for Adolescents with Anorexia Nervosa: Clinical Significance and Predictors of Treatment Outcome. Eur Eat Disord Rev, 24(3), 214-222. [CrossRef]
- Shek, D. T., & Ma, C. M. (2011). Longitudinal data analyses using linear mixed models in SPSS: concepts, procedures and illustrations. The Scientific World Journal, 11, 42-76. [CrossRef]
- Singer, J. D., & Willett, J. B. (2003). Applied longitudinal data analysis. Oxford Press.
- Solmi, M., Radua, J., Olivola, M., Croce, E., Soardo, L., Salazar de Pablo, G., Il Shin, J., Kirkbride, J. B., Jones, P., Kim, J. H., Kim, J. Y., Carvalho, A. F., Seeman, M. V., Correll, C. U., & Fusar-Poli, P. (2022). Age at onset of mental disorders worldwide: large-scale meta-analysis of 192 epidemiological studies. Mol Psychiatry, 27(1), 281-295. [CrossRef]
- Takahashi, M. (2017). Statistical inference in missing data by MCMC and non-MCMC multiple imputation Aagorithms: Assessing the effects of between-imputation iterations. Data Science Journal, 16(37), 1-17. [CrossRef]
- van Hoeken, D., & Hoek, H. W. (2020). Review of the burden of eating disorders: mortality, disability, costs, quality of life, and family burden. Curr Opin Psychiatry, 33(6), 521-527. [CrossRef]
- Van Huysse, J. L., Smith, K., Mammel, K. A., Prohaska, N., & Rienecke, R. D. (2020). Early weight gain predicts treatment response in adolescents with anorexia nervosa enrolled in a family-based partial hospitalization program. Int J Eat Disord, 53(4), 606-610. [CrossRef]
- World Health Organization. (2000). Obesity: Preventing and managing the global epidemic: Report of a WHO consultation. WHO Technical Report Series, 894 (WHO Technical Report Series, Issue.
Figure 1.
Flow-chart with inclusion and exclusion criteria of the study.
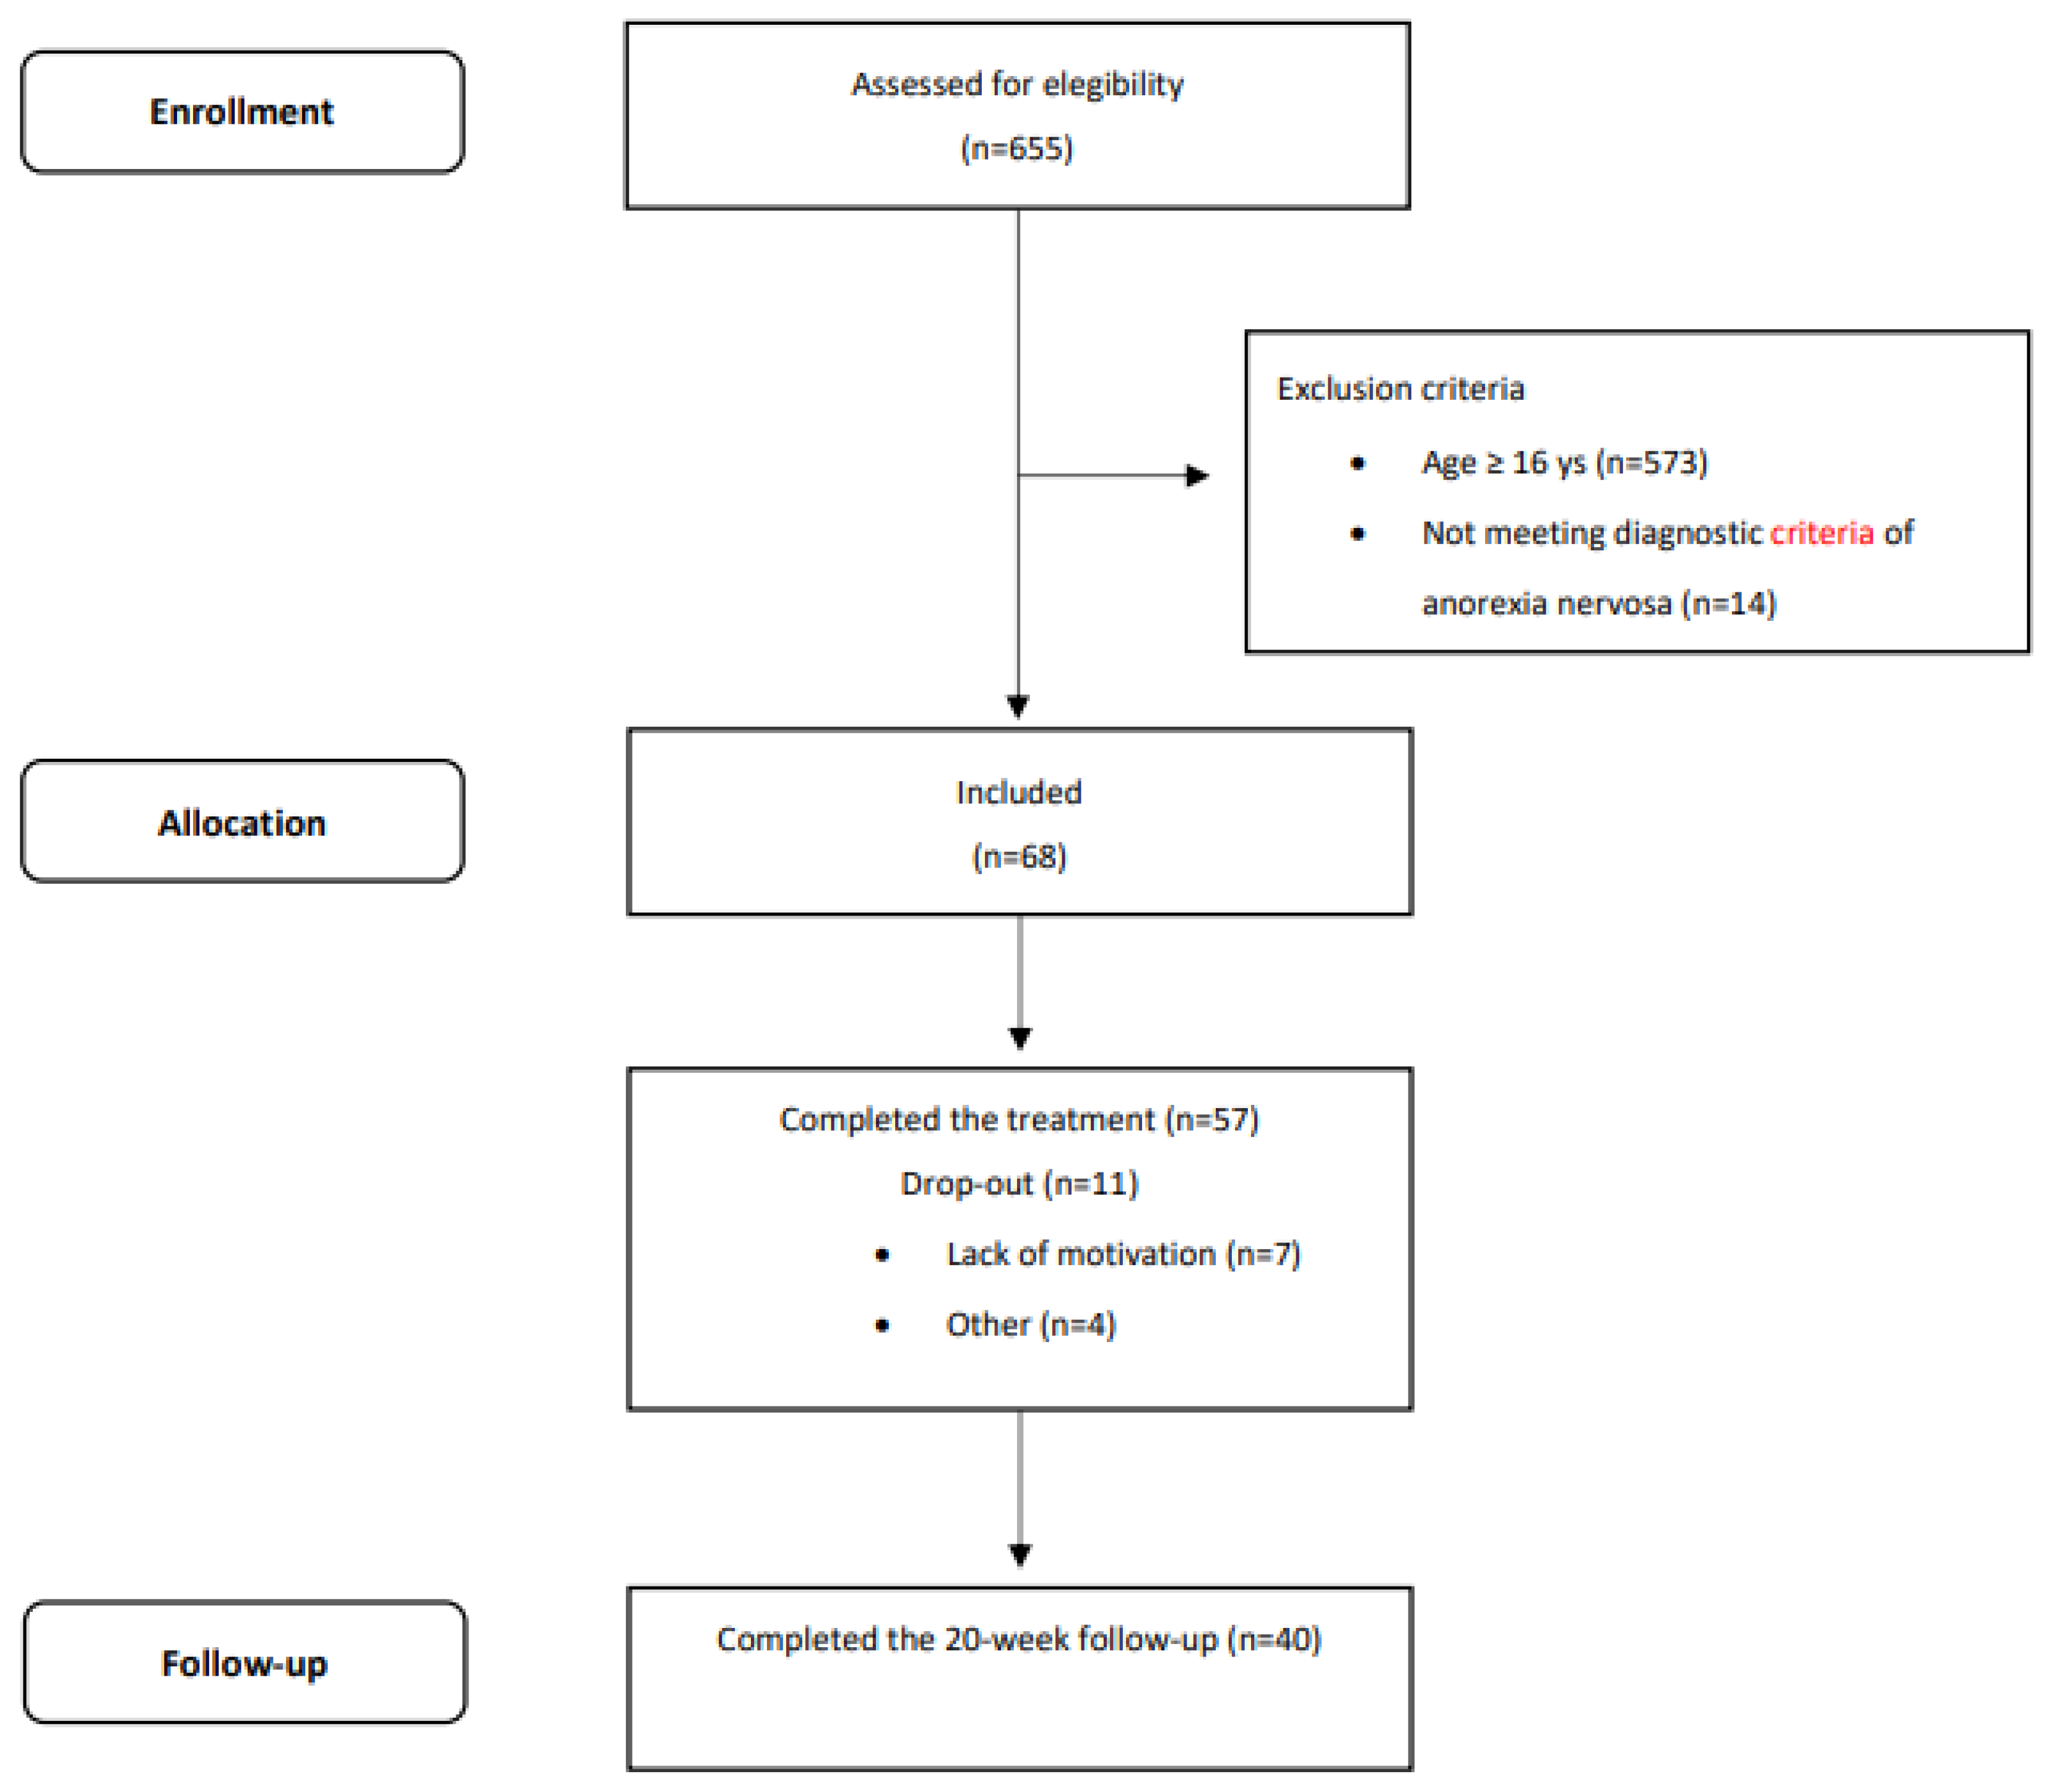

Table 2.
Mean (SE) of baseline, end of intensive treatment - inpatient followed by day patient” (EOIT) and the 20-week follow-up (20-week FU) data in 68 adolescent patients (≤16 years) with anorexia nervosa. An intent-to-treat analysis with a multiple imputation procedure was used. Pooled data are presented.
| Mean and (SE) | Analysis of variance for repeated measures | Linear mixed model | ||||
| Baselinea | EOITb | 20-week FUc | Pairwise Comparisons* | Linear growth | Quadratic growth | |
| BMI-for-age percentile | 5.0 (0.9) | 49.2 (2.3) | 41.2 (7.9) | a<b,c; b>c | β = 167.98 t = 7.90, p < .001 |
β =-149.62, t = 6.43, p < .001 |
| Expected Body Weight | 77.1 (1.2) | 101.8 (1.9) | 99.1 (3.7) | a<b,c; b>c | β = 92.19 t = 20.92, p < .001 |
β =-73.33, t = 17.18, p < .001 |
| Eating Disorder Examination Questionnaire | ||||||
| Restraint | 4.1 (0.2) | 0.9 (0.3) | 1.4 (0.5) | a>b,c; b<c | β = -12.40, t = 6.48, p < .001 |
β = 10.96, t = 4.72, p < .001 |
| Eating concern | 3.4 (0.1) | 1.3 (0.1) | 1.2 (0.2) | a>b,c | β = -7.69, t = 9.95, p < .001 |
β = 6.15, t = 5.96, p < .001 |
| Weight concern | 4.0 (0.2) | 2.1 (0.2) | 1.8 (0.2) | a>b,c; b>c | β = -6.83, t = 8.30, p < .001 |
β = 5.02, t = 5.05, p < .001 |
| Shape concern | 4.8 (0.1) | 3.3 (0.2) | 2.9 (0.2) | a>b,c; b>c | β = -4.48, t = 4.94, p < .001 |
β = 2.67, t = 2.46, p = 0.014 |
| Global score | 4.1 (0.1) | 2.1 (0.2) | 1.9 (0.2) | a>b,c | β = -7.85, t = 10.52, p < .001 |
β = 6.20, t = 7.22, p < .001 |
| Brief Symptom Inventory | ||||||
| Global score | 2.1 (0.1) | 1.2 (0.2) | 1.1 (0.5) | a>b,c | β = -3.10, t = 2.85, p = 0.006 |
β = 2.31, t = 1.57, p = 0.140 |
| Clinical Impairment Assessment | ||||||
| Global score | 33.7 (1.3) | 16.4 (1.8) | 15.2 (2.7) | a>b,c | β = -60.27, t = 6.83, p < .001 |
β = 45.68, t = 4.03, p < .001 |
* Indicate significant differences (p < .05) between baseline (a), EOIT (b) and 20-week FU (c).
Table 3.
a. Multivariable logistic regression analysis of drop-out and the end of intensive treatment - inpatient followed by day patient” (EOIT) and the 20-week follow-up (20-week FU) in 68 adolescent patients (≤16 years) with anorexia nervosa treated via intensive enhanced cognitive behavior therapy (CBT-E). Intent-to-treat analysis with multiple imputation procedure was used. Pooled data are presented.
| Dependent variable: drop-out rate | ||||
| Independent variables | β | p-value | OR | 95% CI OR |
| Age | 0.13 | 0.766 | 1.14 | 0.49 − 2.65 |
| Duration of illness | 0.01 | 0.984 | 1.01 | 0.57 − 1.78 |
| BMI-for-age percentile | -0.05 | 0.388 | 0.95 | 0.83 − 1.07 |
| Eating Disorder Examination Questionnaire (EDE − Q) – global score | 1.34 | 0.086 | 3.81 | 0.83 − 17.54 |
| Brief symptom Inventory (BSI) – global score | -0.48 | 0.578 | 0.62 | 0.11 − 3.41 |
| Clinical Impairment Assessment (CIA) – global score | -0.06 | 0.411 | 0.94 | 0.81 − 1.09 |
| Dependent variable: Good BMI outcome at EOIT | ||||
| Independent variables | β | p-value | OR | 95% CI OR |
| Age | 0.22 | 0.808 | 1.25 | 0.20 − 7.65 |
| Duration of illness | -0.45 | 0.270 | 0.64 | 0.29 − 1.42 |
| BMI-for-age percentile | 12.1 | 0.988 | 0.00 | 0.00 |
| EDE − Q – global score | -0.25 | 0.834 | 0.77 | 0.07 − 8.92 |
| BSI – global score | 0.23 | 0.839 | 1.26 | 0.13 − 12.20 |
| CIA – global score | -0.06 | 0.664 | 0.94 | 0.69 − 1.27 |
| Dependent variable: Full response at EOIT | ||||
| Independent variables | β | p-value | OR | 95% CI OR |
| Age | 0.22 | 0.562 | 1.25 | 0.59 – 2.67 |
| Duration of illness | -0.06 | 0.813 | 0.94 | 0.59 − 1.52 |
| BMI-for-age percentile | 0.03 | 0.504 | 1.03 | 0.94 − 1.14 |
| EDE − Q – global score | -0.22 | 0.691 | 0.80 | 0.27 − 2.39 |
| BSI – global score | 0.47 | 0.470 | 1.60 | 0.45 − 5.72 |
| CIA – global score | -0.08 | 0.244 | 0.92 | 0.80 − 1.06 |
| Dependent variable: Good BMI outcome at 20-week FU | ||||
| Independent variables | β | p-value | OR | 95% CI OR |
| Age | -0.03 | 0.951 | 0.97 | 0.33 − 2.85 |
| Duration of illness | 0.04 | 0.903 | 1.04 | 0.56 − 1.93 |
| BMI-for-age percentile | 0.13 | 0.394 | 1.14 | 0.82 − 1.60 |
| EDE − Q – global score | -0.18 | 0.890 | 0.83 | 0.05 − 14.46 |
| BSI – global score | 1.45 | 0.270 | 4.28 | 0.29 − 63.14 |
| CIA – global score | -0.11 | 0.311 | 0.89 | 0.71 − 1.12 |
| Delta BMI-for-age percentile | -0.06 | 0.165 | 0.94 | 0.87 − 1.03 |
| Delta EDE-Q | 0.36 | 0.664 | 1.44 | 0.26 − 7.95 |
| Delta BSI | -1.25 | 0.332 | 0.29 | 0.02 − 4.15 |
| Delta CIA | 0.08 | 0.415 | 1.08 | 0.89 − 1.31 |
| Dependent variable: Full response at 20-week FU | ||||
| Independent variables | β | p-value | OR | 95% CI OR |
| Age | 0.36 | 0.391 | 1.44 | 0.62 – 3.33 |
| Duration of illness | -0.12 | 0.689 | 0.89 | 0.49 − 1.61 |
| BMI-for-age percentile | 0.11 | 0.409 | 1.11 | 0.85 − 1.46 |
| EDE-Q – global score | -0.46 | 0.681 | 0.63 | 0.06 − 6.46 |
| BSI – global score | 1.98 | 0.178 | 7.30 | 0.36 − 148.01 |
| CIA – global score | -0.15 | 0.081 | 0.86 | 0.72 − 1.02 |
| Delta BMI-for-age percentile | -0.03 | 0.338 | 0.96 | 0.89 − 1.04 |
| Delta EDE − Q | 0.34 | 0.722 | 1.40 | 0.19 − 10.127 |
| Delta BSI | -1.79 | 0.093 | 0.17 | 0.02 − 1.37 |
| Delta CIA | 0.14 | 0.155 | 1.15 | 0.94 − 1.40 |
Delta indicates the difference between baseline and end of treatment (EOT).
Table 3.
b. Multivariate linear regression analysis of body mass index (BMI) and eating disorder psychopathology at the end of intensive treatment - inpatient followed by day patient” (EOIT) and the 20-week follow-up (20-week FU) in 68 adolescent patients (≤16 years) with anorexia nervosa treated via intensive enhanced cognitive behavior therapy (CBT-E). Intent-to-treat analysis with multiple imputation procedure was used. Pooled data are presented.
| Dependent variable: BMI-for-age percentile at EOIT | ||||
| Independent variables | β | t | p-value | 95% CI |
| Age | -4.12 | 1.60 | 0.110 | -9.17 − 0.94 |
| Duration of illness | -1.27 | 0.67 | 0.501 | -4.99 − 2.45 |
| BMI-for-age percentile | -0.18 | 0.47 | 0.639 | -0.94 − 0.58 |
| Eating Disorder Examination Questionnaire (EDE-Q) – global score | 3.12 | 0.81 | 0.425 | -4.72 − 10.96 |
| Brief symptom Inventory (BSI) – global score | 4.47 | 1.01 | 0.312 | -4.22 − 13.17 |
| Clinical Impairment Assessment (CIA) – global score | -0.79 | 1.78 | 0.082 | -1.68 − 0.10 |
| Dependent variable: EDE-Q global score at EOIT | ||||
| Independent variables | β | t | p-value | 95% CI |
| Age | 0.02 | 0.10 | 0.920 | -0.31 − 034 |
| Duration of illness | 0.02 | 0.18 | 0.858 | -0.21 − 0.25 |
| BMI-for-age percentile | -0.02 | 1.07 | 0.287 | -0.07 − 0.02 |
| Eating Disorder Examination Questionnaire (EDE-Q) – global score | 0.19 | 0.85 | 0.398 | -0.25 − 0.63 |
| Brief symptom Inventory (BSI) – global score | -0.01 | 0.03 | 0.973 | -0.55 − 0.53 |
| Clinical Impairment Assessment (CIA) – global score | 0.02 | 0.58 | 0.561 | -0.04 − 0.07 |
| Dependent variable: BMI-for-age percentile at 20-week FU | ||||
| Independent variables | β | t | p-value | 95% CI |
| Age | 0.93 | 0.10 | 0.917 | -17.58 − 19.43 |
| Duration of illness | -0.89 | 0.15 | 0.880 | -13.13 − 11.34 |
| BMI-for-age percentile | 1.44 | 0.91 | 0.373 | -1.99 − 4.88 |
| EDE-Q – global score | -5.57 | 0.20 | 0.849 | -72.46 − 61.32 |
| BSI – global score | 21.85 | 1.25 | 0.231 | -15.73 − 59.44 |
| CIA – global score | -0.99 | 0.48 | 0.640 | -5.53 − 3.55 |
| Delta BMI-for-age percentile | -0.72 | -1.14 | 0.283 | -2.13 − 0.70 |
| Delta EDE-Q | 7.37 | 0.38 | 0.716 | -37.87 − 52.60 |
| Delta BSI | -18.92 | 0.97 | 0.360 | -64.11 − 26.27 |
| Delta CIA | 0.57 | 0.32 | 0.754 | -3.41 − 4.55 |
| Dependent variable: EDE-Q global score at 20-week FU | ||||
| Independent variables | β | t | p-value | 95% CI |
| Age | -0.38 | 2.07 | 0.039 | -0.75 − -0.02 |
| Duration of illness | 0.12 | 0.80 | 0.427 | -0.17 − 0.41 |
| BMI-for-age percentile | -0.02 | 0.71 | 0.482 | -0.09 − 0.04 |
| EDE-Q – global score | 0.10 | 0.26 | 0.793 | -0.65 − 0.84 |
| BSI – global score | -0.53 | 1.41 | 0.164 | -1.27 − 0.22 |
| CIA – global score | 0.09 | 2.03 | 0.052 | -0.001 − 0.18 |
| Delta BMI-for-age percentile | 0.004 | 0.35 | 0.726 | -0.02 − 0.03 |
| Delta EDE-Q | -0.19 | -0.65 | 0.519 | -0.80 − 0.41 |
| Delta BSI | 0.57 | 1.66 | 0.109 | -0.14 − 1.27 |
| Delta CIA | -0.05 | 1.30 | 0.212 | -0.14 − 0.03 |
Delta indicates the difference between baseline and EOIT.
Disclaimer/Publisher’s Note: The statements, opinions and data contained in all publications are solely those of the individual author(s) and contributor(s) and not of MDPI and/or the editor(s). MDPI and/or the editor(s) disclaim responsibility for any injury to people or property resulting from any ideas, methods, instructions or products referred to in the content. |
© 2025 by the authors. Licensee MDPI, Basel, Switzerland. This article is an open access article distributed under the terms and conditions of the Creative Commons Attribution (CC BY) license (http://creativecommons.org/licenses/by/4.0/).
Copyright: This open access article is published under a Creative Commons CC BY 4.0 license, which permit the free download, distribution, and reuse, provided that the author and preprint are cited in any reuse.


