Submitted:
21 July 2025
Posted:
23 July 2025
You are already at the latest version
Abstract
This study proposes a novel egg-crate honeycomb core sandwich panel (SP-EHC) that combines the structural advantages of conventional lattice and grid configurations while mitigating their limitations in stability and mechanical performance. The design employs chamfered intersecting grid walls to create a semi-enclosed honeycomb architecture, enhancing out-of-plane stiffness, buckling resistance, and enabling ventilation and drainage. To facilitate efficient and accurate structural analysis, a two-dimensional equivalent plate model (2D-EPM) is developed using the Variational Asymptotic Method (VAM). This model significantly reduces the complexity of three-dimensional elasticity problems while preserving essential microstructural characteristics. A Reissner–Mindlin-type formulation is derived, enabling local field reconstruction for detailed stress and displacement evaluation. Model validation is conducted through experimental testing and three-dimensional finite element simulations. The 2D-EPM demonstrates high accuracy, with static analysis errors in load–displacement response within 10%, and a maximum modal frequency error of 10.23% in dynamic analysis. The buckling and bending analyses, with or without initial deformation, show strong agreement with the 3D-FEM results, with deviations in the critical buckling load not exceeding 5.23%. Local field reconstruction achieves stress and displacement prediction errors below 2.7%, confirming the model’s fidelity at both global and local scales. Overall, the VAM-based 2D-EPM provides a robust and computationally efficient framework for the structural analysis and optimization of advanced sandwich panels.
Keywords:
egg-crate honeycomb core
; sandwich panel
; variational asymptotic method
; equivalent plate model
; p buckling analysis
; local field reconstruction
1. Introduction
Sandwich panels have become indispensable in modern engineering due to their exceptional combination of high stiffness, strength, and low weight [1,2,3]. A typical sandwich structure consists of two thin, stiff face sheets bonded to a lightweight core, which can occupy more than half the volume and weight of the panel [4,5]. The core thus plays a critical role in mechanical performance, and extensive research has been devoted to optimizing core configurations for improved strength-to-weight ratios [6,7]. Early studies focused on honeycomb cores – named for their biomimetic hexagonal cells – which endow panels with high out-of-plane compression and shear stiffness at minimal weight [8,9].
Recently, numerous analytical models have been developed to characterize sandwich panels, ranging from classical first-order shear deformation theory [10,11] to higher-order and layer-wise (zig-zag) theories [12,13]. These models improve accuracy in predicting bending and vibration by accounting for transverse shear and layer discontinuities, but they also introduce complexity (e.g. requiring additional degrees of freedom for each layer) and may not easily accommodate complex core architectures [14,15]. As a result, the analysis and design of novel core geometries often rely on numerical methods. Finite element analysis (FEA) is frequently used in both industry and academia to evaluate sandwich panel behavior, yet full three-dimensional (3D) modeling of a sandwich structure with intricate cellular cores is computationally expensive and time-consuming [16,17].
To alleviate this issue, homogenization and equivalent single-layer approaches have been explored, wherein a periodic unit cell of the core is analyzed to derive effective properties for an equivalent continuum panel [18,19]. Such micromechanical approaches greatly reduce computational cost by replacing the detailed core with a homogeneous plate model [20,21]. However, standard homogenization can lose microstructural detail and may sacrifice accuracy in predicting local stress concentrations or higher-order effects, especially for advanced core designs [22]. This limitation motivates the pursuit of more refined yet efficient modeling techniques.
In parallel with advances in modeling, a rich variety of innovative core designs has emerged to overcome the limitations of conventional honeycombs and lattice grids [23,24]. Researchers have proposed architected cellular materials and metamaterial cores that achieve superior mechanical performance through geometry [25,26]. For example, auxetic re-entrant honeycombs (with negative Poisson’s ratio) have demonstrated enhanced energy absorption and stiffness compared to regular hexagonal cells [27,28]. Novel re-entrant chiral and hybrid honeycomb patterns have been shown to improve impact resistance and specific energy absorption under compression [29,30]. Elliptical and other non-periodic cell geometries have likewise been tailored to enhance in-plane stiffness or to achieve desirable anisotropic properties [31]. Beyond honeycombs, lattice and grid-like cores manufactured via advanced methods (e.g. additive manufacturing) are gaining attention [32,33].
Periodic truss lattices and orthogrid structures can be optimized to align with load paths, and they offer the promise of multi-functionality – for instance, open-cell lattice cores can double as heat exchange surfaces for thermal management [34,35]. Despite these advantages, conventional grid and lattice sandwich structures face several limitations. First, purely open lattice cores are prone to local instabilities: under concentrated or transverse loads, their slender struts can lead to highly localized stress and early failure in the core [36,37]. This makes lattice cores less effective in carrying impact loads without additional reinforcement.
Second, while grid-stiffened panels (e.g. orthogrid or iso-grid structures) provide high in-plane stiffness, they often exhibit complex buckling modes and stress concentrations at nodal intersections or cut-outs. Orthogonal grid patterns increase stiffness but may require curved or hierarchical modifications to delay buckling in critical regions [38]. In general, fully exploiting these novel core architectures is challenging because their mechanical behavior is not as well understood as that of traditional honeycombs. Designers lack simple formulas or design guidelines, and instead must resort to extensive FEA for each new topology [39,40]. This trial-and-error approach is costly and time-consuming, underscoring the need for efficient analytical or equivalent models to guide the design of advanced sandwich cores.
The present work introduces a novel “egg-crate” honeycomb core sandwich panel (SP-EHC), along with a high-fidelity yet computationally efficient modeling framework for its static and dynamic analysis. The SP-EHC core concept is derived from conventional lattice and grid structures, aiming to integrate their strengths while mitigating weaknesses. The core consists of an orthogonal grid network with intersecting walls, but unlike a simple rectangular grid, the intersection regions are chamfered to form a semi-enclosed cell geometry as shown in Figure 1. This egg-crate-like configuration creates a pattern of contiguous cells analogous to a honeycomb, but with open corners and pathways. The chamfered grid walls serve to enhance structural strength and buckling resistance by eliminating sharp corner stress concentrations and providing smoother load transfer between intersecting ribs. Meanwhile, the semi-enclosed cells preserve the panel’s lightweight characteristics and introduce practical benefits such as ventilation and drainage through the core.
To rigorously analyze the SP-EHC design, the two-dimensional equivalent plate model (2D-EPM) using the variational asymptotic method (VAM) is developed. The VAM, originally formulated by Cesnik and Hodges for composite structures [41,42], is a multiscale asymptotic technique that reduces a 3D elasticity problem to a lower-dimensional model without ad-hoc assumptions. The core idea of VAM is to exploit the small geometric parameter (the core thickness-to-panel length ratio, in this case) and systematically minimize the 3D strain energy functional to obtain a simplified model that still captures the essential physics [43]. In practice, this involves decomposing the displacement field into a 2D (mid-plane) part plus a warping field, and deriving effective plate stiffness by averaging the 3D behavior over a representative unit cell. Unlike classical plate theories, the VAM-based approach inherently accounts for the actual microstructure of the core, enabling accurate prediction of both global responses and local fields.
This method has been successfully applied to periodic lattice and honeycomb structures in recent studies, showing that a VAM-derived plate model can reproduce the full 3D behavior with dramatically reduced computational cost [44,45]. For example, Wang et al. [46] used a VAM-based equivalent model for triangular honeycomb panels and achieved excellent agreement with experimental and 3D FEA results (for bending deflections, buckling loads, and vibration frequencies) while improving computation efficiency by orders of magnitude. In this study, the Variational Asymptotic Method (VAM) is employed to derive the three-dimensional strain energy of the SP-EHC cell, followed by an asymptotic expansion to extract the governing two-dimensional plate equations and construct the equivalent stiffness matrices. Based on the 2D solution, recovery relations are established to reconstruct local stress and strain fields within the core. A key advantage of the VAM framework lies in its multiscale capability: it enables efficient computation of global deflections and stresses, while also allowing detailed reconstruction of micro-scale stress distributions—such as those in cell walls—for failure and fatigue analysis. This level of resolution is not readily achievable through conventional homogenization techniques.
2. VAM-Based Equivalent Model of SP-EHC
2.1. Three-Dimensional Energy Expression of SP-EHC
From the perspective of the equivalent single-layer theory, the 3D displacement field of SP-EHC can be expressed using the 2D displacement field and the warping functions , as
where the underlined terms represent the displacements of classical plate theory.
The explicit form of can be derived from Eq. (1) by applying a volume-averaging procedure over the representative unit cell:
Considering that the local coordinate system originates from an arbitrary point within the unit cell, the 3D displacement field can be projected to obtain an equivalent 2D displacement field using Eq. (2). To ensure consistency with the macroscopic kinematics, the warping functions are subject to the following constraint:
By introducing the concept of strain decomposition with local rotation, the 3D strain field accounting for small rotations can be expressed as:
where is the Kronecker delta symbol.
To derive the explicit expression of the 3D strain field, Eq. (1) is substituted into Eq. (4). Neglecting higher-order terms that do not contribute to the total strain energy yields:
where
The strain energy of the SP-EHC can be expressed as:
where denotes the strain energy density, and is the representative unit cell domain in the - plane.
The explicit form of is given by:
where the subscript b and t refer to the bottom and top face sheets, respectively; subscripts I, II, and III denote distinct regions within the core cell, as illustrated in Figure 2.
The virtual work done by external loads on the SP-EHC can be decomposed into two parts: the virtual work related to the 2D-EPM, and the remaining part , such that
where and denote the warping displacements on the bottom and top surfaces, respectively; and represent the surface tractions on the bottom and top surfaces; is the body force. The distributed force contributions to the virtual work are expressed as:
The original 3D kinetic energy of SP-EHC can be expressed as:
where
where V and denote the absolute velocity and angular velocity, respectively, and v is the volume occupied by the sandwich panel. The corresponding quantities are defined as:
The parameters and represent the mass densities of 3D-FEM and 2D-EPM, respectively. The equivalent mass density can be determined by assuming ideal face sheet-core bonding, while neglecting the mass contribution of internal walls within the cellular structure, such as
where and are the mass densities of the core and face sheets, respectively; represents the volume of face sheet. Based on geometric modeling, the core volume can be expressed as:
The elastic dynamic behavior of SP-EHC satisfies Hamilton’s principle, which can be stated as:
The governing equation for the variation of can be expressed as:
where D is the elasticity matrix and is the strain vector.
Directly solving the minimization problem in Eq. (18) poses significant challenges, particularly in the context of fully 3D elastic analyses. However, by conducting an asymptotic analysis of the transformed expressions within the equivalent formulation, a potential solution for can be derived without imposing restrictive assumptions on the displacement field or material behavior. The detailed procedure for this asymptotic approach will be presented in the following section.
2.2. Equivalent Analysis Based on the VAM
To accurately reduce the original 3D problem to a 2D equivalent model, it is essential to recover the strain energy stored in the 3D structure within the 2D formulation. This is most effectively achieved by leveraging small geometric or material parameters inherent to the structure and applying a stepwise transformation via asymptotic analysis. Within this framework, the orders of magnitude of all quantities involved in the expansion can be expressed as:
where and h represent the characteristic material property scale and geometric scale, respectively; is a small perturbation parameter.
By analyzing the scaling orders in Eq. (19), it becomes evident that the applied loads contribute at higher orders. As a result, terms corresponding to zero-order energy equivalence can be reasonably neglected. Referring to Eq. (5), the strain field under the zero-order approximation can be expressed in matrix form as:
where , and
To obtain a more general approximation, the warping functions are discretized using a numerical method (such as finite element interpolation) as:
where S is the shape function matrix depending on microscopic coordinates; N is the shape function matrix formed by the nodal values of .
By substituting Eqs. (22) into (9) and (20), the weak form of the zero-order approximate energy can be expressed as:
where
By applying the averaging constraint condition in Eq. (3) and minimizing Eq. (23), a linear system is obtained as:
Since N depends linearly on the 2D plate strain , and this relationship is independent of the strain magnitude, the solution for the warping parameters can be symbolically expressed as:
2.3. Transformation into the Reissner–Mindlin Model
Although the zero-order asymptotic strain energy correction in Eq. (27) is mathematically valid, an additional step is required to map the current approximate energy expression to the classical Reissner–Mindlin plate model. The generalized form of the Reissner–Mindlin strain energy is given by:
In Eq. (28), the Reissner–Mindlin model is obtained by eliminating the coupling terms between the membrane–bending strain vector and the transverse shear strain vector . The full strain energy expression can be rewritten as:
In addition, the strain energy expression must include the work conjugate to the external load term F, which is expressed as:
The total energy of the 2D-EPM can be expressed using the variable transformations and , leading to:
where
Due to the axial and planar symmetry of the SP-EHC, certain stiffness components are eliminated, leading to the final constitutive relation of the 2D-EPM:
where , , and () denote the in-plane forces, bending moments, and shear force, respectively.
The principal advantage of this method lies in its ability to construct the Reissner–Mindlin plate model directly from the zero-order asymptotic approximation, thereby eliminating the need for higher-order expansions or external transformation procedures. This approach enables the macroscopic behavior to be explicitly described through variable expressions derived from the asymptotic system, which inherently capture all 2D field variables in the in-plane coordinates and . Consequently, the overall problem formulation is greatly simplified while preserving the essential mechanical characteristics of the original 3D structure.
2.4. Local Field Recovery
In addition to capturing macroscopic responses, evaluating the local field behavior within the original microstructure is often essential. Based on the results of the macroscopic structural analysis, the local displacement field can be reconstructed as
The local strain field can be reconstructed as:
According to the 3D constitutive relationship (Hooke’s law), the local stress field within the unit cell can be obtained as:
In summary, the local stress and strain fields within the unit cell can be accurately reconstructed using the generalized macroscopic strain , curvature , and displacement within the equivalent model framework. This multiscale reconstruction approach ensures that detailed microscale mechanical responses are captured while leveraging the computational efficiency of the reduced two-dimensional formulation.
3. Dynamic Verification
In practical engineering applications, sandwich panels are often subjected to stochastic dynamic loads, including wind pressure, seismic excitation, and vehicular vibrations, which can critically affect their dynamic behavior, buckling resistance, and fatigue life. Consequently, an accurate assessment of their vibrational response across different modes is essential to ensure structural safety and reliability. However, full three-dimensional (3D) modeling of the SP-EHC entails significant computational effort due to the complexity of its geometry and material composition, thereby limiting analysis efficiency and model scalability. To address these challenges, a VAM-based equivalent model was employed to predict the free-boundary vibration behavior of the SP-EHC.
3.1. Material Property Testing
The mechanical properties of the 3D-printed PLA material were determined through uniaxial tensile tests conducted in accordance with the GB/T 1040.2-2006 standard using a universal testing machine. Dog-bone-shaped specimens, with dimensions shown in Figure 3(a), were carefully aligned and mounted to ensure vertical positioning and prevent slippage. A small preload was applied to eliminate potential seating effects. The tests were performed at a constant displacement rate of 5 mm/min until failure. Load and displacement were recorded in real time, while strain was measured using an extensometer to ensure high accuracy. Nominal stress–strain curves were obtained from the load–displacement data, as illustrated in Figure 3(c). The linear elastic region was identified by excluding initial seating and post-yield nonlinearity, and the elastic modulus was calculated as the slope of a least-squares linear fit over this range. The average elastic modulus, determined from three specimens, was 2,413 MPa. The Poisson’s ratio and density were measured separately, yielding values of 0.39 and 1.30 g/cm³, respectively.
3.2. Free-Boundary Vibration Analysis
In modal testing, boundary constraints are typically applied using mechanical fixtures; however, the elastic deformation of these fixtures can introduce additional compliance, adversely affecting the accuracy of measured modal frequencies and mode shapes. This deviation from ideal boundary conditions complicates high-precision modal analysis. To mitigate such boundary interference and ensure reliable validation of the VAM-based 2D-EPM, all-PLA specimens were fabricated using 3D printing technology. Modal vibration tests were conducted under free boundary conditions to eliminate fixture-induced artifacts. The specimens consisted of 8 and 4 unit cells in the and directions, respectively, with unit cell dimensions listed in Table 1. The overall dimensions of the specimen were L=360 mm, W=180 mm, and H=24 mm, as illustrated in Figure 4(a). This dense measurement configuration significantly improves the spatial resolution of modal data, thereby enhancing the accuracy of numerical model validation.
The free-boundary vibration test setup for the SP-EHC specimen is shown in Figure 4(c). To simulate free boundary conditions, the specimen was suspended from a gantry frame using two nylon cords. An accelerometer was mounted at a fixed location on the specimen surface to capture real-time response signals. The structure was excited using an impact hammer, and both force and acceleration time histories were recorded via a dynamic signal analyzer and transmitted to a computer for processing. A Fast Fourier Transform (FFT) was then applied to convert the time-domain data into the frequency domain, allowing extraction of the natural frequencies. In the numerical simulation, a frequency analysis step within the linear perturbation module was used to compute the first seven eigenfrequencies. The model was assigned completely free boundary conditions, and the interaction between the honeycomb core and face sheets was represented using “Tie” constraints. The three-dimensional model comprised 84,125 C3D10 elements, while the two-dimensional model employed 1,525 S4R elements.
Figure 5 shows seven distinct energy peaks, corresponding to the first through seventh modal frequencies of the SP-EHC under free boundary conditions, within the 310–430 Hz range. Each modal frequency was accurately identified using the half-power bandwidth method. The prominent peaks reflect resonance responses at specific frequencies, highlighting the structure’s characteristic modal behavior. Figure 6 shows the first seven elastic mode frequencies, which increase progressively with mode order. Notably, the seventh mode appears at 420.27 Hz, approximately 1.12 times the frequency of the first mode at 375.73 Hz.
A comparison of the modal frequencies obtained from the three methods indicates that the experimental results are the highest, followed by the 2D-EPM, while the 3D-FEM yields the lowest frequencies. The elevated experimental frequencies are primarily due to the additional stiffness introduced by the nylon cord suspension. In contrast, the lower frequencies predicted by the 3D-FEM are attributed to localized face sheet vibrations, which are more pronounced due to their relatively low stiffness at lower modes. The 2D-EPM results lie between the two, capturing a balance between global structural stiffness and localized effects. Error analysis shows that the maximum deviation between the 2D-EPM and the other two methods occurs at the fourth mode, with an error of 10.23%, while all other modes exhibit errors below 10%. These results confirm the accuracy and reliability of the VAM-based equivalent model in predicting the free-boundary modal characteristics of the SP-EHC.
4. Static Verification
Static analysis plays a critical role in evaluating the structural integrity and load-bearing capacity of sandwich panels under various boundary and loading conditions. In this chapter, the static performance of the SP-EHC is examined using both 3D-FEM and the VAM-based 2D-EPM. The investigation covers buckling behavior under in-plane compression, out-of-plane bending with and without initial geometric imperfections, and localized stress and displacement field reconstruction.
4.1. Structural Modeling
The structural parameters used for finite element validation are provided in Table 1. Figure 7 illustrates that the 3D-FEM consists of a metallic core layer sandwiched between upper and lower carbon fiber reinforced polymer (CFRP) face sheets. The unit cell is periodically replicated 21 times along the direction and 16 times along the direction, forming a full-scale SP-EHC. Each face sheet comprises eight CFRP plies with a thickness of 0.25 mm per ply and a symmetric layup sequence of , designed to enhance stiffness and load-bearing capacity in both principal directions. The matrix material is epoxy resin with a fiber volume fraction of 60%. The core layer is fabricated from aluminum, and its material properties are summarized in Table 2. The equivalent stiffness matrix, derived using the VAM, serves as the primary input for constructing the 2D-EPM, as illustrated in Figure 8.
4.2. Buckling Analysis Under In-Plane Loading
Buckling performance analysis of composite sandwich panels is of considerable engineering significance. Owing to their high strength-to-weight ratio, these structures are extensively employed in aerospace, civil engineering, and transportation, offering superior load-bearing capacity and structural stability. Buckling analysis facilitates the evaluation of instability risks under diverse loading and boundary conditions, providing a theoretical basis for structural optimization and safety evaluation.
To evaluate the applicability of the 2D-EPM for buckling prediction, analyses were performed using both 3D-FEM and 2D-EPM under four representative boundary conditions, as shown in Figure 9. In Cases 1 (CSFF) and 2 (CCFF), compressive loads were applied along the short edge, whereas in Cases 3 (SSSS) and 4 (CCSS), loading was applied along the long edge. Symmetric compression along the long edge is commonly employed to investigate the buckling behavior of sandwich panels under longitudinal loading. In practical applications, these panels often experience biaxial compression in the longitudinal direction due to self-weight, wind loads, and other external forces, potentially leading to in-plane buckling and a significant reduction in load-carrying capacity. Simulations under this loading condition enable effective evaluation of critical buckling loads, deformation characteristics, and failure modes, offering valuable insights for structural design.
Conversely, symmetric compression along the short edge examines the panel’s response to transverse loading. Scenarios such as lateral wind pressure or accidental impacts can induce local crushing or buckling near the short edges. This analysis facilitates a detailed assessment of local stiffness, compressive strength, and stability, thereby supporting safety evaluations under extreme loading conditions. A total compressive load of 1 N was applied at the boundaries in all cases; hence, the buckling eigenvalues obtained from the finite element analysis directly correspond to the critical buckling loads.
Table 3 compares the predicted first-order critical buckling loads and corresponding buckling modes of the SP-EHC under four typical boundary conditions, obtained using 2D-EPM and 3D-FEM. The results indicate that the critical buckling loads predicted by the two models show minimal discrepancies, with a maximum deviation of no more than 6%. Moreover, the buckling modes exhibit high morphological agreement, demonstrating that the 2D-EPM offers reliable accuracy and applicability for predicting the first-order buckling behavior of sandwich panels.
Detailed comparisons reveal that the critical buckling load in Case 2 is approximately twice that of Case 1, indicating that enhanced boundary constraints significantly improve structural stability. In addition, the buckling mode shapes reveal that stress concentration regions tend to shift toward the less constrained edges, indicating a higher likelihood of local instability initiating in areas with weaker restraint. A similar trend is observed between Cases 3 and 4, further underscoring the critical role of boundary conditions in influencing buckling behavior.
Notably, in the comparison between Cases 2 and 3, Case 3 exhibits a higher critical buckling load despite having weaker boundary constraints. This seemingly counterintuitive result is primarily attributed to differences in loading direction. When compression is applied along the long edge, the panel benefits from greater bending stiffness and improved buckling resistance. Additionally, the increased structural flexibility in this direction promotes stress redistribution, thereby reducing the likelihood of local buckling. In contrast, although Case 2 features stronger constraints under short-edge compression, it is more prone to stress concentrations and localized deformations, increasing its susceptibility to instability. These findings indicate that critical buckling performance is governed not only by boundary conditions but also by loading direction and structural geometry. Consequently, enhancing boundary support in conjunction with optimizing the loading path offers an effective strategy for improving the load-bearing capacity and buckling stability of sandwich panels.
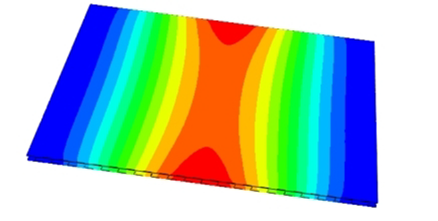
Considering only the first-order buckling load may not fully capture the structural stability under realistic loading scenarios. Higher-order buckling modes often emerge at increased load levels and can significantly affect the overall instability mechanism, particularly under specific boundary or geometric conditions. Figure 10 shows that the first four buckling mode shapes predicted by the 2D-EPM and 3D-FEM demonstrates strong consistency across various boundary conditions. The relative errors in the corresponding buckling loads remain within 10%, confirming the accuracy and effectiveness of the 2D-EPM in capturing higher-order buckling behavior.
The buckling response of the SP-EHC is highly sensitive to both boundary conditions and loading direction. The number and arrangement of clamped edges significantly influence the critical buckling load and mode shapes: increasing the number of fixed boundaries enhances the overall structural stiffness, elevates the critical load, and tends to localize failure near the constrained regions. In contrast, a higher proportion of free edges leads to more complex buckling deformations and a more dispersed failure pattern. The loading direction also plays a critical role. Under long-edge compression with free boundaries, buckling modes are more evenly distributed across the panel. In comparison, short-edge compression induces instability localized near the free edges, resulting in more intricate and concentrated deformation patterns.
4.3. Out-of-Plane Bending Analysis Without Initial Displacement
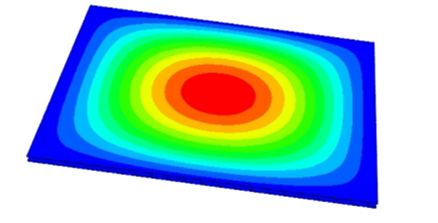
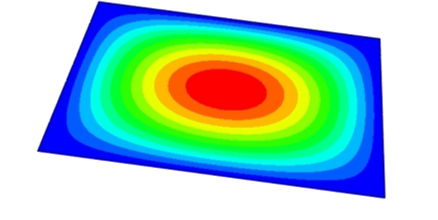
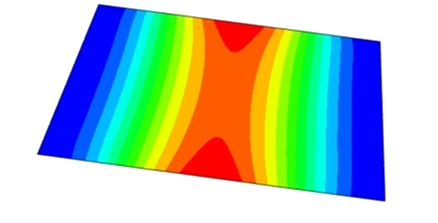
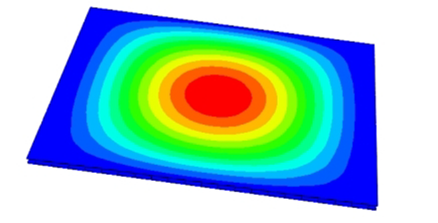
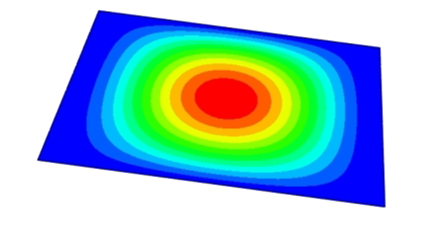
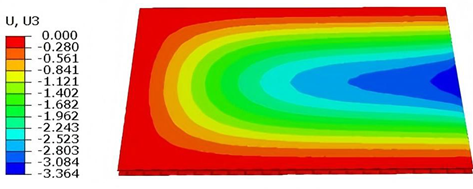
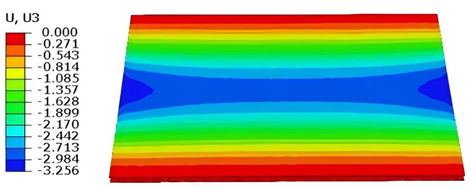
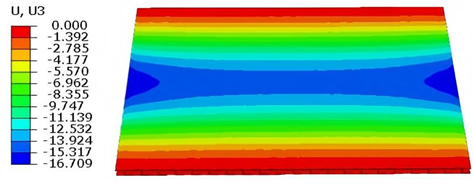
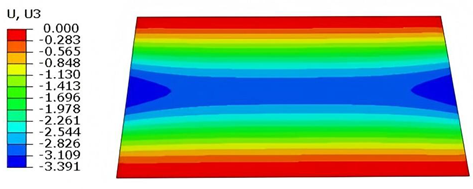
Figure 11 illustrates four typical boundary conditions used to evaluate the out-of-plane bending deformation of the SP-EHC under a uniformly distributed load. In the figure, C, S, and F represent clamped, simply supported, and free edges, respectively. Cases 5 to 8 correspond to CCCC, CCCF, CCFF, and SSFF boundary conditions, all subjected to a uniform pressure of 100 kPa with zero initial displacement. A general static analysis step was performed using the ABAQUS software to valuate the maximum displacement and overall deformation behavior of the sandwich panels. Table 4 presents the resulting displacement contours and the relative errors in maximum displacement for each case.
The analysis results reveal that maximum displacement increases progressively as boundary constraints are relaxed—from CCCC to SSFF BCs—indicating that the CCCC BCs provides the greatest out-of-plane bending stiffness, while SSFF BCs offers the least. Specifically, the maximum displacement under SSFF BCs is nearly five times greater than that under CCCC BCs. This is attributed to the lack of moment restraint in the SSFF BCs, where simply supported edges allow free rotation and bending, resulting in significantly larger deformations. Comparison of displacement contours shows strong agreement between the 3D-FEM and 2D-EPM in both deformation patterns and numerical values. The relative error in maximum displacement across all boundary conditions ranges from 2.05% to 4.15%, remaining within acceptable engineering limits. These results confirm that the 2D-EPM provides accurate and reliable predictions of the out-of-plane bending behavior of the SP-EHC under various boundary conditions.
To systematically evaluate the accuracy of the 2D-EPM in predicting the out-of-plane mechanical performance of the SP-EHC, representative displacement extraction paths were designed in addition to the maximum displacement analysis. As illustrated in Figure 12, two characteristic paths were selected for detailed evaluation. Path 1 follows the midline along the longitudinal axis of the sandwich panel, capturing deformation along the primary load-bearing direction. Path 2 extends diagonally across the panel, providing a comprehensive view of global deformation patterns under complex loading conditions.
These two paths enable systematic extraction of displacement–path distribution curves under four representative boundary conditions. This path-based analysis offers several advantages. First, comparing displacement profiles along different paths allows rigorous validation of the 2D-EPM’s ability to capture global deformation patterns, thereby reinforcing its engineering reliability. Second, the curves intuitively reveal spatial variations in deformation gradients, aiding in the detection of localized stress concentrations—critical for structural safety assessment and design refinement. Finally, the method facilitates quantitative comparison of structural responses along symmetric and asymmetric directions, enabling evaluation of the model’s capability to capture anisotropic behavior and enhancing its adaptability across diverse design requirements.
Figure 13 shows the displacement distribution curves along Path 1 and Path 2 under four representative boundary conditions, comparing results from the 3D-FEM and 2D-EPM. Analysis of the curves reveals that for Cases 5 (CCCC), 7 (CCFF), and 8 (SSFF), the displacement profiles along Path 1 exhibit pronounced symmetry in the direction. This behavior is attributed to the centrally symmetric boundary and loading configurations, which promote a uniform deformation response. These results demonstrate that under symmetric boundary conditions, the displacement path curves effectively capture the global deformation characteristics, reinforcing the predictive accuracy of the 2D-EPM for structural behavior prediction.
In contrast, Case 6 (CCCF) exhibits clear asymmetry in the displacement distribution due to the uneven combination of clamped (C) and free (F) boundaries. The displacement curve along Path 2 shows a pronounced gradient variation, with a significantly steeper slope near the clamped edge compared to the free edge. This nonuniform deformation arises because the clamped edge fully restricts rotation, thereby limiting displacement in that region, while the free edge permits greater deformation. As a result, the displacement profile becomes asymmetric, reflecting the influence of boundary condition imbalance on structural response.
Despite the complexity of deformation patterns under asymmetric boundary conditions, the 2D-EPM accurately captures the overall trends of the displacement curves, demonstrating strong predictive capability. These results underscore the model’s robustness and adaptability in addressing complex boundary scenarios. Across all four cases, the displacement–path curves predicted by the 2D-EPM show excellent agreement with those from the 3D-FEM, with relative errors in maximum displacement remaining within acceptable engineering margins. In summary, the 2D-EPM not only reliably predicts the global out-of-plane deformation behavior of the SP-EHC but also effectively accounts for the influence of varying boundary conditions. Its consistent performance—even under complex and asymmetric configurations—establishes a solid theoretical foundation and provides valuable support for structural analysis and engineering design.
4.4. Out-of-Plane Bending Analysis with Initial Displacement
In practical engineering applications, structural components rarely conform to the idealized assumptions of perfect initial geometry. Sandwich panels, in particular, are susceptible to initial displacements or geometric imperfections introduced during manufacturing, transportation, and installation. These imperfections may arise from fabrication errors, material inhomogeneities, environmental factors such as temperature and humidity fluctuations, or external disturbances during handling and assembly. Such geometric deviations, present before the panel enters service, can significantly influence its mechanical response under out-of-plane loading. This effect is especially pronounced in thin-walled or lightweight structures, where even minor imperfections can reduce load-carrying capacity, trigger premature buckling, or induce localized instability.
To more accurately simulate real-world service conditions, this section incorporates initial geometric imperfections into the out-of-plane loading analysis of the SP-EHC under CCFF boundary conditions. These imperfections account for practical factors such as manufacturing deviations and residual stresses, which are commonly encountered in engineering applications. More importantly, the analysis captures the structure’s nonlinear response and potential stability issues under out-of-plane loading, providing valuable insights for the optimization and safety evaluation of sandwich panel designs. A systematic numerical investigation was conducted by introducing prescribed initial displacements of varying amplitudes into the model to evaluate their influence on the transverse load-bearing behavior and ultimate strength of the structure. The simulation procedure is illustrated in Figure 14, where and denote the imposed initial displacement amplitudes along the and directions, respectively. The range of initial imperfections considered includes: , and .
Figure 15 illustrates the influence of initial deformation along the direction on the displacement response of the SP-EHC under CCFF boundary conditions. As the initial deformation amplitude increases from -9% to 9%, the total displacement of the SP-EHC exhibits a progressive upward trend. Among the three displacement components, exhibits a nonlinear response: it first decreases and then increases with varying initial deformation. Notably, at zero imperfection (0%), is nearly zero, indicating that displacement in this direction is primarily load-induced, with minimal contribution from geometric imperfections. Furthermore, introducing moderate compressive deformation in the - direction reduces the out-of-plane displacement component , effectively enhancing the panel’s out-of-plane stiffness.
Figure 16 illustrates the influence of initial deformation along the direction on the displacement components in all three coordinate directions. As the initial deformation varies from -9% to 9%, the total displacement initially decreases and then increases, though the overall variation remains relatively small. For individual components, reaches a minimum at zero imperfection and increases with greater initial deformation, indicating a clear positive correlation. A similar trend is observed for , indicating that in-plane displacements in both directions are sensitive to initial geometric imperfections. In contrast, remains relatively stable throughout the deformation range, implying that imperfections in the direction have minimal impact on the out-of-plane displacement response.
In summary, the SP-EHC under CCFF boundary conditions exhibits notable sensitivity to initial geometric imperfections. Disturbances along the and directions significantly affect the in-plane displacement components ( and ), while their effects on the out-of-plane component () are direction-dependent. Specifically, compressive deformation along the axis contributes to a reduction in , whereas deformation along the axis has negligible impact. These findings offer important guidance for controlling initial imperfections and optimizing the stability design of sandwich panels.
4.5. Local Field Recovery
Local field reconstruction is an effective approach for accurately evaluating localized structural performance and informing targeted design optimizations. By enabling precise adjustments to structural configurations or material distributions, this method enhances the strength and stiffness of critical regions, thereby improving overall system reliability and stability. Compared to global response analysis, local field reconstruction offers higher spatial resolution and predictive accuracy, making it particularly well-suited for capturing localized stress, strain, and displacement fields in complex structures such as SP-EHC.
In this section, local field reconstruction is conducted for two representative cases: (1) Case 3 without initial deformation and clamped (CCCC) boundary conditions; and (2) Case 3 with 9% initial deformation along the -axis. By comparing the localized stress and displacement fields predicted by the 2D-EPM with those obtained from 3D-FEM, the accuracy and applicability of the dimensional reduction method in reconstructing local fields are systematically evaluated.
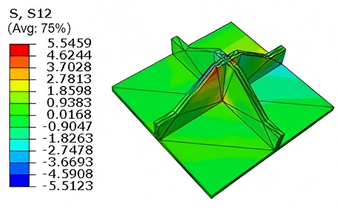
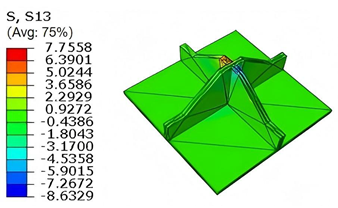
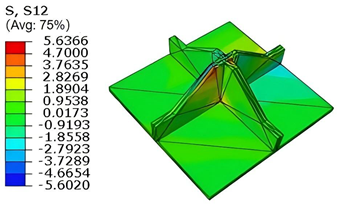
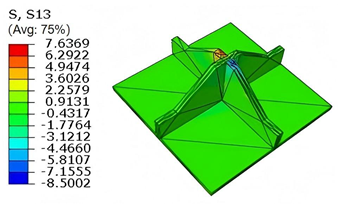
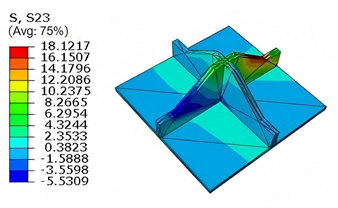
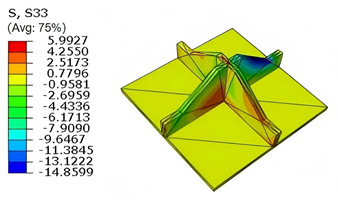
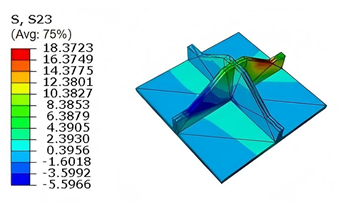
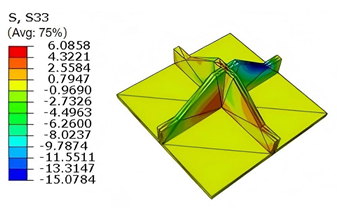
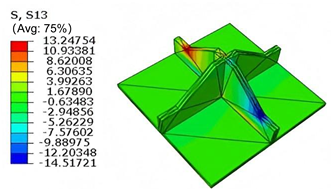
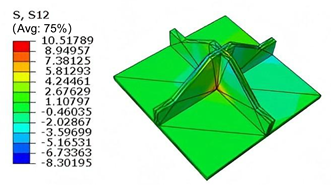
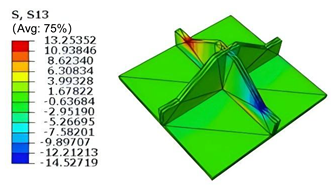
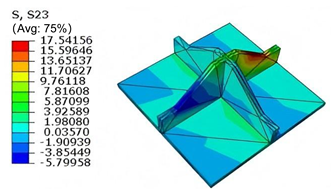
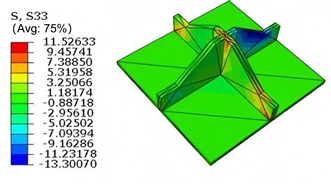
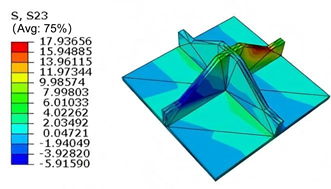
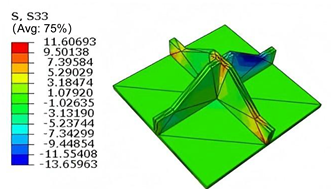
Table 5 compares the local stress field distributions within the central cell of the panel in Case 3, as predicted by 3D-FEM and 2D-EPM. The results indicate that the normal bending stresses ( and ) are primarily concentrated in the bottom face sheet and at the face sheet–core interface, with the maximum tensile stress reaching 71.676 MPa. This stress concentration is likely caused by pronounced bending deformation in the overhanging region, driven by geometric features and external loading. The coupling between face sheet bending and core shear deformation further amplifies this localized stress.
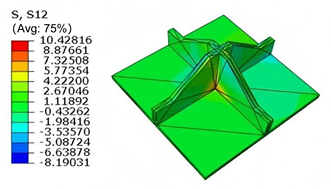
The shear stresses (, , and ) are primarily distributed along the cell walls of the core in the -direction, with a maximum value of 18.372 MPa. Due to the high stiffness and small thickness of the face sheets, they predominantly resist bending, while the core layer bears the majority of the shear load. The observed stress heterogeneity highlights the strong coupling between load transfer and internal structure within the sandwich panel. Notably, shear stresses accumulate near the center of the face–core interface. In combination with elevated shear stresses, this significantly increases the risk of interfacial delamination. Comparison of the local stress contours reveals strong agreement between the 2D-EPM and 3D-FEM predictions, with a maximum relative error of only 1.641%. This confirms the accuracy and effectiveness of the equivalent model in capturing localized stress field behavior.
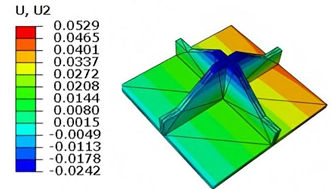
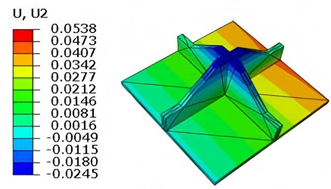
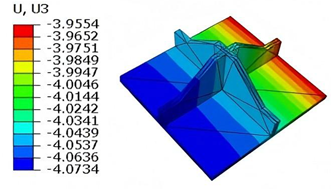
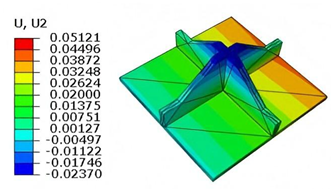
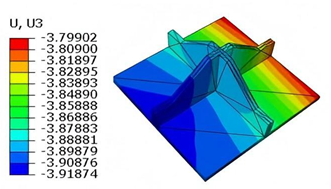
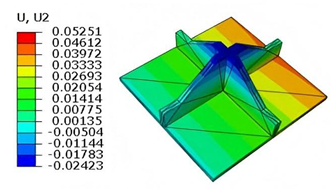
Table 6 compares the local displacement field distributions obtained from 3D-FEM and 2D-EPM. The results reveal a pronounced displacement concentration at the face–core interface, attributed to the modulus gradient between the face sheets and the core, with the core exhibiting significantly lower stiffness. Under out-of-plane loading, the displacement distribution displays clear biaxial symmetry, consistent with the geometric symmetry of the unit cell and the applied boundary conditions. Notably, the displacement along the -direction is concentrated within the face sheet, while the displacement along the -direction is concentrated near the face sheet-core interface. This behavior is attributed to the stiffness contrast between the constituent materials and the applied loading conditions. The high-stiffness face sheets dominate the deformation response along the -axis, whereas the softer core material experiences greater displacement along the -axis—particularly near the face–core interface—due to local stress concentrations induced by the mismatch in material stiffness.
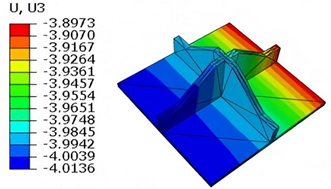
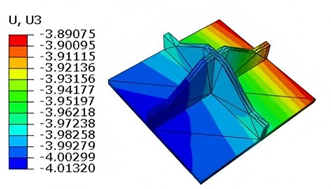
The out-of-plane displacement component shows a red-shifted region in the contour map skewed toward the cell wall of unit cell. This asymmetry results from stress redistribution caused by the free boundary condition in Case 3: the lack of constraint in the -direction allows the cell wall to bear a larger portion of the lateral load. Quantitative comparison of the reconstructed displacement fields (, , ) shows that the average relative errors of the 2D-EPM with respect to the 3D-FEM reference are 2.7%, 1.7%, and 1.5%, respectively. These results confirm the accuracy and applicability of the proposed dimensional reduction approach in capturing localized bending behavior of sandwich panels.
Table 7 compares the local stress fields within the central cell of the panel under the CCFF boundary condition (Case 3), with an applied initial displacement of 9%. Compared with the results in Table 6, the normal stress increases by nearly an order of magnitude, while remains unchanged. This indicates that the imposed initial displacement in the -direction significantly amplifies , primarily due to the lack of constraint along this direction. The resulting tensile force induced by the initial imperfection leads to elevated stress concentrations.
Moreover, high tensile stress is observed along the upper outer arm in the -direction, especially at the interface with adjacent unit cells, indicating a critical region for stress transmission. The combined effects of out-of-plane loading and initial geometric imperfection leads to stress concentration in this area. Shear stresses and also increase significantly—by approximately an order of magnitude—while remains unchanged. This behavior may result from structural distortion near the boundary induced by the initial displacement, leading to a redistribution of internal forces. Under out-of-plane loading, the amplified local deformation intensifies both stress concentration and shear effects in this region.
Furthermore, the altered geometry introduces discontinuities in local boundary conditions, exacerbating shear stress gradients near the edges. Consequently, structural deformation and stress redistribution propagate inward from the boundaries, further intensifying the shear response. These findings highlight the importance of accounting for initial imperfections in structural core design. For cores susceptible to manufacturing or assembly defects, particular attention should be given to the strength and stiffness at key constraint regions—especially near interface boundaries and bonding lines—to mitigate stress concentrations and deformation amplification induced by initial displacements.
Table 8 compares the local displacement fields within the unit cell located at the same position under CCFF boundary condition (Case 3) with imposed initial displacement of 0.9%. By comparing these results with those in Table 6 and the corresponding displacement contours, several key observations emerge: exhibits a notable increase, shows a slight rise, while exhibits a slight reduction. This suggests that the influence of initial geometric imperfection exceeds that of out-of-plane loading, resulting in a decrease in compared to the perfect, unperturbed structure.
Therefore, the impact of initial geometric imperfections must be carefully considered in the design of sandwich panels. Reinforcing or modifying regions susceptible to such defects is recommended to mitigate their adverse effects. In particular, local stiffening along directions with pronounced imperfections can help reduce displacement concentrations and enhance overall structural robustness.
5. Conclusions
In this study, a novel egg-crate honeycomb core sandwich panel (SP-EHC) was proposed to address the limitations of conventional sandwich panels. A two-dimensional equivalent plate model (2D-EPM) based on the Variational Asymptotic Method (VAM) was developed and systematically validated through experimental and finite element analyses. Based on the findings, the following conclusions can be drawn:
(1) The proposed SP-EHC exhibits superior mechanical performance, including enhanced buckling resistance and improved out-of-plane stiffness. The 2D-EPM accurately predicts both static and dynamic responses of the structure. The relative error in modal frequency prediction is within 10.23%, and the critical buckling load prediction error remains below 5.23% across various boundary conditions.
(2) The equivalent model demonstrates high fidelity in simulating bending deformations under various boundary conditions, both with and without initial geometric imperfections. Maximum displacement errors remain below 4.15%, highlighting the model’s strong applicability and reliability for practical engineering applications.
(3) The 2D-EPM effectively reconstructs local stress and displacement fields, with maximum stress prediction errors below 2.5%, demonstrating its capability in local field analysis. This offers a powerful tool for identifying stress concentrations and guiding structural optimization.
Despite the effectiveness of the VAM-based equivalent model and the novel SP-EHC structure, several limitations persist. Future work will extend the model to incorporate nonlinear material behavior, thermo-mechanical coupling, and dynamic impact response. Moreover, experimental validation under complex loading conditions, including fatigue and multi-axial stress states, is essential to evaluate the SP-EHC’s performance in practical applications.
Author Contributions
Individual contributions are as follows: Writing - original draft, Li R.H. and Yuan H.;
Investigation, Cai Z.X. and Liu, Z.T.; Supervision, Zhong Y.F.; Validation, Tang Y. All authors have read and agreed
to the published version of the manuscript
Funding
This research was funded by the National Natural Science Foundation of China (Grant Number: 52073036) and the Natural Science Foundation of Chongqing, China (cstc2021jcyj-msxmX0035).
Institutional Review Board Statement
Not applicable.
Informed Consent Statement
Not applicable.
Data Availability Statement
Data available on request due to restrictions, e.g., privacy or ethical. The data presented in this study are available on request from the corresponding author. The data are not publicly available due to subsequent analyzes and publications.
Conflicts of Interest
The authors declare no conflict of interest.
References
- Ma, Q.; Rejab, M.R.; Siregar, J.P.; Guan, Z. A review of the recent trends on core structures and impact response of sandwich panels. J. Compos. Mater. 2021, 55, 2513–2555. [Google Scholar] [CrossRef]
- Ramnath, B.V.; Alagarraja, K.; Elanchezhian, C. Review on sandwich composite and their applications. Mater. Today: Proc. 2019, 16, 859–864. [Google Scholar] [CrossRef]
- Vladimirova, E.; Gong, M. Advancements and applications of wood-based sandwich panels in modern construction. Buildings 2024, 14, 2359. [Google Scholar] [CrossRef]
- Sahu, S.K.; Sreekanth, P.R.; Reddy, S.K. A brief review on advanced sandwich structures with customized design core and composite face sheet. Polymers 2022, 14, 4267. [Google Scholar] [CrossRef] [PubMed]
- George, T.; Deshpande, V.S.; Sharp, K.; Wadley, H.N. Hybrid core carbon fiber composite sandwich panels: Fabrication and mechanical response. Compos. Struct. 2014, 108, 696–710. [Google Scholar] [CrossRef]
- Charkaoui, A.; Hassan, N.M.; Bahroun, Z. Enhancing mechanical properties of cellular core sandwich panels: a review of topological parameters and design improvements. Mater. Res. Express 2023, 10, 102001. [Google Scholar] [CrossRef]
- Sadiq, M.A.; Kovács, G. Optimization of composite sandwich structures: A review. Machines 2025, 13, 536. [Google Scholar] [CrossRef]
- Obadimu, S.O.; Kourousis, K.I. In-plane compression performance of additively manufactured honeycomb structures: a review of influencing factors and optimisation techniques. Int. J. Struct. Integr. 2023, 14, 337–353. [Google Scholar] [CrossRef]
- Kim, Y.; Son, K.H.; Lee, J.W. Auxetic structures for tissue engineering scaffolds and biomedical devices. Materials 2021, 14, 6821. [Google Scholar] [CrossRef] [PubMed]
- Karimi, M.; Khoshgoftar, M.J.; Karimi, M.; Mirzaali, M.J.; Javanbakht, Z. An analytical model for the static behaviour of honeycomb sandwich plates with auxetic cores using higher-order shear deformation theories. Int. J. Mech. Mater. Des. 2023, 19, 951–969. [Google Scholar] [CrossRef]
- Ebrahimi, F.; Sepahvand, M. Wave propagation analysis of cylindrical sandwich shell with auxetic core utilizing first-order shear deformable theory (FSDT). Mech. Based Des. Struct. Mach. 2024, 52, 1705–1729. [Google Scholar] [CrossRef]
- Si, J.; Zhang, Y. An enhanced higher order zigzag theory for laminated composite plates under mechanical/thermal loading. Compos. Struct. 2022, 282, 115074. [Google Scholar] [CrossRef]
- Alam, M.I.; Pandit, M.K.; Pradhan, A.K. A modified higher-order zigzag theory for predicting flexural behavior of laminated composite and sandwich shell. Mech. Adv. Mater. Struct. 2024, 31, 6434–6449. [Google Scholar] [CrossRef]
- Carrera, E.; Cinefra, M.; Petrolo, M. Classical, refined, zig-zag, layer-wise models and best theory diagrams for laminated structures. In Mathematical Methods and Models in Composites; 2023; pp. 155–208.
- Yang, W.; Yan, G.; Alnowibet, K.A.; El-Meligy, M. Application of Carrera unified formulation to predict the flexural response of the composite floor systems at elevated temperatures: Development of the hybrid population-based metaheuristic algorithms. Mech. Adv. Mater. Struct. 2024, 1–9. [Google Scholar] [CrossRef]
- Karri, C.P.; Kambagowni, V. Finite element analysis approach for optimal design and mechanical performance prediction of additive manufactured sandwich lattice structures. J. Inst. Eng. India Ser. D 2024, 1–6. [Google Scholar] [CrossRef]
- Teimouri, A.; Alinia, M.; Kamarian, S.; Saber-Samandari, S.; Li, G.; Song, J.I. Design optimization of additively manufactured sandwich beams through experimentation, machine learning, and imperialist competitive algorithm. J. Eng. Des. 2024, 35, 320–337. [Google Scholar] [CrossRef]
- Abu Salem, K.; Augello, R.; Carrera, E. Component-wise modelling of core and skin in sandwich structures using a single refined beam finite element. Mech. Adv. Mater. Struct. 2025, 1–4. [Google Scholar] [CrossRef]
- Gupta, S.; Gnanamoorthy, R.; Kandasubramanian, B. Additive manufacturing of topology optimized multi-functional cellular framework for enhanced energy absorption. Prog. Addit. Manuf. 2025, 1–29. [Google Scholar] [CrossRef]
- Li, H.; Sharif Khodaei, Z.; Aliabadi, M.H. FFT-based homogenisation for efficient concurrent multiscale modelling of thin plate structures. Comput. Mech. 2024, 1–7. [Google Scholar] [CrossRef]
- Lee, H.; Lee, S.; Ryu, S. Advancements and challenges of micromechanics-based homogenization for the short fiber reinforced composites. Multiscale Sci. Eng. 2023, 5, 133–146. [Google Scholar] [CrossRef]
- Taherzadeh-Fard, A.; Cornejo, A.; Jiménez, S.; Barbu, L.G. Numerical analysis of damage in composites: from intra-layer to delamination and data-assisted methods. Mathematics 2025, 13, 1578. [Google Scholar] [CrossRef]
- Ma, Q.; Rejab, M.R.; Siregar, J.P.; Guan, Z. A review of the recent trends on core structures and impact response of sandwich panels. J. Compos. Mater. 2021, 55, 2513–2555. [Google Scholar] [CrossRef]
- Kunzmann, C.; Aliakbarpour, H.; Ramezani, M. Biomimetics design of sandwich-structured composites. J. Compos. Sci. 2023, 7, 315. [Google Scholar] [CrossRef]
- Iqbal, S.; Kamiński, M. Review study on mechanical properties of cellular materials. Materials 2024, 17, 2682. [Google Scholar] [CrossRef] [PubMed]
- Karathanasopoulos, N.; Rodopoulos, D.C. Enhanced cellular materials through multiscale, variable-section inner designs: mechanical attributes and neural network modeling. Materials 2022, 15, 3581. [Google Scholar] [CrossRef] [PubMed]
- Teng, X.C.; Ren, X.; Zhang, Y.; Jiang, W.; Pan, Y.; Zhang, X.G.; Zhang, X.Y.; Xie, Y.M. A simple 3D re-entrant auxetic metamaterial with enhanced energy absorption. Int. J. Mech. Sci. 2022, 229, 107524. [Google Scholar] [CrossRef]
- Lu, H.; Wang, X.; Chen, T. In-plane dynamic crushing of a combined auxetic honeycomb with negative Poisson’s ratio and enhanced energy absorption. Thin-Walled Struct. 2021, 160, 107366. [Google Scholar] [CrossRef]
- Xu, Z.H.; Cui, Y.J.; Wang, K.F.; Wang, B.L.; Wang, B. Quasi-static compression and impact resistances of novel re-entrant chiral hybrid honeycomb structures. Compos. Struct. 2025, 119206. [Google Scholar] [CrossRef]
- Chen, M.; Zhong, R.; Wang, Y.; Wu, H.; Fu, M. Mechanical properties of re-entrant chiral anisotropic honeycomb. Eng. Struct. 2023, 291, 116431. [Google Scholar] [CrossRef]
- Cluni, F.; Gusella, V. Homogenization of non-periodic masonry structures. Int. J. Solids Struct. 2004, 41, 1911–1923. [Google Scholar] [CrossRef]
- San Ha, N.; Lee, T.U.; Ma, J.; et al. Energy absorption of a bio-inspired cylindrical sandwich structure. Thin-Walled Struct. 2024, 195, 111378. [Google Scholar] [CrossRef]
- Dereli, E.; Mbendou II, J.; Patel, V.; Mittelstedt, C. Analytical and numerical analysis of composite sandwich structures with additively manufactured lattice cores. Compos. Part C Open Access 2024, 14, 100484. [Google Scholar] [CrossRef]
- Yan, H.; Wu, W.T.; Zhao, Z.; Feng, F. Review and comparison of turbulent convective heat transfer in state-of-the-art 3D truss periodic cellular structures. Appl. Therm. Eng. 2023, 235, 121450. [Google Scholar] [CrossRef]
- Zhang, Y.; Yan, Z.; Shen, M.; Jiang, Q.; Wang, W.; Sang, Y.; Hao, B. Study on the thermal control performance of lightweight minimal surface lattice structures for aerospace applications. Appl. Therm. Eng. 2025, 261, 125110. [Google Scholar] [CrossRef]
- Cao, X.; Ji, B.; Lin, Y.; Fan, H. Large-diameter metal matrix composite lattice truss sandwich cylinder: Additive manufacturing, testing and analyzing. Compos. Struct. 2023, 304, 116445. [Google Scholar] [CrossRef]
- Li, T.; Wang, L. Bending behavior of sandwich composite structures with tunable 3D-printed core materials. Compos. Struct. 2017, 175, 46–57. [Google Scholar] [CrossRef]
- Maes, V.K.; Pavlov, L.; Sahak, M. An efficient semi-automated optimisation approach for (grid-stiffened) composite structures: Application to Ariane 6 Interstage. Compos. Struct. 2019, 209, 1042–1049. [Google Scholar] [CrossRef]
- Huang, L.; Sheikh, A.H.; Ng, C.T.; Griffith, M.C. An efficient finite element model for buckling analysis of grid stiffened laminated composite plates. Compos. Struct. 2015, 122, 41–50. [Google Scholar] [CrossRef]
- Ahmadi, H.; Rahimi, G. Analytical and experimental investigation of transverse loading on grid stiffened composite panels. Compos. Part B Eng. 2019, 159, 184–198. [Google Scholar] [CrossRef]
- Yu, W.; Hodges, D.H.; Volovoi, V.; Cesnik, C.E. On Timoshenko-like modeling of initially curved and twisted composite beams. Int. J. Solids Struct. 2002, 39, 5101–5121. [Google Scholar] [CrossRef]
- Patil, M.J.; Hodges, D.H.; Cesnik, C.E. Nonlinear aeroelastic analysis of complete aircraft in subsonic flow. J. Aircraft 2000, 37, 753–760. [Google Scholar] [CrossRef]
- Bhadoria, S.K.; Burela, R.G. Analytical and computational study of compressible neo-Hookean model using VAM for two types of global warping constraints. Int. J. Non-Linear Mech. 2024, 160, 104652. [Google Scholar] [CrossRef]
- Peng, X.; Wang, J.; Wang, W.; Lei, B. Comparative analysis of in-plane elasticity and impact responses for re-entrant, star-shaped and double-arrowhead honeycombs using VAM and improved PSO. Aerosp. Sci. Technol. 2025, 158, 109925. [Google Scholar] [CrossRef]
- Qiao, K.; Xu, X.; Guo, S. Numerical implementation of variational asymptotic homogenization method for periodic plate structures. Int. J. Aeronaut. Space Sci. 2021, 22, 64–78. [Google Scholar] [CrossRef]
- Wang, Z.; Yang, X.; Lai, W.; Zhong, Y.; Liu, R. A VAM-based equivalent model for triangular honeycomb sandwich panels: Comparison with numerical and experimental data. Materials 2022, 15, 4766. [Google Scholar] [CrossRef] [PubMed]
Figure 1.
Comparison of grid, lattice, and 3D egg-crate structures.
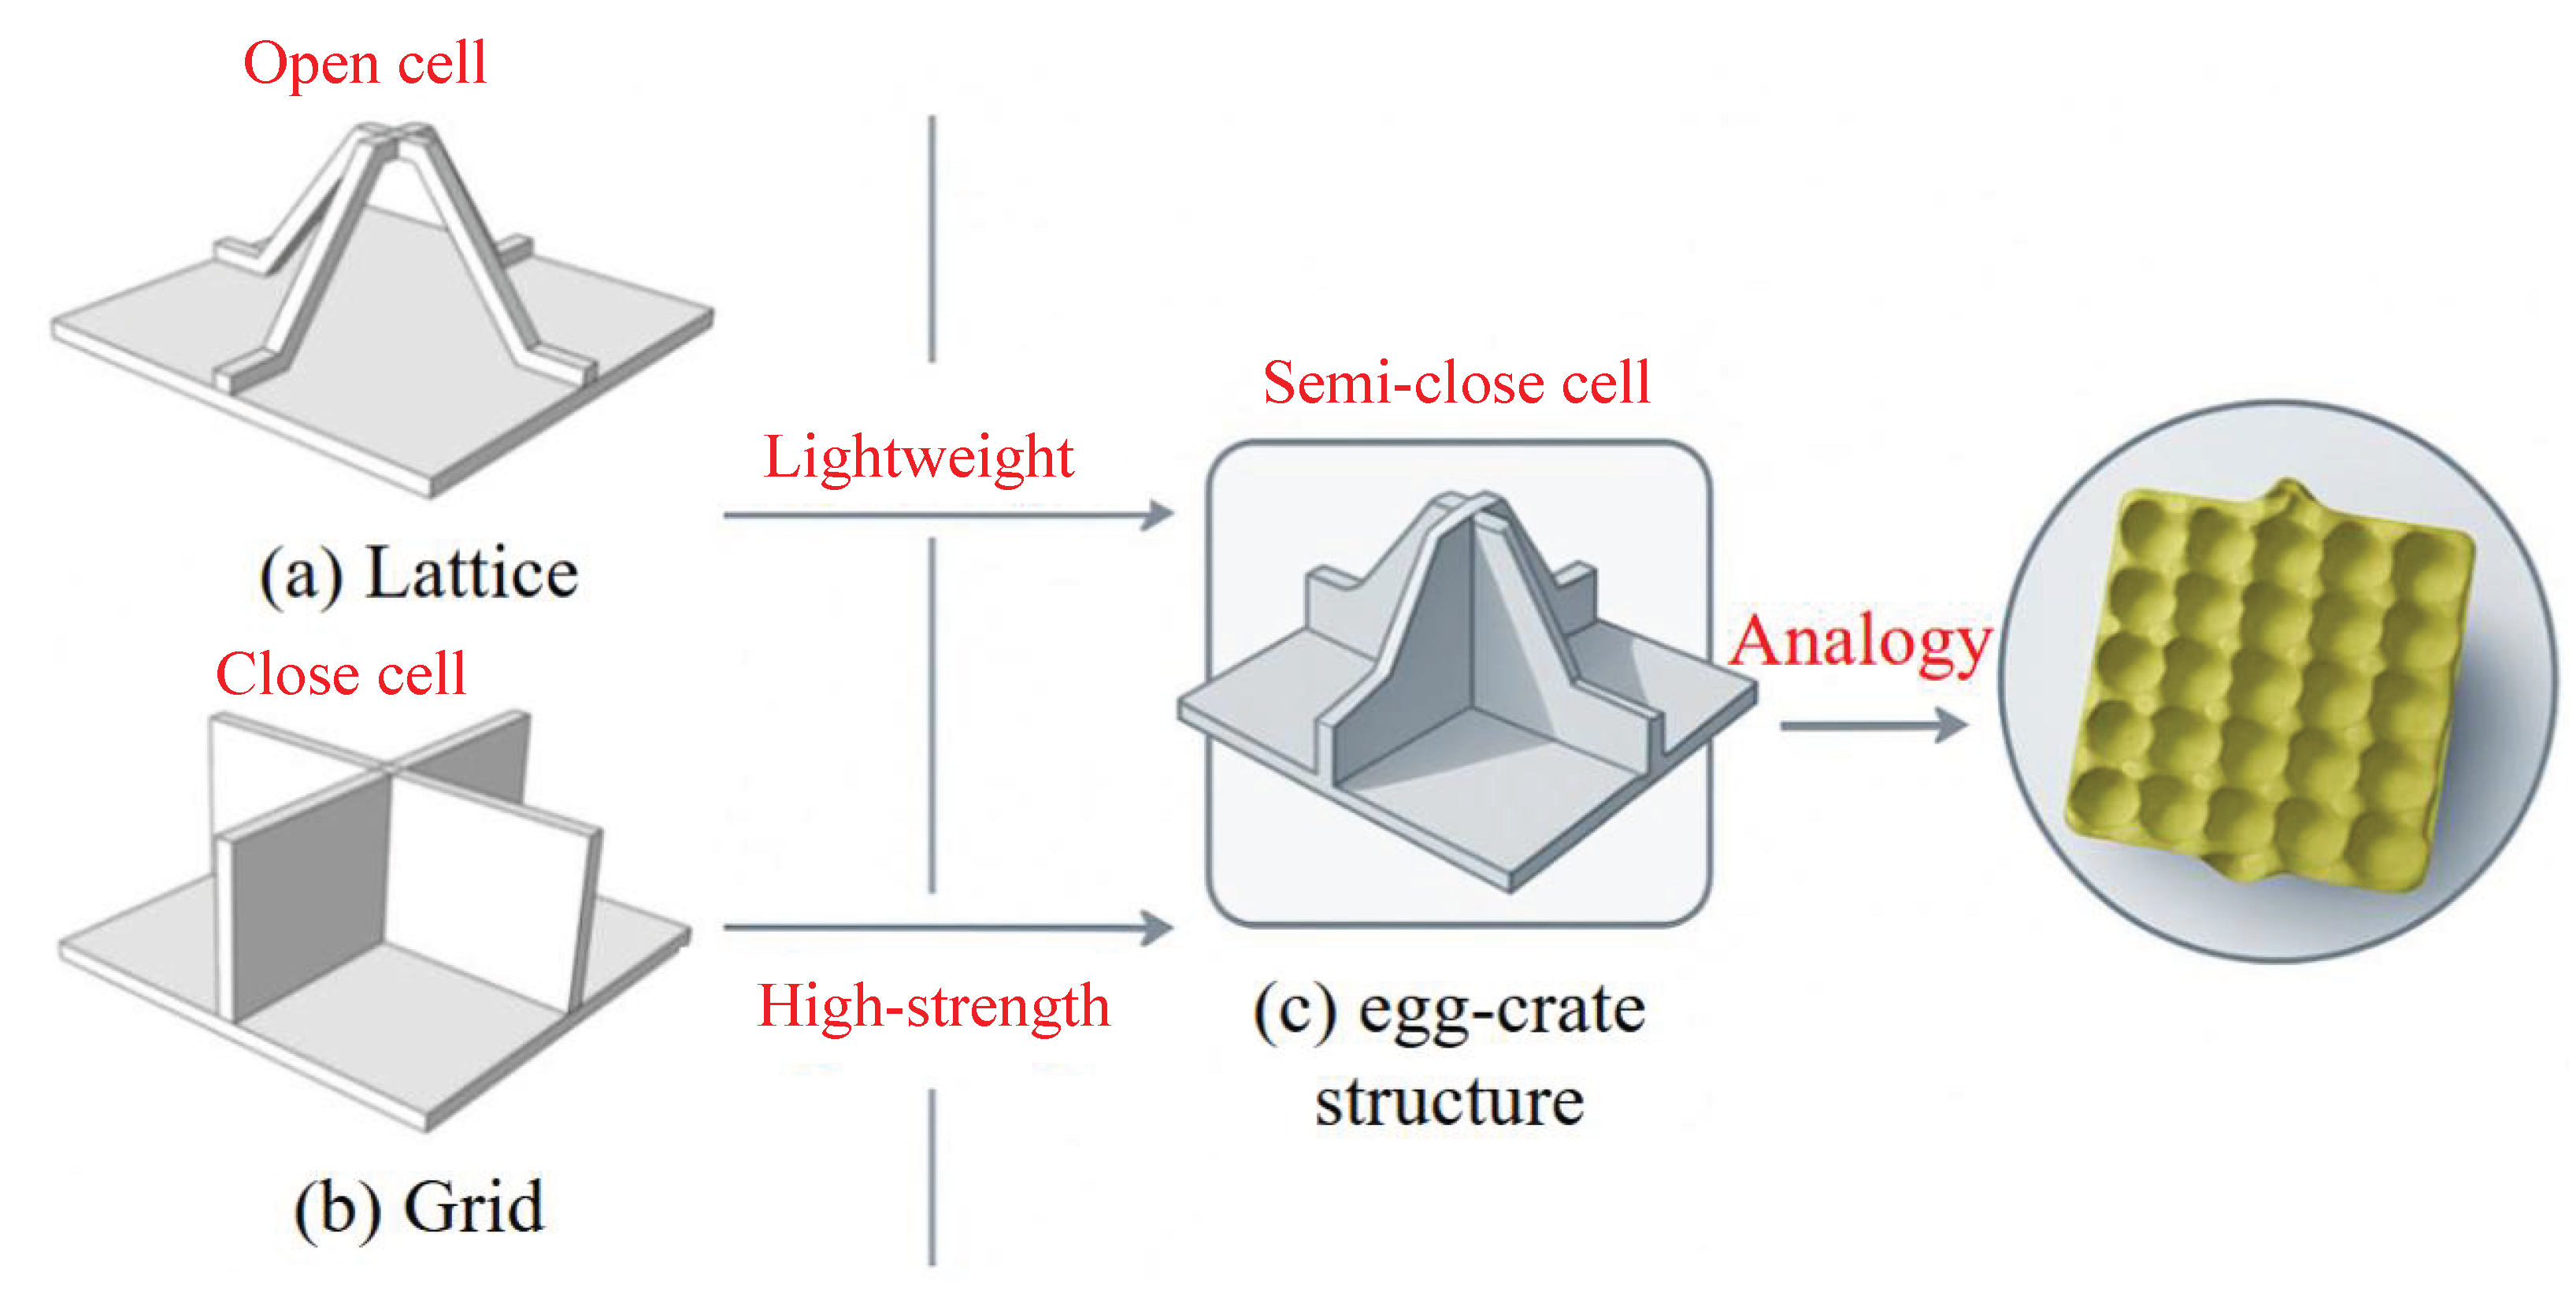
Figure 2.
Schematic of VAM-based strain energy derivation for SP-EHC.
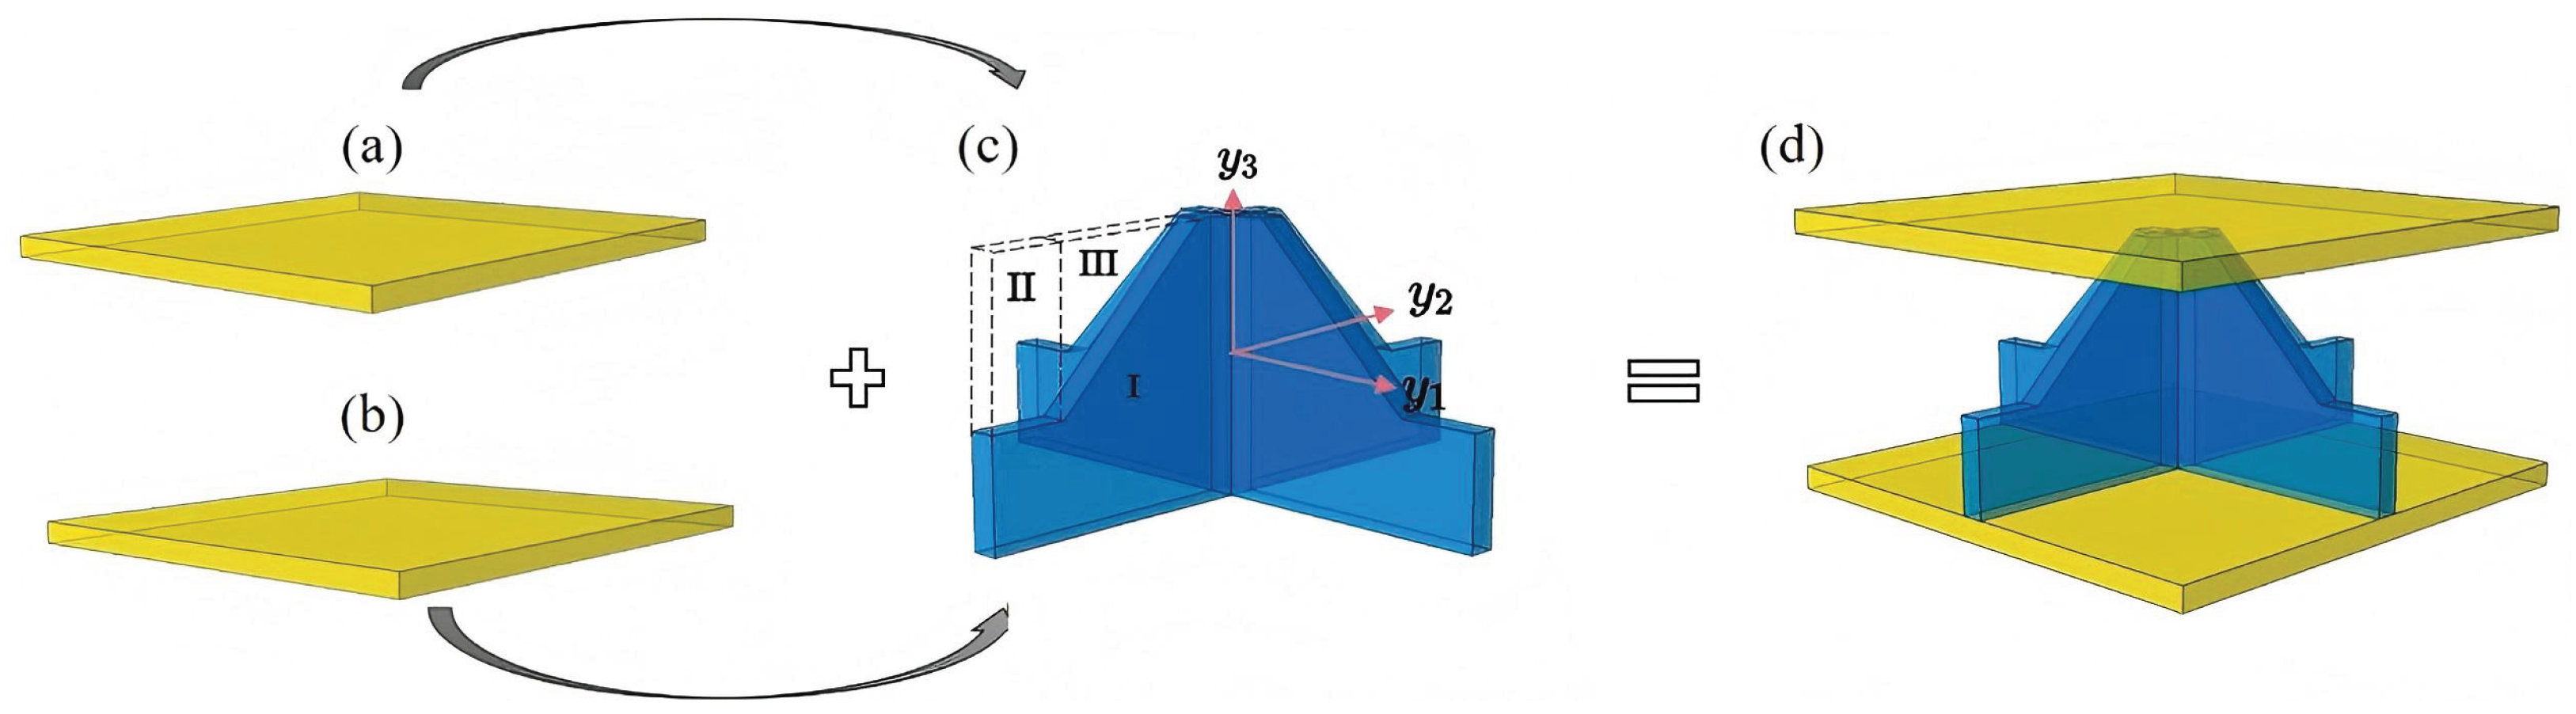
Figure 3.
(a) Dimensions of the dog-bone-shaped tensile specimen (mm), (b) Experimental setup for uniaxial tensile testing, (c) Nominal stress–strain curves of PLA specimens under uniaxial tension.
Figure 3.
(a) Dimensions of the dog-bone-shaped tensile specimen (mm), (b) Experimental setup for uniaxial tensile testing, (c) Nominal stress–strain curves of PLA specimens under uniaxial tension.
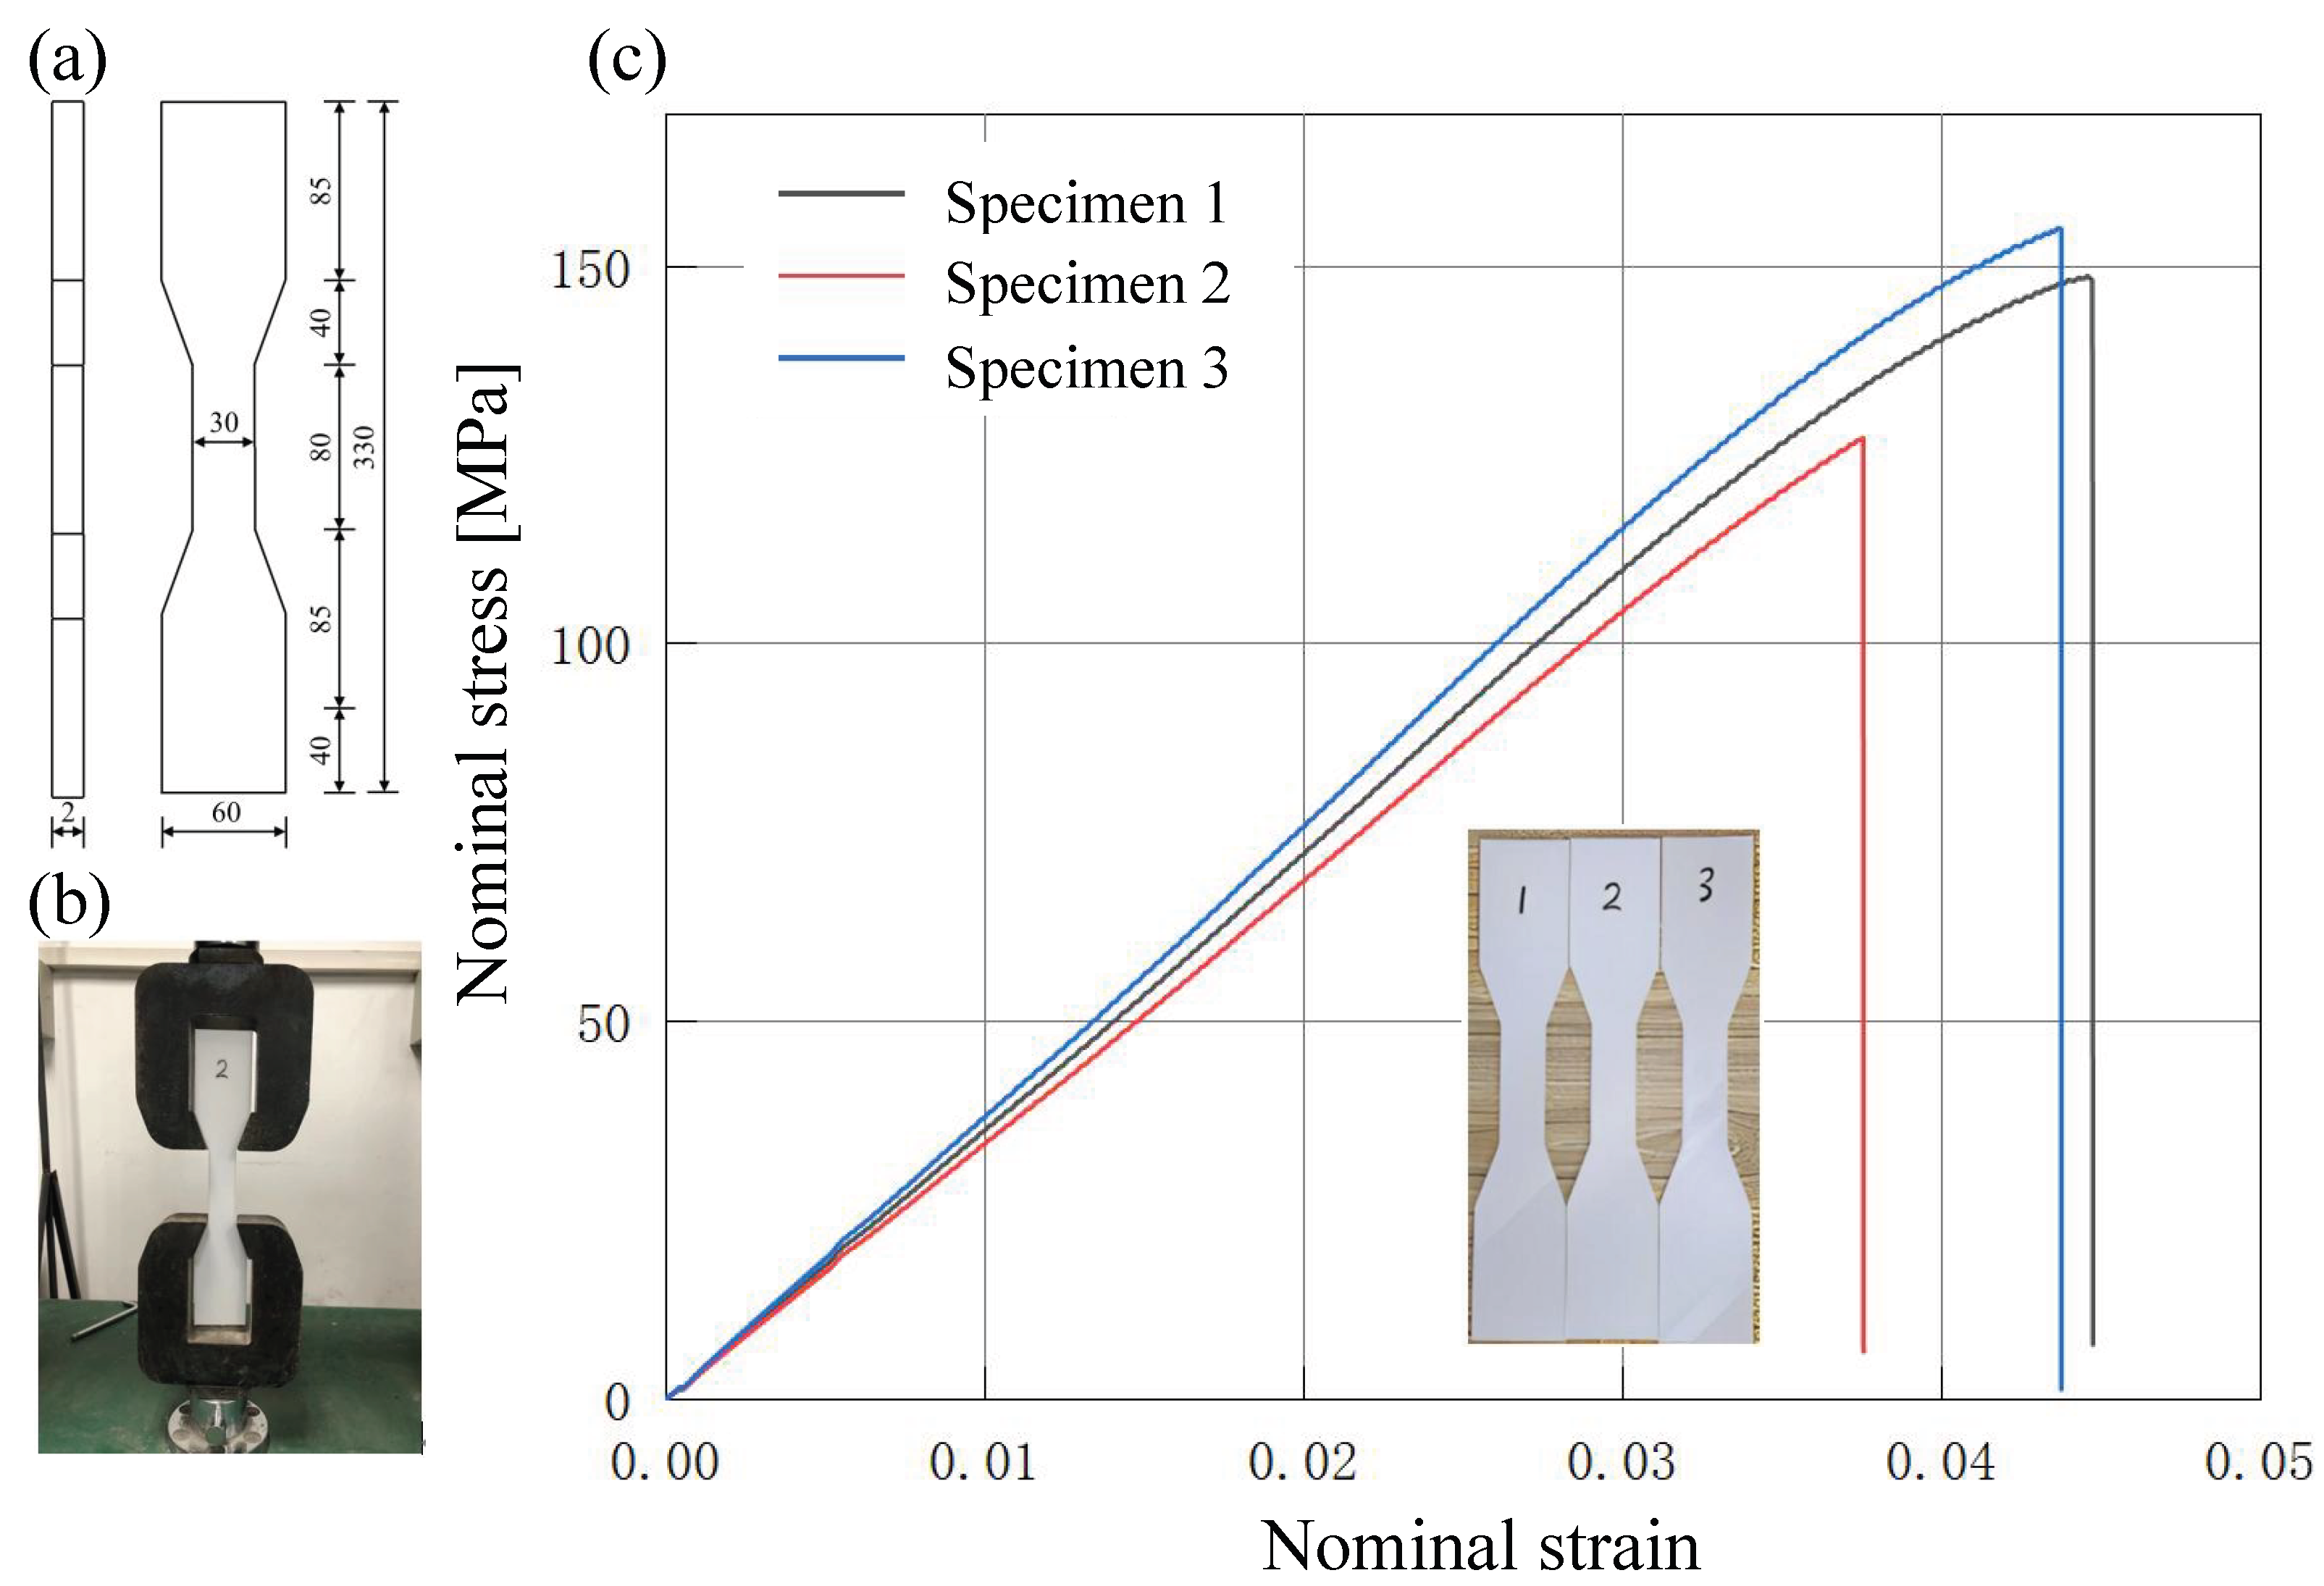
Figure 4.
(a) Photograph of the fabricated 3D egg-crate core sandwich panel; (b) Schematic of a unit cell with geometric parameters; (c) Experimental setup for free-boundary vibration testing.
Figure 4.
(a) Photograph of the fabricated 3D egg-crate core sandwich panel; (b) Schematic of a unit cell with geometric parameters; (c) Experimental setup for free-boundary vibration testing.
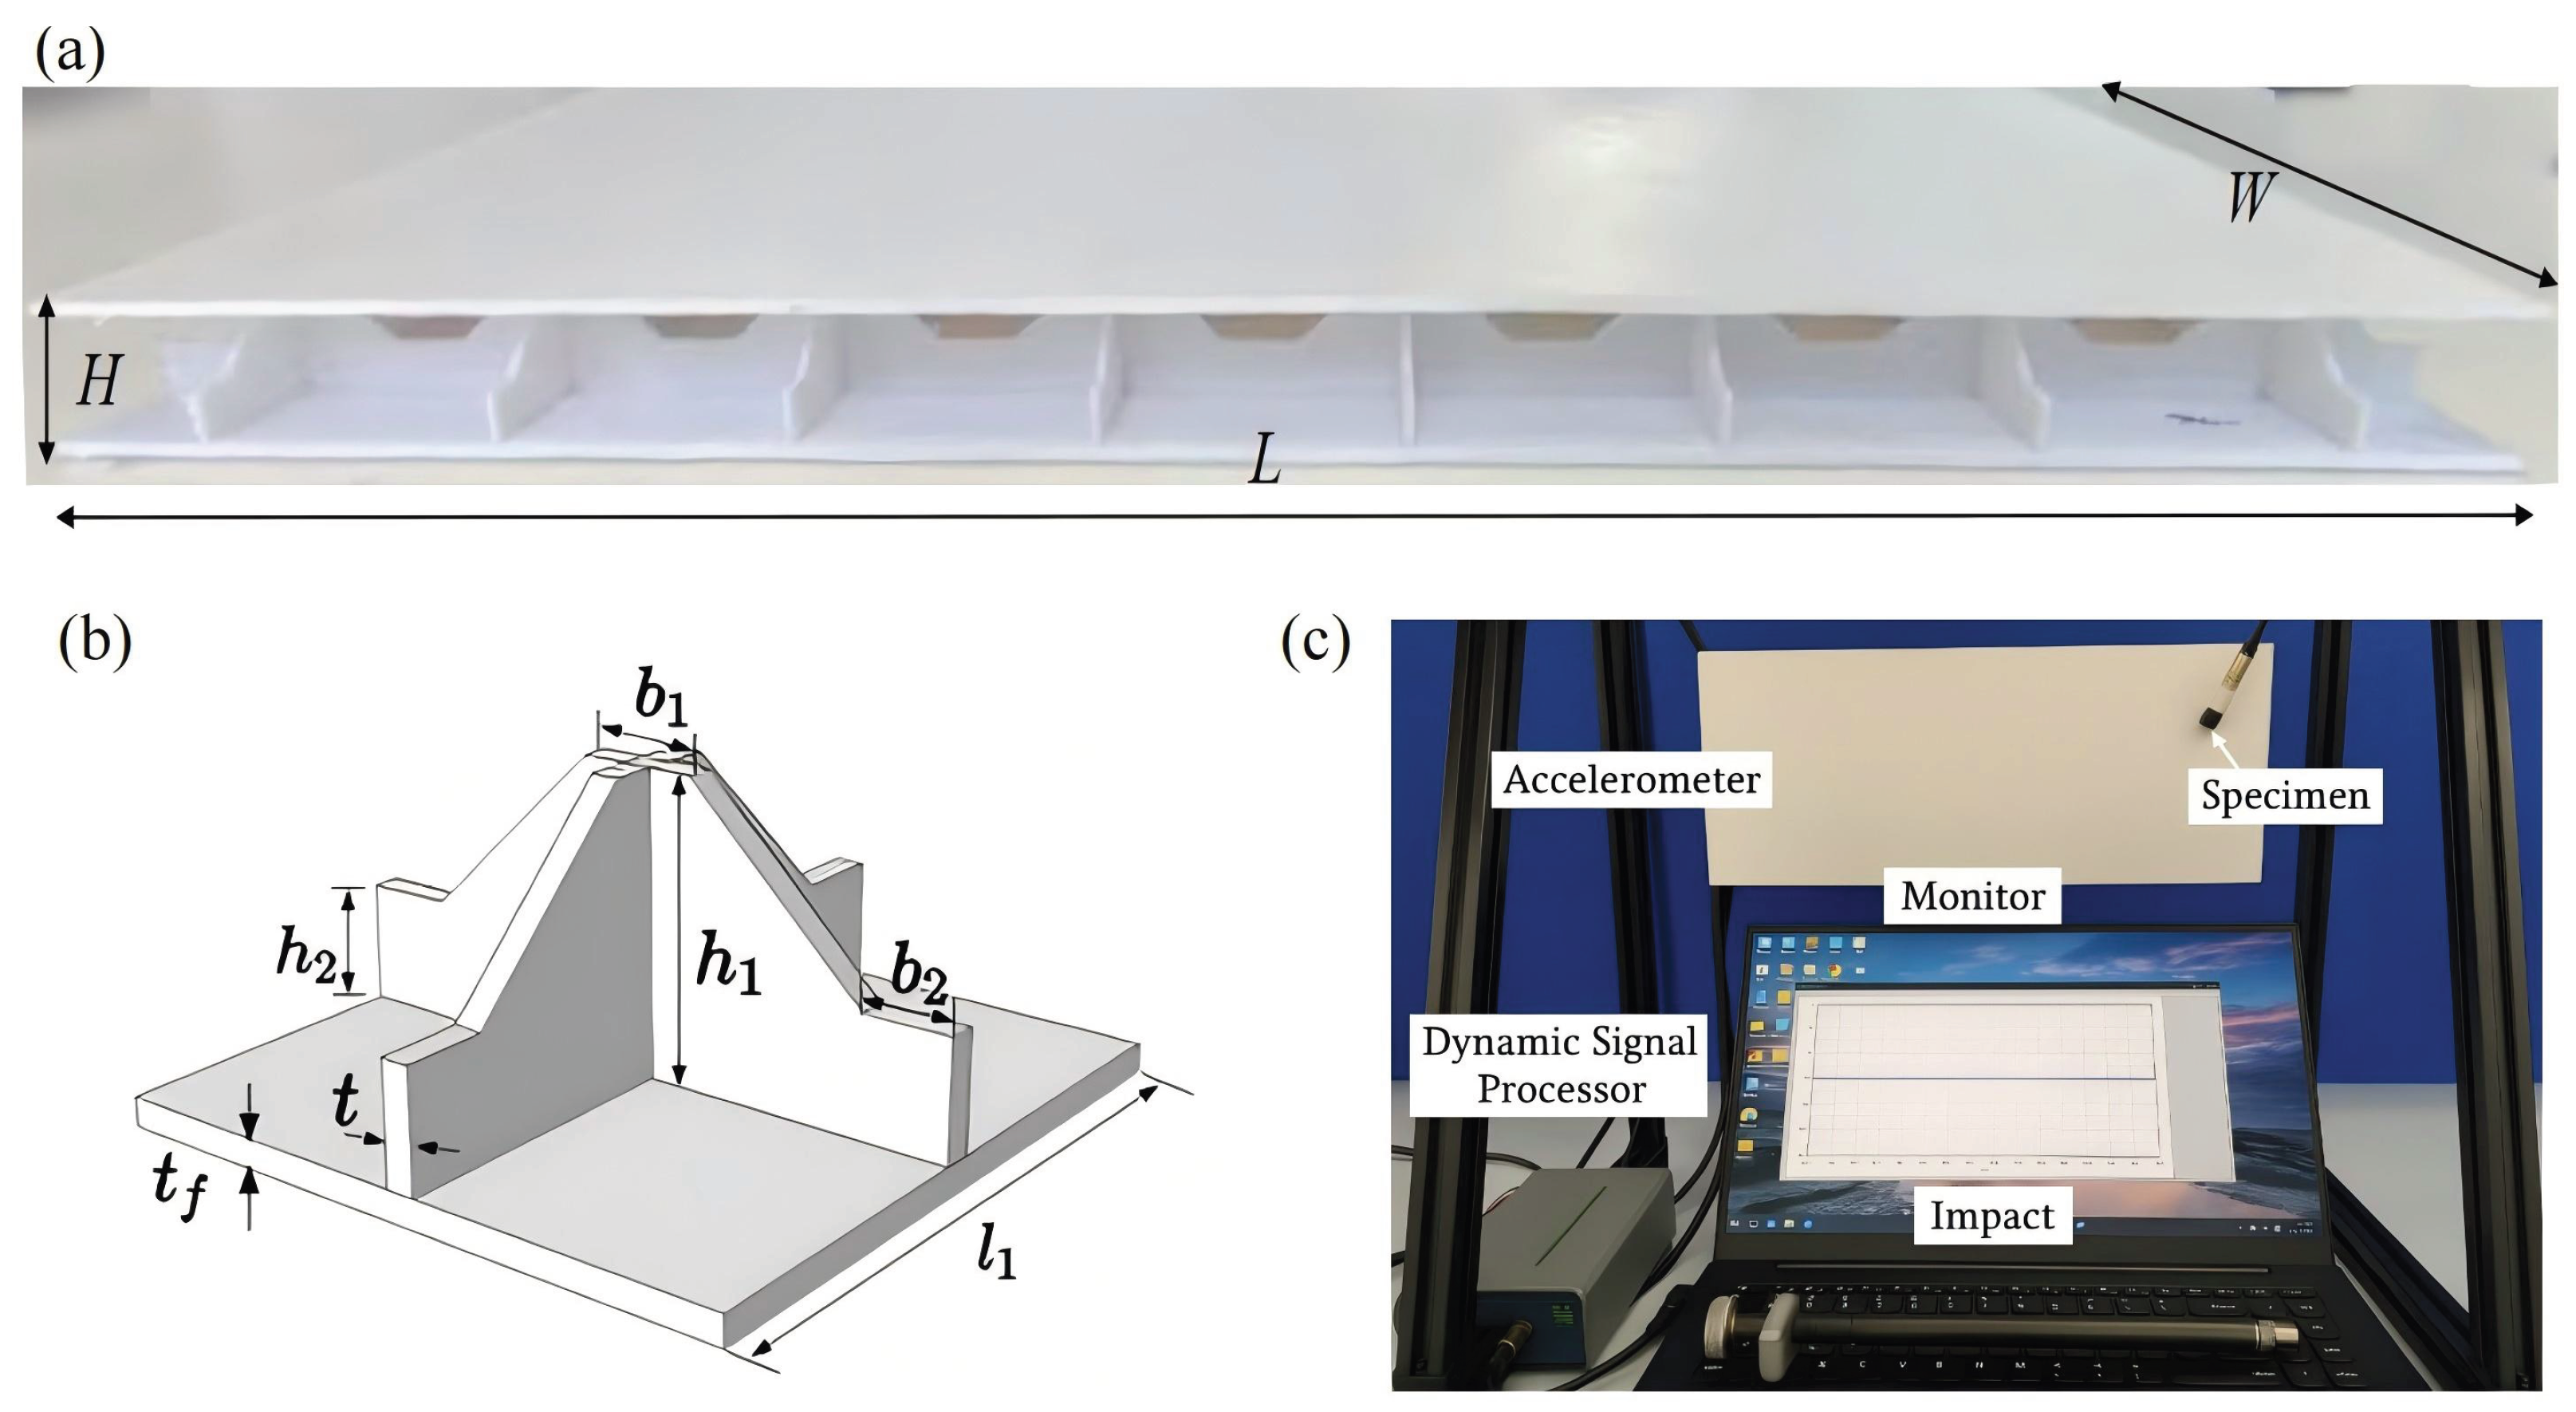
Figure 5.
Comparison of frequency-domain responses of SP-EHC obtained from 3D-EXP, 3D-FEM, and 2D-EPM.
Figure 5.
Comparison of frequency-domain responses of SP-EHC obtained from 3D-EXP, 3D-FEM, and 2D-EPM.
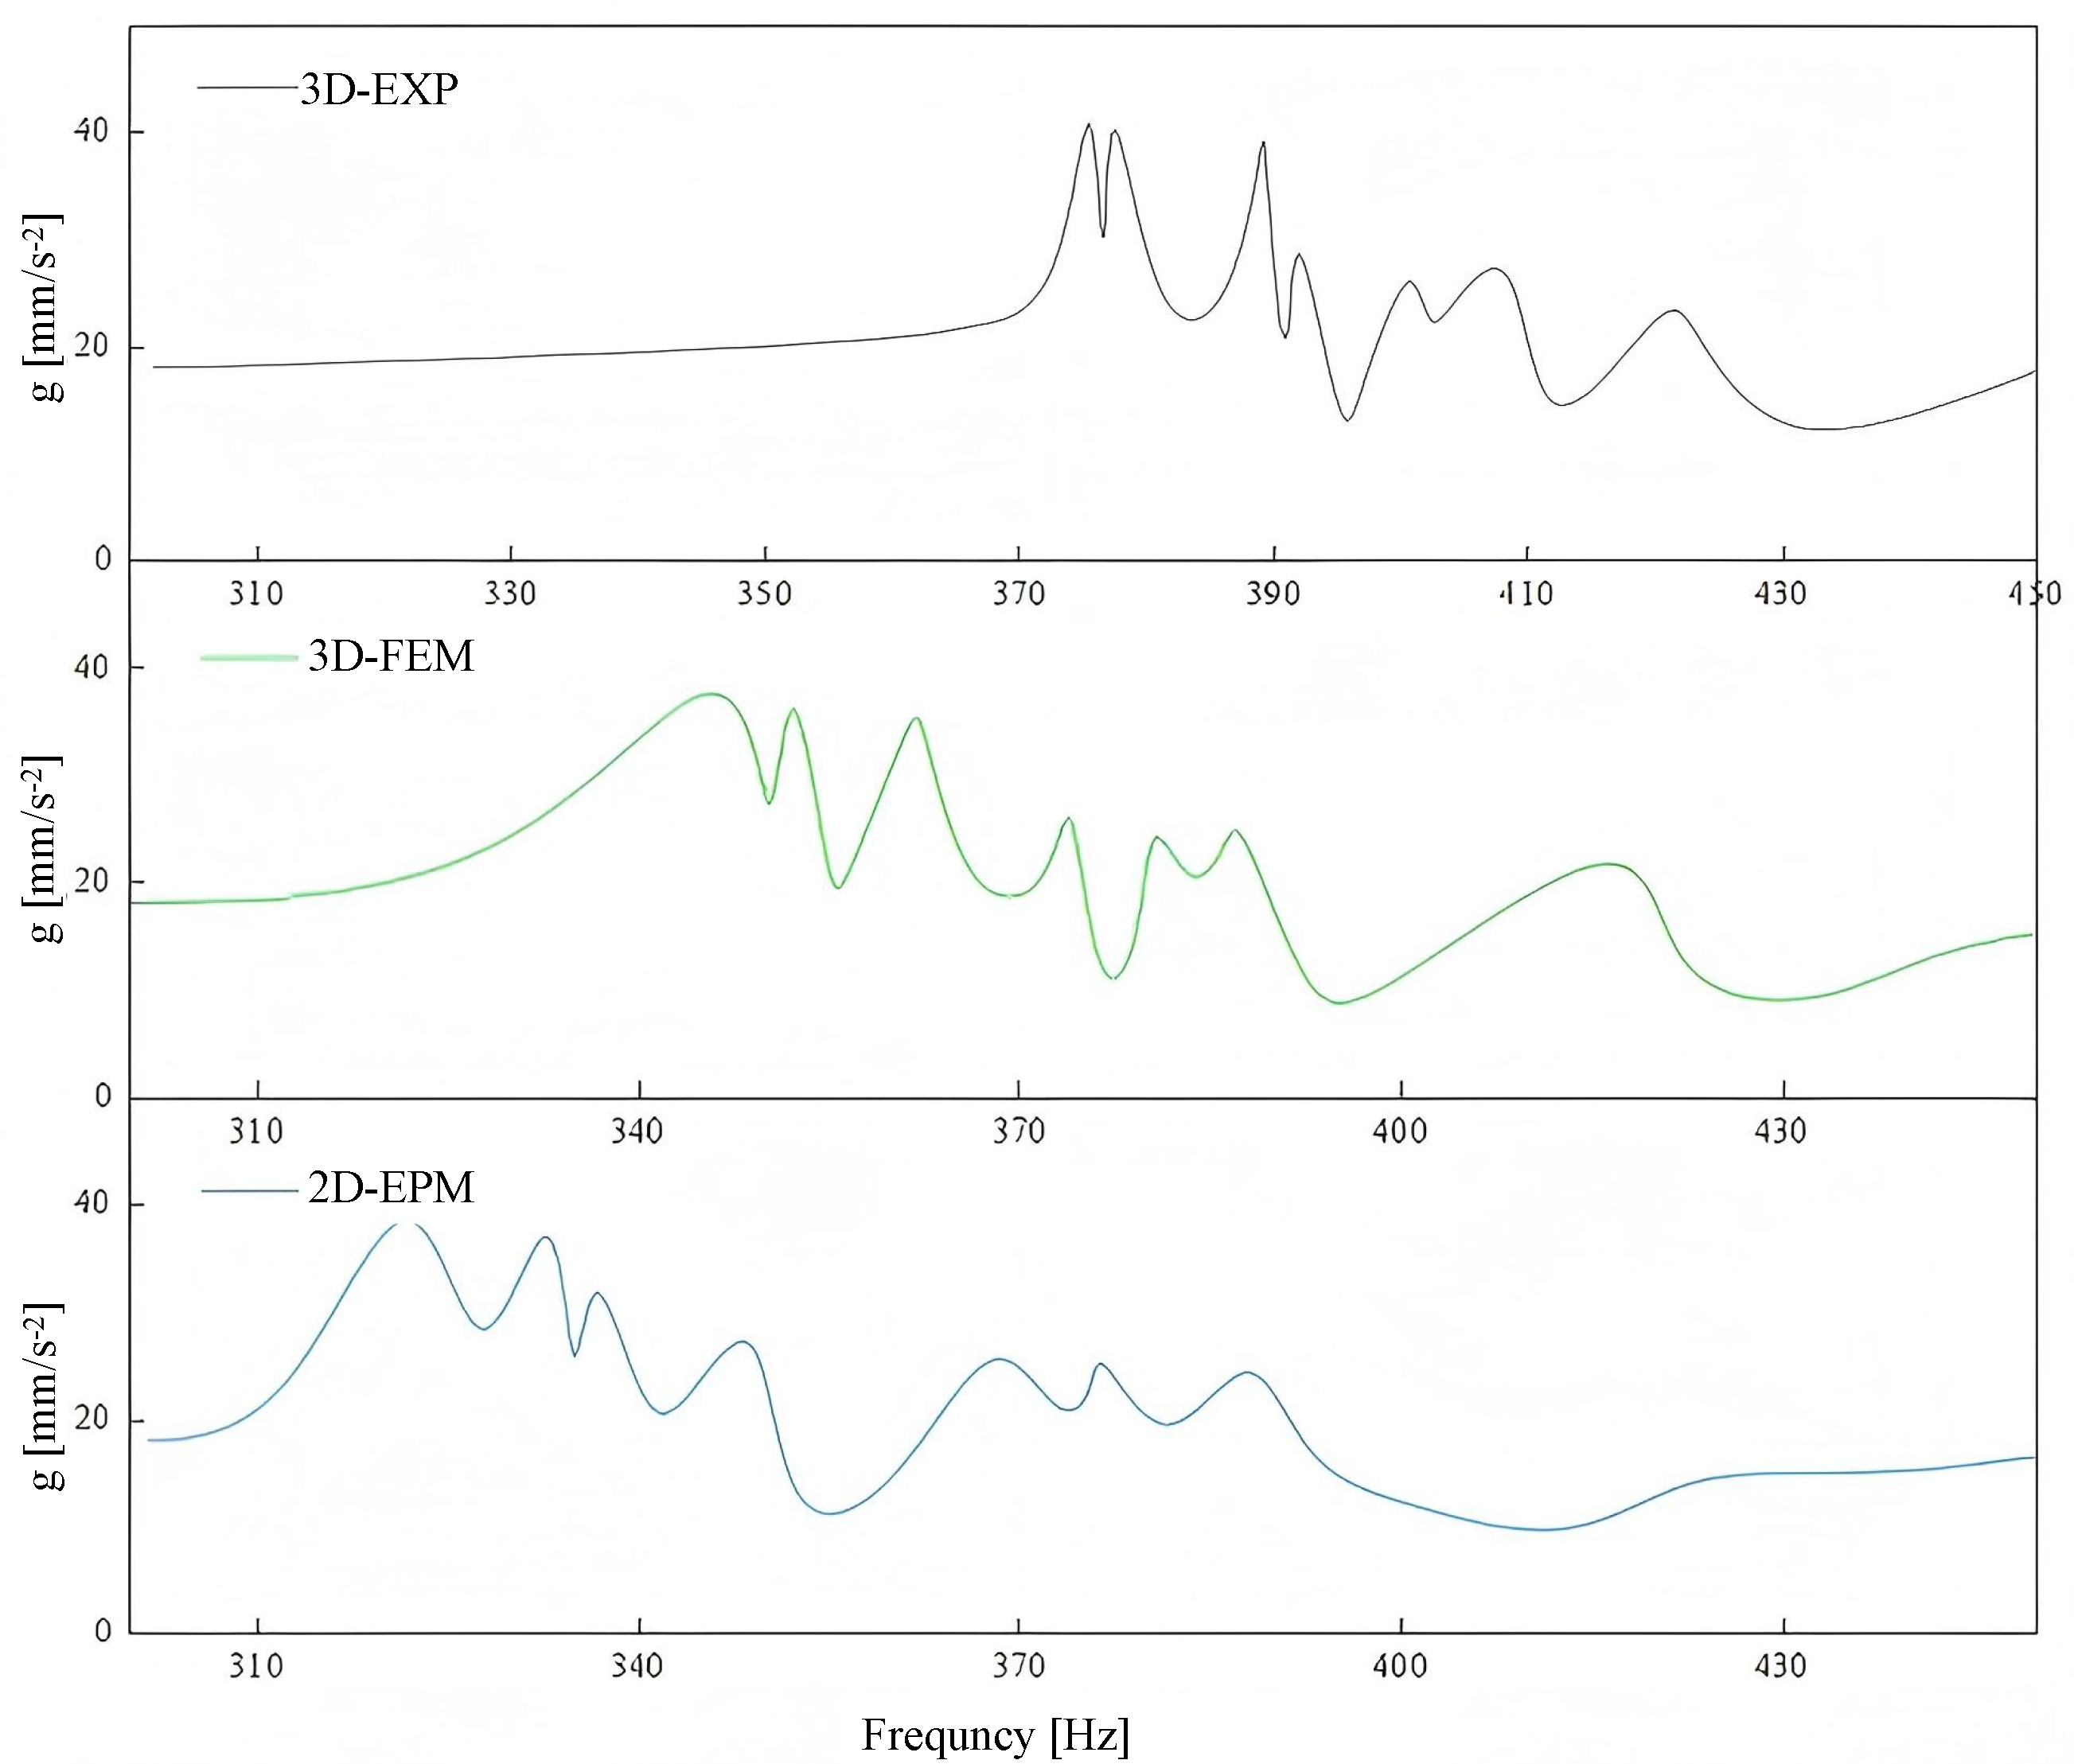
Figure 6.
Comparison of natural frequencies and modal errors for the first seven modes obtained from 3D-EXP, 3D-FEM, and 2D-EPM. Errors 1 and 2 refer to the deviations of the 3D-FEM and 2D-EPM results from the 3D-EXP data, respectively.
Figure 6.
Comparison of natural frequencies and modal errors for the first seven modes obtained from 3D-EXP, 3D-FEM, and 2D-EPM. Errors 1 and 2 refer to the deviations of the 3D-FEM and 2D-EPM results from the 3D-EXP data, respectively.
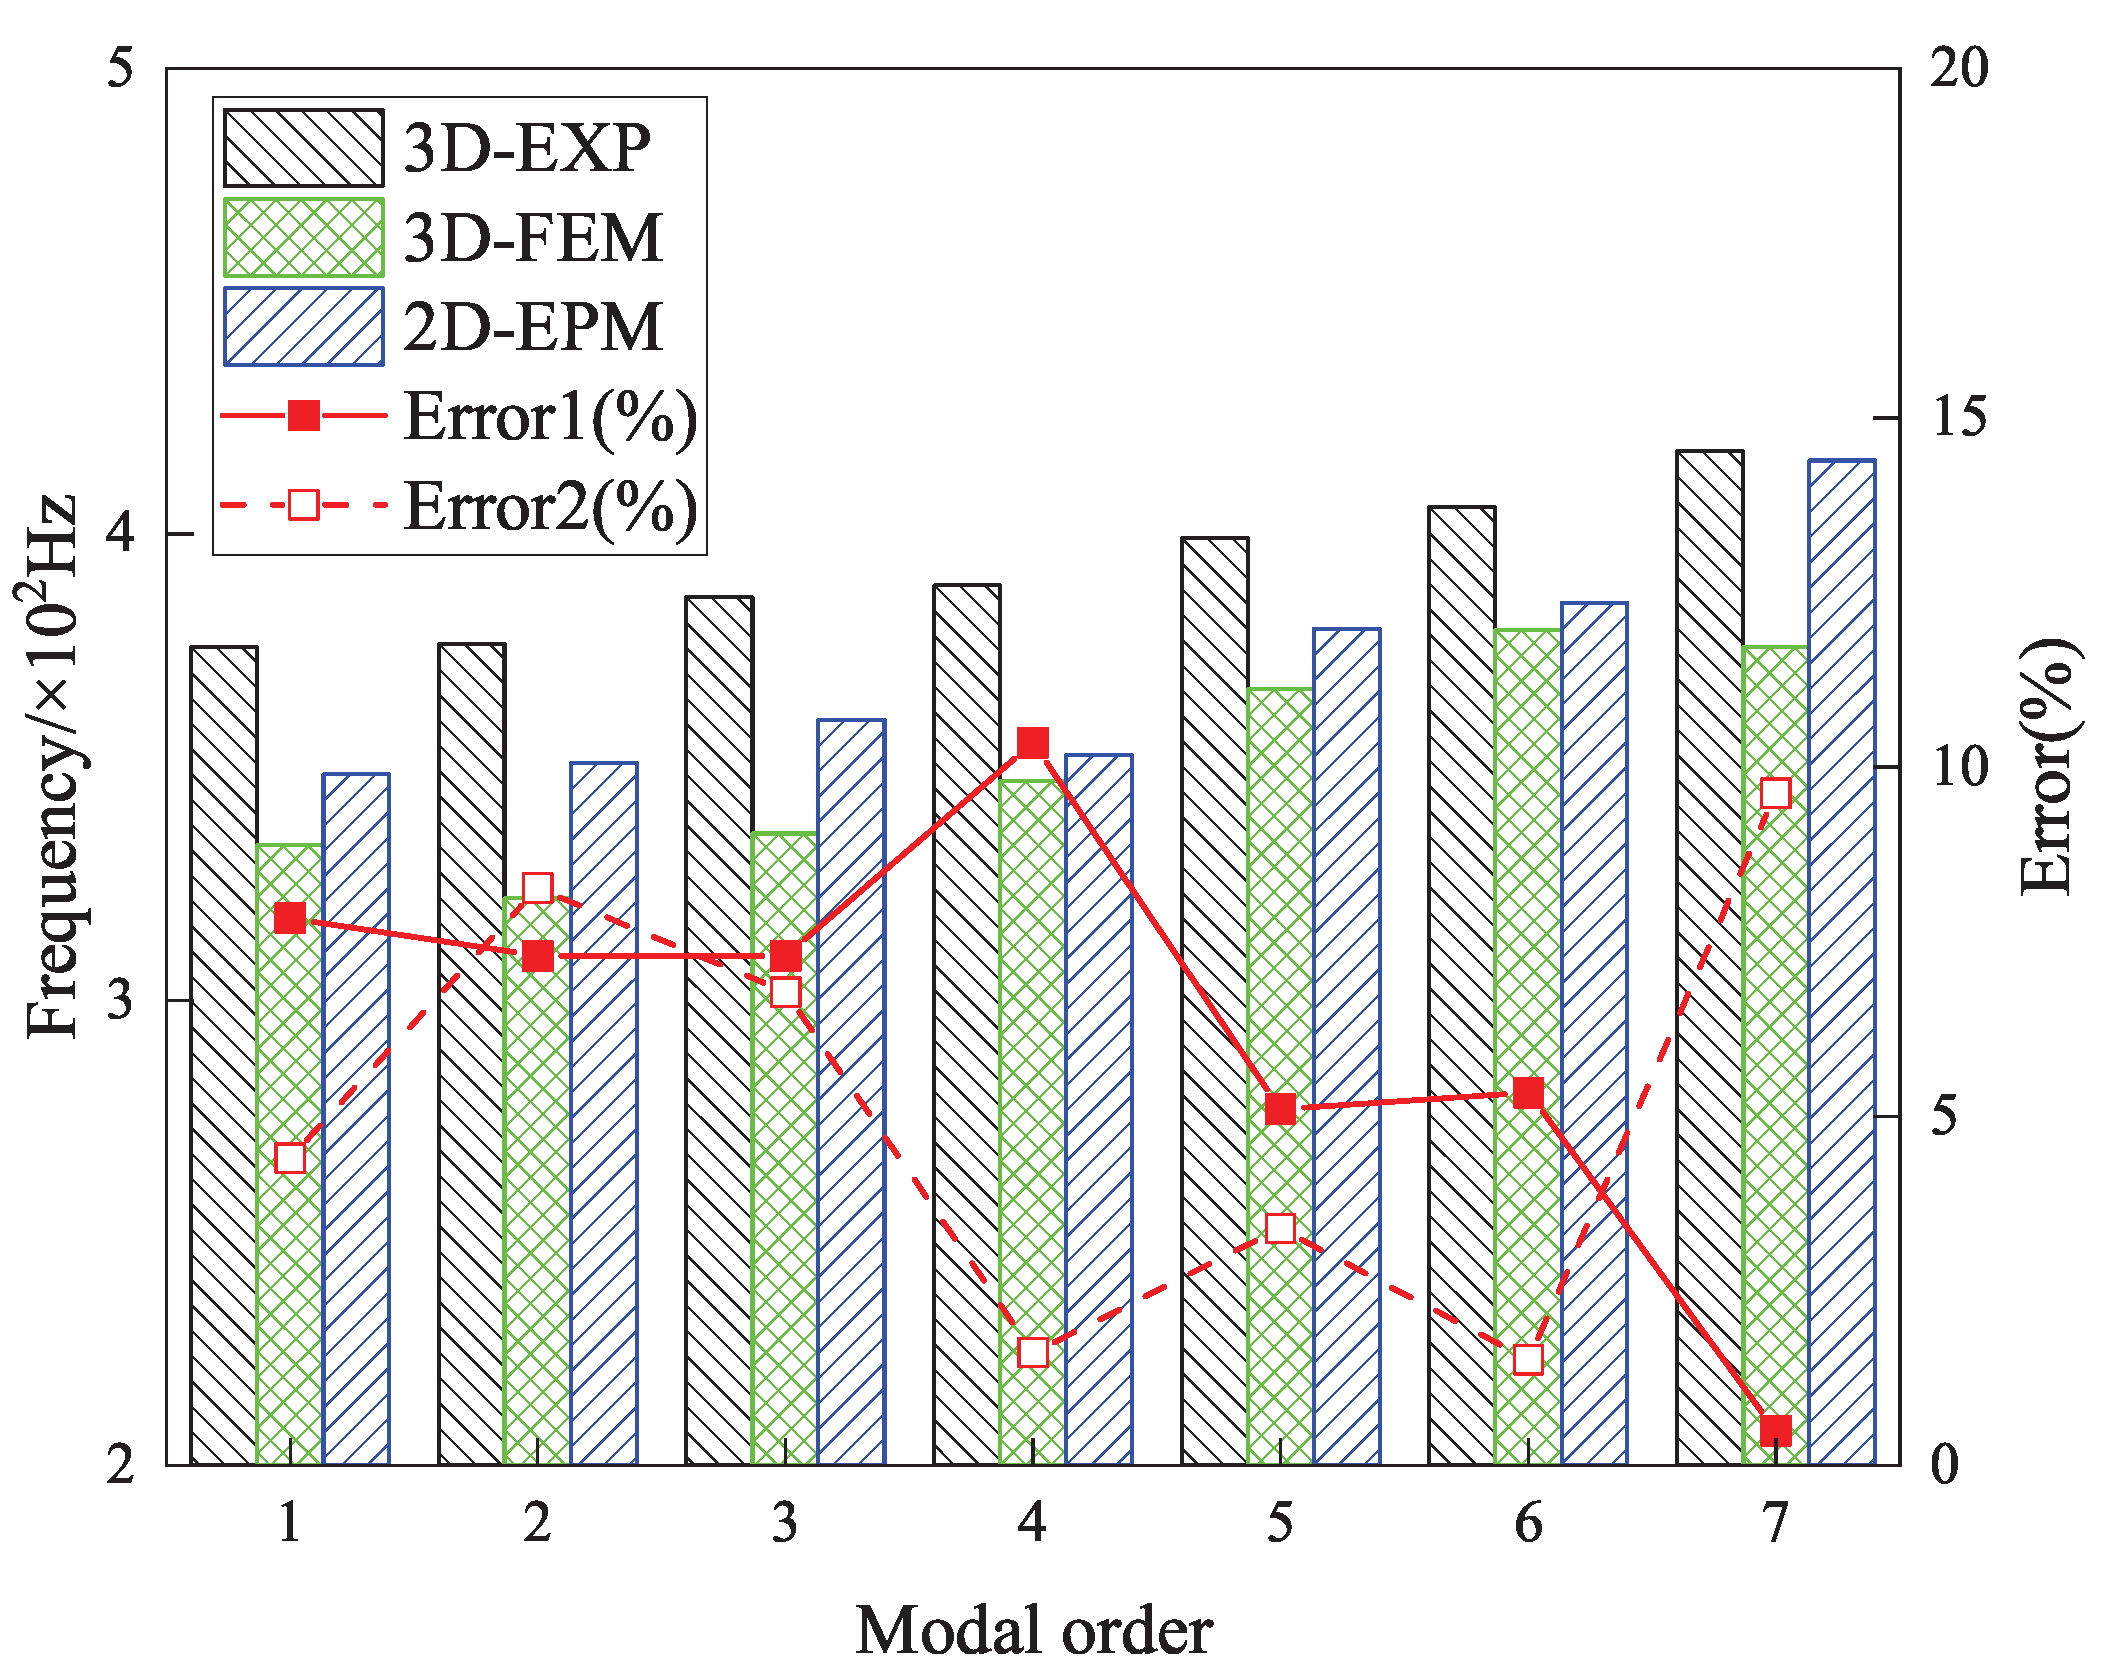
Figure 7.
Schematic illustration of the SP-EHC construction. The panel consists of two CFRP face sheets and a aluminum core layer formed by a periodic array of unit cells. Each unit cell features a cross-shaped configuration composed of orthogonally arranged structural elements.
Figure 7.
Schematic illustration of the SP-EHC construction. The panel consists of two CFRP face sheets and a aluminum core layer formed by a periodic array of unit cells. Each unit cell features a cross-shaped configuration composed of orthogonally arranged structural elements.
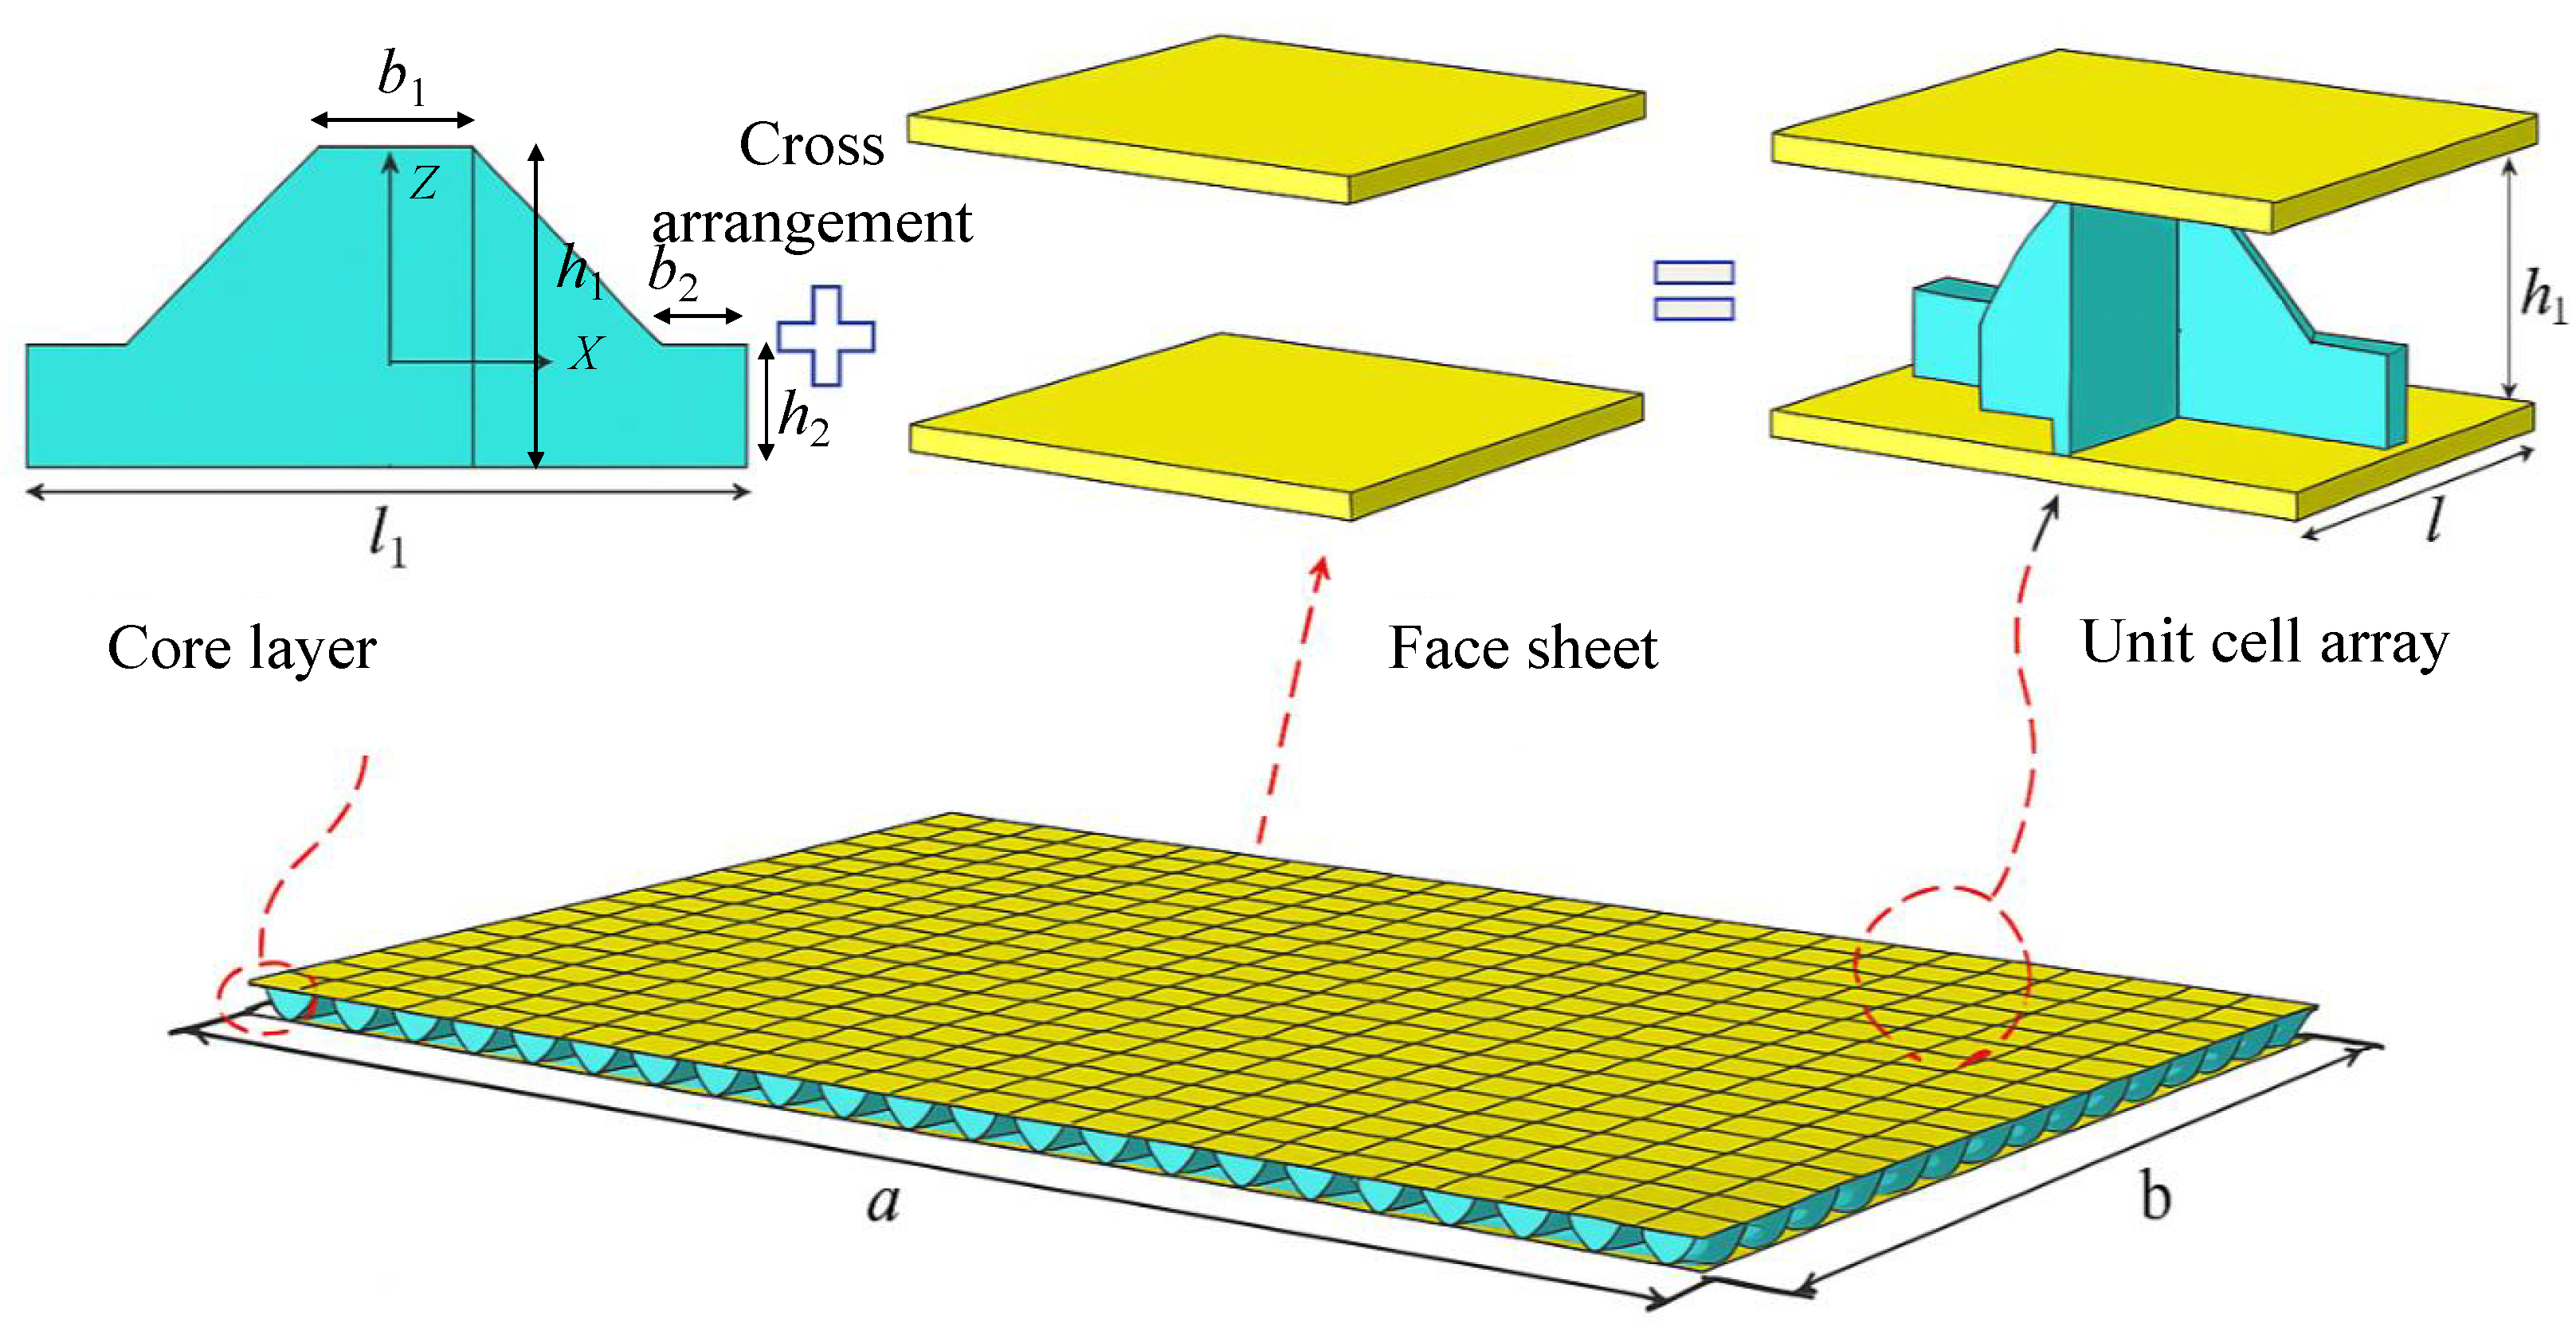
Figure 8.
Transformation of the theoretical stiffness matrix into its numerical representation.
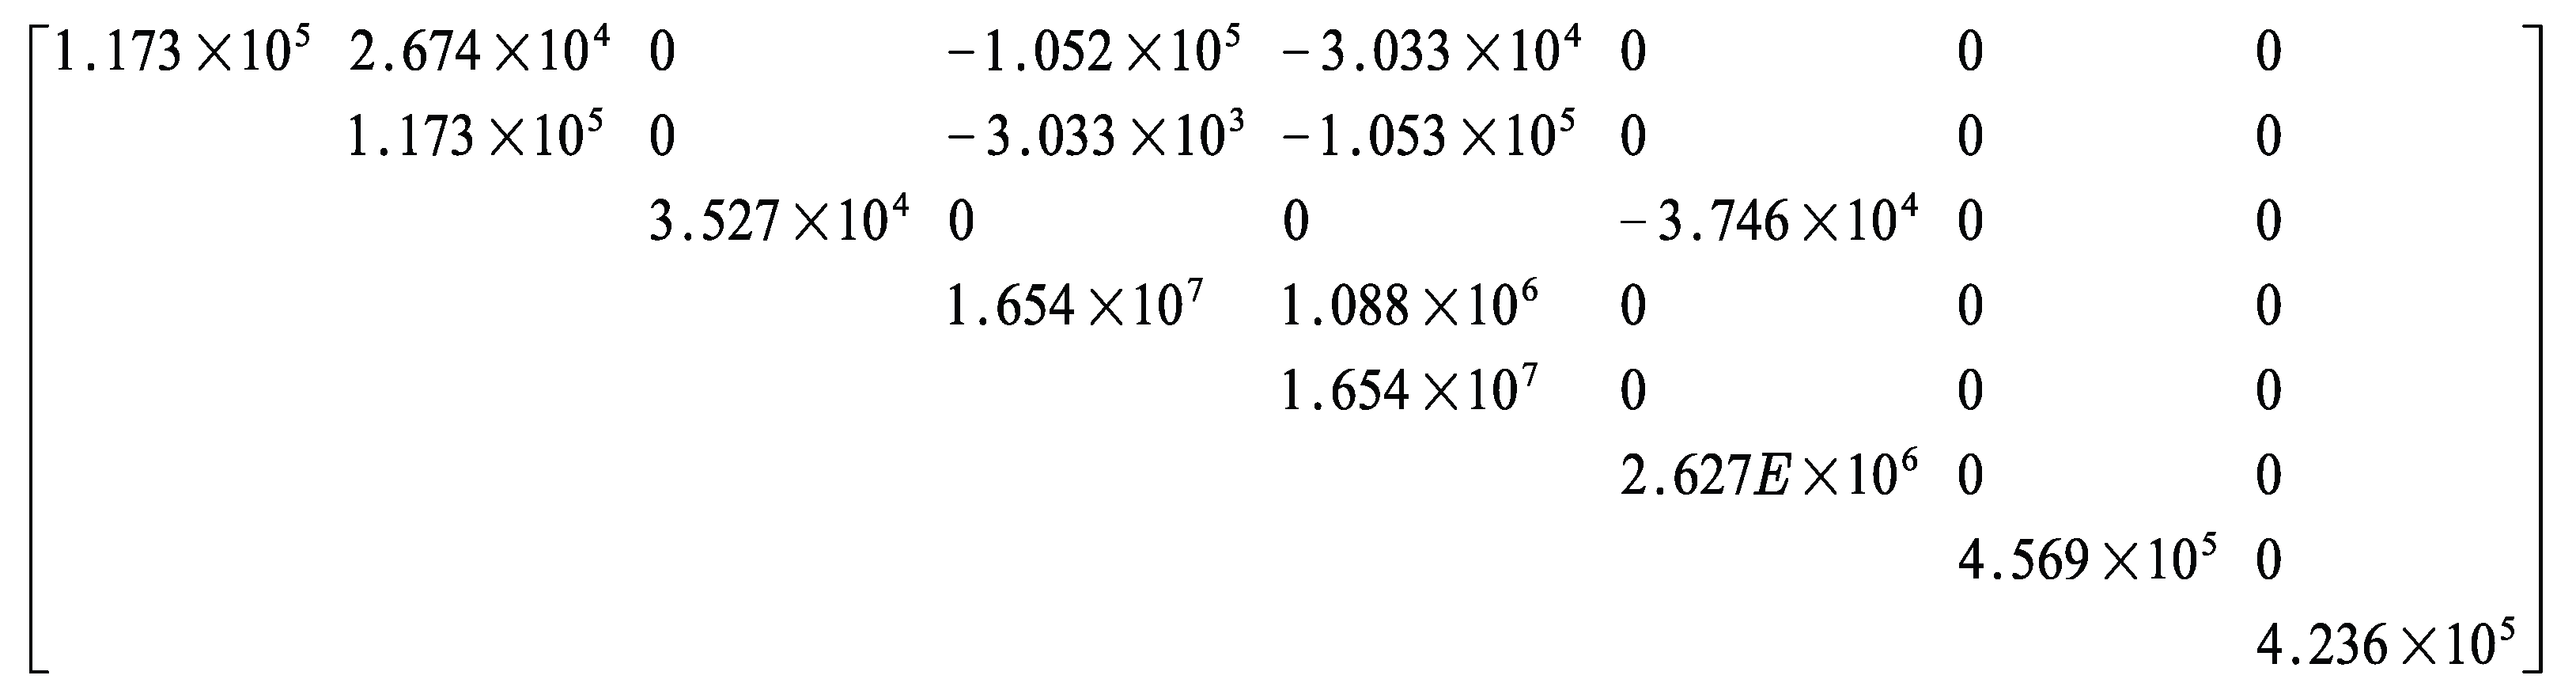
Figure 9.
Boundary condition configurations for rectangular composite sandwich panels under in-plane loading: (a) Case 1: CSFF, (b) Case 2: CCFF, (c) Case 3: SSSS, and (d) Case 4: CCSS.
Figure 9.
Boundary condition configurations for rectangular composite sandwich panels under in-plane loading: (a) Case 1: CSFF, (b) Case 2: CCFF, (c) Case 3: SSSS, and (d) Case 4: CCSS.
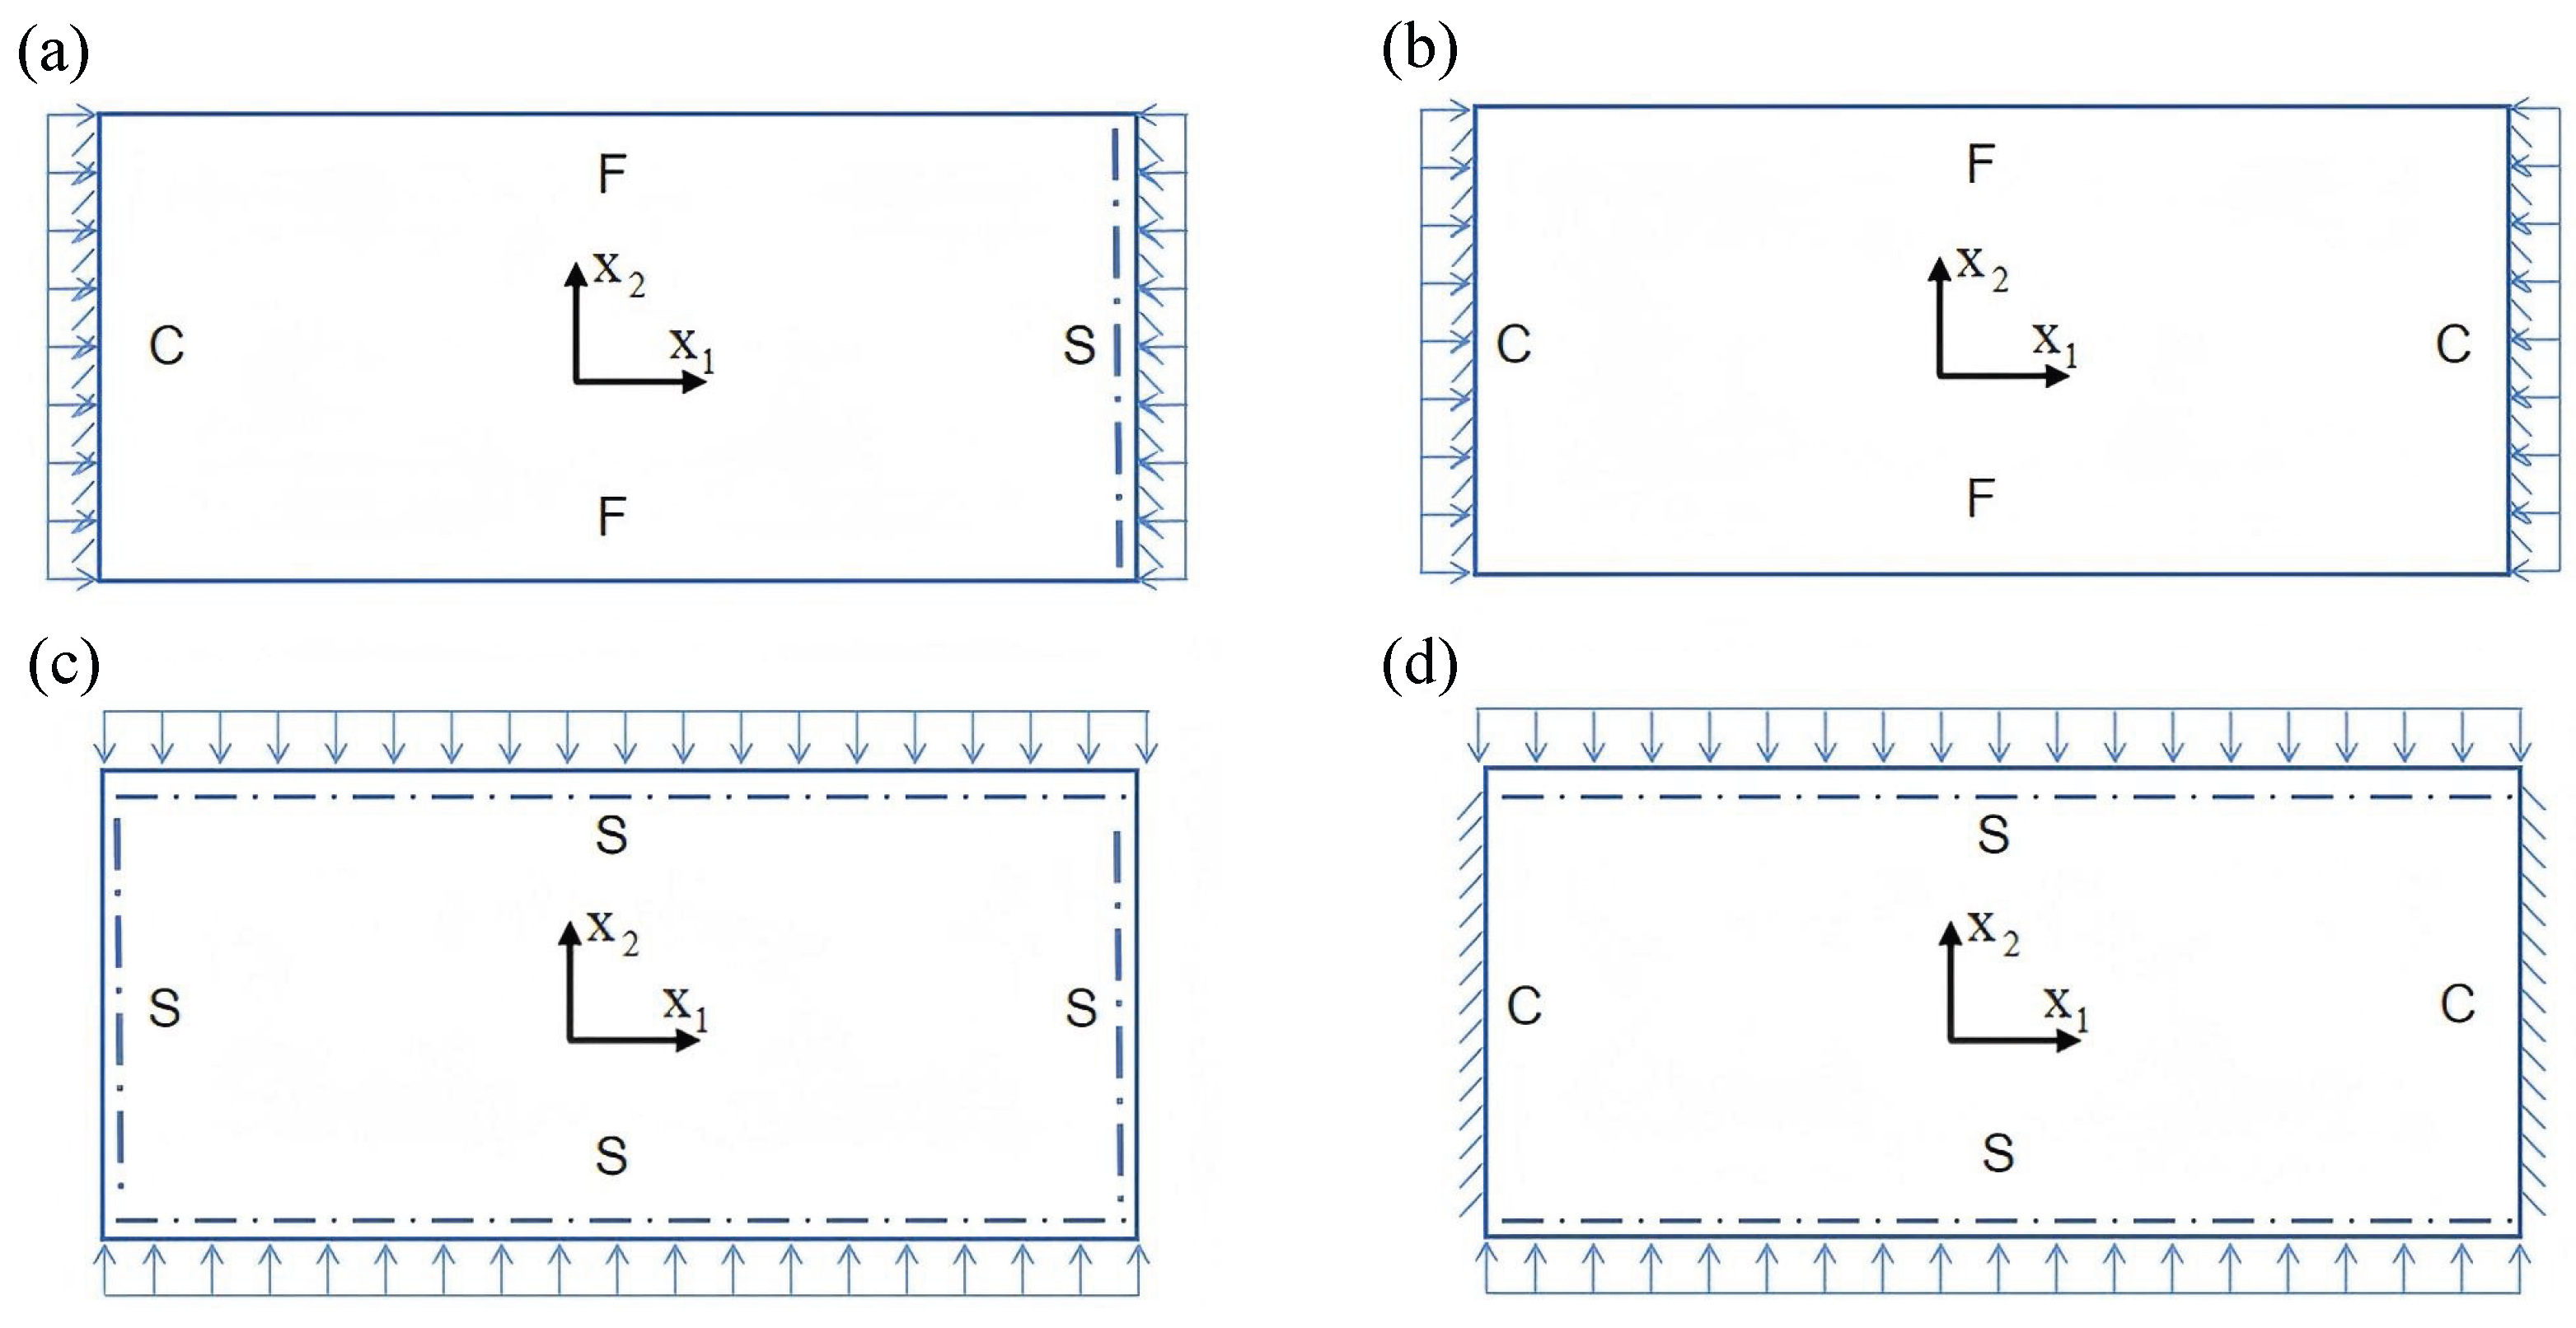
Figure 10.
Comparison of the first four buckling loads predicted by 2D-EPM and 3D-FEM under (a) Case 1: CSFF, (b) Case 2: CCFF, (c) Case 3: SSSS, and (d) Csae 4: CCSS.
Figure 10.
Comparison of the first four buckling loads predicted by 2D-EPM and 3D-FEM under (a) Case 1: CSFF, (b) Case 2: CCFF, (c) Case 3: SSSS, and (d) Csae 4: CCSS.
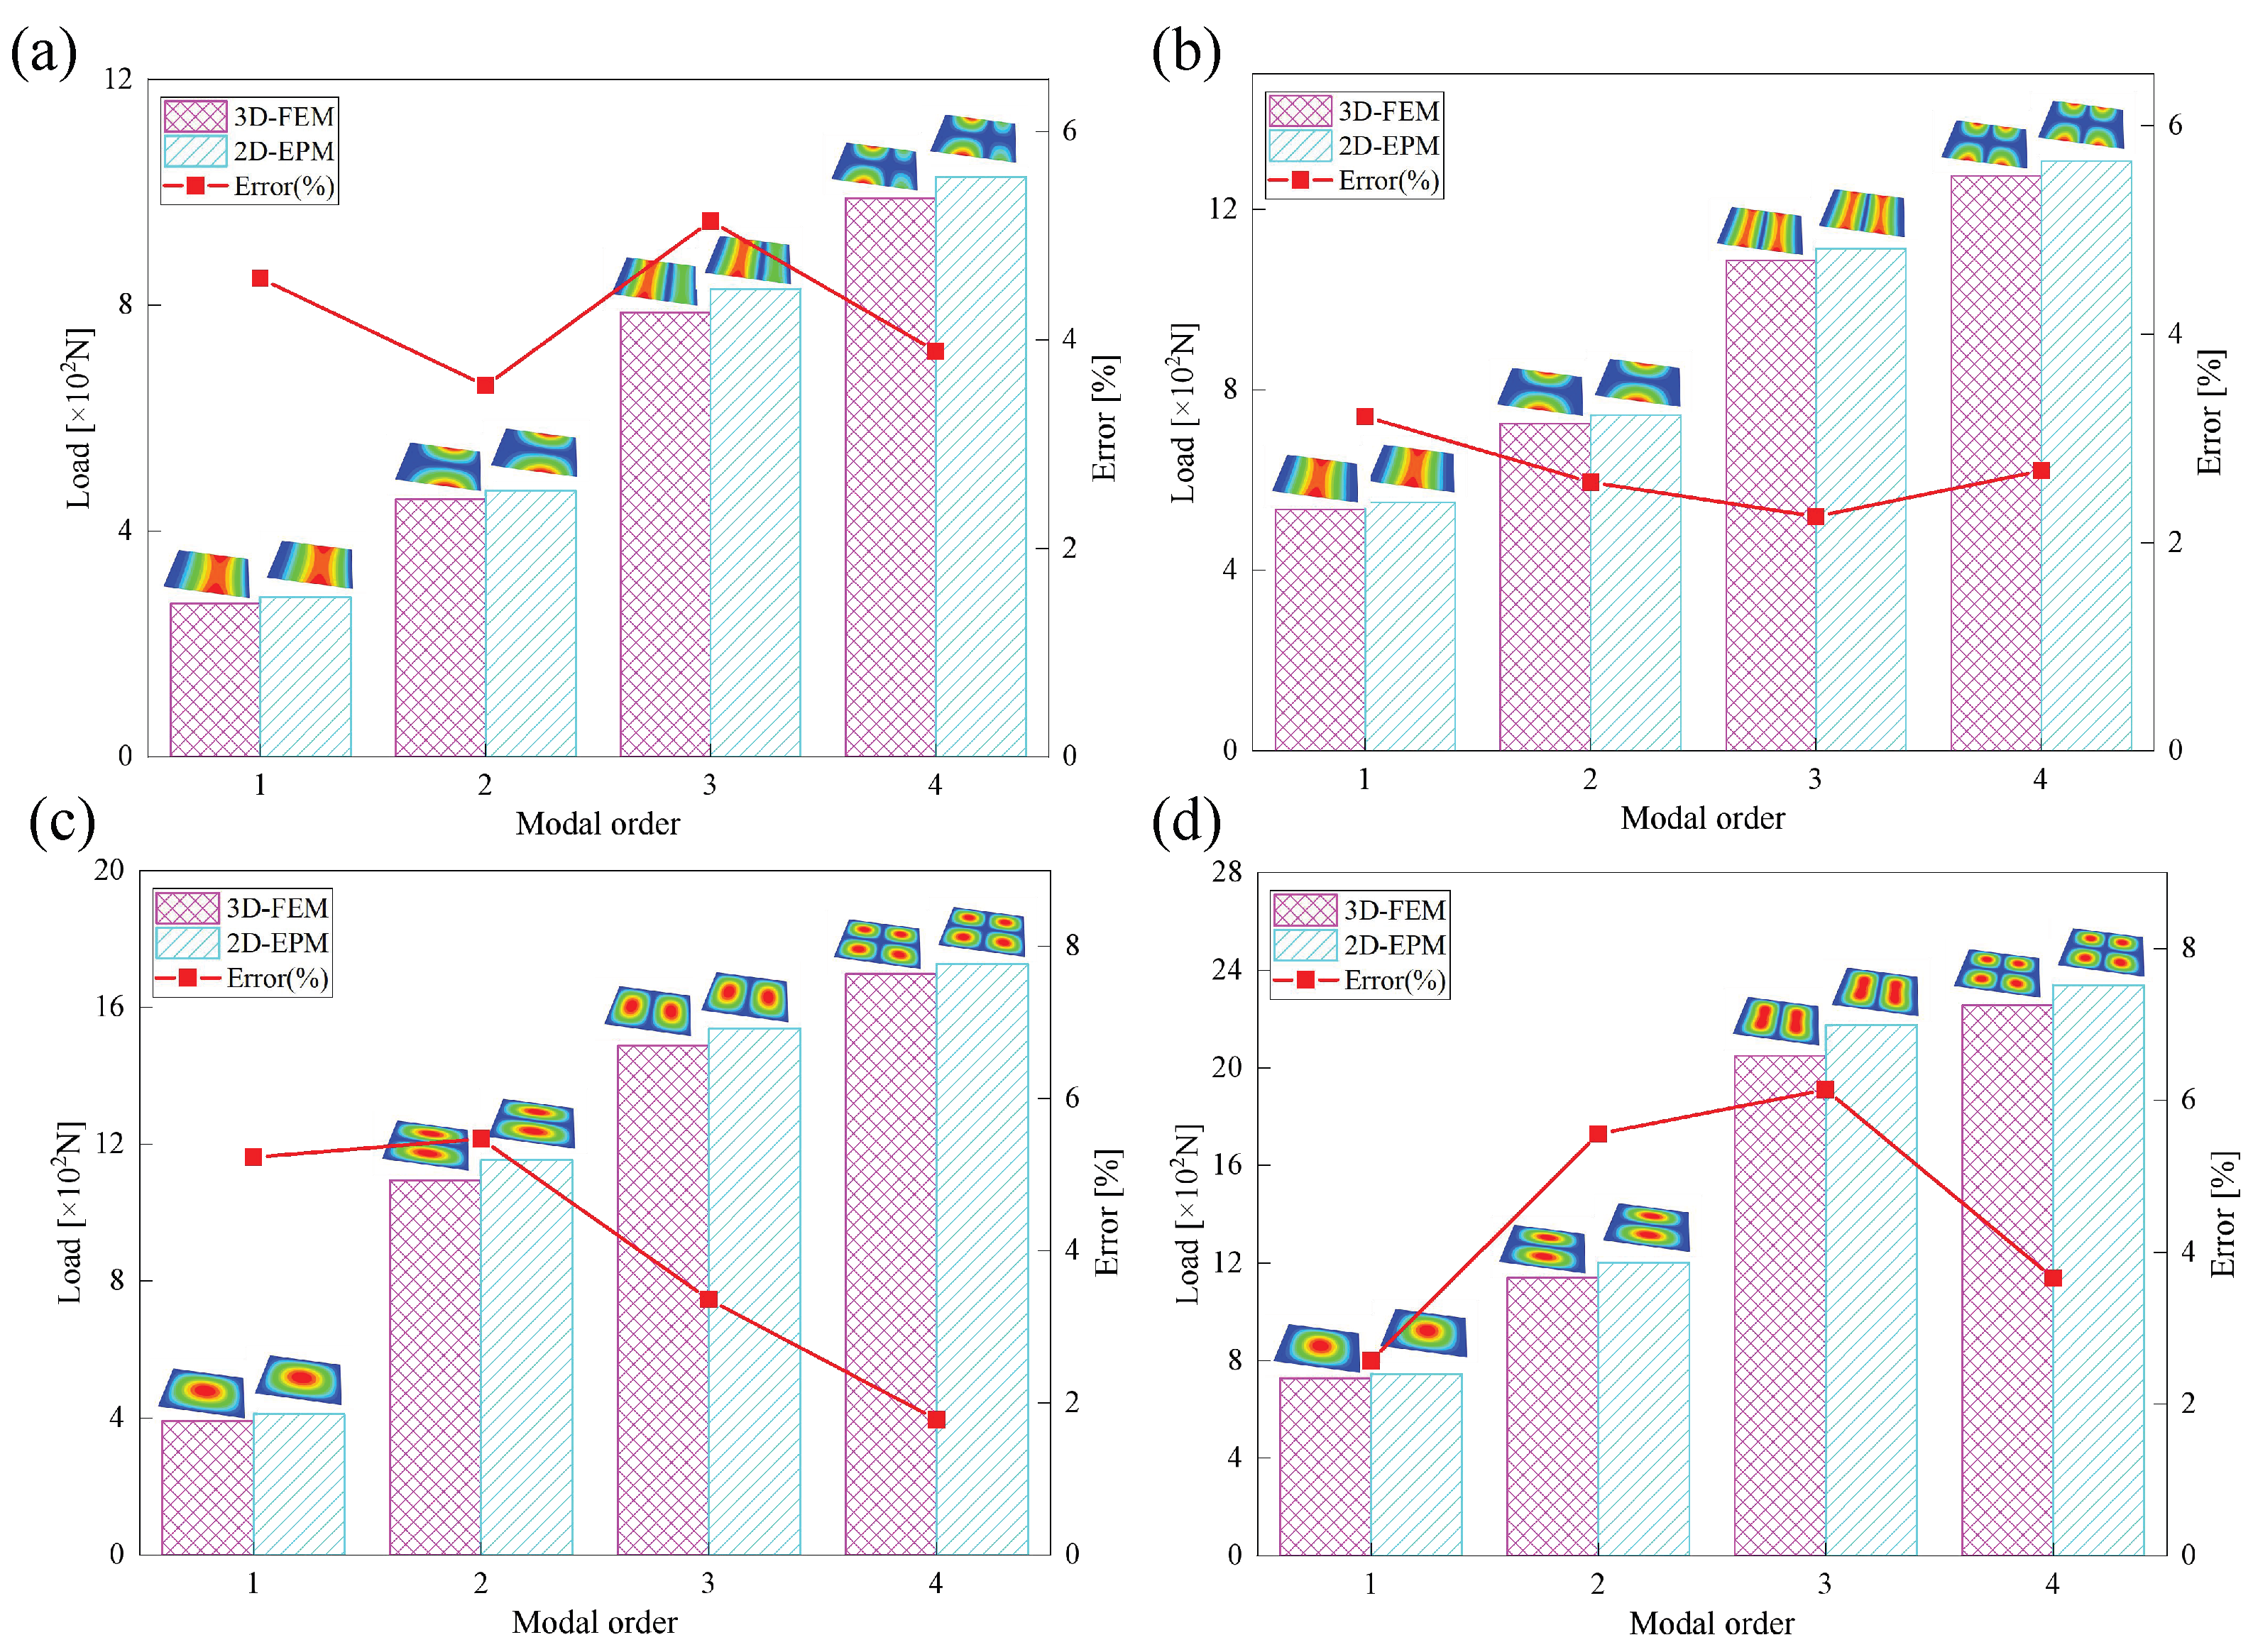
Figure 11.
Four typical boundary conditions for out-of-plane bending analysis of SP-EHC under a uniform load of 100 kPa: (a) Case 5: CCCC, (b) Case 6: CCCF, (c) Case 7: CCFF, and (d) Csae 8: SSFF.
Figure 11.
Four typical boundary conditions for out-of-plane bending analysis of SP-EHC under a uniform load of 100 kPa: (a) Case 5: CCCC, (b) Case 6: CCCF, (c) Case 7: CCFF, and (d) Csae 8: SSFF.
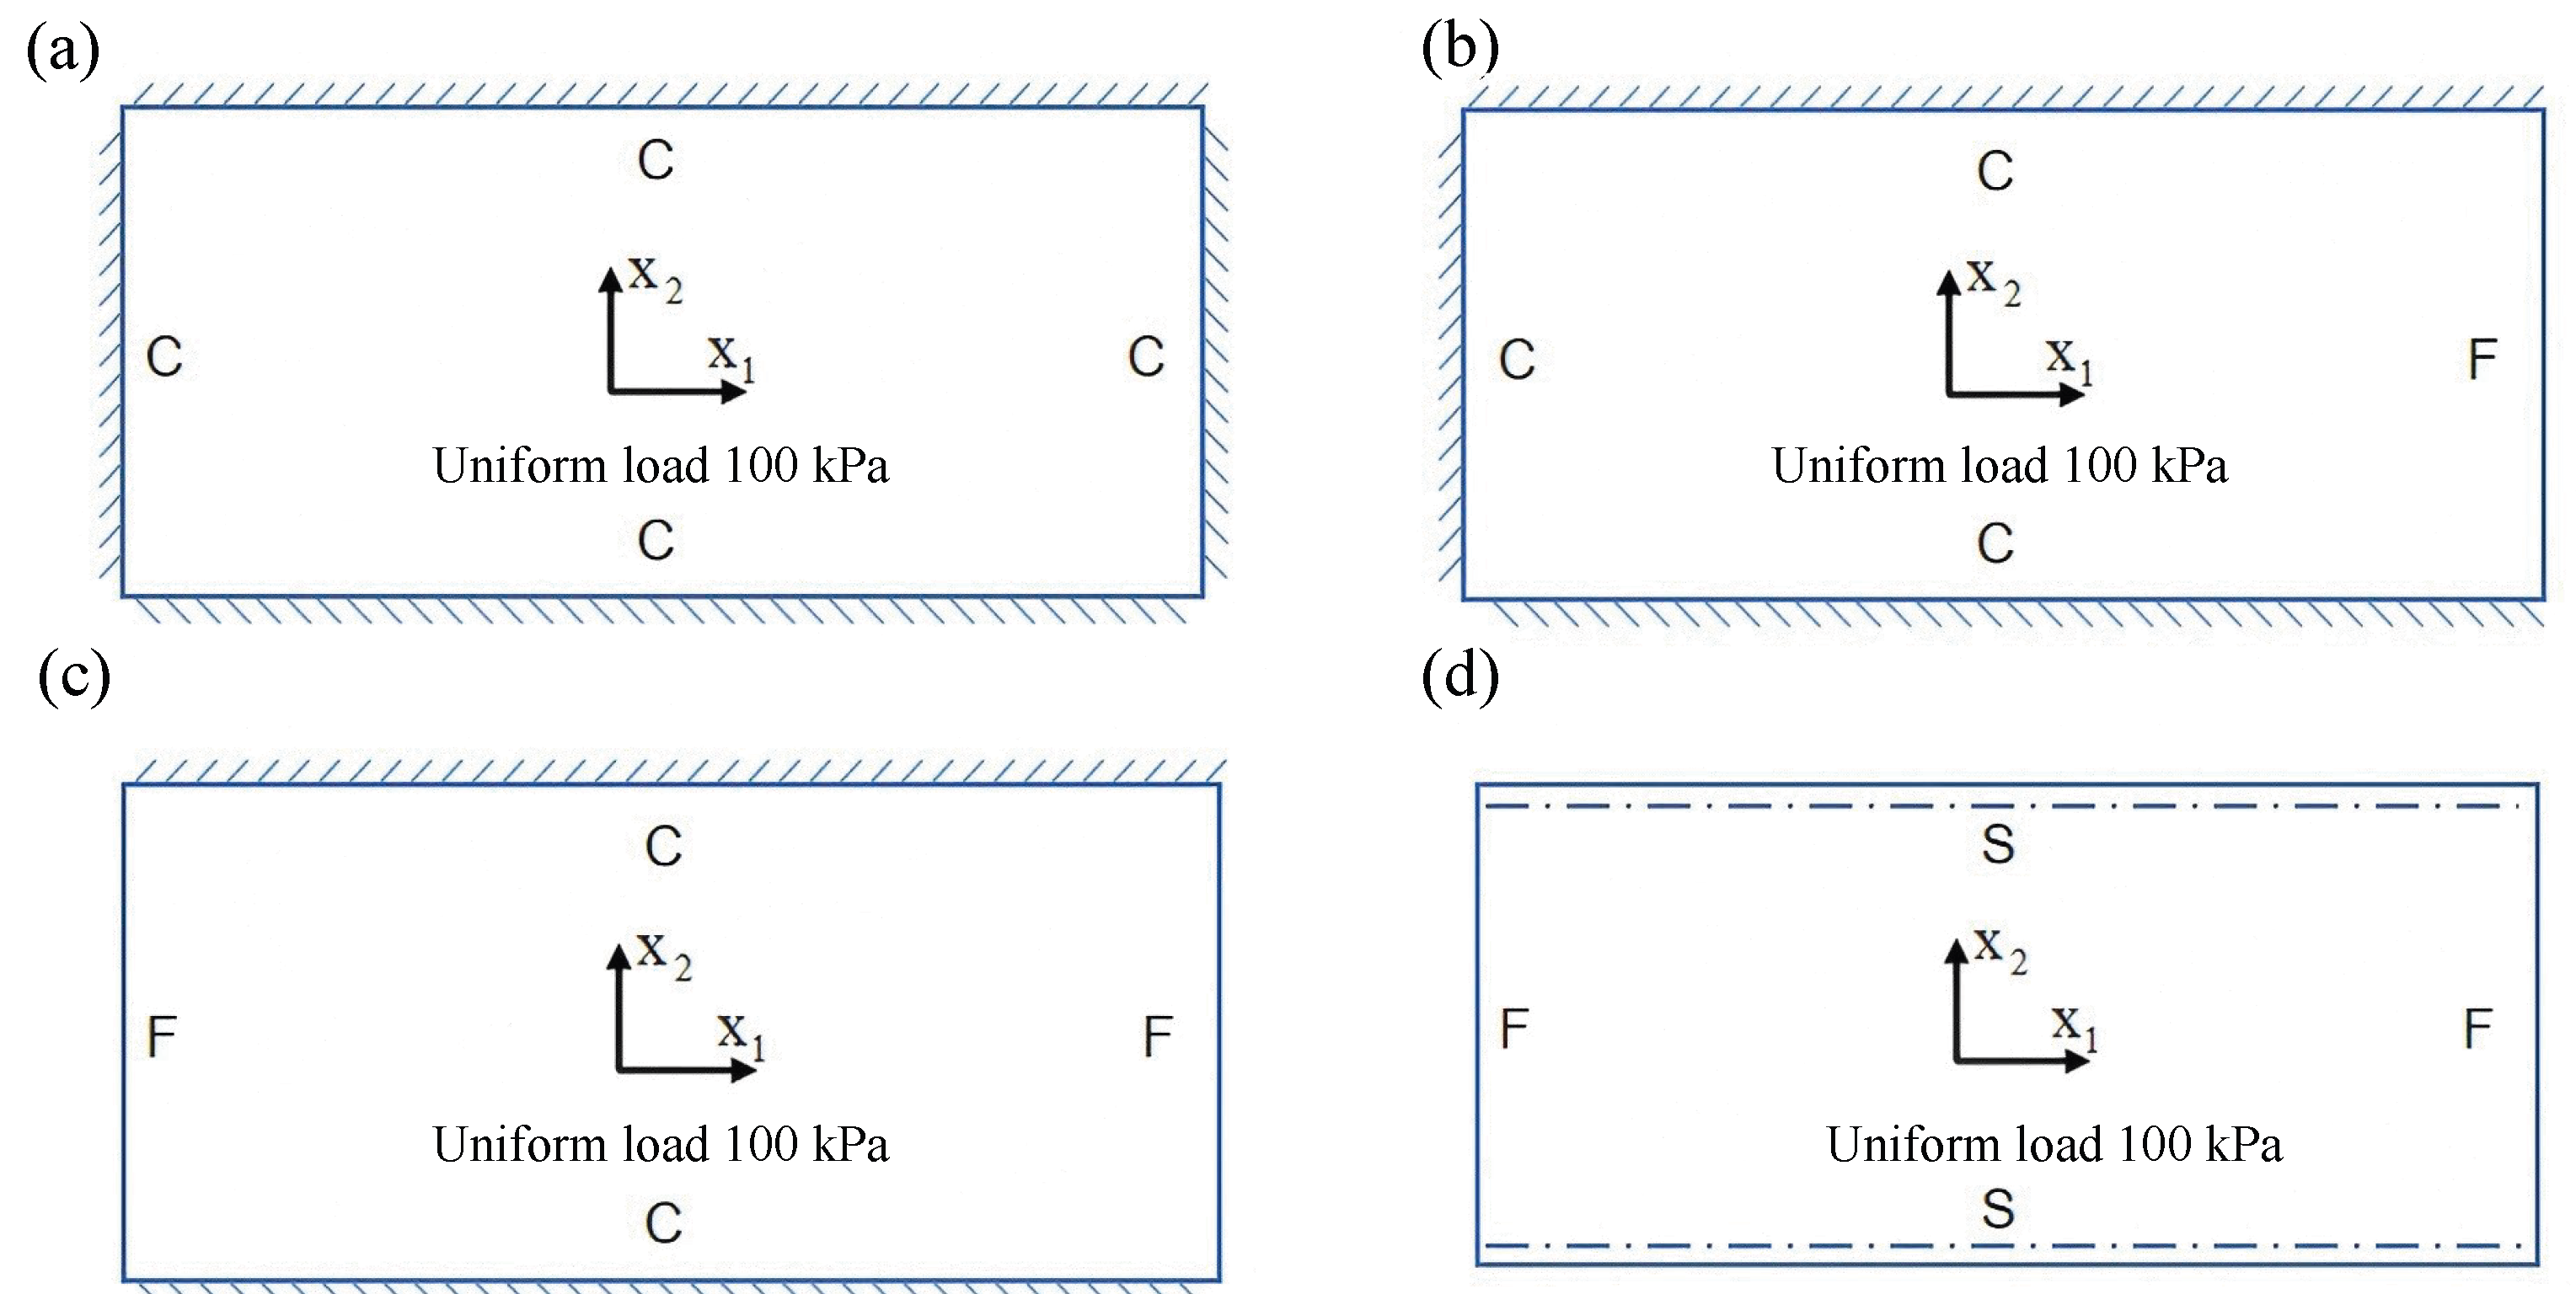
Figure 12.
Definition of typical displacement extraction paths for deformation analysis. (a) Path 1 is aligned along the longitudinal midline of the sandwich panel, (b) Path 2 is set along the diagonal of the panel.
Figure 12.
Definition of typical displacement extraction paths for deformation analysis. (a) Path 1 is aligned along the longitudinal midline of the sandwich panel, (b) Path 2 is set along the diagonal of the panel.
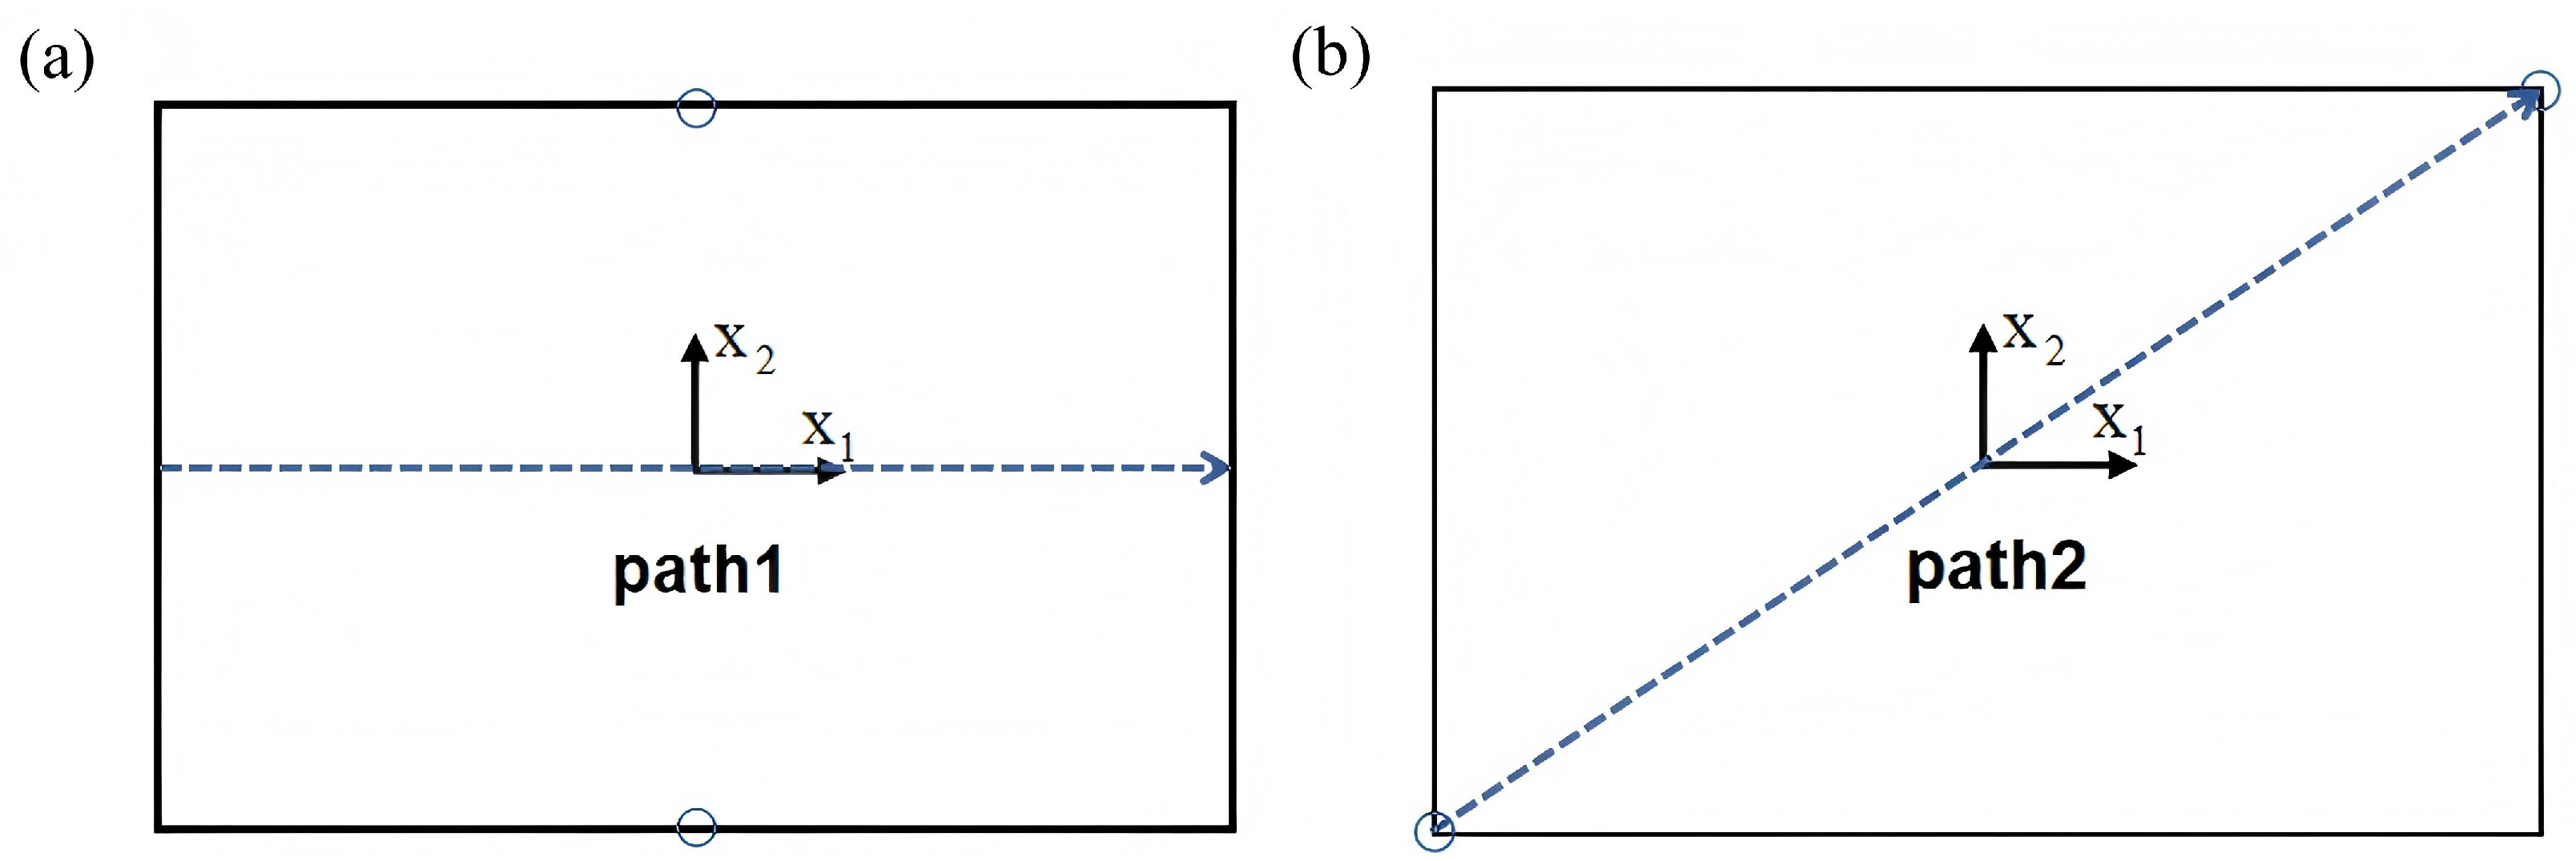
Figure 13.
Comparison of displacement-path curves of 3D-FEM and 2D-EPM under different cases: (a) Case 5, (b) Case 6, (c) Case 7, and (d) Case 8.
Figure 13.
Comparison of displacement-path curves of 3D-FEM and 2D-EPM under different cases: (a) Case 5, (b) Case 6, (c) Case 7, and (d) Case 8.
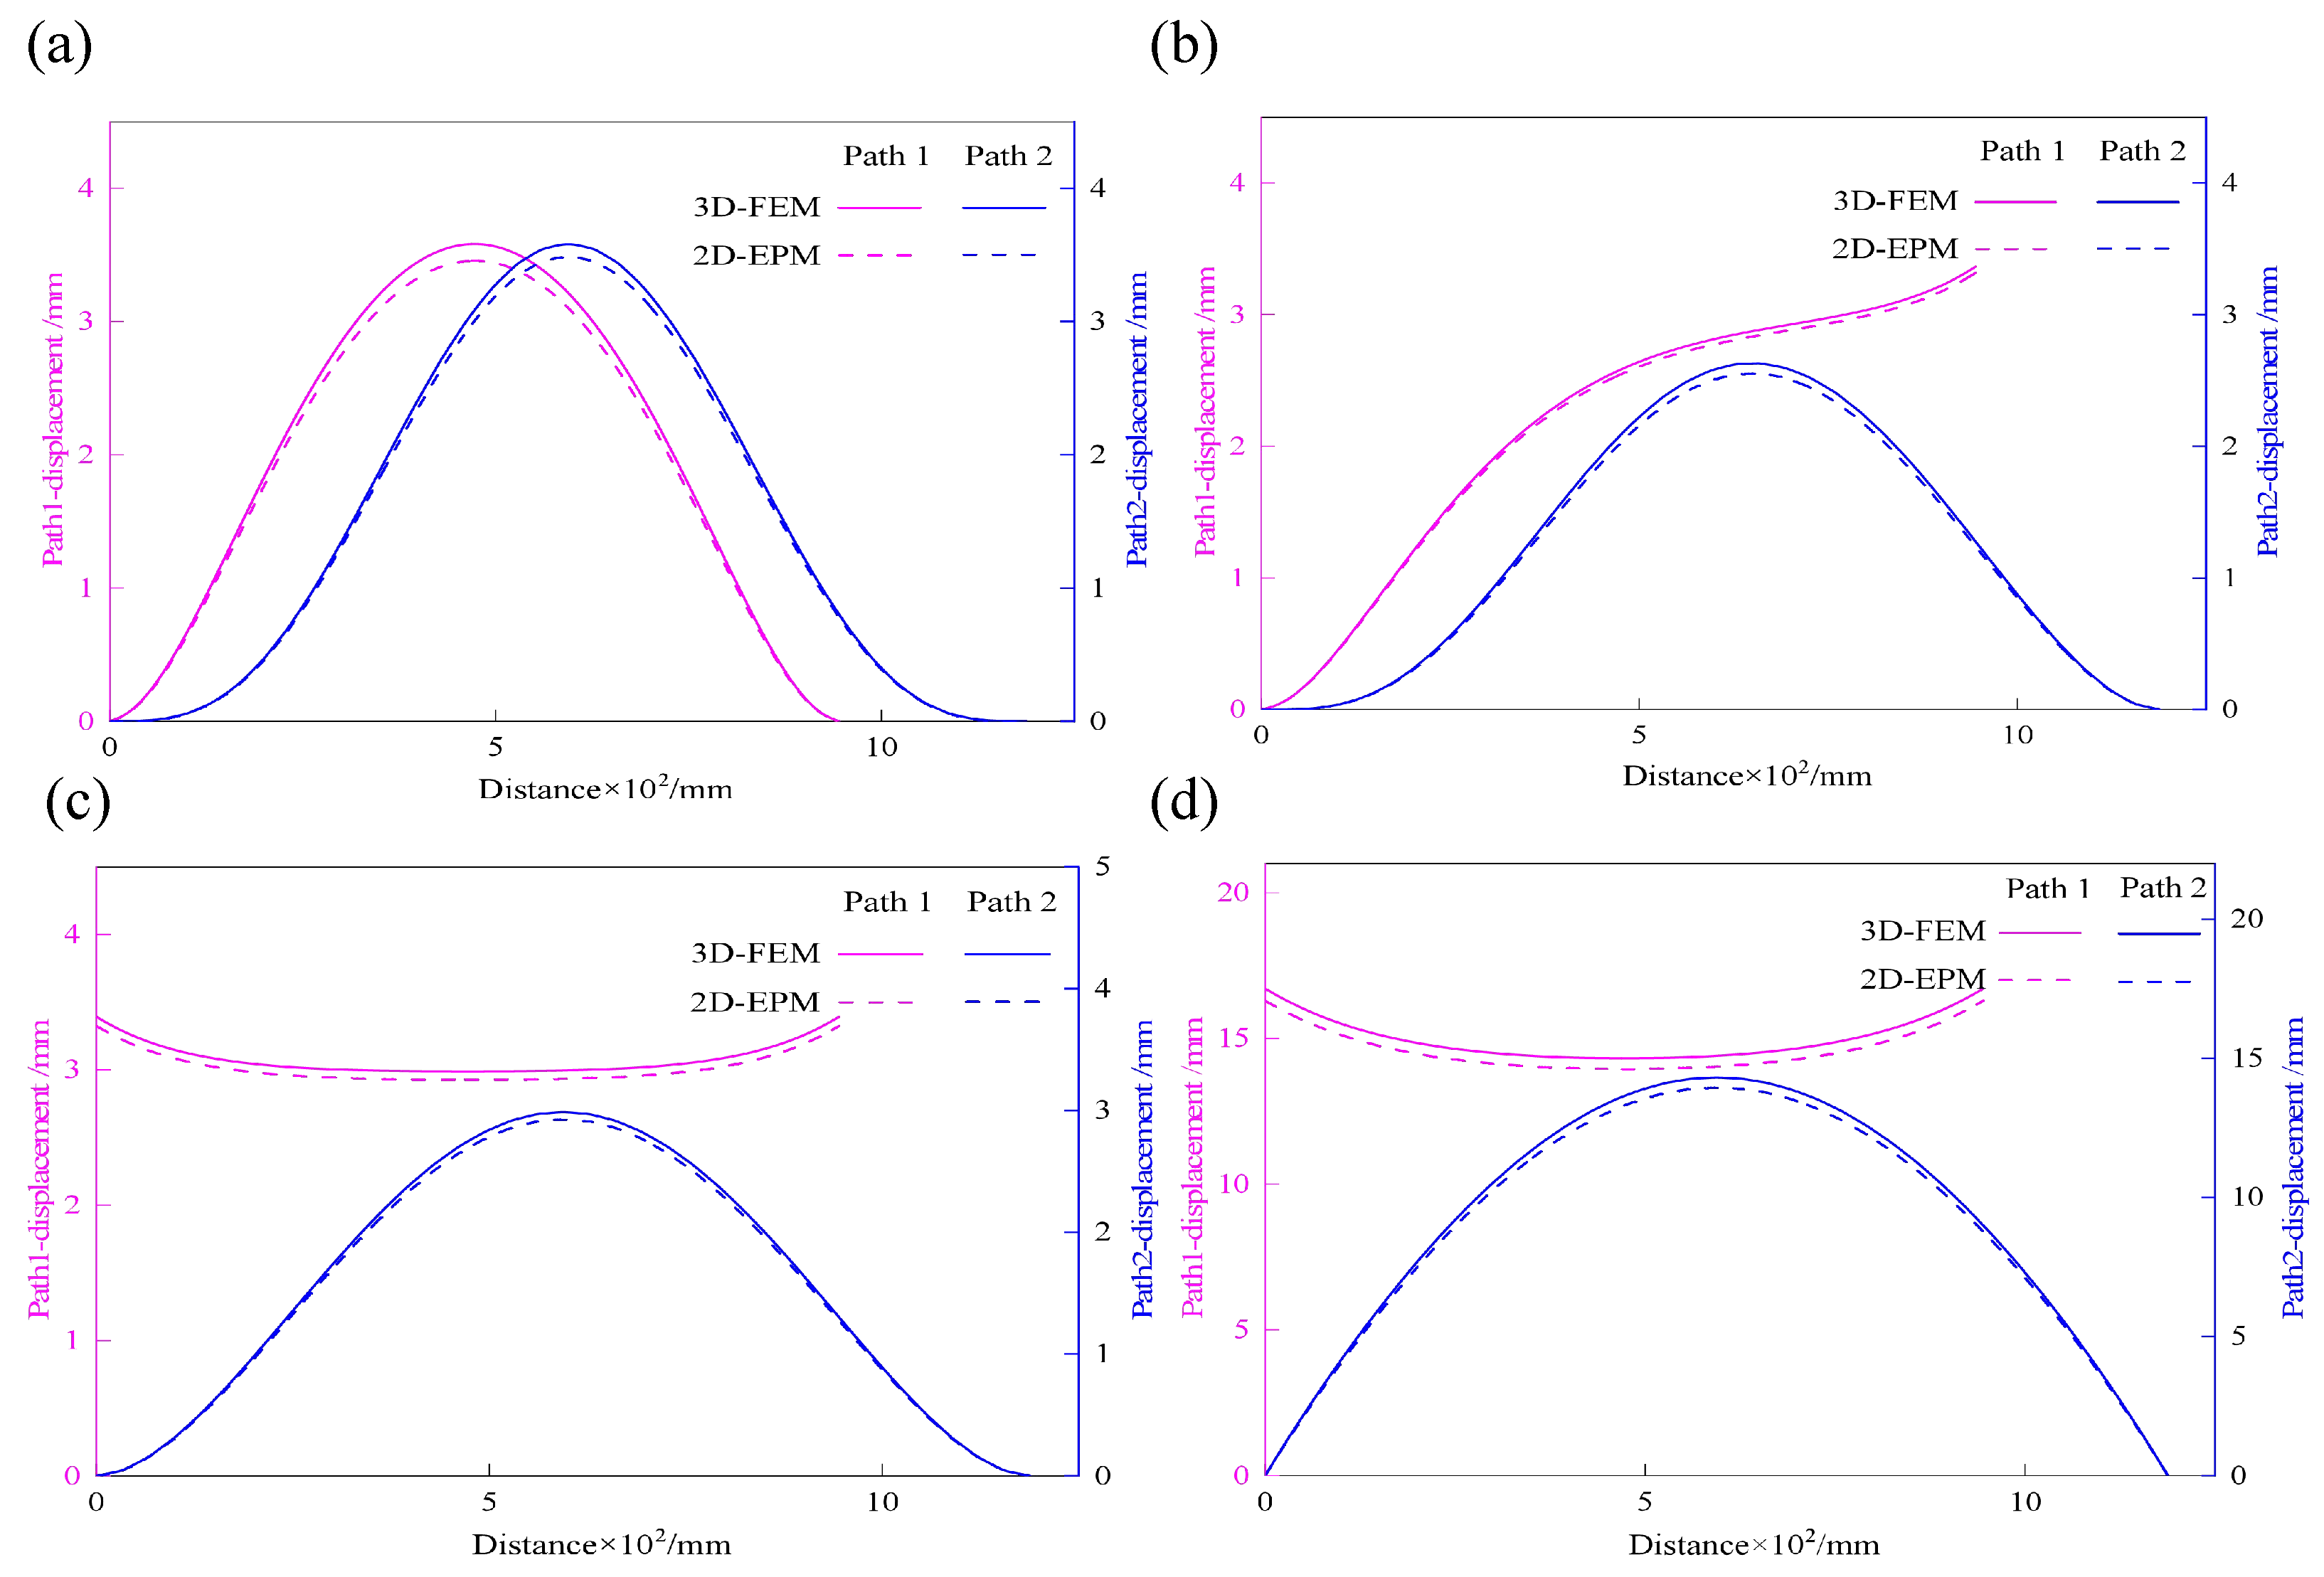
Figure 14.
Schematic diagram of initial deformation in (a) and (b) directions.
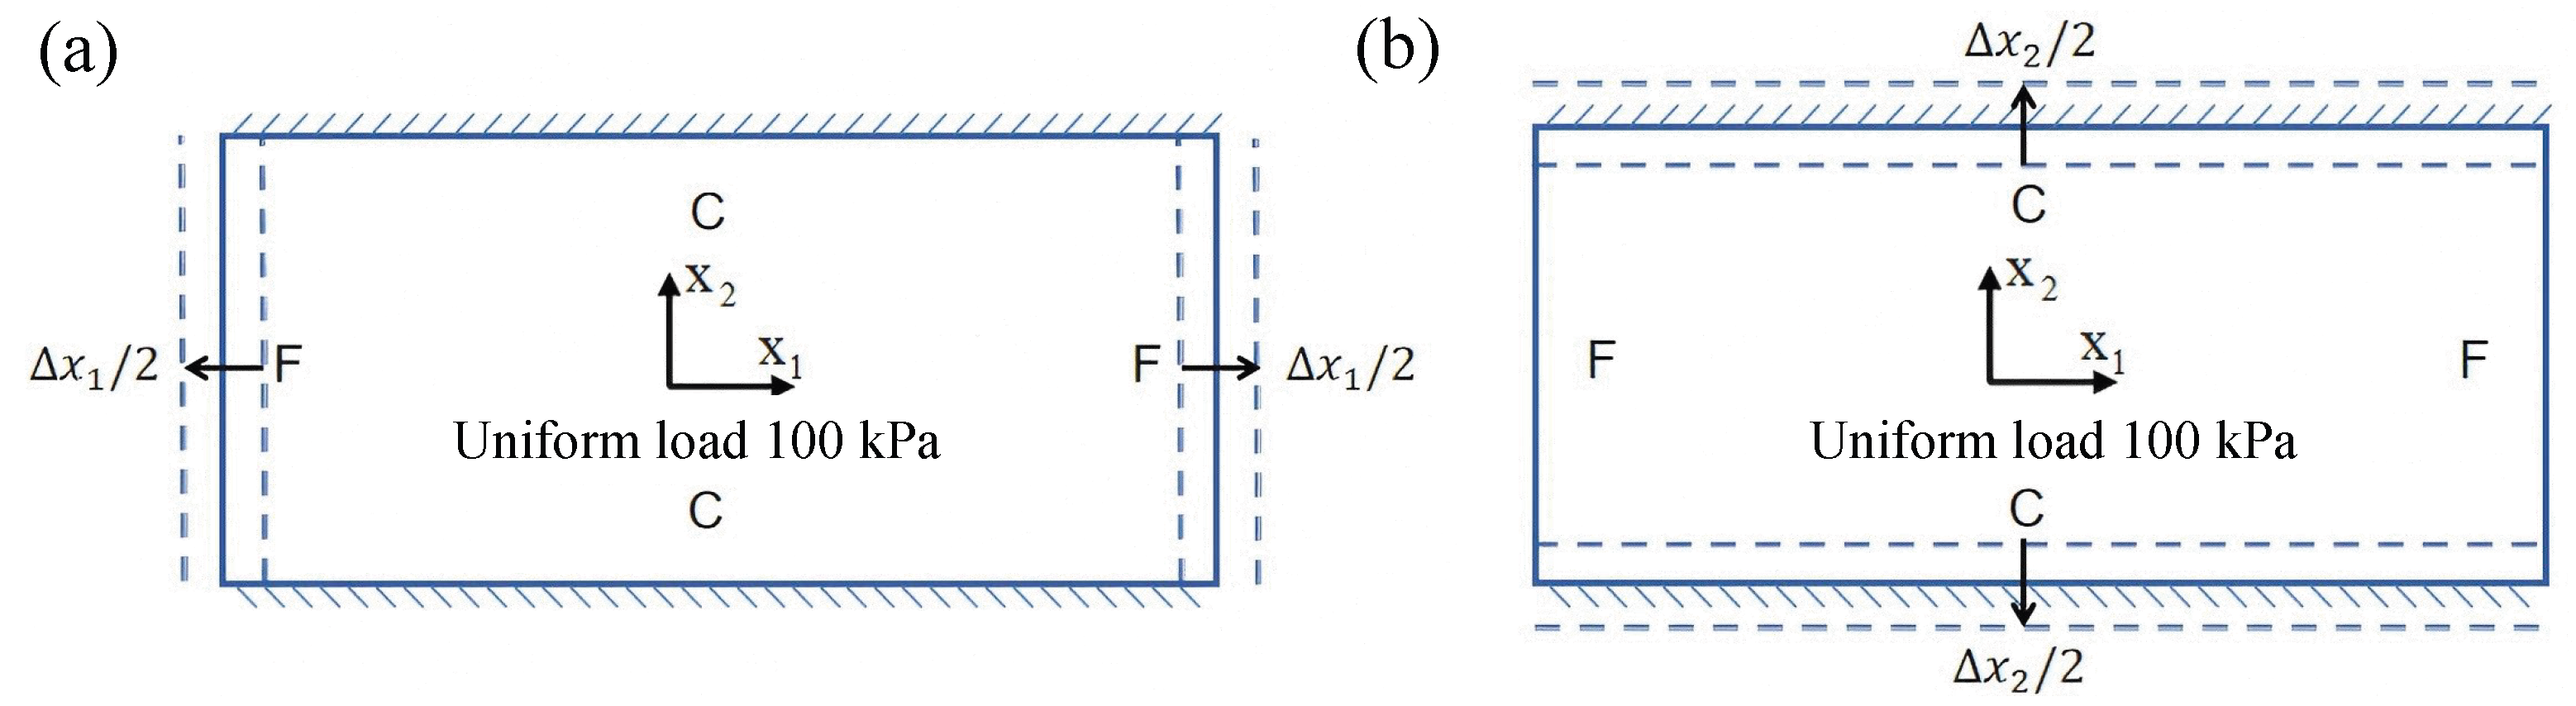
Figure 15.
Effect of initial deformation along the direction on the displacement of SP-EHC under out-of-plane loads and CCFF boundary conditions: (a) , (b) , (c) , and (d) U.
Figure 15.
Effect of initial deformation along the direction on the displacement of SP-EHC under out-of-plane loads and CCFF boundary conditions: (a) , (b) , (c) , and (d) U.
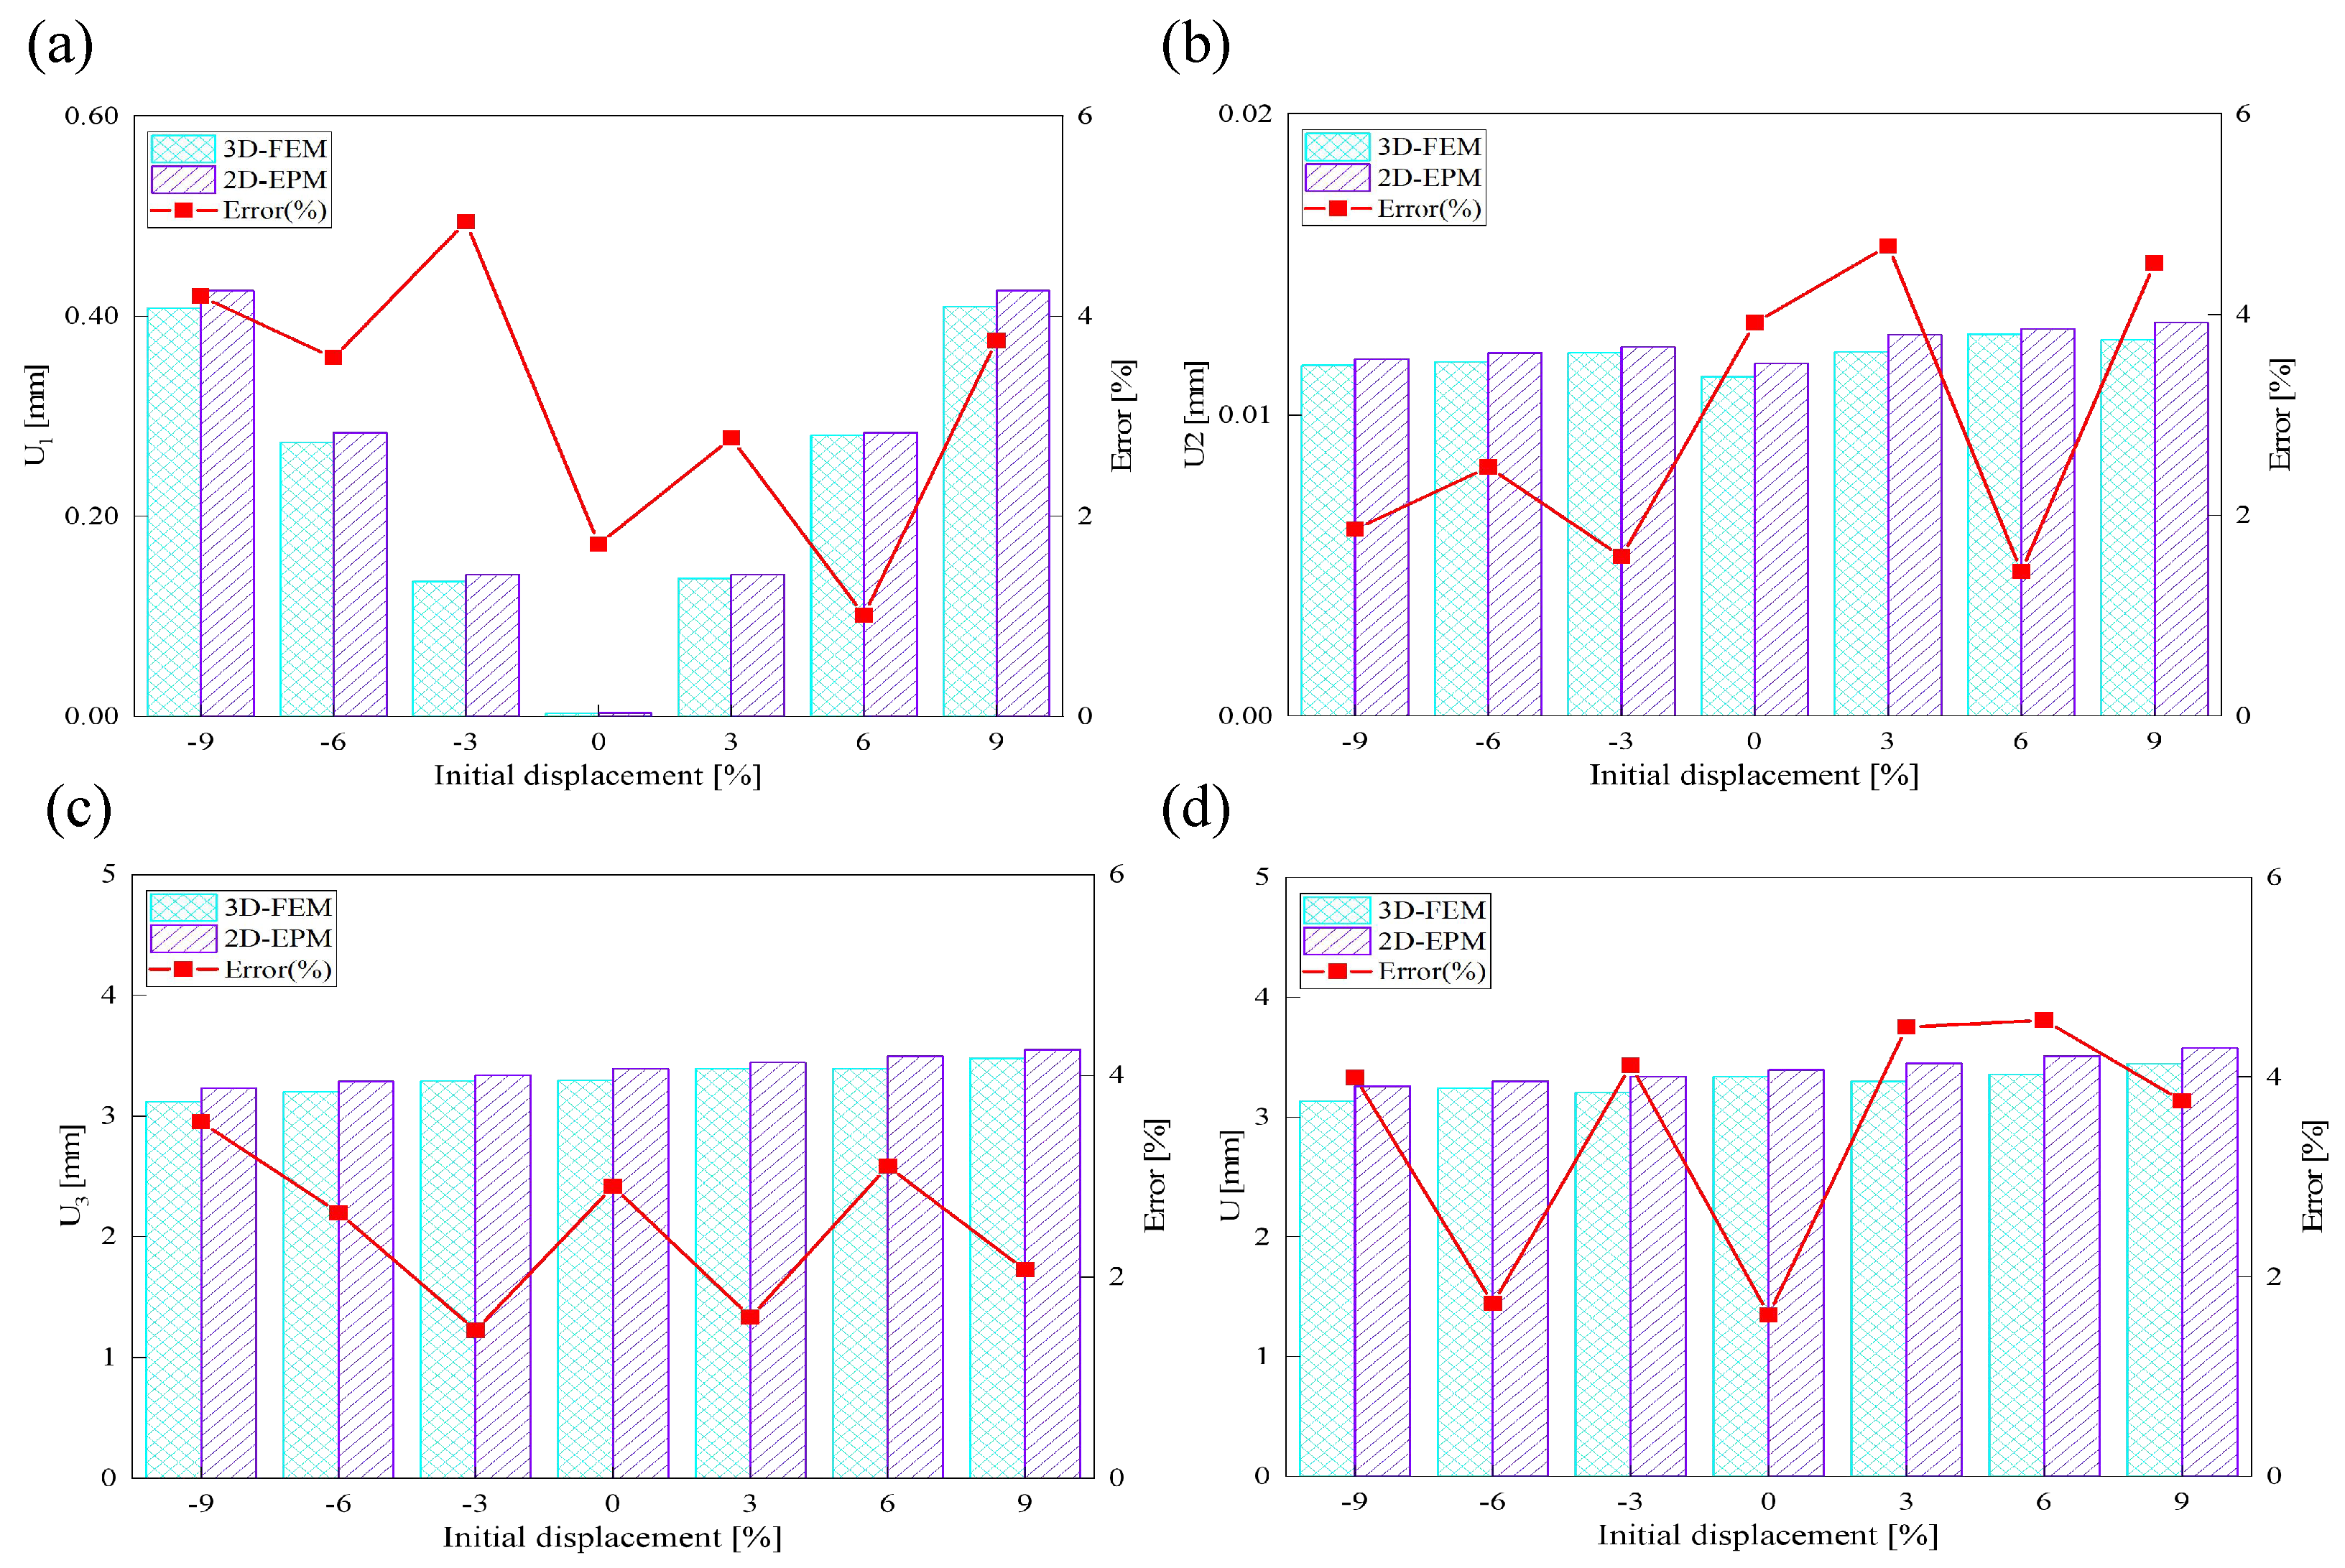
Figure 16.
Effect of initial deformation along the direction on the displacement of SP-EHC under out-of-plane loads and CCFF boundary conditions: (a) , (b) , (c) , and (d) U.
Figure 16.
Effect of initial deformation along the direction on the displacement of SP-EHC under out-of-plane loads and CCFF boundary conditions: (a) , (b) , (c) , and (d) U.
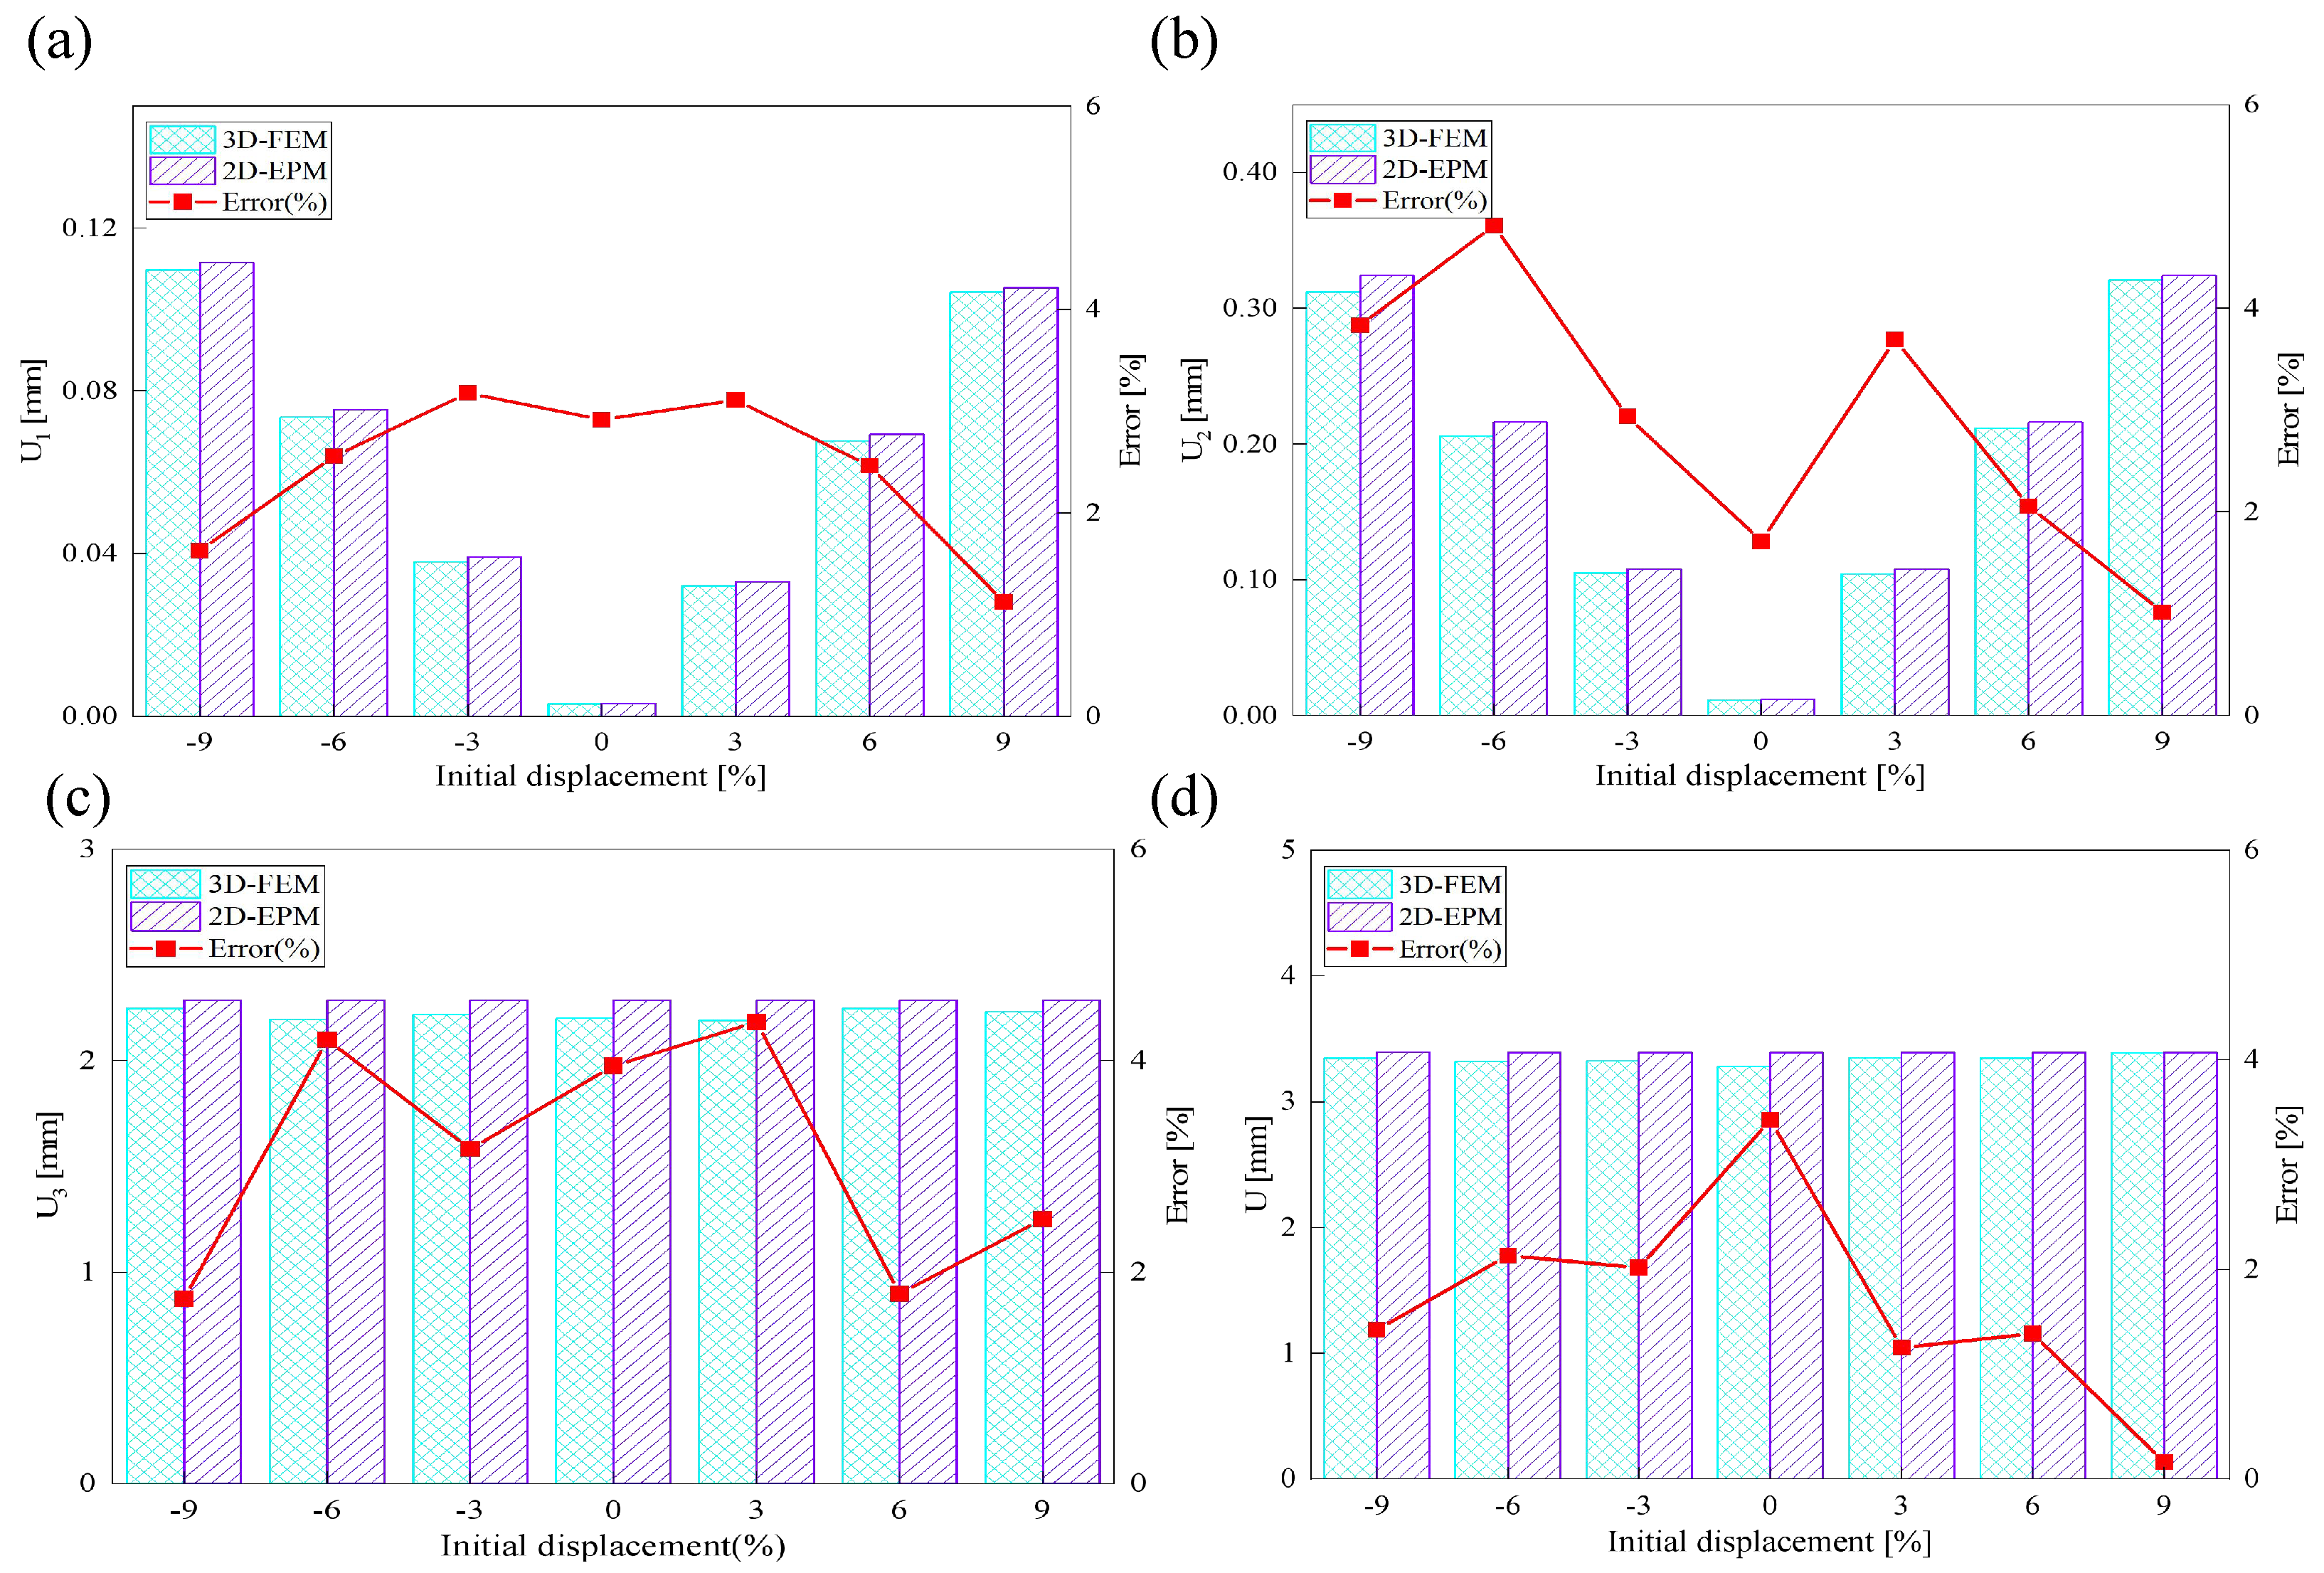

Table 1.
Geometric parameters of unit cell and sandwich panels.
| Model | Unit cell | Sandwich panel | ||||||
| Parameter | (mm) | (mm) | (mm) | (mm) | (mm) | (mm) | L (mm) | W (mm) |
| Value | 8 | 8 | 20 | 2 | 6 | 45 | 360 | 180 |
Table 2.
Fiber/Matrix/Aluminum metal material parameters.
| Material Parameters | Symbol / Unit | Carbon Fiber | Epoxy Resin | Aluminum |
|---|---|---|---|---|
| Elastic Modulus | / GPa | 100 | 4.5 | 70 |
| / GPa | 8.4 | 4.5 | ||
| Shear Modulus | / GPa | 4 | 1.7 | 27 |
| / GPa | 3.5 | 1.7 | ||
| Poisson’s Ratio | 0.1 | 0.38 | ||
| 0.25 | 0.38 | 0.3 | ||
| 0.25 | 0.38 | |||
| Density | / g·cm−3 | 1.81 | 1.6 | 2.7 |
Table 3.
Comparison of buckling modes and critical bucklinf loads under different boundaries predicted by 3D-FEM and 2D-EPM.
Table 3.
Comparison of buckling modes and critical bucklinf loads under different boundaries predicted by 3D-FEM and 2D-EPM.
| Case | Case 1 | Case 2 | Case 3 | Case 4 |
|---|---|---|---|---|
| 3D-FEM | 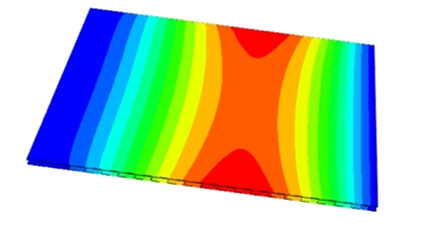 |
 |
 |
 |
| 270.63 N | 533.95 N | 391.00 N | 411.45 N | |
| 2D-EPM | 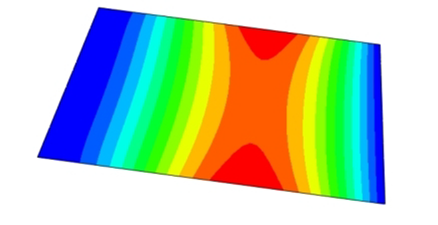 |
 |
 |
 |
| 283.05 N | 551.09 N | 727.10 N | 745.79 N | |
| Error | 4.59% | 3.21% | 5.23% | 2.57% |
Table 4.
Comparison of displacement clouds predicted by 3D-FEM and 2D-EPM under different boundaries (unit: mm).
Table 4.
Comparison of displacement clouds predicted by 3D-FEM and 2D-EPM under different boundaries (unit: mm).
| Case | Case 5 | Case 6 | Case 7 | Case 8 |
|---|---|---|---|---|
| 3D-FEM | 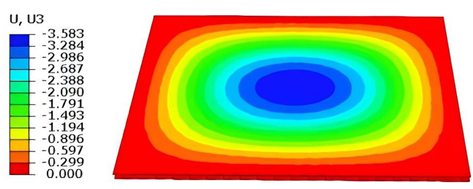 |
 |
 |
 |
| 2D-EPM | 0.2 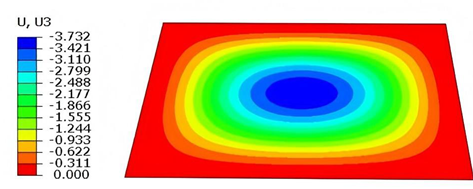
|
0.2 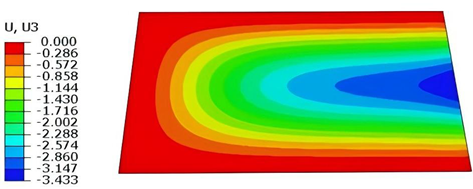
|
 |
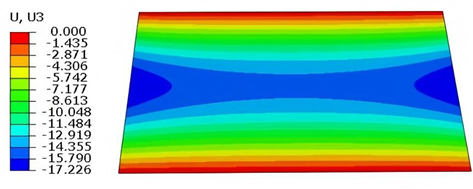 |
| Error | 2.22% | 2.05% | 4.15% | 3.09% |
Table 5.
Comparison of local stress field distribution predicted by 3D-FEM and 2D-EPM in Case 3.
| Models | |||
|---|---|---|---|
| 3D-FEM | 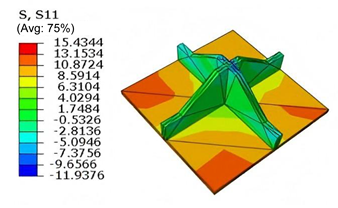 |
 |
 |
| MPa | MPa | MPa | |
| 2D-EPM | 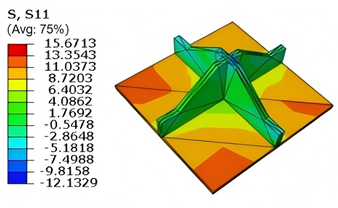 |
 |
 |
| MPa | MPa | MPa | |
| Max. Error | 1.536% | 1.641% | 1.534% |
| Models | |||
| 3D-FEM | 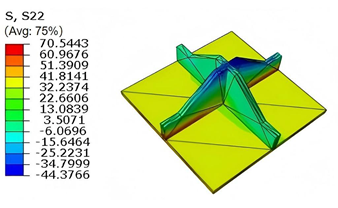 |
 |
 |
| MPa | MPa | MPa | |
| 2D-EPM | 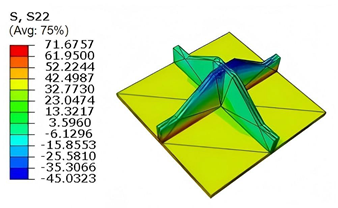 |
 |
 |
| MPa | MPa | MPa | |
| Max. Error | 1.610% | 1.380% | 1.552% |
Table 6.
Comparison of local displacement field predicted by 3D-FEM and 2D-EPM in Case 3.
| Models | |||
|---|---|---|---|
| 3D-FEM | 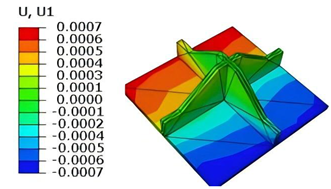 |
 |
 |
| mm | mm | mm | |
| 2D-EPM | 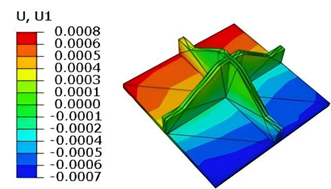 |
 |
 |
| mm | mm | mm | |
| Max. Error | 2.703% | 1.701% | 1.488% |
Table 7.
Comparison of local stress field distribution predicted by 3D-FEM and 2D-EPM in Case 3 with initial displacement of 9%.
Table 7.
Comparison of local stress field distribution predicted by 3D-FEM and 2D-EPM in Case 3 with initial displacement of 9%.
| Models | |||
|---|---|---|---|
| 3D-FEM | 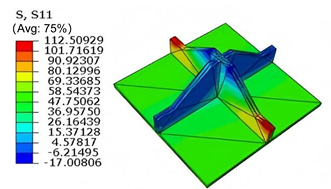 |
 |
 |
| MPa | MPa | MPa | |
| 2D-EPM | 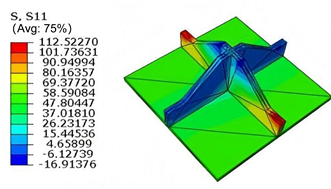 |
 |
 |
| MPa | MPa | MPa | |
| Max. Error | 0.552% | 0.863% | 0.068% |
| Models | |||
| 3D-FEM | 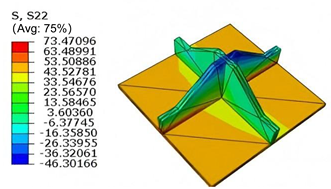 |
 |
 |
| MPa | MPa | MPa | |
| 2D-EPM |  |
 |
 |
| MPa | MPa | MPa | |
| Max. Error | 2.409% | 2.252% | 0.703% |
Table 8.
Comparison of local displacement field distribution predicted by 3D-FEM and 2D-EPM in Case 3 with initial displacement of 9%.
Table 8.
Comparison of local displacement field distribution predicted by 3D-FEM and 2D-EPM in Case 3 with initial displacement of 9%.
| Models | |||
|---|---|---|---|
| 3D-FEM | 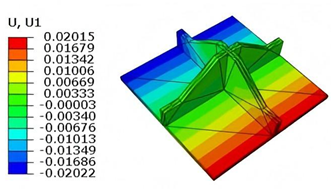 |
 |
 |
| mm | mm | mm | |
| 2D-EPM | 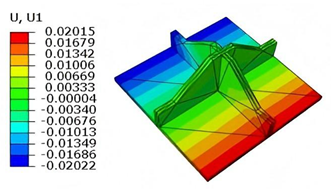 |
 |
 |
| mm | mm | mm | |
| Max. Error | 0.005% | 2.539% | 2.422% |
Disclaimer/Publisher’s Note: The statements, opinions and data contained in all publications are solely those of the individual author(s) and contributor(s) and not of MDPI and/or the editor(s). MDPI and/or the editor(s) disclaim responsibility for any injury to people or property resulting from any ideas, methods, instructions or products referred to in the content. |
© 2025 by the authors. Licensee MDPI, Basel, Switzerland. This article is an open access article distributed under the terms and conditions of the Creative Commons Attribution (CC BY) license (http://creativecommons.org/licenses/by/4.0/).
Copyright: This open access article is published under a Creative Commons CC BY 4.0 license, which permit the free download, distribution, and reuse, provided that the author and preprint are cited in any reuse.


