
Submitted:
21 July 2025
Posted:
22 July 2025
You are already at the latest version
Abstract
The type of dietary fat may affect blood lipids or/and obesity, leading to various diseases. Hyperlipidemia is an increase in total cholesterol (TC), low-density lipoproteins (LDL-C), triglycerides (TG), or all of them. Objective: This study aimed to investigate the effect of milk ghee (MG) and hydrogenated palm oil (HPO) on plasma lipids and white adipose tissue as an obesity indicator in rats. Method: Twelve male albino rats were divided into two groups, each group fed on a diet containing different fats for eight weeks. Plasma TC, high-density lipoproteins (HDL-C), VLDL-C&LDL-C and TG were analyzed. White adi-pose tissues were investigated. Results: Results showed that rats fed HPO had signifi-cantly higher levels of HDL-C than rats fed MG (56.33 and 51.66 mg/dl) respectively. The MG group had significantly high levels of TC, LDL-C, and TG (86.4, 34.73, and 56.20 mg/dl), and the HPO group recorded (81.14, 24.80, and 47.13 mg/dl). Rats fed HPO have a significant decrease in white adipose tissue weight than the MG group, and a small size of adipose cells. Conclusion: The consumption of hydrogenated palm oil could have a bene-ficial impact on improving plasma lipids and obesity instead of milk ghee.
Keywords:
adipose tissue
; hydrogenated palm oil
; milk ghee
; obesity
; plasma lipids
1. Introduction
The leading cause of death in the world is coronary heart disease, and hypercholesterolemia is known as an important risk factor for coronary heart disease [1]. Hyperlipidemia play a role in the development of atherosclerosis and are a very serious factor for heart diseases, strokes, and peripheral vascular diseases [2]. Hyperlipidemia reflects to increased levels of blood total cholesterol (TC), low-density lipoproteins (LDL-C), triglycerides (TG), low levels of high-density lipoprotein (HDL-C), or a combination of these three indicators [3]. Obesity was classified as a disease by the World Health Organization in 1948, and then in 2013, it was classified as a disease by many medical associations and countries [4]. Obesity is a chronic, progressive, and treatable behavioral disorder with multiple factors. The increase in body fat leads to dysfunction in adipose tissue and problems in the body and movement, resulting in metabolic, psychological, and social health consequences. The Body Mass Index (BMI) is a good indicator for some patients, but the precise diagnosis of obesity involves anthropometric assessments such as body fat percentage, visceral fat, and waist circumference [5].
The type of dietary fat or oil may affect obesity or some indicators of atherosclerosis, such as it is impact on blood lipids. Low-density lipoproteins (LDL) and very low-density lipoproteins (VLDL) are affected by the type of dietary fats consumed. These lipoproteins play a very important role in the body as they are the main carriers of cholesterol and triglycerides in the blood [6]. Consuming milk fat raises blood cholesterol levels. Feeding rats a diet rich in milk fat caused an increase in blood cholesterol levels, which may lead to a higher likelihood of developing heart and vascular diseases [7]. In addition to a study indicating that the consumption of 5% to 10% of milk fat causes weight gain [8]. Modern margarine products low in trans fatty acids may be classified as functional foods because they contain plant sterols, which have been found to lower cholesterol levels [9]. The consumption of rapeseed oil improved liver steatosis, liver enzymes, insulin resistance, fasting blood glucose, plasma total cholesterol, and anthropometric measurements among individuals without alcohol-related fatty liver, compared to those consuming milk ghee [10]. No significant changes were observed in blood indicators when feeding rats a high-fat diet containing milk ghee, hydrogenated oil, or vegetable oil. However, the hydrogenated oil group had the highest levels of cholesterol and blood glucose. Additionally, a greater amount of lipids droplets were in the liver of the groups fed hydrogenated oil or vegetable oil [11]. The effect of oils and fats on blood lipids and obesity is based on their differences in chemical composition, especially the type of fatty acids they contain. Conjugated linoleic acid may positively affect obesity, atherosclerosis, and some types of cancer [12]. Palmitic acid has a lowering effect on blood and liver triglycerides [13]. Stearic acid may slightly reduce total cholesterol to HDL-C compared to palmitic and myristic acids, and stearic acid has a more positive effect compared to trans fatty acids [14]. There are no significant differences between diets rich in stearic acid, oleic acid, or linoleic acid on blood lipids [15]. Feeding mice with oleic acid-enriched soybean oil led to a reduction in the development of atherosclerosis in LDL receptor knock-out mice independently of changes in plasma lipids compared to regular soybean oil [16]. Oils or fats that contain medium-chain fatty acids did not affect total cholesterol, LDL-C, or HDL-C but led to a slight increase in triglycerides [17]. Indicators of oxidative stress and liver inflammation decreased in mice fed a diet rich in myristic acid compared to mice fed a regular diet. However, prolonged consumption of myristic acid may exacerbate insulin resistance associated with obesity by increasing inflammation in adipose tissue and increased secretion of resistin [18].
Food manufacturers have turned to the hydrogenation technique to solidify vegetable oils and extend their shelf life [19]. Recently, the substitution of milk fat to hydrogenated palm oil in food manufacturers and at the household for cooking has become more widespread. The market for hydrogenated oil reached 686.76 million USD in value in 2022 and expected to reach 993.93 million USD in readjusted terms by 2030 (The Brainy Insights, 2023).
In the Kingdom of Saudi Arabia, the import and use of partially hydrogenated oils have been banned since January 2020, while the import and use of fully hydrogenated oils have been permitted for food factories, restaurants, and others. This was due to the fact that partially hydrogenated oils contain trans fatty acids. Partially hydrogenated oils contain trans fatty acids ranging from 10-60%. In contrast, fully hydrogenated oils have hydrogen added to all double bonds in the oil, with the absence of trans fatty acids [20]. It is well known that trans fatty acids cause many health problems, such as lowering the ratio of HDL to LDL, affecting fat metabolism, weakening endothelial cell functions, and increasing the risk of heart disease and atherosclerosis [21]. Hydrogenated oils have been used in the food industry since the 1960s due to their functional properties on food products, such as plasticity and improved emulsification. This type of fat is also characterized by reducing production costs for many products like bakery products, snacks, and various fatty food products [22].
Hydrogenated palm oil and milk ghee have different chemical compositions, and this difference may affect their metabolism, which in turn impacts certain health indicators. Therefore, this study aimed to compare the effects of hydrogenated palm oil and milk ghee on plasma lipids and white adipose tissues (as an indicator of obesity) by feeding experimental rats diets containing one of these two types.
2. Materials and Methods
Fully hydrogenated palm oil was purchased from the local market, while ghee was prepared by melting butter and heating it until ghee was formed.
Chemical analysis of oils and fats:
The fatty acid profile was analyzed using GC technique according to AOAC-996.01 method [23]. The fat-soluble vitamins (K, E, D, and A) were estimated using a spectrophotometer according to the method described in [24,25]. The β-carotene pigment soluble in fat was estimated using a spectrophotometric method as described in [26,27]. Iodine value and saponification value were determined by titration methods as [28] describe. Acid value and peroxidase value were determined by titration methods as described in [29].
The experiment was conducted in the animal experimentation laboratory (temperature 20°C, humidity 40%) at the College of Agricultural and Food Sciences, King Faisal University.
Twelve male albino rats, four weeks old and weighing 80 to 100 grams, were equally divided into two groups. Each group was fed a standard diet for one week (acclimatization). Then, one group was fed a high-fat diet (80% standard diet with 20% milk fat), while the other group was fed a diet containing 80% standard diet and 20% hydrogenated palm oil for eight weeks, with open access to food and water. Diet components (Table 1) were created in accordance with (Abd El-Gawad), with an adjustment of fat proportion [30]. All the rats were weighed at the beginning of the first week and at the end of the eighth week to calculate the body mass index (BMI) and the percentage of the body weight gain (%BWG). A blood sample was taken from each rat before starting the first week and after the end of the eighth week. At the end of the experiment, after the eighth week, the rats were dissected to obtain the organs (heart, spleen, kidneys, and liver), weighed, and a part of the liver was preserved in saline solution (0.9% sodium chloride) and stored at -18°C to estimate the total cholesterol and triglycerides in the liver. Additionally, the white adipose tissues (epididymal, mesenteric, retroperitoneal, and perirenal tissues) were excised, weighed, and left in 10% formalin for histopathological analysis.
Blood collection:
At the beginning of the first week and after the end of the eighth week, blood samples were taken after an eight-hour fast. 1.5 ml of blood was taken from the eye vein using a heparinized capillary tube and placed in an Eppendorf tube containing EDTA. The blood samples were centrifuged at 3000 RPM for 18 minutes, then the plasma was obtained and transferred to a clean tubes [31].
Determination of plasma parameters:
Plasma total cholesterol (TC), high-density lipoprotein (HDL-C), total triglyceride (TG), plasma glucose, Alanine aminotransferase (ALT), and aspartate aminotransferase (AST) were directly assayed by using kits (Quimica clinica Aplicada, Spain) by using spectrophotometer UV1800, Japan (Muniz et al., 2019). Low-density lipoprotein (LDL-C) and very Low-density lipoprotein (VLDL-C) were calculated also Atherosclerosis index were calculated according to [30] as followed:
LDL-C & VLDL-C mg/dl = Total cholesterol – HDL-C
Atherosclerosis index = LDL-C & VLDL-C/HDL-C
Body mass index (BMI) and Body weight gain (%BWG):
BMI and %BWG were calculated [30].
Body Mass Index = (final weight)/(length2)
% Body Weight Gain = [(final weight – initial weight)/(initial weight)]*100
Liver TC and TG:
The frozen liver was thawed at room temperature and placed in a plastic bag, then mashed. 0.1 grams of the mashed liver were weighed in a capped test tube, and 10 ml of a chloroform-methanol solution (2:1) were added. The tube was then covered and shaken well. The contents of the tube were filtered using filter paper. Then, 10 microliters of the filtrate were added to a clean test tube, followed by 1 ml of the total cholesterol reagent or the total triglycerides reagent. A standard sample was also prepared, and the tube was incubated at room temperature for ten minutes. The absorbance was measured at 545nm, and liver TC and TG were calculated using the following equation [33].
Liver TC or Liver TG = (Absorbance of sample/absorbance of standard)*200
After being preserved in 10% formalin, white adipose tissues underwent tissue processing and paraffin embedding. A rotary microtome (Leica microsystem, Germany) was used to cut the tissues into 4 µm sections, and hematoxylin and eosin staining was applied. An Olympus BX51 photomicroscope (Olympus Inc., Japan) set to 200x magnification was used to examine the stained tissues. Optika Pro View software was used to measure the area of 100 adipose cells from stained adipose tissues [34,35].
Statistical analysis:
The data were presented as means and standard deviations. The analysis was conducted using SAS 09 software. The experiment was designed using a completely randomized design, and the means were tested using the least significant difference test (LSD) with a significance level of 0.05.
3. Results
Table 2, showed the fatty acids profile, vitamins and pigment soluble in fat of milk ghee and HPO. Milk ghee contains 68.17% saturated fatty acid, 31.76% unsaturated fatty acid composed of monounsaturated fatty acid 26.26%, and polyunsaturated fatty acid 3.63%. Furthermore, milk ghee contains 1.87% trans fatty acid. The main fatty acids in milk ghee were palmitic acid (C16:0) 36.09%, oleic acid (C18:1n9c) 22.50%, and myristic acid (C14:0) 10.64%. Hydrogenated palm oil contains 98.97% saturated fatty acids, 0.97% unsaturated fatty acids and none of trans fatty acids. However, the unsaturated fatty acids are composed of 0.93% monounsaturated fatty acids, and 0.04% polyunsaturated fatty acids. The main fatty acids in hydrogenated palm oil are lauric acid (C12:0) 42.37, myristic acid (C14:0) 14.41%, palmitic acid (C16:0) 9.27% and stearic acid (C18:0) 26.23%. There are no significant differences between the two types of fat in fat-soluble vitamins (K, E, D, and A) and β-carotene. Milk ghee contained cholesterol, while HPO did not contain cholesterol. This is because milk ghee is an animal fat, whereas the other is a fat from a plant source.
Table 3, represents the chemical composition of milk fat and hydrogenated palm oil. Milk fat has a higher iodine value than HPO, with significant differences, due to the presence of more double bonds in it compared to hydrogenated palm oil. HPO contained more free fatty acids, which may be due to the production processes during hydrogenation. There are no significant differences in the saponification value between types of fat, and the saponification value reflects the average length of the fatty acid chains that make up the oil or fat. Milk ghee had a higher peroxide value than HPO with significant differences. The peroxide value is affected by the type of fatty acids; as the unsaturated fatty acids increase, the oil or fat becomes more prone to oxidation.
Table 4, shows the effect of feeding on diets containing milk ghee or hydrogenated palm oil for eight weeks on plasma TC, HDL-C, LDL-C, atherosclerosis index, TG, blood glucose, ALT, and AST. At the beginning of the experiment, the mean levels of TC, HDL-C, LDL-C, TG, and glucose in all rats were 73.8, 46.91, 26.89, 32.40, and 101.60 mg/dl respectively. After eight weeks of feeding the highest TC, LDL-C, TG, and glucose levels were found in the milk ghee group with significant differences compared to the HPO group. Furthermore, those feeding on HPO recorded a significant increase in HDL-C level compared to those who fed on a diet containing milk ghee. The highest atherosclerosis index was found in the milk ghee group with a significant difference. No significant differences were found between both groups in the ALT level. Feeding rats with hydrogenated palm oil led to a significant increase in AST levels compared to the milk ghee group.
Table 5, represents the body weight, BMI, %BWG, organs weight, adipose tissues, and liver lipids of rats feeding on a diet containing milk ghee or hydrogenated palm oil. There are no significant differences between both groups on initial and final weight. Food intake were increased in both groups from the beginning and after eight weeks. However, the milk ghee group recorded a significant increase in food intake in week eight compared to the HPO group. No significant differences were found in BMI and %BWG between groups. In addition, no significant differences were recorded between groups on the percentage of heart, liver, kidney, and spleen. The lowest liver TC were found in the HPO group with a significant difference compared to the milk ghee group. The HPO group recorded a significant increase in liver TG compared to the milk ghee group. Feeding on both diets did not affect the total percentage of adipose tissues. The highest percentage of the epididymal, retroperitoneal, and perirenal were found in rats fed on a diet containing milk ghee compared to rats fed on HPO. However, rats fed on a diet containing HPO were the highest percentage of mesenteric tissue compared to the milk ghee group.
Figure 1, Propound the average area of one hundred adipose tissue cells in the different types of adipose tissues (epididymal, mesenteric, retroperitoneal, and perirenal). Rats feeding a diet containing HPO recorded a significant decrease in the average area of one hundred cells of epididymal, mesenteric, retroperitoneal, and perirenal tissues, also they have a small amount of large adipose cells compared to the milk ghee group (Figure 2, Figure 3, Figure 4 and Figure 5).
4. Discussion
The TC is affected by the high-fat diet. In this research, we recorded a significant increase in the TC from the beginning, and this increase may be due to the high amount of saturated fatty acids in both types, as Baudet et al. reported that high consumption of saturated fatty acids can lead to an increase in blood TC levels. However, the milk ghee group increases the TC levels, a study on mice reported that consuming the milk fat (butter) made a significant increase in TC levels compared with other groups [36]. In addition, our results noted that HPO elevated the HDL-C levels, while milk ghee had lower levels of HDL-C. According to previous studies, rats feeding on hydrogenated palm oil increase the levels of HDL-C [37], whereas another study found that milk fat caused a reduction of HDL-C levels and an increase in LDL-C levels in mice, and our results agreed with this study [36]. Lauric and myristic acids give a more favorable plasma lipid profile [38]. However, the positive effect of hydrogenated palm oil on plasma lipids may be due to the fatty acid composition. Table 2 illustrates that HPO has 42.37% lauric acid and 14.41% myristic acid, whereas milk ghee contains 3% and 10.64%, respectively. Also, Table 2 shows that hydrogenated palm oil contains a high amount of stearic acid. A study showed that oleic acid and stearic acid may have a positive effect on blood TC and TG, while linoleic acid may have a negative effect on blood TC and TG [39]. In addition, mice diet free from linoleic acid is linked with an increase in lipoprotein lipase activity, and linoleic acid increases lipogenic enzyme activity and high levels of mRNA that gird on creating fats [40]. However, ghee is more nutritionally reliable than other fats and oils because it contains medium-chain fatty acids, which are directly absorbed and burned by the liver to provide energy [41].
In a study, it was found that mice fed milk fat for eight weeks showed a significant increase in final weight compared to mice fed palm oil, sunflower oil, canola oil, or the control group. Furthermore, the milk fat group was the highest in %BWG compared with the palm oil and control groups [42]. Rats fed on milk fat for fifteen weeks recorded the highest final weight compared with the sunflower oil group [43]. However, mice feeding on a diet containing palm oil for fifteen weeks recorded a significant decrease in %BWG compared with mice fed on a diet containing olive oil. In addition, there are no significant differences in %BWG between mice fed on a diet containing palm oil or hydrogenated palm oil and mice fed on a regular diet (control) [44]. Body mass index of normal male rats ranged between 0.45 and 0.68 g/cm2 [45,46]. Accordingly, in our experiment all groups of rats indicate that they did not enter the abnormal stage. However, BMI is an inaccurate indicator for overweight or obesity in some cases, while the percentage of body fat is more accurate indicator for obesity and overweight in humans and animals [47].
The positive effect of the HPO on white adipose tissue may be due to an increased rate of hydrolysis of triglycerides, an increased rate of beta-oxidation of fatty acids, or an increase in the inhibition of lipogenesis. The position of stearic acid in the triglyceride may also have an effect. Stearic acid in the third position of the triglyceride may cause hydrolysis, and then the fatty acids bind with calcium and magnesium to form insoluble salts. This may affect fat absorption, contributing to reducing weight [48]. In addition, the reduction of total cholesterol in the liver for the HPO group may be due to the HPO having a high content of stearic acid. Stearic acid may lower total cholesterol in the liver because it requires more bile salts in the gut for the emulsification, causing the liver to consume a larger amount of cholesterol to produce bile salts [49]. Table 5 demonstrates the liver TC, in HPO group, the liver TC is around one-third of what the milk ghee group contains of liver TC.
5. Conclusions
The consumption of HPO may have a positive effect on plasma lipids and adipose tissue compared to milk ghee. Feeding rats HPO for eight weeks at 20% of their diet resulted in a significant decrease in the levels of TC, LDL-C, TG, and blood glucose, as well as a significant decrease in the atherosclerosis index and liver TC. It also led to a significant increase in HDL-C levels. While milk ghee led to an improvement in AST levels compared to HPO, there were no significant differences between the two types of fats on ALT. Hydrogenated palm oil also led to a significant reduction in the percentage of white adipose tissues (epididymal, retroperitoneal, and perirenal), while milk ghee resulted in a significant decrease in the percentage of mesenteric. HPO also led to a significant reduction in the size of white adipose tissues cells.
Author Contributions
Alshaikhsaleh, S. M. lab analysis included the biological experiment and blood samples analysis as well as literature review and editing the article. Saleh, F. A. supervised the experiment and reviewed the article. Al-Otaibi, M. M. did the supervising of the experiment and reviewing of the manuscript.
Funding
The authors declare the financial support was received for the research and publication of this article. We would like to thanks the Deanship of Scientific Research, the Vince Presidency for Graduate Studies and Scientific Research, at King Faisal University for supporting this project No. (Will be available later).
Institutional Review Board Statement
In this section, you should add the Institutional Review Board Statement and approval number, if relevant to your study. You might choose to exclude this statement if the study did not require ethical approval. Please note that the Editorial Office might ask you for further information. Please add “The study was conducted in accordance with the Declaration of Helsinki, and approved by the Institutional Review Board (or Ethics Committee) of NAME OF INSTITUTE (protocol code XXX and date of approval).” for studies involving humans. OR “The animal study protocol was approved by the Institutional Review Board (or Ethics Committee) of NAME OF INSTITUTE (protocol code XXX and date of approval).” for studies involving animals. OR “Ethical review and approval were waived for this study due to REASON (please provide a detailed justification).” OR “Not applicable” for studies not involving humans or animals.
Data Availability Statement
Data are available from the author Shaheed M Alshaikhsaleh on reasonable request.
Acknowledgments
The author would like to thankful the department of Food and Nutrition Sciences, College of Agricultural and Food Sciences, King Faisal University, Alahsa, Saudi Arabia for the scientific advises. In addition, thanking Mr. Muntadhar Mohammed Alshaikhsaleh for his valuable help.
Ethics statement
The experiment was approved by the Research Ethics Committee of the Deanship of Scientific Research, King Faisal University.
Conflicts of Interest
The authors declare no conflict of interest.
References
- Xu, D.; Feng, M.; Chu, Y.F.; Wang, S.; Shete, V.; Tuohy, K.M.; Liu, F.; Zhou, X.; Kamil, A.; Pan, D.; et al. The Prebiotic Effects of Oats on Blood Lipids, Gut Microbiota, and Short-Chain Fatty Acids in Mildly Hypercholesterolemic Subjects Compared With Rice: A Randomized, Controlled Trial. Front. Immunol. 2021, 12, 1–16. [Google Scholar] [CrossRef] [PubMed]
- Prasad, K.; Mishra, M. Mechanism of Hypercholesterolemia-Induced Atherosclerosis. Rev. Cardiovasc. Med. 2022, 23, 212. [Google Scholar] [CrossRef] [PubMed]
- Castelli, W.P. Cholesterol and Lipids in the Risk of Coronary Artery Disease--the Framingham Heart Study. Can. J. Cardiol. 1988, 4 Suppl A, 5A–10A. [Google Scholar] [PubMed]
- Rubino, F.; Batterham, R.L.; Koch, M.; Mingrone, G.; le Roux, C.W.; Farooqi, I.S.; Farpour-Lambert, N.; Gregg, E.W.; Cummings, D.E. <em>Lancet Diabetes & Endocrinology</Em> Commission on the Definition and Diagnosis of Clinical Obesity. Lancet Diabetes Endocrinol. 2023, 11, 226–228. [Google Scholar] [CrossRef] [PubMed]
- Fitch, A.K.; Bays, H.E. Obesity Definition, Diagnosis, Bias, Standard Operating Procedures (SOPs), and Telehealth: An Obesity Medicine Association (OMA) Clinical Practice Statement (CPS) 2022. Obes. Pillars 2022, 1, 100004. [Google Scholar] [CrossRef] [PubMed]
- Goodnight, S.H.; Harris, W.S.; Connor, W.E.; Illlngworth, D.R. Review Polyunsaturated Fatty Acids , Hyperlipidemia , and Thrombosis. 1982.
- Talukder, M.I.; Haque, M.I.; Sarker, S.; Sujan, K.M.; Miah, M.A. Hypocholesterolemic Effect of Ginger Extract in Butter Fed Mice. BD Vet. Med. Rec 2017, 3, 35–42. [Google Scholar]
- Nirmala S, K.; Manjula S, B.; H, S. Effect of Two Types of Dietary Ghee on Serum Lipid Levels in Rats. J. Evol. Med. Dent. Sci. 2016, 5, 3140–3144. [Google Scholar] [CrossRef]
- Morris, D.H.; Vaisey-Genser, M. MARGARINE | Dietary Importance. In; Caballero, B.B.T.-E. of F.S. and N. (Second E., Ed.; Academic Press: Oxford, 2003; pp. 3719–3725. ISBN 978-0-12-227055-0. [Google Scholar]
- Maleki Sedgi, F.; Mohammad Hosseiniazar, M.; Alizadeh, M. The Effects of Replacing Ghee with Rapeseed Oil on Liver Steatosis and Enzymes, Lipid Profile, Insulin Resistance and Anthropometric Measurements in Patients with Non-Alcoholic Fatty Liver Disease: A Randomised Controlled Clinical Trial. Br. J. Nutr. 2024, 131, 1985–1996. [Google Scholar] [CrossRef] [PubMed]
- Basheer, S.; Malik, I.R.; Awan, F.R.; Sughra, K.; Roshan, S.; Khalil, A.; Iqbal, M.J.; Parveen, Z. Tissue , and Blood Parameters in Experimental Mice. 2023. [CrossRef]
- den Hartigh, L.J. Conjugated Linoleic Acid Effects on Cancer, Obesity, and Atherosclerosis: A Review of Pre-Clinical and Human Trials with Current Perspectives. Nutrients 2018, 11, 1–29. [Google Scholar] [CrossRef] [PubMed]
- Kritchevsky, D.; Tepper, S.A.; Klurfield, D.M. Serum and Liver Lipids in Rats Fed Mixtures of Corn and Palm Oils ± Cholesterol. Nutr. Res. 2001, 21, 191–197. [Google Scholar] [CrossRef]
- Mensink, R.P. Effects of Stearic Acid on Plasma Lipid and Lipoproteins in Humans. Lipids 2005, 40, 1201–1205. [Google Scholar] [CrossRef] [PubMed]
- Thijssen, M.A.; Mensink, R.P. Small Differences in the Effects of Stearic Acid, Oleic Acid, and Linoleic Acid on the Serum Lipoprotein Profile of Humans. Am. J. Clin. Nutr. 2005, 82, 510–516. [Google Scholar] [CrossRef] [PubMed]
- Yang, Z.H.; Nill, K.; Takechi-Haraya, Y.; Playford, M.P.; Nguyen, D.; Yu, Z.X.; Pryor, M.; Tang, J.; Rojulpote, K.V.; Mehta, N.N.; et al. Differential Effect of Dietary Supplementation with a Soybean Oil Enriched in Oleic Acid versus Linoleic Acid on Plasma Lipids and Atherosclerosis in LDLR-Deficient Mice. Int. J. Mol. Sci. 2022, 23. [Google Scholar] [CrossRef] [PubMed]
- McKenzie, K.M.; Lee, C.M.; Mijatovic, J.; Haghighi, M.M.; Skilton, M.R. Medium-Chain Triglyceride Oil and Blood Lipids: A Systematic Review and Meta-Analysis of Randomized Trials. J. Nutr. 2021, 151, 2949–2956. [Google Scholar] [CrossRef] [PubMed]
- Saraswathi, V.; Kumar, N.; Ai, W.; Gopal, T.; Bhatt, S.; Harris, E.N.; Talmon, G.A.; Desouza, C. V. Myristic Acid Supplementation Aggravates High Fat Diet-Induced Adipose Inflammation and Systemic Insulin Resistance in Mice. Biomolecules 2022, 12, 1–15. [Google Scholar] [CrossRef] [PubMed]
- Mirmiran, P.; Hosseini, S.; Hosseinpour-Niazi, S. Chapter 2 - Hydrogenated Vegetable Oils and Trans Fatty Acids: Profile and Application to Diabetes. In; Watson, R.R., Preedy, V.R.B.T.-B.F. as D.I. for D. (Second E., Eds.; Academic Press, 2019; pp. 19–32 ISBN 978-0-12-813822-9.
- Souad, B. Hydrogenated Oils and Public Health : A Scientific Analysis of Trans Fats and Disease Óleos Hidrogenados e Saúde Pública : Uma Análise Científica Das Gorduras Trans e Doenças Aceites Hidrogenados y Salud Pública : Un Análisis Científico de Las Grasas Tran. 2024, 1–14. [CrossRef]
- Yang, Y.; Jin, J.; Yu, L.; Zeng, W.; Chen, Y.; Zhao, C.; Zhang, J.; Xing, Z.; Jin, Q.; Liu, X.; et al. Sensory Features of Partially Hydrogenated Oil and Their Connection with Melting and Crystalline Characteristics. J. Oleo Sci. 2023, 72, 745–754. [Google Scholar] [CrossRef] [PubMed]
- MA, F.; Sunita, M. Industrial Trans-Fatty Acid Intake Associated with Coronary Heart Disease Risk-A Review. J. Nutr. Food Sci. 2021, 11, 1–8. [Google Scholar]
- Satchithanandam, S.; Fritsche, J.; Rader, J.I. Extension of AOAC Official Method 996.01 to the Analysis of Standard Reference Material (SRM) 1846 and Infant Formulas. J. AOAC Int. 2001, 84, 805–813. [Google Scholar] [CrossRef] [PubMed]
- Sýs, M.; Švecová, B.; Švancara, I.; Metelka, R. Determination of Vitamin E in Margarines and Edible Oils Using Square Wave Anodic Stripping Voltammetry with a Glassy Carbon Paste Electrode. Food Chem. 2017, 229, 621–627. [Google Scholar] [CrossRef] [PubMed]
- Rajput, G.K.; Kumar, A.; Kumar, A.; Srivastav, G. To Develop a Simple (Uv-Vis Spectrometric) Method for the Estimation of Multivitamin with Special Reference to Capsules & Tablets. Int. J. drug Formul. Res. 2011, 2, 43–48. [Google Scholar]
- Munasinghe, M.; Wansapala, J. B-Carotene Content of M. Longifolia Seed Oil in Different Agro-Climatic Zones in Sri Lanka, The Effect of Heat on Its Stability and the Composition of Seed Cake. Potravinarstvo 2015, 9, 474–479. [Google Scholar] [CrossRef] [PubMed]
- Ward, K.; Scarth, R.; Daun, J.K.; Thorsteinson, C.T. A Comparison of High-Performance Liquid Chromatography and Spectrophotometry to Measure Chlorophyll in Canola Seed and Oil. J. Am. Oil Chem. Soc. 1994, 71, 931–934. [Google Scholar] [CrossRef]
- Davies, A.M.C.; Boley, N.P. Food Analysis; 1984; Vol. 21; ISBN 9783319457741.
- Kirk, S.; Sawyer, R. Pearson’s Composition and Analysis of Foods.; Longman Group Ltd., 1991; ISBN 0582409101.
- Abd El-Gawad, I.A.; El-Sayed, E.M.; Hafez, S.A.; El-Zeini, H.M.; Saleh, F.A. The Hypocholesterolaemic Effect of Milk Yoghurt and Soy-Yoghurt Containing Bifidobacteria in Rats Fed on a Cholesterol-Enriched Diet. Int. Dairy J. 2005, 15, 37–44. [Google Scholar] [CrossRef]
- Alshaikhsaleh, S.M.; Asiri, S.A. Influence of Fatty Acid Profile of Moringa Peregrina Seeds Oil on Blood Plasma Lipids and Blood Glucose on Rats. 2025. [CrossRef]
- Muniz, L.B.; Alves-Santos, A.M.; Camargo, F.; Martins, D.B.; Celes, M.R.N.; Naves, M.M. V. High-Lard and High-Cholesterol Diet, but Not High-Lard Diet, Leads to Metabolic Disorders in a Modified Dyslipidemia Model. Arq. Bras. Cardiol. 2019, 113, 896–902. [Google Scholar] [CrossRef] [PubMed]
- Montano, C.E.; Fernandez, M.L.; McNamara, D.J. Regulation of Apolipoprotein B—Containing Lipoproteins by Vitamin C Level and Dietary Fat Saturation in Guinea Pigs. Metabolism 1998, 47, 883–891. [Google Scholar] [CrossRef] [PubMed]
- Sato, M.; Uzu, K.; Yoshida, T.; Hamad, E.M.; Kawakami, H.; Matsuyama, H.; Abd El-Gawad, I.A.; Imaizumi, K. Effects of Milk Fermented by Lactobacillus Gasseri SBT2055 on Adipocyte Size in Rats. Br. J. Nutr. 2008, 99, 1013–1017. [Google Scholar] [CrossRef] [PubMed]
- Alshaikhsaleh, S.M.; Saleh, F.A.; Al-Otaibi, M.M. Effects of Camel Hump Fat, Palm Olein Oil, and Corn Oil Feed Additives on Plasma Lipids and Adipose Tissues in Rats. Front. Nutr. 2025, 12, 1–12. [Google Scholar] [CrossRef] [PubMed]
- Rezq, A.A.; Labib, F.A.; Attia, A.E.M. Effect of Some Dietary Oils and Fats on Serum Lipid Profile, Calcium Absorption and Bone Mineralization in Mice. Pakistan J. Nutr. 2010, 9, 643–650. [Google Scholar] [CrossRef]
- Amini, S.A.; Ghatreh-Samani, K.; Habibi-Kohi, A.; Jafari, L. Comparison of Pure Palm Olein Oil, Hydrogenated Oil-Containing Palm, and Canola on Serum Lipids and Lipid Oxidation Rate in Rats Fed with These Oils. Arch. Iran. Med. 2017, 20, 96–100. [Google Scholar] [PubMed]
- Santana, L.F.; Cordeiro, K.W.; Soares, F.L.P.; Freitas, K. de C. Coconut Oil Increases HDL-c and Decreases Triglycerides in Wistar Rats. Acta Sci. - Heal. Sci. 2016, 38, 185–190. [Google Scholar] [CrossRef]
- Bi, X.; Yeo, P.L.Q.; Loo, Y.T.; Henry, C.J. Associations between Circulating Fatty Acid Levels and Metabolic Risk Factors. J. Nutr. Intermed. Metab. 2019, 15, 65–69. [Google Scholar] [CrossRef]
- Fariña, A.C.; Lavandera, J.; González, M.A.; Bernal, C.A. Effect of Conjugated Linoleic Acids on Nutritional Status and Lipid Metabolism in Rats Fed Linoleic-Acid-Deprived Diets. Eur. J. Lipid Sci. Technol. 2019, 121, 1–10. [Google Scholar] [CrossRef]
- Shivananjappa, M.; S, S.; M, P.; R, M.; Naik R, S. Health Benefits of Ghee (Clarified Butter) - A Review from Ayurvedic Perspective. IP J. Nutr. Metab. Heal. Sci. 2020, 3, 64–72. [Google Scholar] [CrossRef]
- Laugerette, F.; Furet, J.P.; Debard, C.; Daira, P.; Loizon, E.; Géloën, A.; Soulage, C.O.; Simonet, C.; Lefils-Lacourtablaise, J.; Bernoud-Hubac, N.; et al. Oil Composition of High-Fat Diet Affects Metabolic Inflammation Differently in Connection with Endotoxin Receptors in Mice. Am. J. Physiol. - Endocrinol. Metab. 2012, 302, 374–386. [Google Scholar] [CrossRef] [PubMed]
- Hsu, S.C.; Huang, C.J. Reduced Fat Mass in Rats Fed a High Oleic Acid-Rich Safflower Oil Diet Is Associated with Changes in Expression of Hepatic PPARα and Adipose SREBP-1c-Regulated Genes. J. Nutr. 2006, 136, 1779–1785. [Google Scholar] [CrossRef] [PubMed]
- Magri, T.P.R.; Fernandes, F.S.; Souza, A.S.; Langhi, L.G.P.; Barboza, T.; Misan, V.; Mucci, D.B.; Santos, R.M.; Nunes, T.F.; Souza, S.A.L.; et al. Interesterified Fat or Palm Oil as Substitutes for Partially Hydrogenated Fat in Maternal Diet Can Predispose Obesity in Adult Male Offspring. Clin. Nutr. 2015, 34, 904–910. [Google Scholar] [CrossRef] [PubMed]
- Mamikutty, N.; Thent, Z.C.; Sapri, S.R.; Sahruddin, N.N.; Mohd Yusof, M.R.; Haji Suhaimi, F. The Establishment of Metabolic Syndrome Model by Induction of Fructose Drinking Water in Male Wistar Rats. Biomed Res. Int. 2014, 2014. [Google Scholar] [CrossRef] [PubMed]
- Novelli, E.L.B.; Diniz, Y.S.; Galhardi, C.M.; Ebaid, G.M.X.; Rodrigues, H.G.; Mani, F.; Fernandes, A.A.H.; Cicogna, A.C.; Novelli Filho, J.L.V.B. Anthropometrical Parameters and Markers of Obesity in Rats. Lab. Anim. 2007, 41, 111–119. [Google Scholar] [CrossRef] [PubMed]
- Rodríguez-Correa, E.; González-Pérez, I.; Clavel-Pérez, P.I.; Contreras-Vargas, Y.; Carvajal, K. Biochemical and Nutritional Overview of Diet-Induced Metabolic Syndrome Models in Rats: What Is the Best Choice? Nutr. Diabetes 2020, 10. [Google Scholar] [CrossRef] [PubMed]
- Yan, S.; Li, X.; Zhang, L.; Zeng, Y.; Liu, S.; Liu, X.; Zhou, H.; Wen, L.; Wang, J. Moderate Quantity of Lard Mixed with Sunflower Oil Attenuate Lipid Accumulation in Mice. Oil Crop Sci. 2020, 5, 205–212. [Google Scholar] [CrossRef]
- Schneider, C.L.; Cowles, R.L.; Stuefer-Powell, C.L.; Carr, T.P. Dietary Stearic Acid Reduces Cholesterol Absorption and Increases Endogenous Cholesterol Excretion in Hamsters Fed Cereal-Based Diets. J. Nutr. 2000, 130, 1232–1238. [Google Scholar] [CrossRef] [PubMed]
Figure 1.
Average of 100 cells area of different types of adipose tissue by µm2.
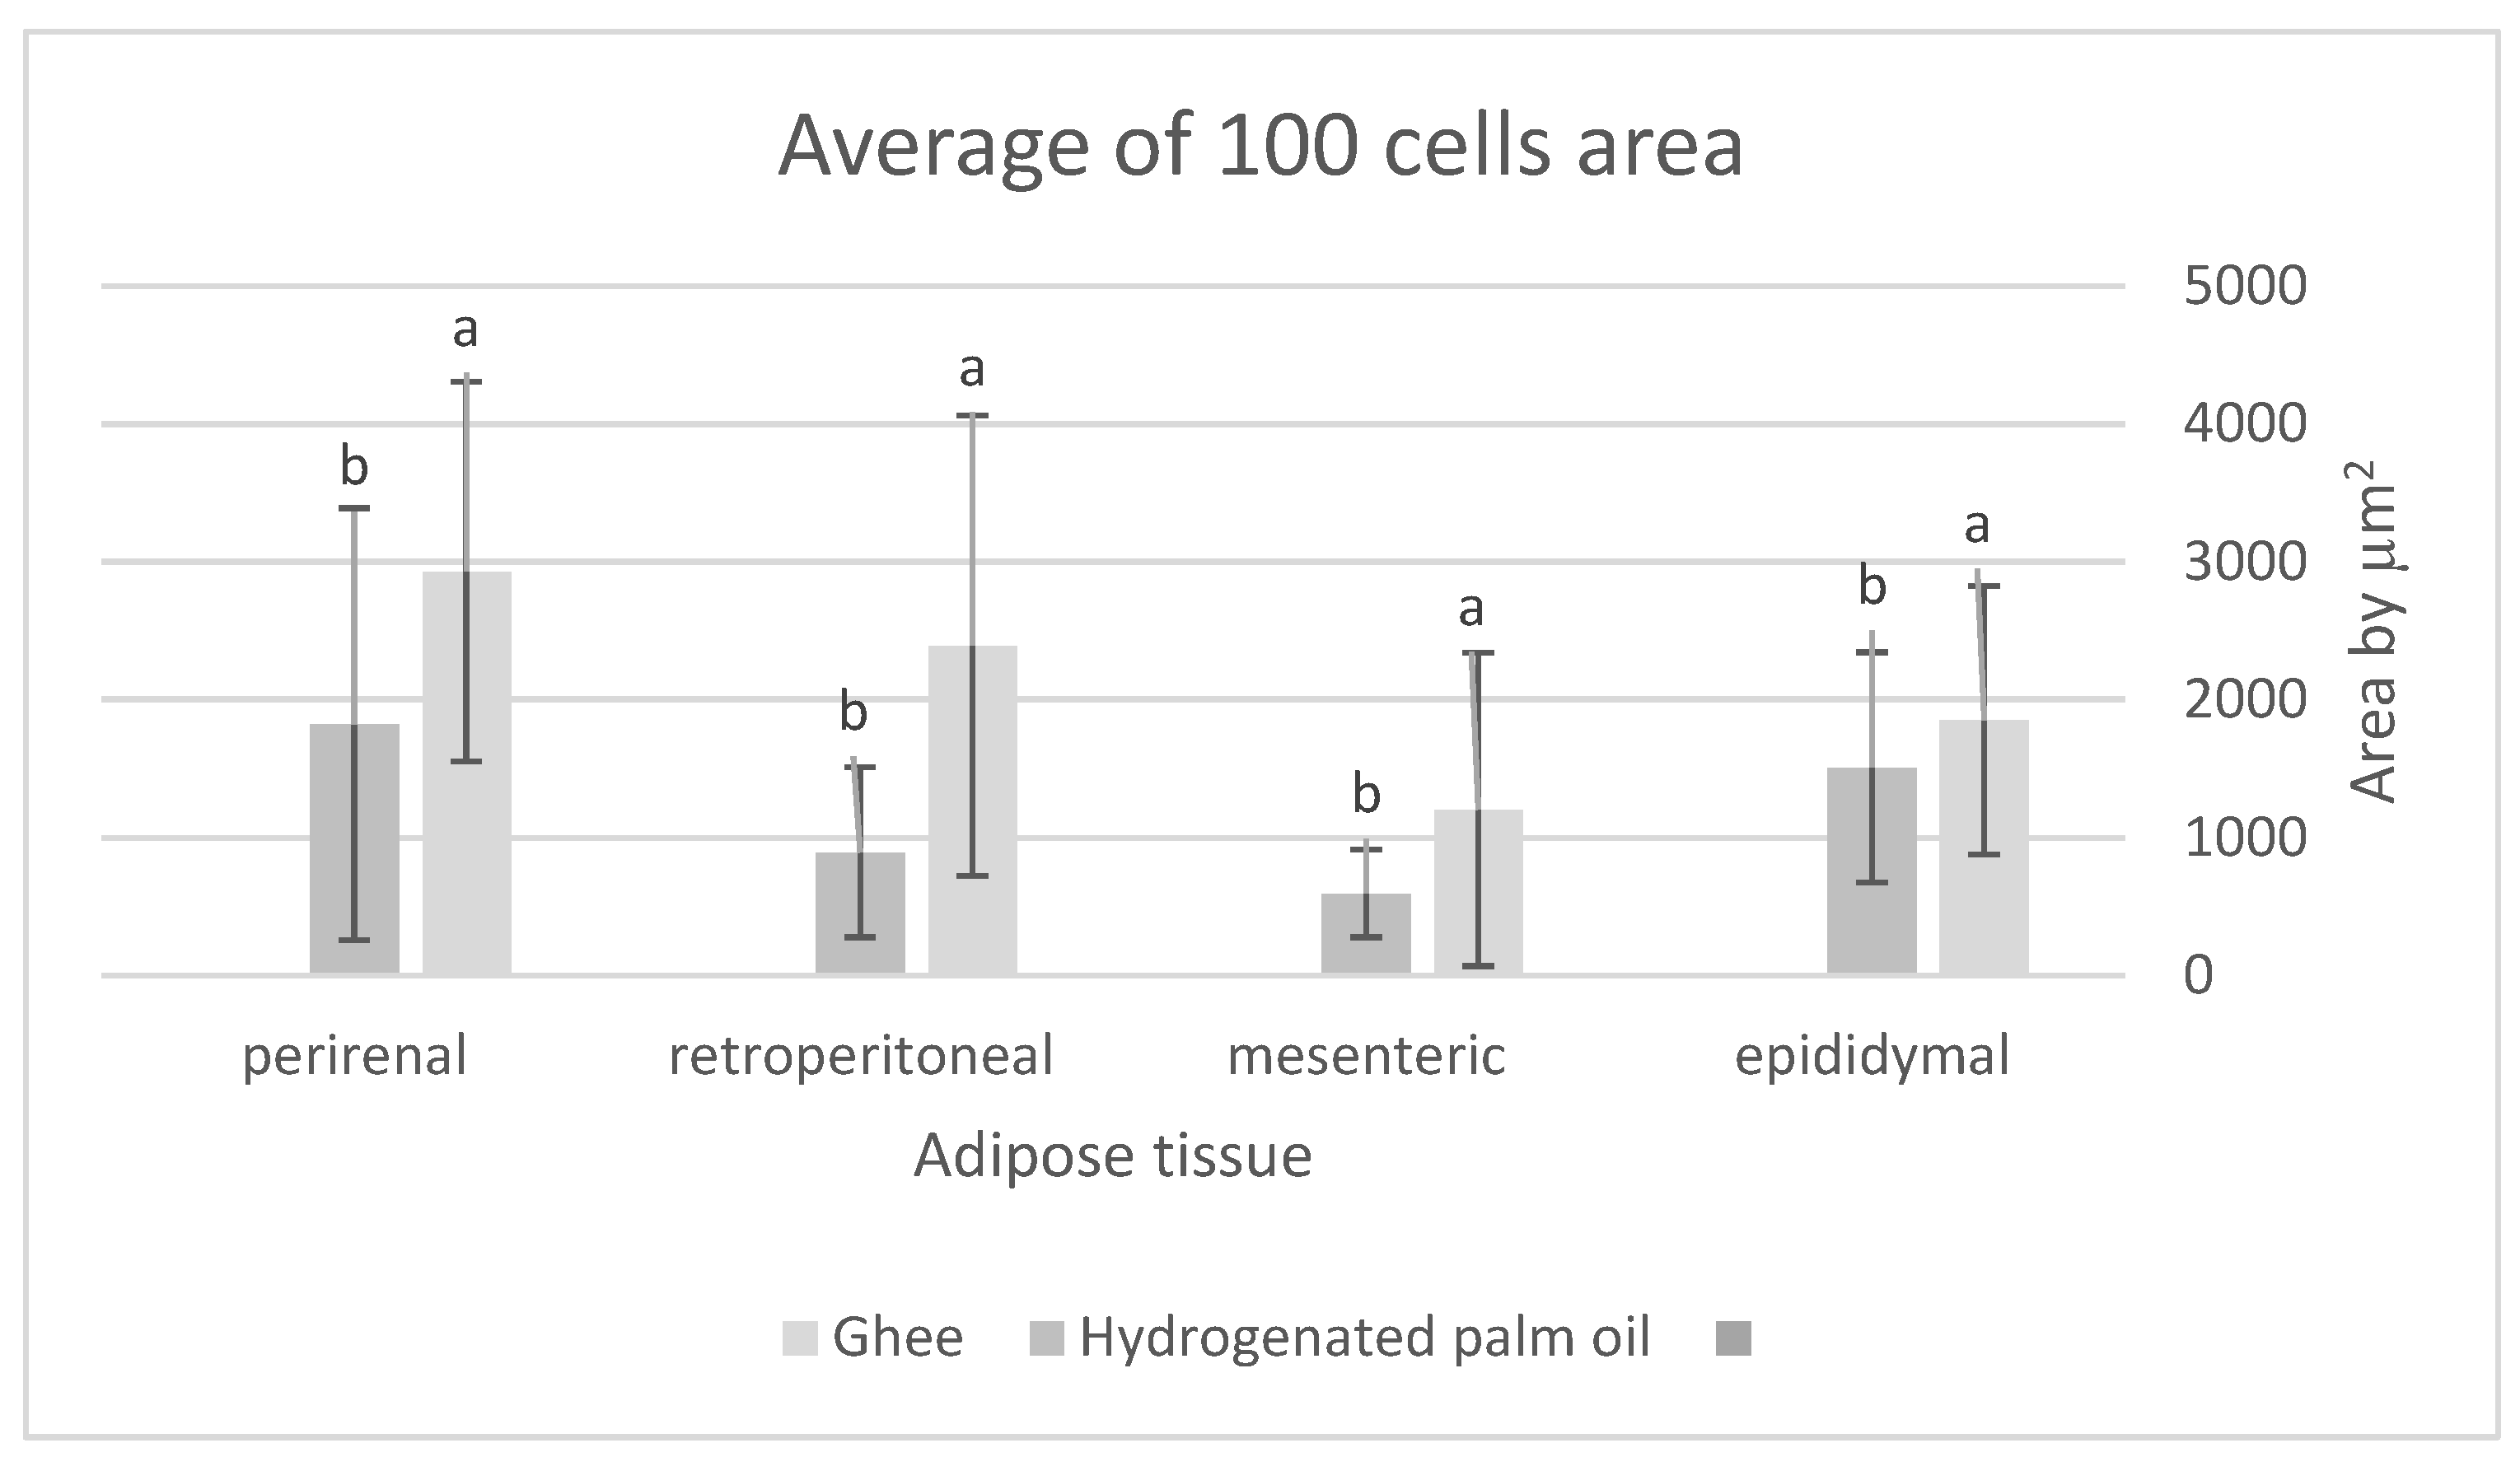
Figure 2.
Effect of different dietary fat and oil on cells area of adipose tissue (epididymal). HPO, Hydrogenated palm oil; MG, Milk ghee.
Figure 2.
Effect of different dietary fat and oil on cells area of adipose tissue (epididymal). HPO, Hydrogenated palm oil; MG, Milk ghee.
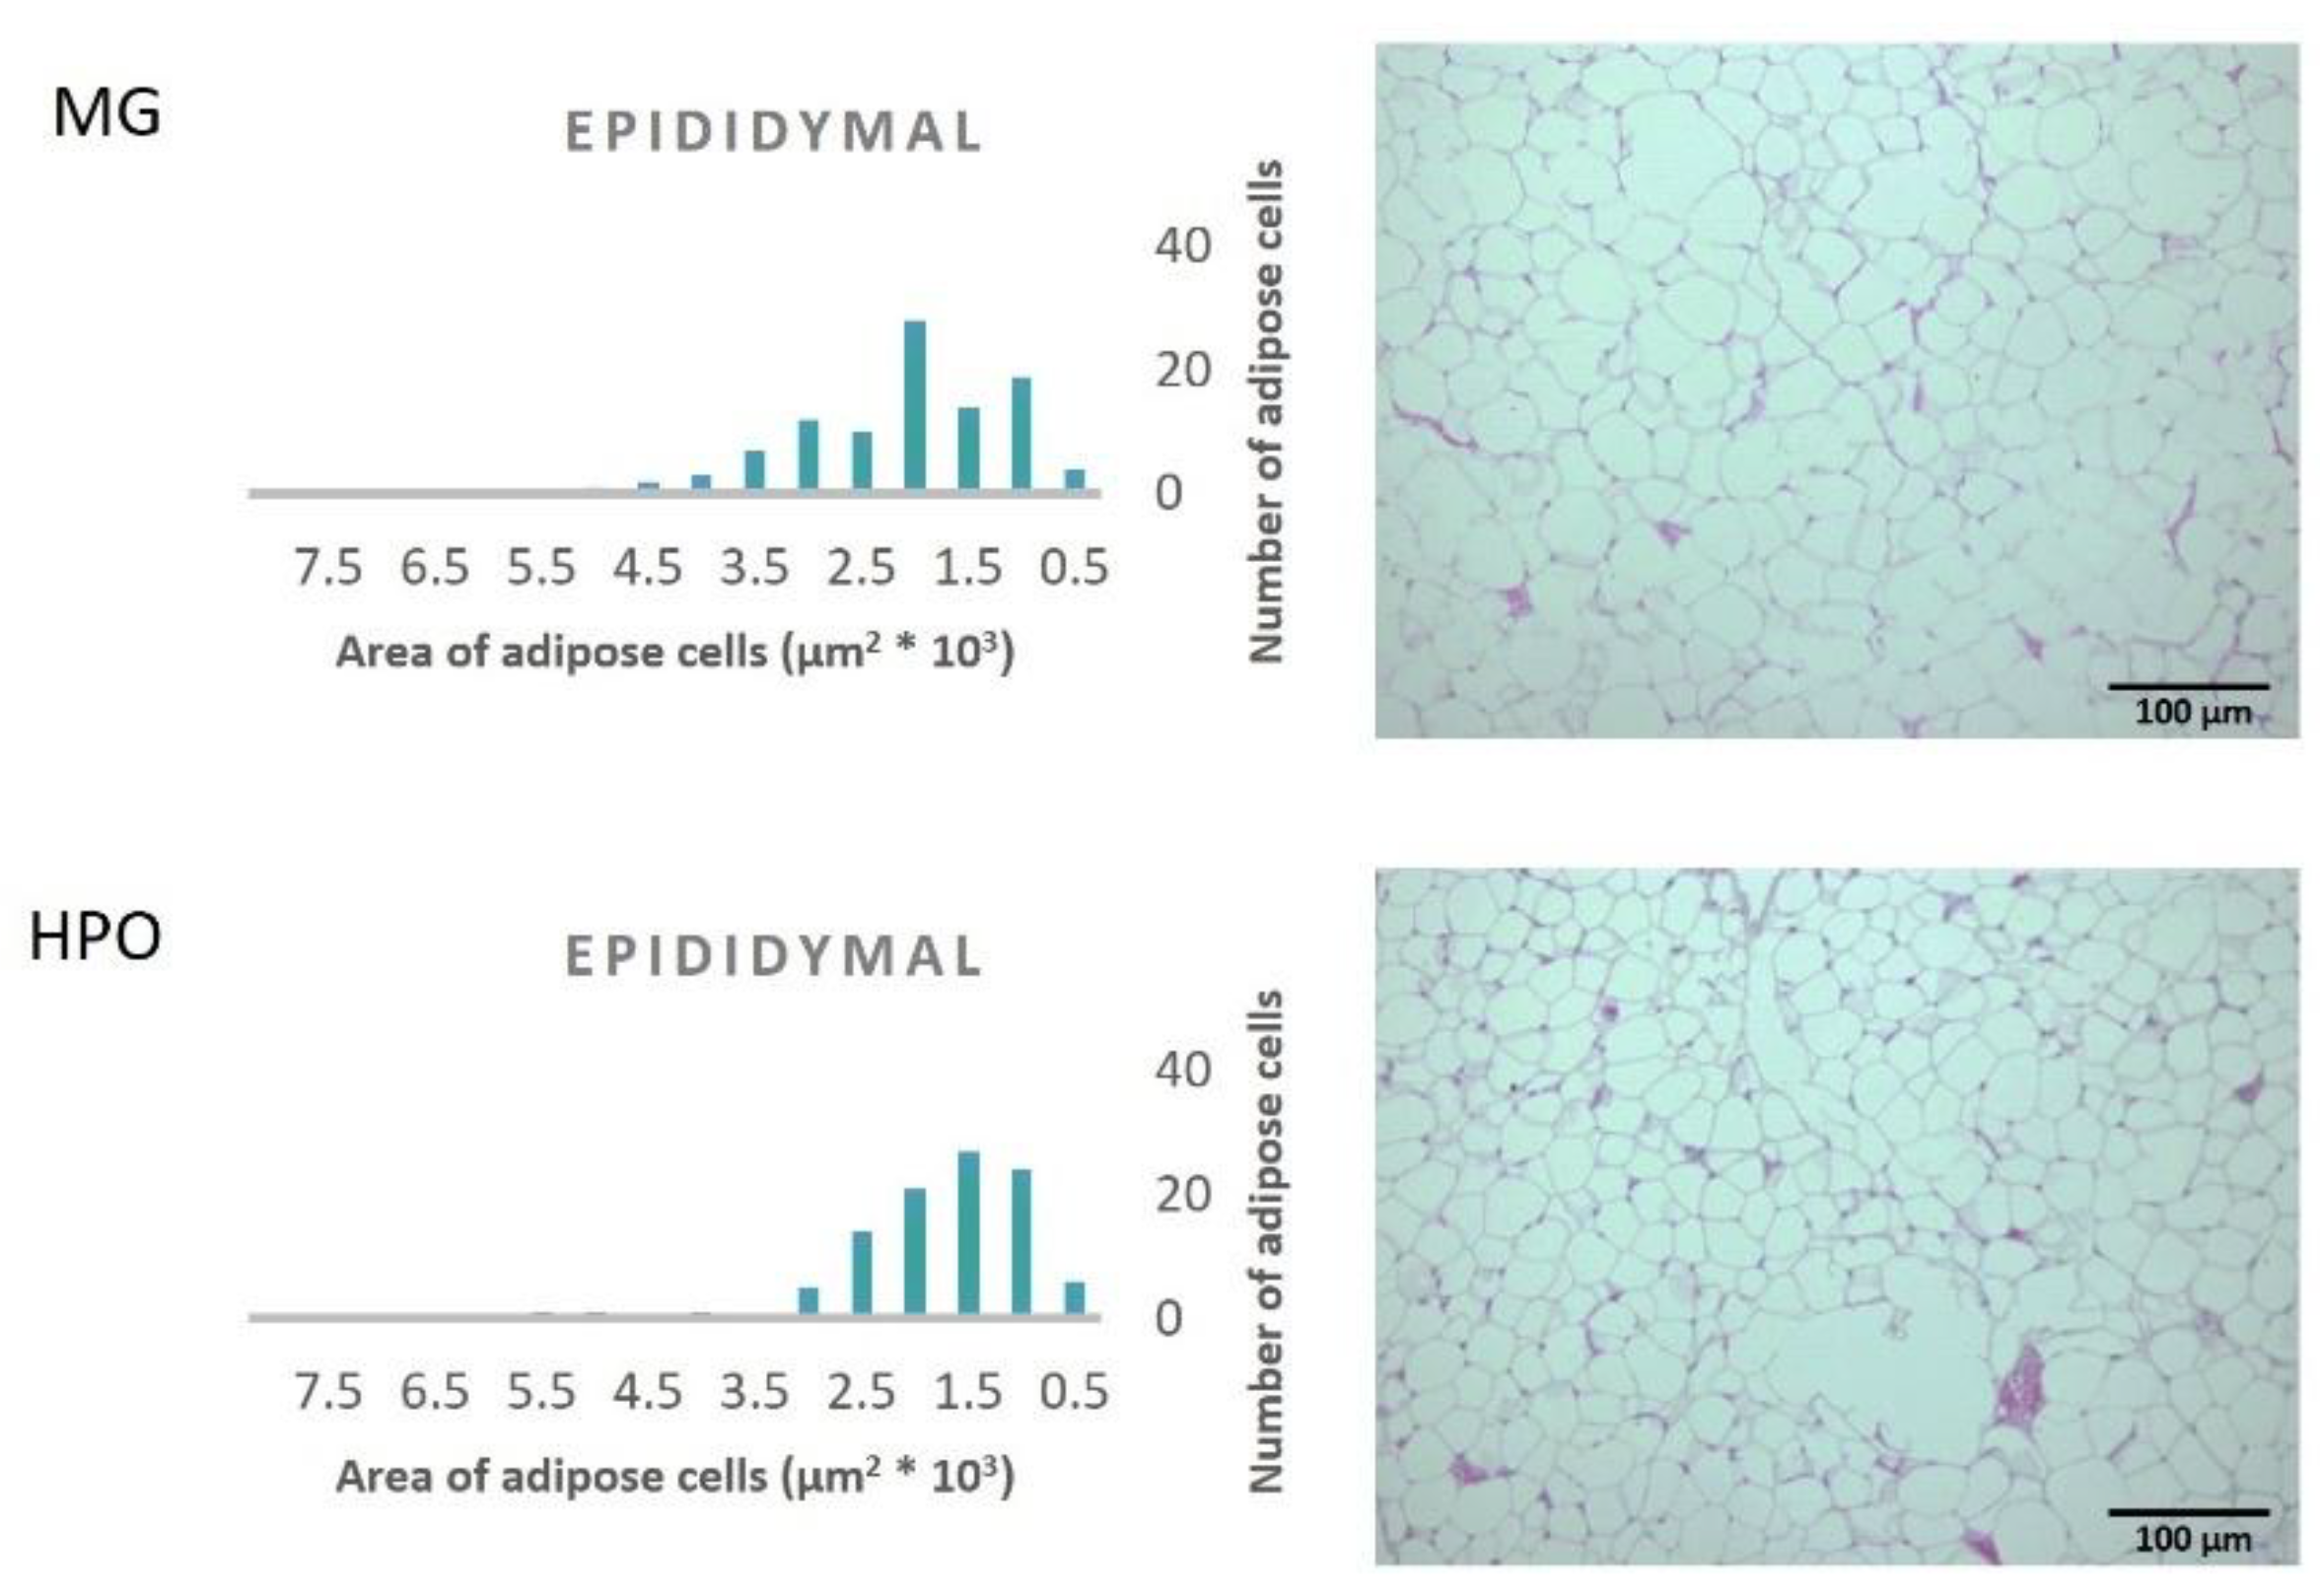
Figure 3.
Effect of different dietary fat and oil on cells area of adipose tissue (retroperitoneal). HPO, Hydrogenated palm oil; MG, Milk ghee.
Figure 3.
Effect of different dietary fat and oil on cells area of adipose tissue (retroperitoneal). HPO, Hydrogenated palm oil; MG, Milk ghee.
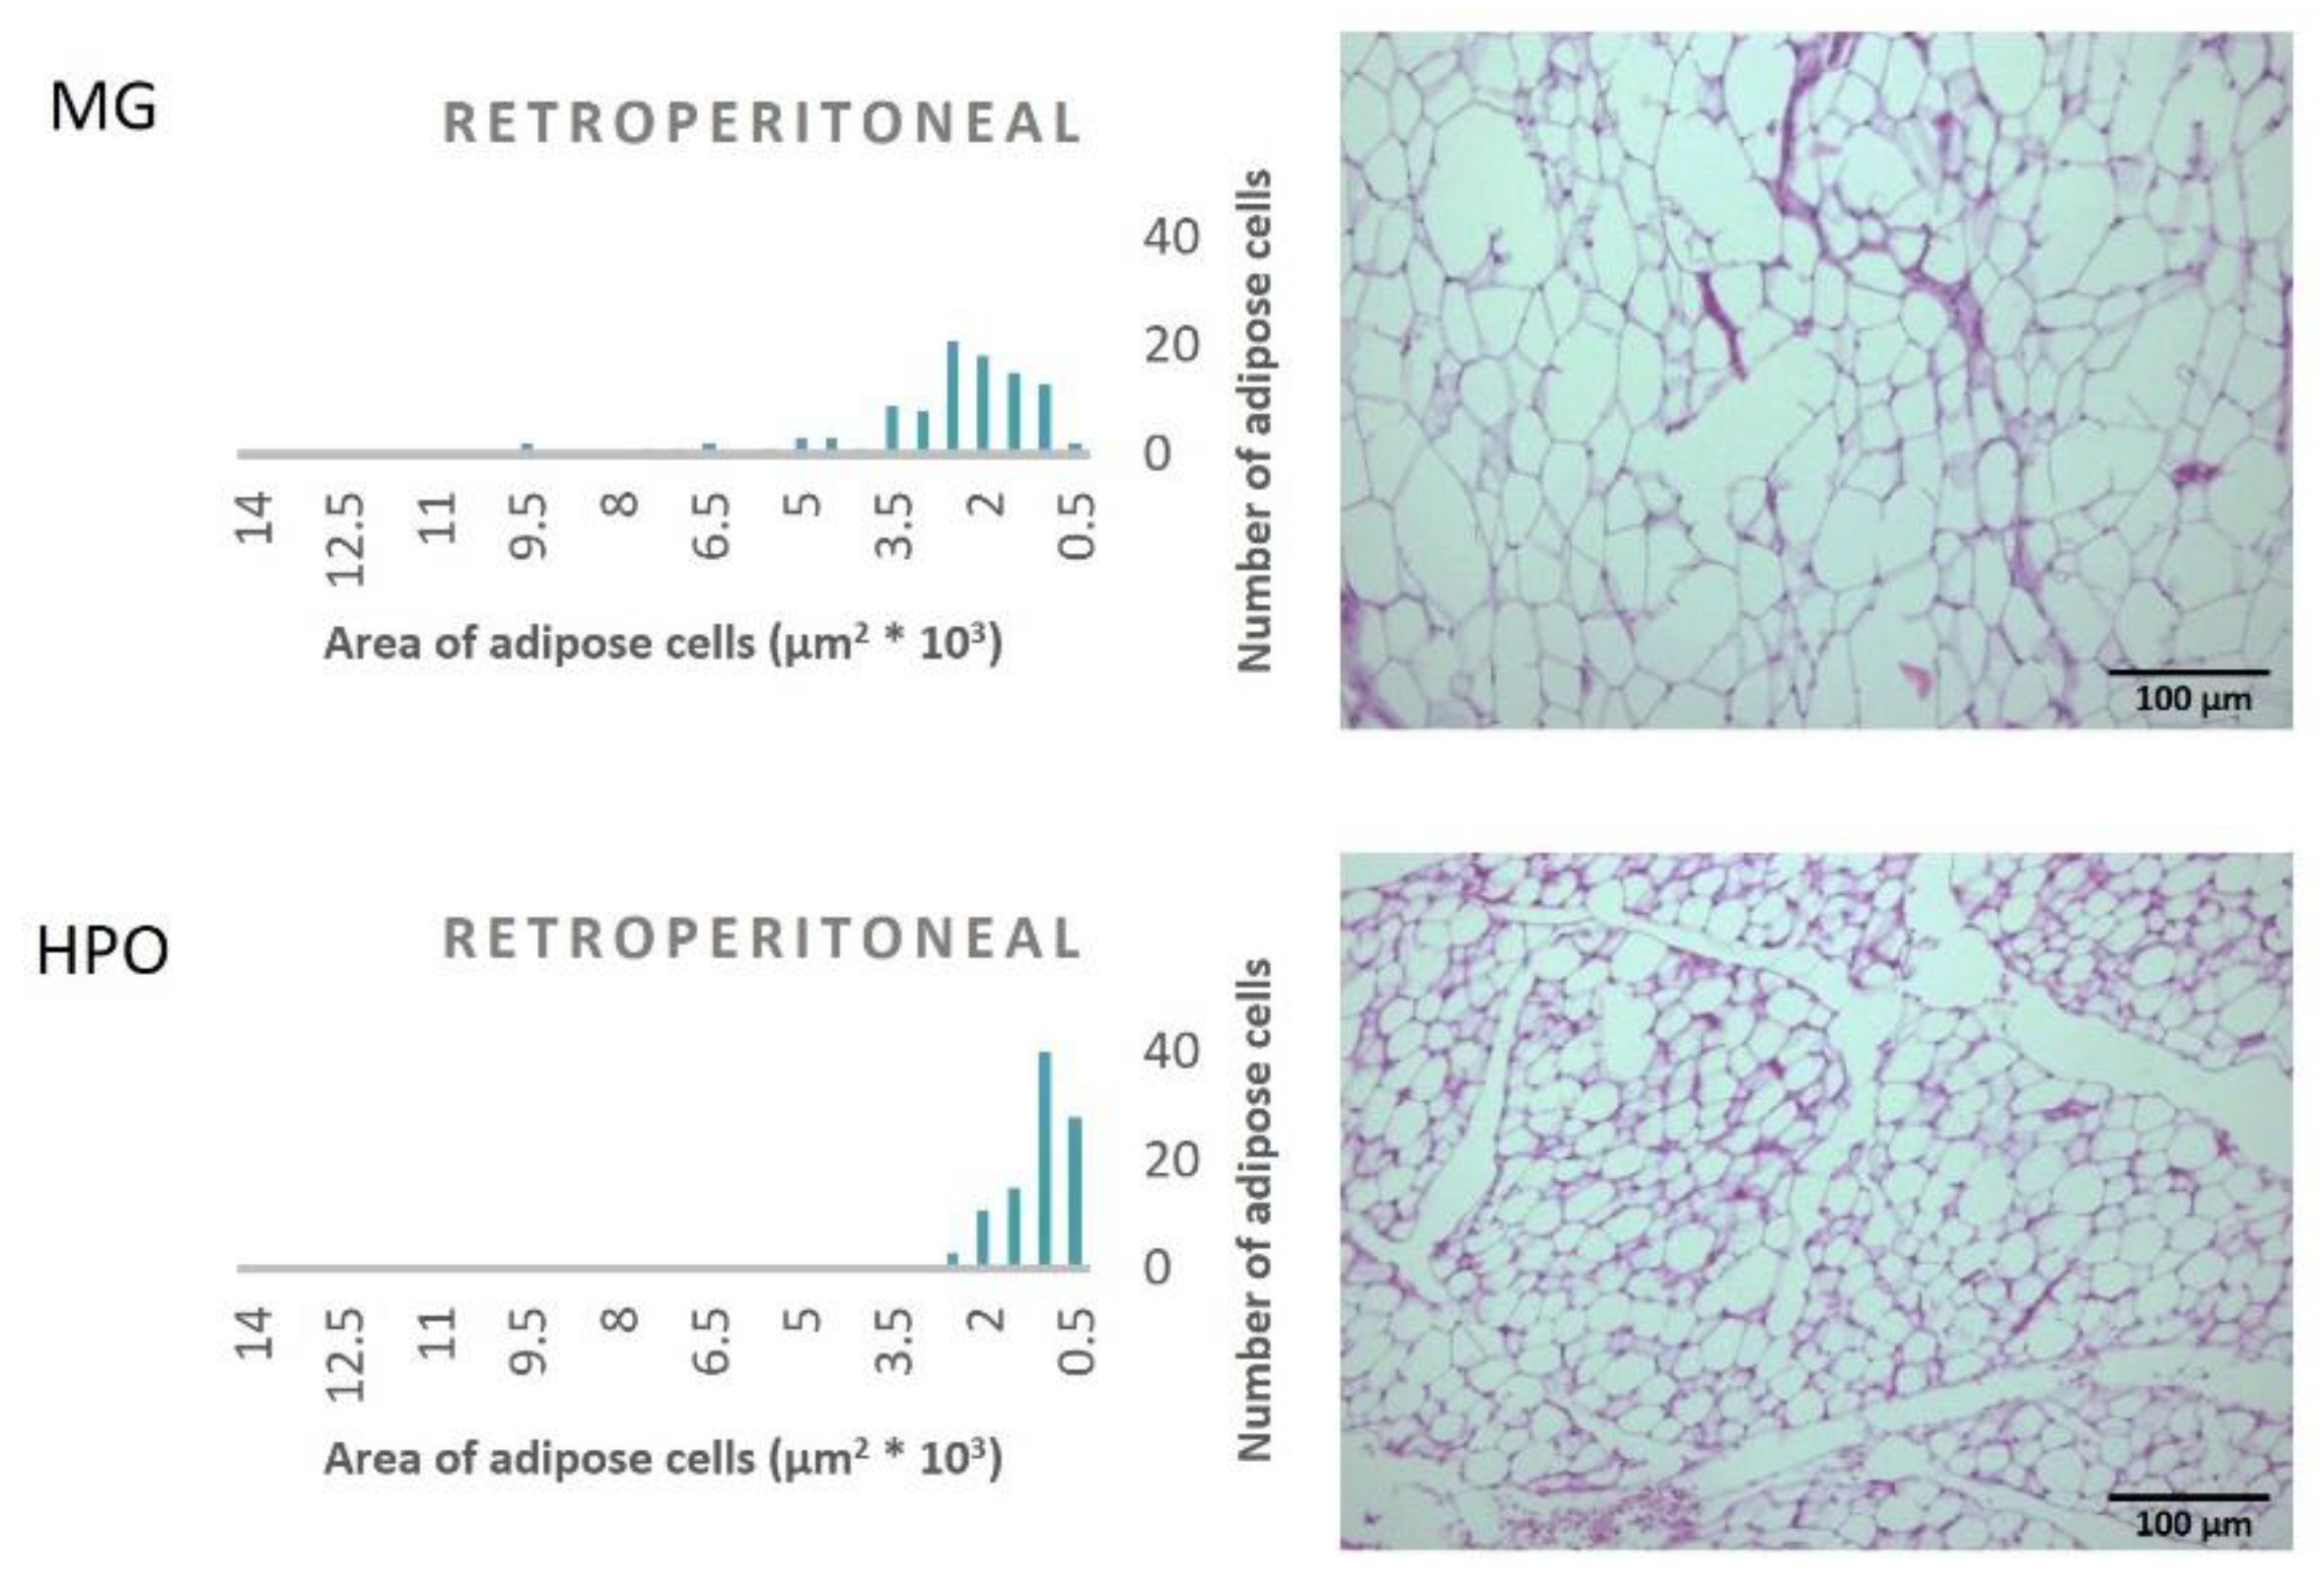
Figure 4.
Effect of different dietary fat and oil on cells area of adipose tissue (perirenal). HPO, Hydrogenated palm oil; MG, Milk ghee.
Figure 4.
Effect of different dietary fat and oil on cells area of adipose tissue (perirenal). HPO, Hydrogenated palm oil; MG, Milk ghee.
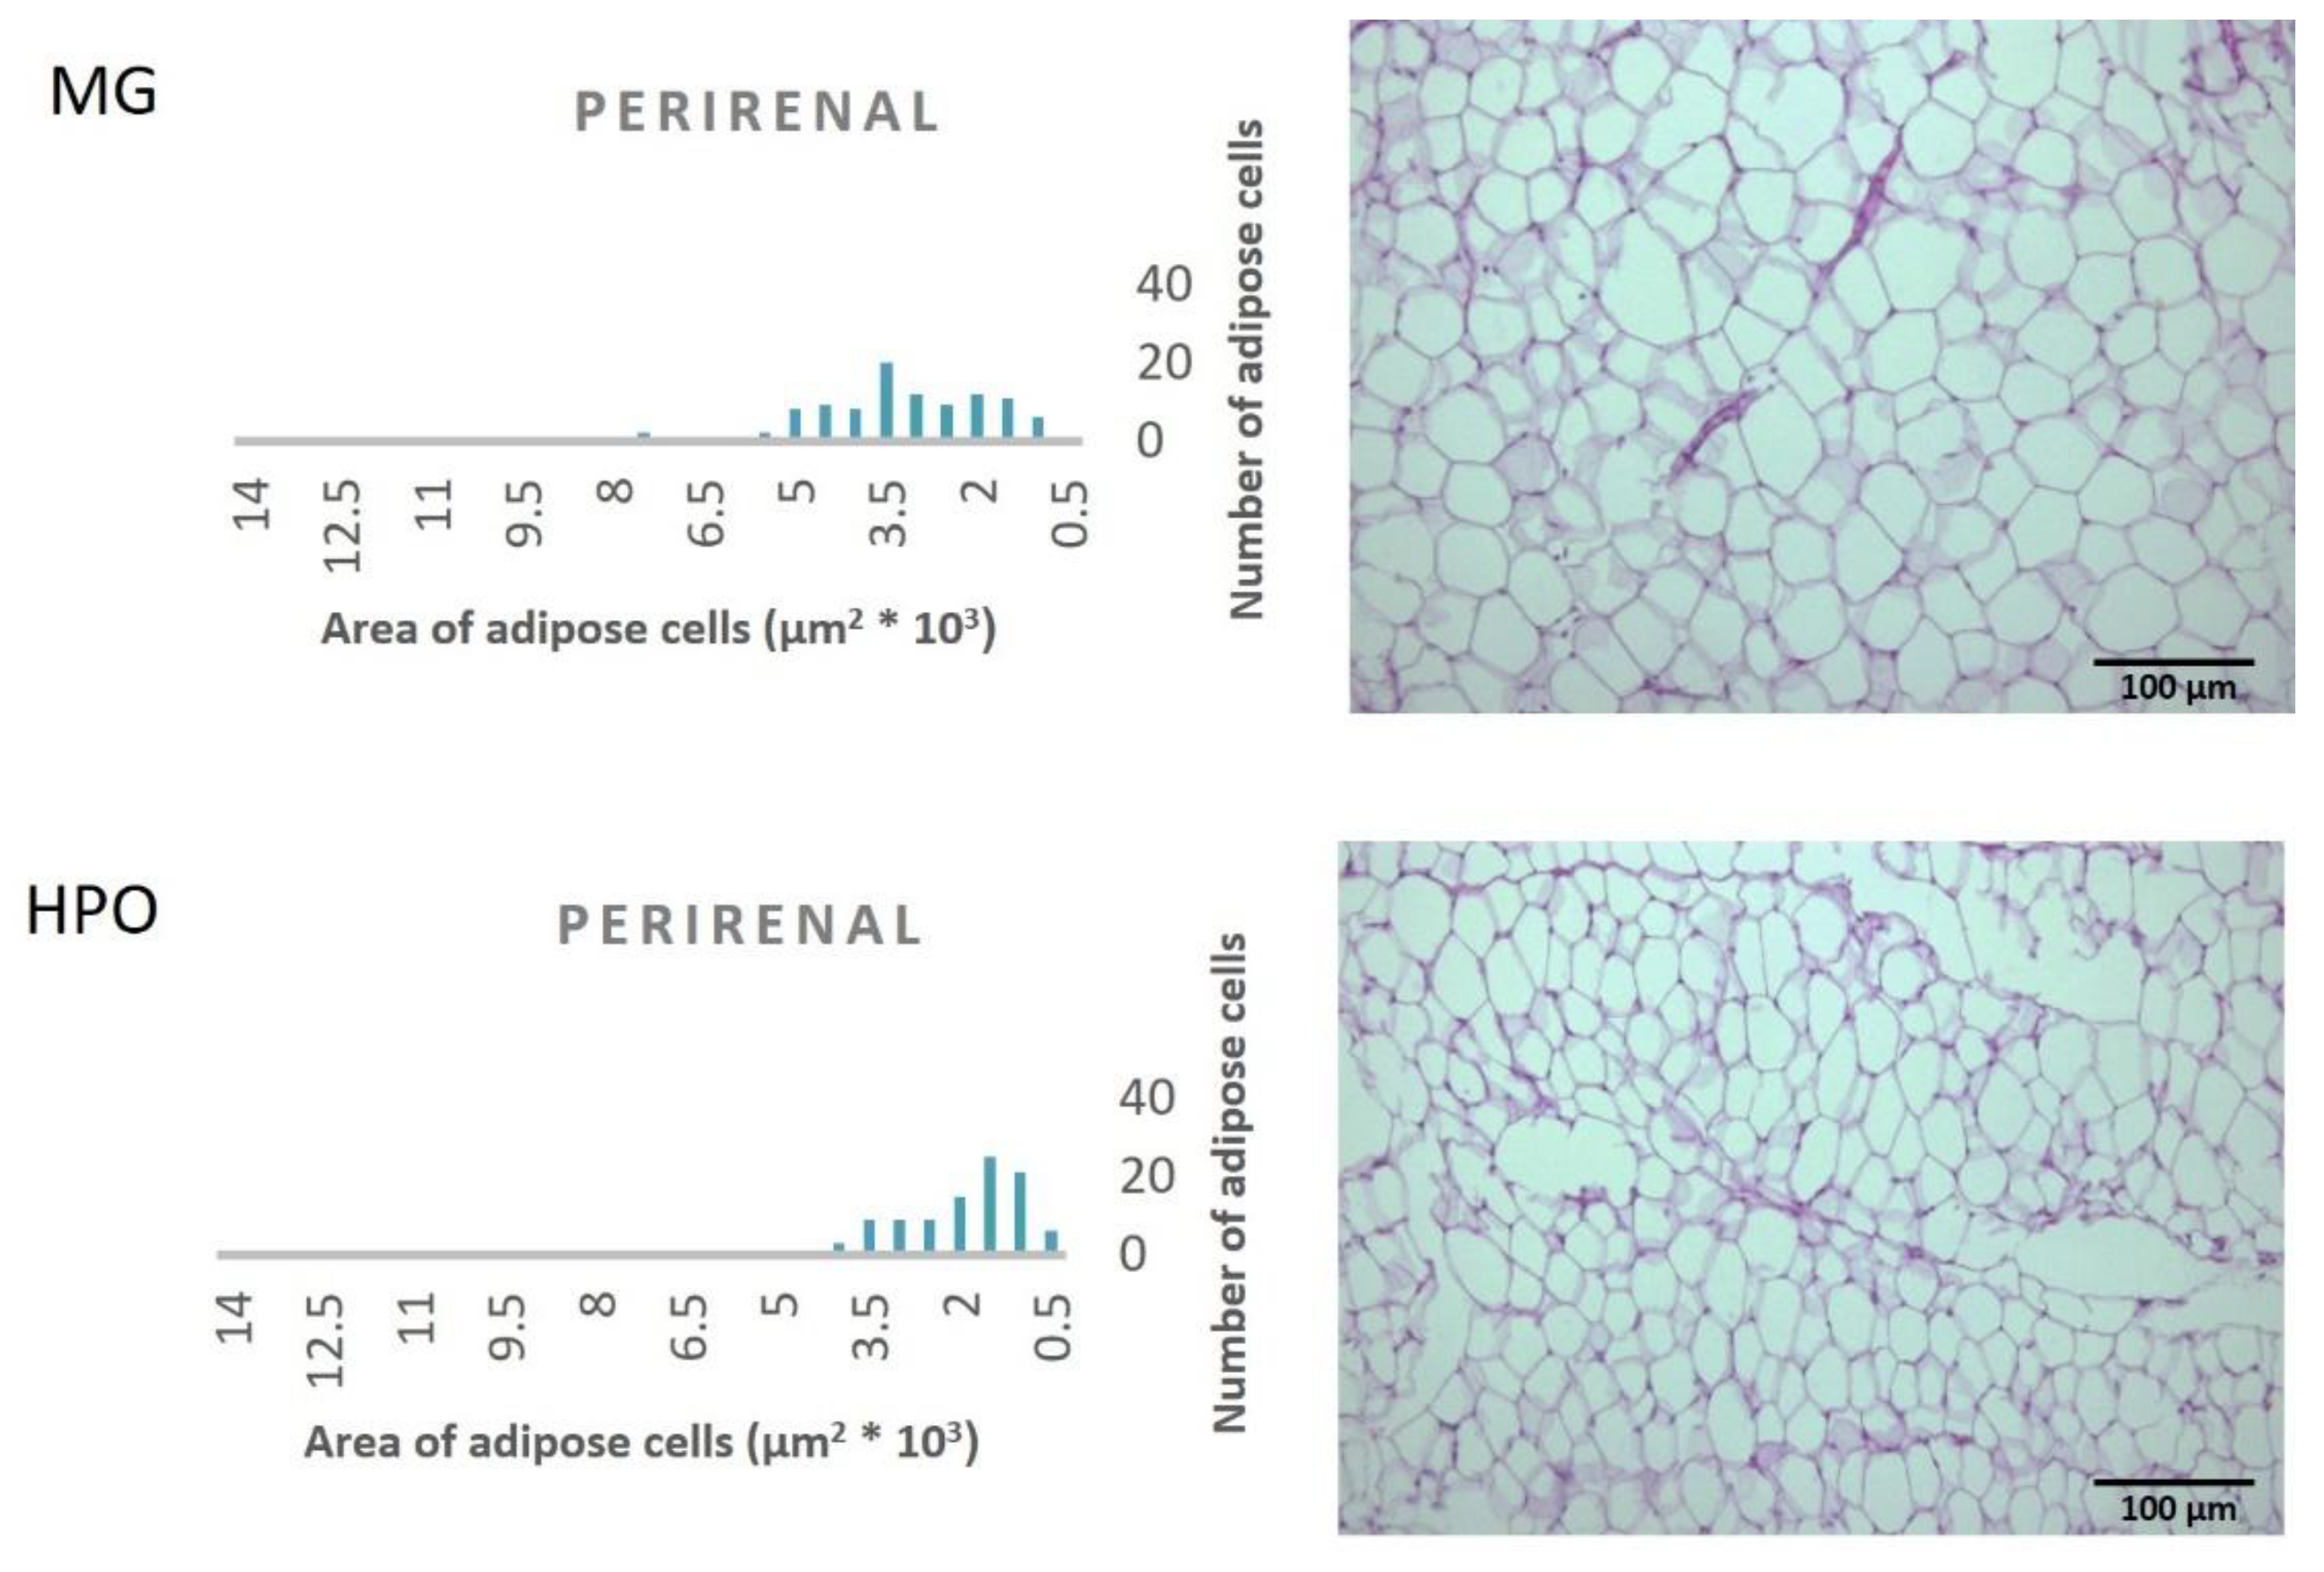
Figure 5.
Effect of different dietary fat and oil on cells area of adipose tissue (mesenteric). HPO, Hydrogenated palm oil; MG, Milk ghee.
Figure 5.
Effect of different dietary fat and oil on cells area of adipose tissue (mesenteric). HPO, Hydrogenated palm oil; MG, Milk ghee.
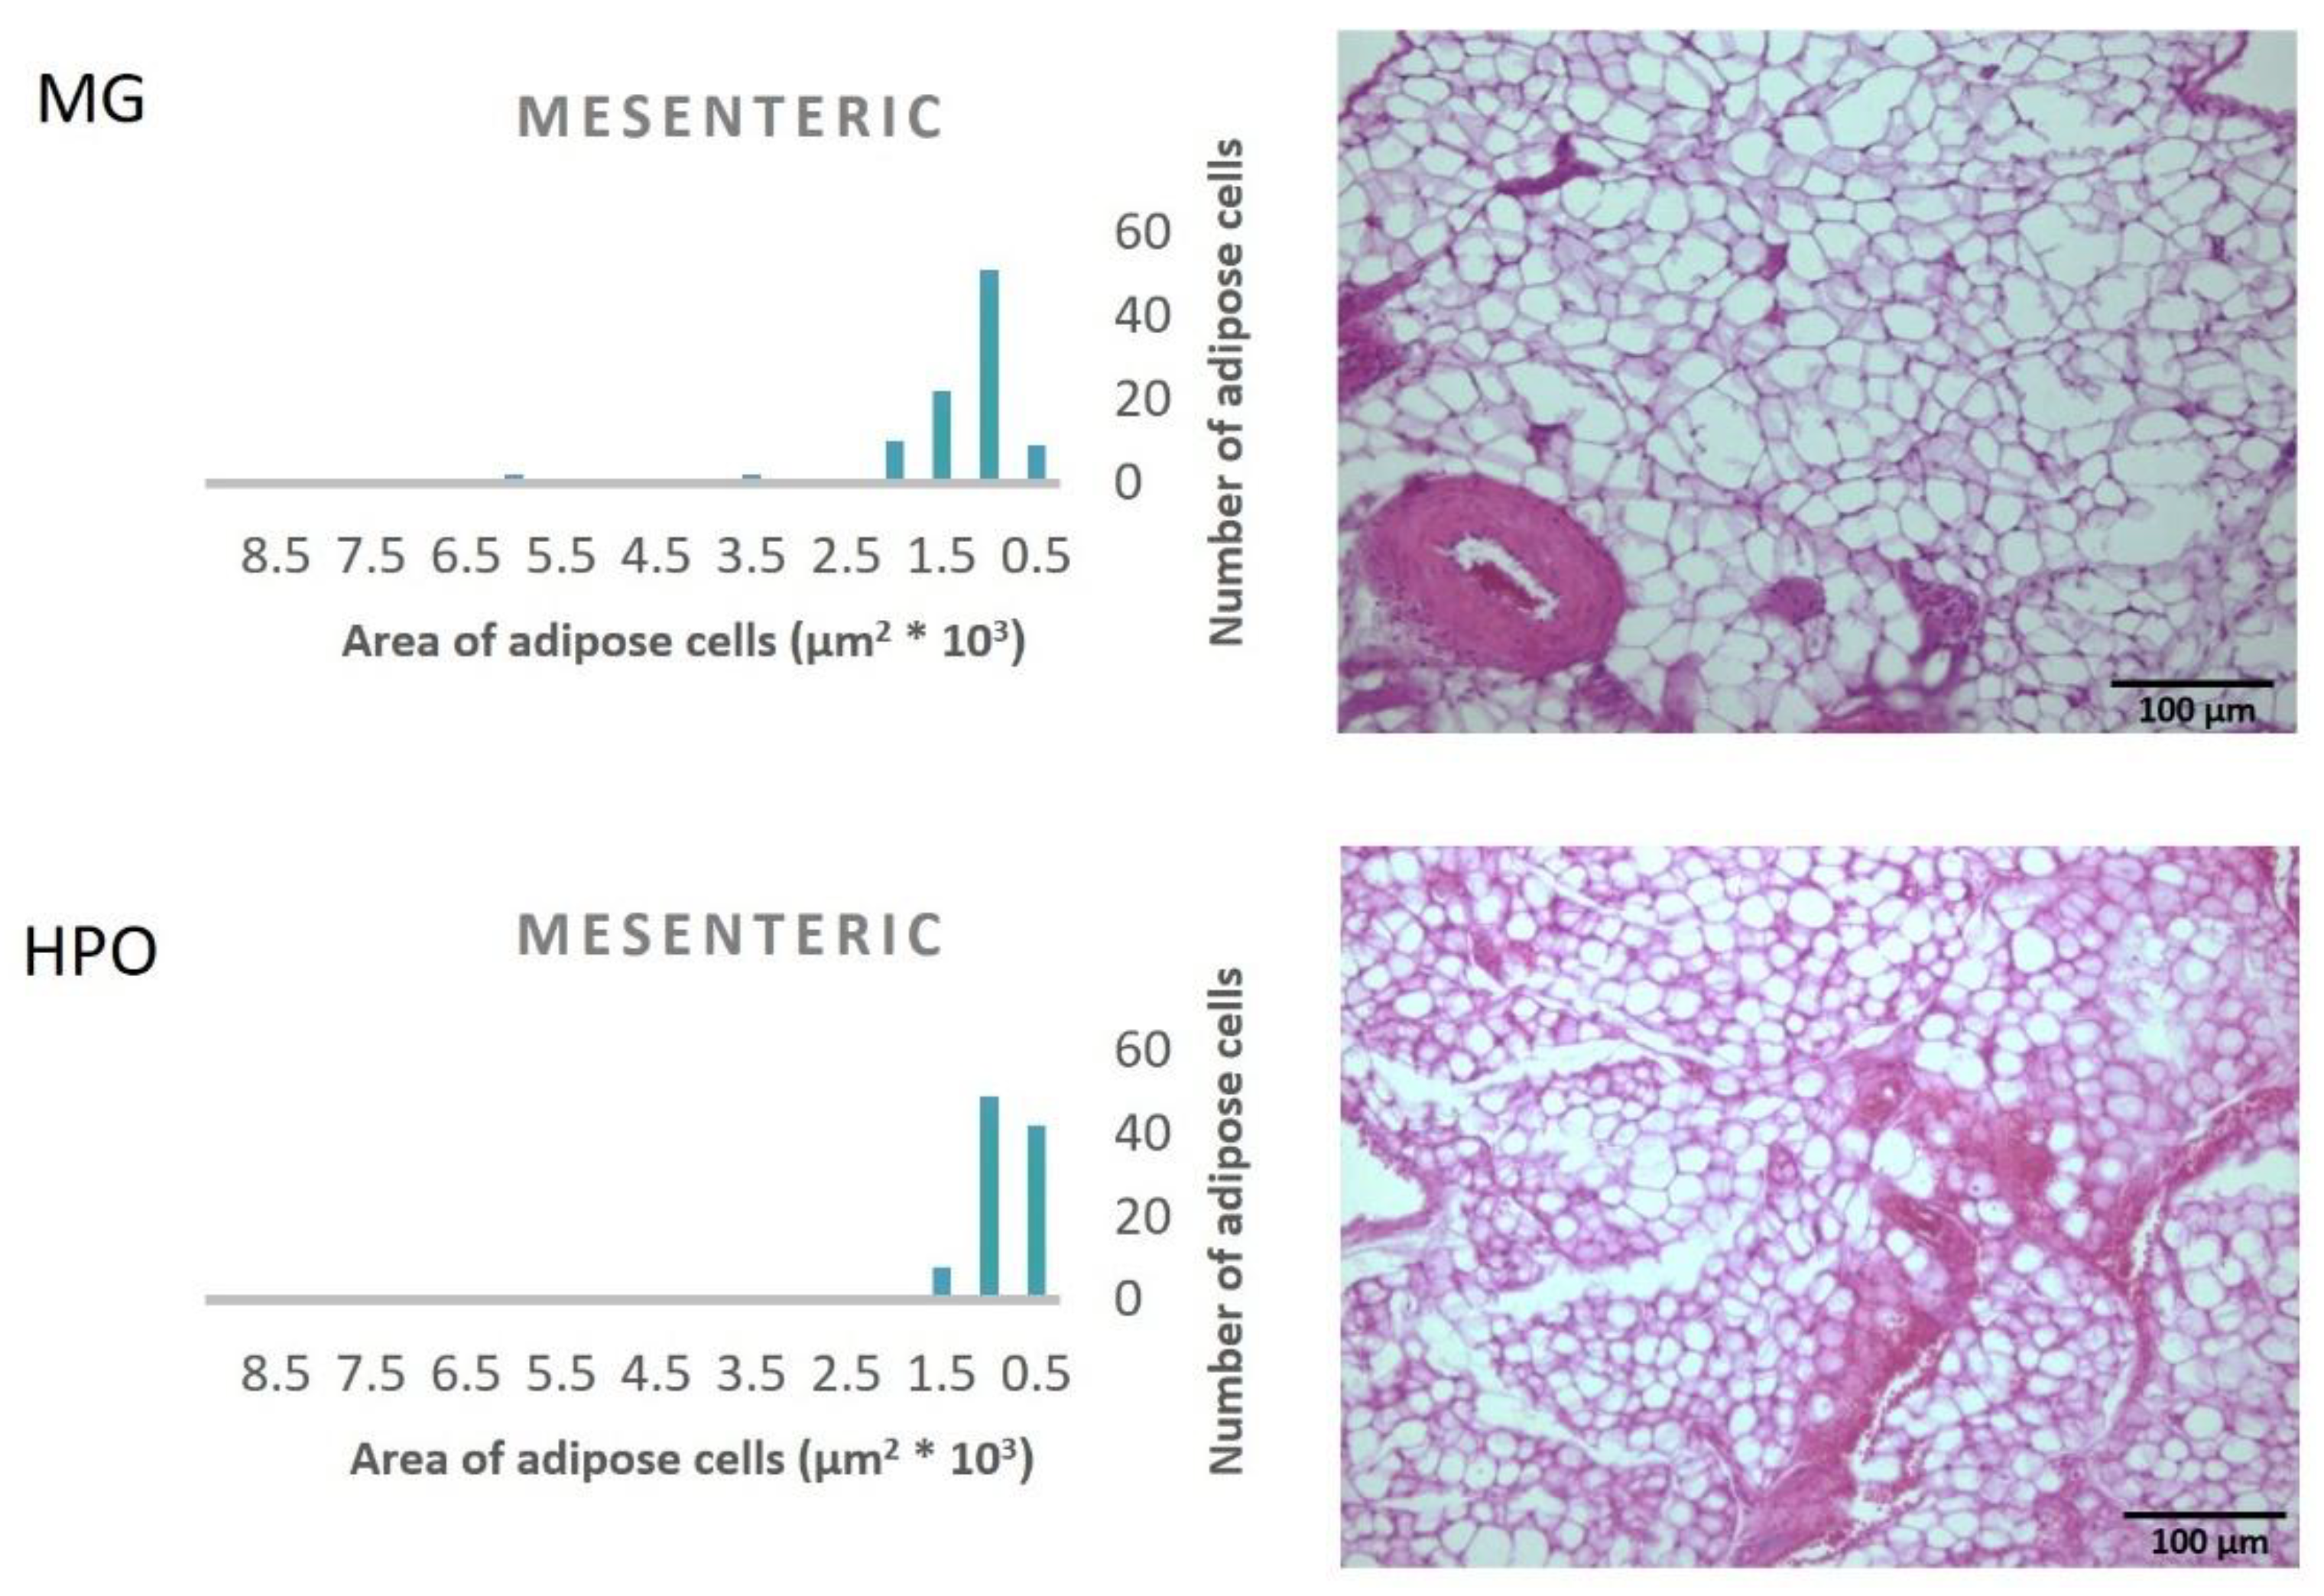

Table 1.
Diet composition (g/100g).
| Ingredient | Milk ghee group | HPO group |
|---|---|---|
| Starch | 50 | 50 |
| Casein | 15 | 15 |
| Oil or fat | 20 | 20 |
| Cellulose | 10 | 10 |
| Minerals mixture | 4 | 4 |
| Vitamins mixture | 1 | 1 |
Hydrogenated Palm oil (HPO).
Table 2.
Fatty acids profile, vitamins and pigments of different types of fat.
| Fatty acids (%) | Milk ghee | HPO |
|---|---|---|
| C4:0 (Butryic) C4H8O2 | 1.48 | - |
| C6:0 (Caproic) C6H12O2 | 1.37 | 0.22 |
| C8:0 (Caprylic) C8H16O2 | 1.02 | 3.15 |
| C10:0 (Capric)C₁₀H₂₀O₂ | 2.63 | 2.90 |
| C11:0 (Undecanoic)C₁₁H₂₂O₂ | 0.05 | 0.03 |
| C12:0 (Lauric)C₁₂H₂₄O₂ | 3.00 | 42.37 |
| C13:0 (Tridecanoic)C₁₃H₂₆O₂ | 0.07 | 0.04 |
| C14:0 (Myristic)C₁₄H₂₈O₂ | 10.64 | 14.41 |
| C14:0 (Myristoleic)C₁₄H₂₆O₂ | 1.18 | - |
| C15:0 (Pentadecanoic)C₁₅H₃₀O₂ | 1.37 | - |
| C15:1 (Cis-10-Pentadecanoic) | 0.02 | - |
| C16:0 (Palmitic)C₁₆H₃₂O₂ | 36.09 | 9.27 |
| C16:1 (Palmitoleic)C₁₆H₃₀O₂ | 2.18 | - |
| C17:0 (Heptdecanoic)C₁₇H₃₄O₂ | 0.78 | 0.03 |
| C17:1 (CIS-10Heptadecanoic) | 0.25 | - |
| C18:0 (Stearic)C₁₈H₃₆O₂ | 8.65 | 26.23 |
| C18:1n9t (Elaidic)C₁₈H₃₄O₂ | 1.84 | - |
| C18:1n9c (Oleic)C₁₈H₃₄O₂ | 22.50 | 0.07 |
| C18:2n6t (Linolelaidic)C₁₈H₃₂O₂ | 0.03 | - |
| C18:2n6c (Linoleic)C₁₈H₃₀O₂ | 3.06 | 0.01 |
| C20:0 (Arachidic)C₂₀H₄₀O₂ | 0.14 | 0.29 |
| C18:3n6 (Y-Linolenic)C₁₈H₃₀O₂ | 0.05 | - |
| C20:1n9 (Cis-11-Eicosenoic)C₂₀H₃₈O₂ | 0.13 | - |
| C18:3n3 (A-Linolenic)C₁₈H₃₀O₂ | 0.35 | - |
| C21:0 (Henecosanoic)C₂₁H₄₂O₂ | 0.66 | - |
| C20:2 (Cis-11,14-Eicosadienoic)C₂₀H₃₆O₂ | 0.03 | - |
| C22:0 (Behenic)C₂₂H₄₄O₂ | 0.05 | 0.04 |
| C20:3n6 (Cis-8,11,14-Eicosatrienoic)C₂₀H₃₄O₂ | 0.09 | - |
| C22:1n9 (Erucic)C₂₂H₄₂O₂ | 0.02 | - |
| C20:3n3 (Cis-11,14,17-Eicosatrienoic) C20H34O2 | - | - |
| C23:0 (Tricosanoic)C₂₃H₄₆O₂ | 0.20 | - |
| C20:4n6 (Arachidonic)acid C₂₀H₃₂O₂ | 0.03 | 0.03 |
| C22:2 (Cis-13,16-Docosadienoic)C₂₂H₄₀O₂ | 0.01 | 0.86 |
| C24:0 (Lignoceric)C₂₄H₄₈O₂ | 0.04 | 0.06 |
| C20:5n3 (Cis-Eicosapentanoic Acid)C₂₀H₃₀O₂ | 0.02 | - |
| C24:1n9 (Nervonic) C24H46O2 | - | - |
| Saturated Fatty Acid | 68.17 | 98.97 |
| Unsaturated Fatty Acid | 31.76 | 0.97 |
| Monounsaturated Fatty Acid | 26.26 | 0.93 |
| Polyunsaturated Fatty Acid | 3.63 | 0.04 |
| Trans Fatty Acid | 1.87 | <LOQ |
| Vitamin A µg/g | 56.15±3.49 | 51.09±7.09 |
| Vitamin D IU/g | 3426.5±926.64 | 4832.55±2133.51 |
| Vitamin E mg/kg | 47.5186±7.17 | 47.5069±1.61 |
| Vitamin K mg/g | 12.304±0.23 | 12.334±0.12 |
| β-carotene mg/kg | 17.3±0.77 | 13.12±4.93 |
| Cholesterol mg/100g | 168.16±5.20 | - |
Fatty acids with (-) means undetectable. Vitamins and pigments are shown as mean ± SD on n=3 replicate per sample.
Table 3.
Chemical properties in different types of oil and fat.
| Parameter | Milk ghee | HPO |
|---|---|---|
| Iodine value gI/100g | 36.19±1.35a | 4.64±0.15b |
| Acid value mg KOH/g | 0.34±0.02b | 0.75±0.00a |
| Saponification value mg KOH/g | 207.97±5.51a | 208.14±6.85a |
| Peroxide value mEq/Kg | 1.28±0.3a | 0.38±0.10b |
Data are shown as mean ± SD on n=3 replicate per sample. Values in the same row with different latter are significant different, p < 0.05.
Table 4.
The effect of feeding on different types of fat on plasma parameters.
| Parameter | Beginning | 24 | |
|---|---|---|---|
| AST 54±3 | |||
| Milk ghee | HPO | ||
| TC mg/dl | 71.35±0.51 | 86.4±0.48a | 81.14±4.32b |
| HDL-C mg/dl | 45..78±0.72 | 51.66±1.09b | 56.33±4.01a |
| LDL&VLDL-C mg/dl | 25.57±1.36 | 34.73±1.57a | 24.80±8.34b |
| Atherosclerosis index | 0.55±0.02 | 0.67±0.04a | 0.45±0.18b |
| TG mg/dl | 31.90±0.73 | 56.20±0.97a | 47.13±5.93b |
| Glucose mg/dl | 102.38±0.20 | 138.62±3.97a | 131.33±2.70b |
| ALT U/L | 21.12±0.92 | 30.24±7.00a | 32.57±3.18a |
| AST U/L | 47.54±3.24 | 41.29±7.64b | 52.64±4.14a |
Data are shown as mean ± SD on n=6 replicate per group. Values in the same row with different latter are significant different, p < 0.05. Hydrogenated palm oil (HPO).
Table 5.
The effect of feeding on different types of fat on body weight, BMI, %BWG, origins weight, adipose tissues and liver lipids.
Table 5.
The effect of feeding on different types of fat on body weight, BMI, %BWG, origins weight, adipose tissues and liver lipids.
| Parameter | Group | |
|---|---|---|
| Milk ghee | HPO | |
| Initial weight g | 94.5±11.50a | 88.5±9.31a |
| Final weight g | 326.0±49.29a | 293.0±23.00a |
| Food intake in the beginning g | 13.21±1.18a | 13.14±1.10a |
| Food intake after 8 weeks g | 19.07±0.78a | 16.50±0.50b |
| BMI | 0.53±0.02a | 0.56±0.04a |
| %BWG | 243.93±9.40a | 231.85±8.14a |
| % Heart | 0.42±0.02a | 0.37±0.06a |
| % Liver | 4.26±0.05a | 4.38±0.18a |
| % Kidney | 0.59±0.01a | 0.60±0.06a |
| % spleen | 0.33±0.04a | 0.34±0.04a |
| % Total adipose tissues | 2.11±0.20a | 1.73±0.42a |
| % epididymal | 0.44±0.02a | 0.35±0.07b |
| % mesenteric | 0.87±0.08b | 0.98±0.12a |
| % retroperitoneal | 0.62±0.23a | 0.30±0.12b |
| % perirenal | 0.17±0.03a | 0.08±0.00b |
| Liver TC mg/g | 46.78±10.35a | 16.97±10.55b |
| Liver TG mg/g | 33.75±9.07b | 110.82±11.37a |
Data are shown as mean ± SD. Values in the same row with different small letter are significant different between groups and capital letter between time, p < 0.05. Hydrogenated palm oil (HPO).
Disclaimer/Publisher’s Note: The statements, opinions and data contained in all publications are solely those of the individual author(s) and contributor(s) and not of MDPI and/or the editor(s). MDPI and/or the editor(s) disclaim responsibility for any injury to people or property resulting from any ideas, methods, instructions or products referred to in the content. |
© 2025 by the authors. Licensee MDPI, Basel, Switzerland. This article is an open access article distributed under the terms and conditions of the Creative Commons Attribution (CC BY) license (http://creativecommons.org/licenses/by/4.0/).
Copyright: This open access article is published under a Creative Commons CC BY 4.0 license, which permit the free download, distribution, and reuse, provided that the author and preprint are cited in any reuse.


