
Submitted:
18 July 2025
Posted:
21 July 2025
You are already at the latest version
Abstract
Thermo-tolerance is a virulence factor responsible for the emergence of new fungal pathogens, including Candidozyma auris (formerly classified as Candida auris, C. auris). It has been shown that in C. auris the thermo-tolerance as well as other virulence traits such as the ability to aggregate, to form pseudo-hyphae, or to produce melanin are strain-specific features. Here, we investigated the impact of different temperatures (25 °C, 37 °C and 42 °C) on the phenotypic and virulence profile of C. auris strain CDC B11903. The results show a positive correlation between the resistance to antifungals and increasing temperature from 25 °C to 37 °C, while no differences were observed between 37 °C and 42 °C, except for Anidulafungin. Furthermore, C. auris growth was impaired at 25 °C as compared to 37 °C and 42 °C. Except for the haemolytic activity, which increased with rising temperatures, no significant differences in phospholipase and biofilm production were found at all tested temperatures. Moreover, the ability to produce melanin and lipases were ob-served only at 37 °C and 42 °C. The capacity to grow as pseudo-hyphae or in clusters and to ad-here to both biotic and abiotic surfaces were observed at all the temperatures tested, with in-creased propensity of C. auris to adhere to abiotic surfaces with rising temperatures. The results underline the thermo-tolerance of C. auris strain B11903 and its increased virulence profile at human body temperature both in physiological (37 °C) and febrile state (42 °C).
Keywords:
Candida
; Candidozyma auris
; thermo-tolerance
; virulence factors
; antimicrobial susceptibility
1. Introduction
Candida species are among the most prevalent human fungal pathogens worldwide and represent the fourth most common cause of hospital-acquired bloodstream infections in the US. Notably, C. albicans, C. glabrata, C. parapsilosis and C. tropicalis account for approximately 90% of cases of candidemia [1]. Recently, C. auris, a new opportunistic Candida species has emerged and quickly spread worldwide [2]. In only 7 years this yeast, which is difficult to treat and displays clonal inter- and intra-hospital transmission, has become widespread across several countries, causing a broad range of healthcare-associated invasive infections, including not only central venous catheter (CVC) correlated candidemia , but also pericarditis, respiratory and urinary tracts infections [3]. Invasive infections by C. auris mostly occur in critically ill patients, especially patients in intensive care units (ICUs) and those undergoing invasive procedures [4]. This fungus is of clinical concern for several reasons: 1) about 90% of the clinically isolated strains are resistant to fluconazole and some strains are resistant to all currently available antifungal drugs, thus dramatically limiting the therapeutic options [5]; 2) although the recently setting up of rapid methods, such as the “Clade-Finder” [6] has been developed to improve the clade determination for C. auris, the correct identification in daily routine is still challenging, often leading to inappropriate management; 3) people can be colonized by C. auris without being aware of it, and such colonization can last for long time and cause epidemic outbreaks in healthcare facilities, although the possible spread in communities cannot be excluded; 4) the ability to evade the host immune system makes this fungus highly virulent [7]; 5) it causes a high mortality rate in the invasive forms (in-hospital mortality rate of C. auris candidemia ranges from 30 to 60%) [5]; 6) it has the ability to form a biofilm that makes the fungus very resistant to disinfectants and therefore particularly hard to clear it also from the surfaces. C. auris strains are classified in 6 distinct clades named after the geographical areas where the strains were first isolated: South Asian (clade I), East Asian (clade II), African (clade III), South American (clade IV), Iran (clade V) and Singapore (clade VI) [8,9,10]. Differences in genetic backgrounds, biochemical characteristics, and antifungal susceptibility patterns make each clade unique [11]. Interestingly, not only antifungal susceptibility pattern seems to be different among the different clades as well as within the same clade, but also its virulence traits, such as thermo-tolerance, halo-tolerance, melanization and the capacity to form pseudo-hyphae seem to be strain-dependent [12,13,14,15,16] . Several aspects of C. auris biology, such as its genomic and phenotypic characteristics, as well as its pathogenicity, have been studied [17,18,19]. Interestingly, a possible role exerted by the natural environment on the emergence and transmission of this fungus has been hypothesized. It has been suggested, for over a decade, that mycoses in mammalians are infrequent, and this is probably due to the struggle of most fungal species to survive and replicate at the temperatures occurring in mammalian bodies [20]. Recently, it has been reported that some fungal species are able to increase their thermal tolerance, therefore becoming able to adapt to warmer temperatures in the environment, and consequently defeating the protection provided by the endothermy to mammalians [21]. For this reason, global warming is becoming a matter of concern, because it exerts selective pressure on some fungal species that may become pathogenic and lead to the emergency of novel fungal diseases. The quick and simultaneous appearance of C. auris in different and distant regions of our planet supports the “global warming emergence hypothesis”, pointing to this species as a prototype of novel fungal pathogens capable of breaking the mammalian endothermal barrier as a consequence of the global warming adaptation [22,23]. Indeed, C. auris is characterized by genetic variability, capacity to form biofilm, resistance to antifungal drugs and several mechanisms (such as thermotolerance and halotolerance) that make this species capable to adapt to changes in its environment [24,25]. In addition, variations in temperature, salinity and pH have been demonstrated to play a role in the capacity of C. auris to cause disease [26,27,28]. As mentioned above, most of the virulence traits of C. auris are strain-specific; hence the specific biological and phenotypical behaviour are peculiar of each single strain and could modify its virulence potential. Here, we studied the biological features, antimicrobial susceptibility and phenotypic characteristics of C. auris strain CDC B11903 in comparison to the C. albicans reference strain B90028, grown at three different temperatures: 25 °C, 37 °C and 42 °C to analyse the impact of temperature on their virulence and phenotypes.
2. Materials and Methods
2.1. Candida Strains and Growth Conditions
The experiments were carried out using the C. auris reference strain CDC B11903 and the C. albicans reference strain B90028. Both strains were grown on Sabouraud Dextrose Agar (SDA, Difco Laboratories, Detroit, MI, USA), supplemented with chloramphenicol (SDA + CAF), for 24 hr at 30 °C. After incubation, Candida yeasts were harvested by washing the slant culture with sterile saline solution (0.85% NaCl; Sigma-Aldrich, Burlington, Massachusetts, U.S.). The cell density of Candida suspensions was estimated by direct cell count, using a Bürker chamber, and adjusted to the desired concentration.
2.2. Antifungal Susceptibility Testing of C. auris CDC B11903
Antifungal susceptibility testing (AFST) was performed using the Thermo Scientific™ SENSITITRE™ YEASTONE™ panels according to manufacturer’s instructions with minor modifications. Briefly, the C. auris CDC B11903 strain, grown on SDA at 30 °C, was sub-cultured at the same condition to ensure purity and viability. To prepare the inoculum, four single colonies of at least 1 mm in diameter were picked, suspended in sterile 0.85% sodium chloride solution, vortexed, and adjusted using a Sensititre™ nephelometer to a transmittance equal to a 0.5 McFarland standard at a wavelength of 530 nm as a stock solution. Further, 20 μL of the stock solution were transferred to the Sensititre™ YeastOne™ (SYO) broth medium, and the final density of the working solution was adjusted to 2 × 10³ CFU/mL by a Bürker chamber, according to Clinical and Laboratory Standards Institute (CLSI) M27M44S guidelines. Then, 100 µL of the stock solution were transferred into each well of the SYO panels and incubated without agitation at 25 °C, 37 °C and 42 °C for 24 hr before visual reading. Evident yeast growth was observed as the colour changed from blue (negative, indicating no growth) to pink (positive, indicating growth). We assessed various antifungal agents, including fluconazole, voriconazole, itraconazole, isavucozonale, posaconazole, caspofungin, micafungin, anidulafungin and amphotericin B. Resistance was determined through tentative breakpoints provided by the CDC [29] for amphotericin B (≥ 2 μg/mL), caspofungin (≥ 2 μg/mL), micafungin (≥ 4 μg/mL) anidulafungin (≥ 4 μg/mL) and fluconazole (≥ 32 μg/mL) while no tentative minimal inhibitory concentration (MIC) breakpoints are available for other azoles. MIC were visually determined as–the lowest concentration that produced visual inhibition, compared to the control growth. The results were expressed as geometric means (GM) of two independent experiments performed in duplicate.
2.3. Growth Determination
C. auris and C. albicans yeast cells in log-phase were counted, resuspended at 1x10⁷ CFU/mL in 5 mL of YPD and then serially diluted in phosphate-buffered saline (PBS, Sigma-Aldrich, Milan, Italy). Twenty μL of each fungal suspension were spotted in a plate of SDA + CAF. The plates were then incubated at 25 °C, 37 °C and 42 °C for 24-48 hr. After incubation, the spot growth was visually assessed.
2.4. Melanin Production
To analyse the melanization capacity of C. auris, we used a protocol described by Smith D.F.Q. and collaborators [15]. Briefly, C. auris cells (1x10⁷ CFU/200 μL/well in triplicate) were cultured at 25 °C, 37 °C and 42 °C for 9 days in a minimal medium containing 15 mM C6H12O6, 10 mM MgSO4, 29,4 mM KH2PO4, 13 mM Glycine, 3M Vitamin B1, 1 mM L-DOPA, at pH 5.5. On days 0, 6, and 9 the plates were visually assessed and photographed. C. albicans grown in the same experimental conditions and in medium alone served as internal controls. The experimental protocol used to test melanization, as well as results from C. albicans, were shown in Supplementary Figure S1A. To quantify signal intensity within the wells, images were analyzed using ImageJ2 software (version 2.14.0/1.54f). Each image was first converted to 8-bit grayscale (Image → Type → 8-bit). A region of interest (ROI) corresponding to the inner area of a well was manually defined. This same ROI was then applied to three different wells within each image to measure the mean gray value (Analyze → Measure), ensuring consistency in the area analyzed. The mean gray value represents the average pixel intensity within the selected region and was used as a quantitative measurement of signal intensity.
2.5. Determination of Haemolytic Activity
The haemolytic activity of C. auris was assessed using the method described by Luo et al. [30]. C. albicans was used as a positive control due to its significant haemolytic activity [30]. Briefly, fungal strains were cultured on SDA at 37 °C for 24 hr, then harvested, washed with sterile PBS, and adjusted to 1x10⁸ cells/mL using a haemocytometer. A 10-μL aliquot was spotted onto SDA supplemented with 3% glucose and 7% fresh sheep blood, followed by incubation at 25 °C, 37 °C and 42 °C in 5% CO₂ for 48 hr. Haemolysis was assessed by observing the formation of a translucent halo around the inoculum under transmitted light (iBright Imaging System, Thermo Fisher Scientific, US). The diameters of the lysis zones and colonies were measured using a computerized image analysis system (iBright Analysis Software, Thermo Fisher Scientific, US). Haemolytic activity (Hz) was determined following the method of Price et al. [31], calculating the ratio of the colony diameter (mm) to the total diameter of the colony plus the halo of the haemolysis zone. Assays were conducted in triplicate, and results were expressed as the mean ± SD of three independent experiments. According to the Hz index, haemolytic activity was classified as follows: Hz = 1.0: no haemolytic activity; Hz = 0.999 – 0.700: low haemolytic activity; Hz = 0.699 – 0.400: moderate haemolytic activity; Hz = 0.399 – 0.100: high haemolytic activity.
2.6. Phospholipase Activity
Extracellular phospholipase activity was evaluated by the egg yolk agar plate method described by Price et al. [31]. Briefly, 10 μL of C. auris suspension (1x10⁸/mL) were spotted onto the egg yolk agar medium (Thermo Fisher Scientific, US) and incubated at 25 °C, 37 °C and 42 °C for 4 days. After incubation, the diameter of precipitation zone around the colony was determined. C. albicans strain B90028 was used as a control strain. Phospholipase activity (Pz index) was calculated by applying the following formula:
On the basis of Pz value, phospholipase activity was classified in 5 types as follows:
Pz value = 1: no phospholipase activity; Pz value = 0.90-0.99: weak phospholipase activity (+); Pz value = 0.80-0.89: poor phospholipase activity (++); Pz value = 0.70-0.79: moderate phospholipase activity (+++); Pz value <0.70: intense phospholipase activity (++++).
2.7. Lipase Activity
Lipase activity of C. auris and C. albicans was performed as previously described, with minor modifications [32]. Briefly, 20 μL of C. auris and C. albicans suspensions (1x10⁸/mL) were spotted onto an agar medium prepared as follows: 10.0 g of Bacto Peptone (BD Biosciences), 5.0 g of NaCl, 0.1 g of CaCl2, 15.0 g of agar in 1000 mL of distilled water. After sterilization by autoclave, the medium was allowed to cool to about 50 °C and 5 mL of Tween 80 (Sigma-Aldrich) were added. The plates inoculated with fungi were incubated at 25 °C, 37 °C and 42 °C for 48 hr. After the incubation the production of lipase (Lz) was expressed as the ratio of diameter of a colony to the total diameter plus zone of precipitation. The results were expressed as the average of the values obtained. The ranges of activity according to the Lz index were established as follows: high: Lz = 1: none; Lz value = 0.90–0.99: weak; Lz value = 0.70– 0.89: moderate; Lz value ≤ 0.69: high [33].
2.8. Germ Tube Test
The ability of C. auris to germinate was assessed using the germ tube test [34]. Briefly, the strain was grown on SDA + CAF for 24 hr at 30 °C. After incubation, three different isolated C. auris colonies of at least 1 mm diameter were inoculated into 0.5 mL of FCS and incubated at 25 °C, 37 °C and 42 °C, respectively. After 3 hr of incubation, 10 μL of Candida cell suspension in FCS were transferred onto a glass slide for examination by a light microscope (Olympus, Carl Zeiss, Oberkochen, Baden-Württemberg, Germany) with 100× magnification objective lenses. Images from one representative experiment carried out at each temperature were captured.
2.9. Filamentous Growth Assay
To evaluate the filamentous growth in C. auris, 2 × 10³ yeast cells were cultured in 96-well plates in 200 μL of RPMI 1640 medium, supplemented with 10% FCS, and incubated at 25 °C, 37 °C and 42 °C for 6 hrs and 24 hr. After incubation, the non-adherent cells were removed by washing the wells three times with PBS and the filamentous growth was visualized microscopically by a light microscope (Olympus, Carl Zeiss, Oberkochen, Baden-Württemberg, Germany) with 40× magnification objective lenses. The images were documented with the accompanied digital camera.
2.10. Biofilm Quantification by Crystal Violet and XTT Assays
To evaluate the in vitro biofilm formation by C. auris at different temperatures, 2x10⁵ fungal cells were cultured in 96-well plates in 200 μL of RPMI 1640 medium (pH 7.0), supplemented with 10% FCS and incubated at 25 °C, 37 °C and 42 °C for 24 hr. After incubation, planktonic C. auris cells were gently aspirated and the wells were washed at least thrice with warm PBS. The biofilm biomass and metabolic activity were evaluated by using crystal violet (CV) staining and 2,3-Bis-(2-Methoxy-4-Nitro-5-Sulfophenyl)-2H-Tetrazolium-5-Carboxanilide (XTT) reduction assay, respectively, as previously described [35]. In all experiments, the absorbance values of the negative control wells (containing no fungal cells) were subtracted from the values of the test wells to account for any background absorbance.
2.11. Human Epithelial Cells and Infection Protocol
In the experiments involving epithelial cell infection, two different human cell lines were employed. The urothelial cell line, T24 cells (Cytion 300352), were cultivated in Dulbecco Modified Eagle Medium/Nutrient Mixture F-12 (DMEM-F12) (Sial, Italy) supplemented with L-glutamine (2 mM), penicillin (100 U/mL) (Euroclone SpA, Italy), streptomycin (100 μL/mL) (Euroclone SpA, Italy) and 10% Fetal Bovine Serum (FBS, Sial, Italy), and incubated at 37 °C + 5% CO2. The pulmonary cell line, BEAS-2B cells (ATCC CRL-3588) were cultivated in DMEM High Glucose (Sial, Italy) supplemented with L-glutamine (2 mM, Sial, Italy), penicillin (100 U/mL) (Euroclone SpA, Italy), streptomycin (100 μL/mL) (Euroclone SpA, Italy), and 10% Fetal Bovine Serum (FBS, Sial, Italy), and incubated at 37 °C + 5% CO2. Both cell lines were kept viable by subculturing twice a week.
For generating epithelial monolayer, 5x10⁵ cells were seeded into the wells of a 24-well plate (SPL Life Sciences, Korea) (1 mL/well) and incubated at 37 °C + of 5% CO2 (48 hr for T24 cells, 24 hr for BEAS-2B cells). Before being infected, epithelial monolayers were washed with Phosphate-Buffered Saline (PBS, Sial, Italy), and fresh medium supplemented with 5% FBS was added to each well. Cells were infected with 5x10⁵ CFU of fungi (Multiplicity of Infection, MOI, 1) obtained from a YPD broth fungal culture grown overnight at 37 °C under agitation. After the infection, the plate was incubated at 37 °C + of 5% CO2.
2.12. Adhesion onto Abiotic and Biotic Substrates
The C. auris and C. albicans adhesion to abiotic and biotic surfaces was evaluated at different temperatures. To assess the adhesion on abiotic surface, 1 mL of Candida suspension (5x10⁵ CFU/mL) in YPD broth (Condalab, Spain) was seeded into the wells of a 24-well plate in triplicate. The plate was incubated at 25 °C, 37 °C, or 42 °C for 90 min. Subsequently, the medium was removed, and the wells were washed with PBS to remove non-adherent fungi. Fungal cells adhered to the plastic were detached by adding Soybean Casein Digest Lecithin Polysorbate 80 Medium (SCDLP-80, Biotec, Dueville, Italy) and vigorously pipetting. Samples were diluted, plated onto Sabouraud Dextrose Agar (SDA, Oxoid, UK) and incubated at 37 °C for 24/48 hr. Colony Forming Units (CFU) were counted, and the percentage of adhesion was calculated considering the inoculum as 100%.
T24 or BEAS-2B epithelial cell monolayer was infected with 5x10⁵ CFU (MOI 1) of C. auris or C. albicans and incubated at 37 °C or 42 °C for 90 min. Then, the medium was removed, and non-adherent fungal cells were removed through a PBS wash. Epithelial cells were lysed by adding 1 mL of 0.2% Triton X-100 (Sigma Aldrich, USA) to the wells and pipetting. Samples were diluted, plated onto SDA, and incubated at 37 °C for 24-48 hr. Colony Forming Units (CFU) were counted, and the percentage of adhesion was calculated as above.
2.13. Statistical Analysis
The Shapiro-Wilk test was used to analyse the distribution of data within experimental groups. All statistical analyses were performed by using GraphPad Prism 10.3 software.
Statistical differences between groups were assessed by One-Way ANOVA followed by Tukey’s multiple-comparisons test or by Two-Way ANOVA followed by Sidak’s multiple-comparison test.
Values of *p<0.05, **p<0.01, ***p<0.001 and ****p<0.0001 were considered statistically significant.
3. Results
3.1. Impact of Temperature in C. auris MIC
First, we evaluated the antifungal susceptibility of C. auris at 25 °C, 37 °C and 42 °C. The data shown in Table 1 indicate that the strain was sensitive to all the tested antifungal agents. Moreover, the results highlight the influence of temperature on the antifungal susceptibility profile of C. auris. In fact, the susceptibility to all the antifungals tested was significantly reduced from 25 °C to 37 °C and it remained stable at temperatures ranging from 37 °C to 42 °C, except for anidulafungin, for which no significant differences were observed in MICs values at temperatures between 25 °C and 37 °C.
3.2. Impact of Temperature on C. auris Growth
Previous studies reported that the optimal range of temperatures for C. auris is between 37 °C and 40 °C, similarly to C. albicans [2]. However, some C. auris isolates have been shown to grow at temperatures as high as 42 °C, a condition that inhibits the growth of C. albicans [36]. In the present study, we evaluated the impact of different temperatures on the growth of C. auris reference strain CDC B11903 and we compared it to the growth of C. albicans B90028 under the same experimental conditions. The temperatures were selected to mimic real conditions, i.e., temperatures easy to find in nature (25 °C) and anthropic environments, including normal human body temperature (37 °C), and the temperature occurring in patients with severe febrile status (42 °C) in response to an infectious disease. By spotting C. auris on SDA + CAF at different concentrations, we could not detect any visible difference in fungal growth for the concentration of 1x10⁷ CFU/mL, irrespective of the growing temperature. However, by reducing the fungal inoculum we observed a growth impairment at 25 °C (and to a lesser extent at 42 °C), as compared to the optimal growing temperature of 37 °C. Notably, C. auris growth was impaired at 25 °C starting from the concentration of 105 CFU/mL while C. auris growth seemed to be almost unchanged at 42 °C even at low inoculum (i.e., down to 103 CFU/mL). Conversely, as expected, C. albicans showed to be most hindered in growing at 42 °C (Figure 1).
3.3. Impact of Temperature in C. auris Melanization
Melanin is a black-brown pigment typically produced following enzymatic oxidation of aromatic precursors and it promotes fungal virulence by different mechanisms. Literature reports that several C. auris strains are able to produce melanin [15]. To evaluate such capacity by C. auris CDC B11903, the fungus was cultured in a specific medium containing melanin precursor, at 25 °C, 37 °C and 42 °C. The results in Figure 2A,B show that C. auris was able to produce melanin after 6 and 9 days only at 37 °C and at 42 °C, with no significant differences between these two temperatures. No melanin production was observed at 25 °C. Moreover, as expected, no melanin production was observed for C. albicans, used as a negative control, under the same experimental conditions (Supplementary Figure S1B).
3.4. Impact of Temperature on C. auris Haemolytic Activity
As shown in Figure 3, C. auris exhibited haemolytic activity at all three tested temperatures with significantly larger halos observed at 37 °C and 42 °C, as compared to 25 °C. Notably, two types of haemolysis were observed in both yeasts: a translucent ring indicative of β-haemolysis, detected at all three temperatures, and a greenish-black halo suggestive of α-haemolysis, observed only at 37 °C and 42 °C. To quantify haemolytic activity, the haemolytic index (Hz) was calculated as the ratio between the diameter of the colony and the total diameter of the colony plus halo. As shown in Table 2, C. auris exhibited low haemolytic activity at 25 °C, moderate at 37 °C and high at 42 °C. As expected, C. albicans demonstrated high haemolytic activity at all the tested temperatures.
3.5. Impact of Temperature on C. auris Phospholipase and Lipase Activity
Phospholipase activity plays an important role in Candida pathogenicity [37]. In the present work we evaluated the impact of temperature on extracellular phospholipase activity of C. auris CDC B11903 in comparison to C. albicans B90028. As reported in Figure 4 and in Table 3, C. auris displayed a moderate phospholipase activity at all three tested temperatures, as suggested by the Pz values of 0.78 at 25 °C and 37 °C and 0.77 at 42 °C. Differently, C. albicans did not show any phospholipase activity irrespective of the temperature tested.
Concerning the lipase activity, our results show that, after 48 hr of culture, both C. auris and C. albicans exert high lipase activity at 25 °C. The lipase activity was maintained at 37 °C both for C. auris (moderate activity) and C. albicans (high activity). Conversely, while C. auris showed lipase production also at 42 °C (moderate activity), C. albicans failed to produce lipase at 42 °C (Figure 5 and Table 4).
3.6. Impact of Temperature on C. auris Germ Tube Formation
The morphological transition of C. albicans from yeast to filamentous form is influenced by several laboratory conditions, including temperature of 37 °C and the presence of serum, both mimicking the host tissue environment occurring in mammals [38]. Here, we evaluated the ability of C. auris strain CDC B11903 to germinate in the presence of 100% FCS under the temperatures of 25 °C, 37 °C and 42 °C. The germination is assessed by evaluating both single cells and clusters. As shown in Figure 6, C. auris failed to produce germ tubes under the above-mentioned conditions.
3.7. Impact of Temperature on C. auris Pseudohyphal Formation
The phenotypic switching from yeast to filamentous form as true hyphae or pseudohyphae is a key virulence factor in C. albicans and it is influenced by environmental conditions, both in vitro and in vivo. Unlike C. albicans, the pseudo-hyphal is the only filamentous morphology assumed by C. auris in in vitro experimental models, even under genotoxic stress conditions, while parallel-sided true hyphae have never been observed [39]. In addition, the capability of C. auris to switch from yeast to pseudo-hyphal filamentous form is strain specific, thus suggesting the heterogenous nature of this species [38]. In the present study we evaluated the impact of different temperatures (25 °C, 37 °C and 42 °C) on the capability of C. auris CDC B11903 to grow as pseudo-hyphal form. The microscope images reported in Figure 7 show that, under our experimental conditions, the temperature did not influence the capability of C. auris to form pseudo-hyphae. Indeed, the filamentous growth was quite similar after 6 and 24 hr exposure to all temperatures tested and more evident in C. auris single yeasts than in clustered cells. Moreover, the images also show the ability of C. auris CDC B11903 to coaggregate after 24 hr of culture under the above-mentioned experimental conditions and at all the temperatures tested.
3.8. Impact of Temperature on C. auris Biofilm Formation and Metabolic Activity
C. auris CDC B11903 biofilm production was evaluated in terms of total biomass by CV staining and metabolic activity using the colorimetric XTT reduction assay. Data show that there were not statistically significant differences in C. auris biofilm biomass irrespective of the temperature (Table 5). Contrary, the metabolic activity of the biofilm has shown to be temperature-dependent, as suggested by the higher OD values reached at 37 °C, compared to those observed at 42 °C and 25 °C (* p<0.05 and ** p<0.01, respectively) (Table 5).
3.9. Adhesion Capacity of C. auris to Abiotic Surfaces and Epithelial Cells at Different Temperatures
We next examined how temperature variation impacts on C. auris adhesion to different substrates: abiotic surfaces and epithelial cells such as the human bronchial epithelial cell line BEAS-2B and the T24 urothelial cell lines. Our results show that C. auris exhibited an increased capacity to adhere to abiotic surfaces at all the temperature tested, compared to C. albicans. Notably, its adhesion capacity increased with rising temperature, from 25 °C to 37 °C, and remained constant up to 42 °C (Figure 8A). The temperature did not affect C. auris adhesion to epithelial cells, such as T24 urothelial cells (Figure 8B) and BEAS-2B cells (Figure 8C) Indeed, no statistically significant differences were observed in C. auris adhesion between 37 °C and 42 °C. Furthermore, no significant differences were observed between C. auris and C. albicans adhesion to epithelial cells at both temperatures.
4. Discussion
Survival and growth at physiological body temperature in humans are essential prerequisites for microbial invasion and pathogenicity. Most fungal pathogens are adapted to environmental conditions and thus they do not grow well at relatively high temperatures, as those occurring within the human body, both in physiological conditions (37 °C) or in severe febrile status (over 40 °C). Interestingly, C. auris strains differ in their growth and virulence factors in vitro. The ability of some C. auris isolates to grow at 37 °C and 40 °C appears to be similar to that of C. albicans, and certain isolates are able to grow even at 42 °C [40]. In this study we have evaluated the impact of different temperatures on biological properties and antifungal susceptibility of C. auris reference strain CDC B11903. This strain has been found to grow better at temperatures ranging from 37 °C to 42 °C rather than at 25 °C. Moreover, no difference in biofilm formation has been observed at any of the temperatures tested in terms of total biomass production; however, a reduction in biofilm metabolic activity has been observed both at 25 °C and at 42 °C, with respect to 37 °C. The 25 °C temperature has shown a negative impact on C. auris growth, when the fungal inoculum had been reduced. This is in line with the data obtained by the antifungal susceptibility test, which show lower values of MIC at 25 °C as compared to 37 °C, while no difference in MIC values has been observed between 37 °C and 42 °C (except for anidulafungin, whose MIC value has increased at 42 °C). These data suggest that in our experimental condition C. auris CDC B11903 has the capacity to tolerate high temperatures when exposed to drastic increases. On the other hand, temperatures lower than 37 °C seem to have a more negative impact on the fungus, since no growth has been observed at inoculum below 1x10⁵ CFU/mL and the MIC values are lower.
A growing number of emerging cases of C. auris have been reported with fungal resistance to the standard antifungal treatments including azoles, echinocandins, and polyenes, making these infections difficult to treat. In the United States, about 90% of C. auris isolates have been reported to be resistant to fluconazole, about 30% to amphotericin B, and less than 2% to echinocandins [41,42]. Fungal resistance is one of the paramount points in antifungal stewardship. It has been demonstrated that C. albicans is more susceptible to caspofungin at 37 °C than at 30 °C, in a calcineurin-dependent pathway and not related to FKS, CHS, or CHT genes, all involved in echinocandins resistance [43]. Based on this evidence, we have performed AFST at the three different temperatures of 25 °C, 37 °C and 42 °C for C. auris CDC B11903. First, the Sensititre™ YeastOne™ YO10 AST Plate (Thermofisher, Milan, Italy) investigation, with our minor modifications, has worked at all the tested temperatures, supporting the employment of this method for C. auris AFST profile in clinical and research settings, as previously reported [44]. Regarding the obtained MIC, our results show that the strain CDC B11903 does not exhibit any resistance to the tested drugs. Indeed, variations in MIC have been highlighted at the selected temperatures, with the lowest values observed at 25 °C for all the tested antifungal drugs and increasing values at 37 °C and 42 °C. Interestingly, these results are in contrast to what had been reported for C. albicans [43]. Recent pharmacokinetic/pharmacodynamic analysis of C. auris in a mouse model of infection indicates that, under standard dosing, the breakpoint for amphotericin B should be 1 or 1.5, i.e., values similar to those determined for other Candida species [45]. Therefore, isolates with a MIC ≥ 2 should now be considered resistant. In our case, C. auris exhibits an AmB MIC of 0.5 at 25 °C and at 37 °C, while the high temperature of 42 °C results to have increased the MIC value to 1 µg/mL. The temperature-dependent increase in AmB MIC for C. auris suggests a potential reduction in efficacy under febrile conditions, thereby challenging the reliability of current breakpoints, particularly for clinical isolates of C. auris and in regions where AmB resistance or elevated MICs have been reported. This underscores the need for susceptibility testing that better reflects clinical realities, especially in immunocompromised patients. Antifungal tolerance is often associated with metabolic dormancy, a reversible low-activity state that reduces drugs efficacy [46,47,48]. Thus, lower MIC at 25 °C may reflect a decrease in metabolic activity and a downregulation of targets like 14-demethylase, β-(1,3)-D-glucan synthase, and ergosterol biosynthesis enzymes. Indeed, it has been suggested that higher temperatures accelerate fungal growth and increase susceptibility to drugs targeting metabolism and cell division (e.g., fluconazole, ketoconazole, 5-fluorouracil) [49]. Similarly, it has been reported that elevated temperatures enhance lipid synthesis, potentially sensitizing fungi to amphotericin B and sterol-inhibiting azoles [50]. In addition, higher temperatures promote azole uptake through increased membrane solubility [51,52]. Differently, our data show that while metabolic activity peaked at 37 °C, MIC remained stable compared to 42 °C, suggesting that thermally induced tolerance mechanisms, rather than metabolic output alone, may drive resistance phenotypes.
The capacity of C. auris strain CDC B11903 to tolerate high temperatures is only one of the characteristics that delineates its capacity to behave as an opportunistic pathogen. Several non-pathogenic fungi can grow at temperatures around 37 °C. Indeed, all the fungal species belonging to the mycobiome are tolerant to the human body temperature and only a few of them cause disease and mostly in severely immunocompromised subjects [53]. It follows that this prerequisite must be owned also by those fungi that have adapted to grow within the human body. Hence, the thermotolerance displayed by C. auris strain CDC B11903 is not sufficient, per se, to define it as a potentially opportunistic fungal pathogen [54]. It is acknowledged that what keeps harmless the members of the commensal mycobiota, in comparison to opportunistic fungal pathogens, is not the capacity to grow at body temperature, but rather the lack of additional virulence factors. Therefore, we analysed the presence of virulence traits of C. auris CDC B11903 strain that are expressed at body temperature. The production of melanin is an important virulence trait of several C. auris strains [15]. Here, we show for the first time that C. auris strain B11903 can produce melanin when grown at 37 °C and 42 °C, further suggesting its adaptation to the human body temperature: indeed, in such condition this strain can survive, grow and express its virulence factors. Fungal melanin pigments have strong antioxidant properties that allow them to resist oxidative damage caused by the host immune cells, such as macrophages and neutrophils oxidative bursts [55]. In addition, melanin can bind to and inactivate antimicrobial peptides and antimicrobial enzymes that the host typically uses to degrade and kill fungi during infection, as well as antifungal drugs used to treat infections [56,57,58]. Fungal melanin, located in the fungal cell wall, can alter cell wall composition and physically mask pathogen-associated molecular patterns (PAMPs) that would otherwise be recognized and bound by host’s pathogen recognition receptors (PRRs). These changes may lead to diminished recognition by host immune cells. Hence, our results point to a key role exerted by melanin at 37 °C and 42 °C that increases resistance to fungal drugs and immune responses.
One of the key virulence attributes of pathogenic fungi, including Candida species, is their ability to acquire nutrients and breach host barriers through the secretion of hydrolytic enzymes and toxins. In this study, we have assessed the production of haemolysins, phospholipases, and lipases by C. auris CDC B11903 at different temperatures representative of environmental and host conditions. The haemolytic capacity of C. auris is evident at all the tested temperatures, though more pronounced at 37 °C and 42 °C with respect to 25 °C, as shown by the wider haemolytic halos. Both β-haemolysis and α-haemolysis have been detected, with the latter emerging exclusively at the higher temperatures. This dual haemolytic profile has been reported also in other clinical isolates of C. auris, particularly under host-mimicking conditions [59] and it may reflect an adaptive response to evade host immune defences through the lysis of red blood cells. However, unlike C. albicans, which displays strong haemolytic activity at all temperatures, the performance of C. auris at 25 °C remains low, suggesting that its full virulence potential may require physiological or febrile host temperatures. This observation supports the hypothesis that temperature acts as a signal for virulence activation, as previously demonstrated in C. albicans [60]. Further investigations are required to elucidate the nature of the haemolytic factor, specifically to determine whether it is enzymatic or toxin-mediated.
Phospholipase activity, a well-known virulence trait associated with host cell membrane disruption and tissue invasion, has been detected consistently in C. auris CDC B11903 across all the tested temperatures. The Pz values, which remain in a narrow range (0.77–0.78), indicate a moderate but stable phospholipase production. This thermostability suggests that C. auris maintains a constitutive phospholipase expression regardless of environmental conditions, including host-relevant febrile temperatures. Such stability may represent an adaptive advantage, particularly during colonization and systemic infection, where fluctuating temperatures could otherwise impair enzymatic virulence responses. Interestingly, previous studies have reported inconsistent phospholipase activity in C. auris clinical isolates, with some strains exhibiting little to no detectable enzymatic production [40,61]. Our findings, therefore, contribute to the growing evidence that phospholipase expression in C. auris is strain-dependent and not uniformly absent or negligible as initially suggested in early characterizations of this species. The persistence of phospholipase activity across physiological and stress temperatures in this strain supports its potential contribution to pathogenicity, particularly in niches where host membranes represent a primary barrier to fungal invasion.
Moreover, lipase activity appears to be influenced by temperature in C. auris, with a high and moderate lipase production at 25 °C and 37 °C, respectively, which is also maintained at 42 °C. These results align with previous findings indicating that lipase expression is regulated under host-mimicking conditions and may play a role in skin colonization and biofilm formation [61]. Conversely, C. albicans does not show lipase activity at 42 °C, confirming that the expression of this enzyme is highly variable and context-dependent, even among established pathogens. The lipase activity of C. auris also at febrile-range temperatures may confer this species a selective advantage during systemic infection, or in the colonization of warm, lipid-rich niches such as skin folds. Moreover, given the high lipophilicity of human skin and medical devices, this enzymatic activity may underlie the persistence and transmission of C. auris in healthcare settings. Nonetheless, our data highlight the importance of not underestimating enzymatic virulence factors in C. auris, which may play a more active role in pathogenesis than previously recognized.
Moreover, our results show that temperatures ranging from 25 °C to 42 °C, do not substantially affect pseudo-hyphae formation in C. auris. Global warming has been proposed as a contributing factor in the generation and dissemination of high thermotolerant C. auris strains [62,63,64]. In line with previous studies, the C. auris strain CDC B11903 has been unable to form true hyphae, when cultured in RPMI 1640 supplemented with 10% FCS, or in the presence of 100% FCS. Under these experimental conditions, only pseudo-hyphae, stemming from single yeast cells rather than from cells gathered in clusters have been detected. The production of pseudo-hyphae as a virulence factor in planktonic cells is supported also by previous in vivo experimental models showing that non-aggregating isolates of C. auris exhibit more pathogenicity than aggregating isolates; in addition, such non-aggregating isolates have been shown to be even more virulent than C. albicans [14]. On the other hand, strains capable of forming aggregates have been shown to be more resistant to disinfectants, azole antifungals and immune responses. In addition, they are characterized by a higher ability to colonise (and persist on) biotic and abiotic surfaces. Here, we show an aggregative profile for C. auris CDC B11903. Both pseudo-hyphae formation and aggregative capacity are not modified by changing the temperature from 25 °C to 42 °C.
Adherence to both abiotic and biotic surfaces constitute a pivotal early event in fungal pathogenesis, enabling colonization, biofilm development, and persistence within host tissues and healthcare settings. In this study, C. auris CDC B11903 exhibits significantly higher adhesion capacity to abiotic substrates than C. albicans throughout all the tested temperatures, with adhesive capacity increasing from 25 °C to 37 °C and stabilizing at 42 °C. This thermally responsive trend suggests optimal activation of adhesion-related mechanisms at human body temperature, with maintained performance under febrile conditions, reflecting the induction of adhesins or a cell wall restructuring. The enhanced adhesion under both normothermic and hyperthermic conditions may facilitate early colonization and biofilm establishment, complicating eradication efforts due to inherent antifungal tolerance.
Furthermore, C. auris adheres efficiently to T24 urothelial and BEAS-2B bronchial epithelial cells at both 37 °C and 42 °C, indicating a broad thermotolerance in host-surface interactions. This epithelial tropism may partially explain its frequent detection in urinary and respiratory sites, particularly among critically ill or immunocompromised individuals. Collectively, these observations challenge earlier assumptions regarding the limited virulence of C. auris, instead revealing a consistent and temperature-resilient adhesive phenotype that may act synergistically with enzymatic activity and biofilm formation to promote infection.
Overall, these findings provide a comprehensive view of the virulence arsenal of C. auris CDC B11903 and reinforce the notion that temperature-dependent regulation of specific traits—such as enzyme secretion and melanin production—may critically shape the pathogenic behaviour of this emerging fungal pathogen.
5. Conclusions
Our study demonstrates that C. auris CDC B11903 expresses several virulence factors in a temperature-dependent manner. While it seems to be more susceptible to antifungal drugs and less pathogenic at 25 °C, when exposed at 37 °C and at 42 °C it is able to increase its virulence. Further studies are warranted to explore the genotype-phenotype correlation and peculiar proteomic signatures at different environmental conditions.
Supplementary Materials
The following supporting information can be downloaded at the website of this paper posted on Preprints.org.
Author Contributions
“Conceptualization, R.G., C.M. and E.P.; methodology, T.C., N.P., L.S., L.T.D., S.K., S.S., E.S.P.; software, T.C., N.P., L.S., L.T.D., S.K., S.S., E.S.P.; validation, R.G., C.M., and E.P.; formal analysis, T.C., N.P., L.S., L.T.D., S.K., S.S., E.S.P., A.A., R.G., C.M., M.C., and E.P.; investigation, T.C., N.P., L.S., L.T.D., S.K., S.S., E.S.P.; resources, R.G., C.M., A.A. and E.P.; data curation, T.C., N.P., L.S., L.T.D., S.K., S.S., E.S.P., R.G., C.M. and E.P.; writing—original draft preparation, T.C., N.P., L.S., R.G., C.M., A.A., and E.P.; writing—review and editing, T.C., N.P., L.S., R.G., M.C., C.M., A.A., and E.P.; supervision, R.G., C.M., and E.P.; project administration, R.G. and E.P.; funding acquisition, R.G., C.M., A.A. and E.P. All authors have read and agreed to the published version of the manuscript.”
Funding
This research was partially supported by FAR Dipartimentale 2024 (Ardizzoni)
Data Availability Statement
The original contributions presented in the study are included in the article, further inquiries can be directed to the corresponding authors.
Acknowledgments
We would like to thank Cinzia Rosselli, Translation Office at the Management Staff of UNIMORE, for proofreading the English text.
Conflicts of Interest
The authors declare no conflicts of interest.
References
- Guinea, J. Global Trends in the Distribution of Candida Species Causing Candidemia. Clinical Microbiology and Infection 2014, 20, 5–10. [Google Scholar] [CrossRef] [PubMed]
- Kean, R.; Brown, J.; Gulmez, D.; Ware, A.; Ramage, G. Candida Auris: A Decade of Understanding of an Enigmatic Pathogenic Yeast. JoF 2020, 6, 30. [Google Scholar] [CrossRef] [PubMed]
- Jeffery-Smith, A.; Taori, S.K.; Schelenz, S.; Jeffery, K.; Johnson, E.M.; Borman, A.; Candida auris Incident Management Team; Manuel, R.; Brown, C.S. Candida Auris: A Review of the Literature. Clin Microbiol Rev 2018, 31, e00029-17. [Google Scholar] [CrossRef] [PubMed]
- Posteraro, B.; Cosio, T.; Torelli, R.; De Carolis, E.; Magrì, C.; Posteraro, P.; De Angelis, G.; Sanguinetti, M. Diagnostic and Clinical Management of Candida Auris Infections in Immunocompromised Patients. Expert Review of Anti-infective Therapy 2025, 1–10. [CrossRef]
- Chowdhary, A.; Sharma, C.; Meis, J.F. Candida Auris: A Rapidly Emerging Cause of Hospital-Acquired Multidrug-Resistant Fungal Infections Globally. PLoS Pathog 2017, 13, e1006290. [Google Scholar] [CrossRef] [PubMed]
- Magrì, C.; De Carolis, E.; Ivagnes, V.; Di Pilato, V.; Spruijtenburg, B.; Marchese, A.; Meijer, E.F.J.; Chowdhary, A.; Sanguinetti, M. “CLADE-FINDER”: Candida Auris Lineage Analysis Determination by Fourier Transform Infrared Spectroscopy and Artificial Neural Networks. Microorganisms 2024, 12, 2153. [Google Scholar] [CrossRef] [PubMed]
- Watkins, R.R.; Gowen, R.; Lionakis, M.; Ghannoum, M. Update on the Pathogenesis, Virulence, and Treatment of Candida Auris. PAI 2022, 7, 46–65. [Google Scholar] [CrossRef] [PubMed]
- Maphanga, T.G.; Naicker, S.D.; Kwenda, S.; Muñoz, J.F.; Van Schalkwyk, E.; Wadula, J.; Nana, T.; Ismail, A.; Coetzee, J.; Govind, C.; et al. In Vitro Antifungal Resistance of Candida Auris Isolates from Bloodstream Infections, South Africa. Antimicrob Agents Chemother 2021, 65, e00517-21. [Google Scholar] [CrossRef] [PubMed]
- Khan, T.; Faysal, N.I.; Hossain, M.M.; Mah-E-Muneer, S.; Haider, A.; Moon, S.B.; Sen, D.; Ahmed, D.; Parnell, L.A.; Jubair, M.; et al. Emergence of the Novel Sixth Candida Auris Clade VI in Bangladesh. Microbiol Spectr 2024, 12, e03540-23. [Google Scholar] [CrossRef] [PubMed]
- Suphavilai, C.; Ko, K.K.K.; Lim, K.M.; Tan, M.G.; Boonsimma, P.; Chu, J.J.K.; Goh, S.S.; Rajandran, P.; Lee, L.C.; Tan, K.Y.; et al. Detection and Characterisation of a Sixth Candida Auris Clade in Singapore: A Genomic and Phenotypic Study. The Lancet Microbe 2024, 5, 100878. [Google Scholar] [CrossRef] [PubMed]
- Welsh, R.M.; Sexton, D.J.; Forsberg, K.; Vallabhaneni, S.; Litvintseva, A. Insights into the Unique Nature of the East Asian Clade of the Emerging Pathogenic Yeast Candida Auris. J Clin Microbiol 2019, 57, e00007–19. [Google Scholar] [CrossRef] [PubMed]
- Jenull, S.; Tscherner, M.; Kashko, N.; Shivarathri, R.; Stoiber, A.; Chauhan, M.; Petryshyn, A.; Chauhan, N.; Kuchler, K. Transcriptome Signatures Predict Phenotypic Variations of Candida Auris. Front. Cell. Infect. Microbiol. 2021, 11, 662563. [Google Scholar] [CrossRef] [PubMed]
- Kumar, D.; Banerjee, T.; Pratap, C.B.; Tilak, R. Itraconazole-Resistant Candida Auris with Phospholipase, Proteinase and Hemolysin Activity from a Case of Vulvovaginitis. J Infect Dev Ctries 2015, 9, 435–437. [Google Scholar] [CrossRef] [PubMed]
- Larkin, E.; Hager, C.; Chandra, J.; Mukherjee, P.K.; Retuerto, M.; Salem, I.; Long, L.; Isham, N.; Kovanda, L.; Borroto-Esoda, K.; et al. The Emerging Pathogen Candida Auris: Growth Phenotype, Virulence Factors, Activity of Antifungals, and Effect of SCY-078, a Novel Glucan Synthesis Inhibitor, on Growth Morphology and Biofilm Formation. Antimicrob Agents Chemother 2017, 61, e02396-16. [Google Scholar] [CrossRef] [PubMed]
- Smith, D.F.Q.; Mudrak, N.J.; Zamith-Miranda, D.; Honorato, L.; Nimrichter, L.; Chrissian, C.; Smith, B.; Gerfen, G.; Stark, R.E.; Nosanchuk, J.D.; et al. Melanization of Candida Auris Is Associated with Alteration of Extracellular pH. JoF 2022, 8, 1068. [Google Scholar] [CrossRef] [PubMed]
- Bohner, F.; Papp, C.; Gácser, A. The Effect of Antifungal Resistance Development on the Virulence of Candida Species. FEMS Yeast Research 2022, 22, foac019. [Google Scholar] [CrossRef] [PubMed]
- Du, H.; Bing, J.; Hu, T.; Ennis, C.L.; Nobile, C.J.; Huang, G. Candida Auris: Epidemiology, Biology, Antifungal Resistance, and Virulence. PLoS Pathog 2020, 16, e1008921. [Google Scholar] [CrossRef] [PubMed]
- Lockhart, S.R.; Etienne, K.A.; Vallabhaneni, S.; Farooqi, J.; Chowdhary, A.; Govender, N.P.; Colombo, A.L.; Calvo, B.; Cuomo, C.A.; Desjardins, C.A.; et al. Simultaneous Emergence of Multidrug-Resistant Candida Auris on 3 Continents Confirmed by Whole-Genome Sequencing and Epidemiological Analyses. Clin Infect Dis 2017, 64, 134–140. [Google Scholar] [CrossRef] [PubMed]
- Chow, N.A.; De Groot, T.; Badali, H.; Abastabar, M.; Chiller, T.M.; Meis, J.F. Potential Fifth Clade of Candida Auris, Iran, 2018. Emerg. Infect. Dis. 2019, 25, 1780–1781. [Google Scholar] [CrossRef] [PubMed]
- Robert, V.A.; Casadevall, A. Vertebrate Endothermy Restricts Most Fungi as Potential Pathogens. J INFECT DIS 2009, 200, 1623–1626. [Google Scholar] [CrossRef] [PubMed]
- Garcia-Solache, M.A.; Casadevall, A. Global Warming Will Bring New Fungal Diseases for Mammals. mBio 2010, 1, e00061-10. [Google Scholar] [CrossRef] [PubMed]
- Casadevall, A.; Kontoyiannis, D.P.; Robert, V. On the Emergence of Candida Auris: Climate Change, Azoles, Swamps, and Birds. mBio 2019, 10, e01397-19. [Google Scholar] [CrossRef] [PubMed]
- Bottery, M.; Sedik, S.; Schwartz, I.; Hoenigl, M.; Van Rhijn, N. Climate Change: Shifting Boundaries of Fungal Disease in Europe and Beyond. Thorax 2025, thorax-2024-222168. [CrossRef]
- Kogut, M. Microbial Strategies of Adaptability. Trends in Biochemical Sciences 1980, 5, 47–50. [Google Scholar] [CrossRef]
- Wani, A.K.; Akhtar, N.; Sher, F.; Navarrete, A.A.; Américo-Pinheiro, J.H.P. Microbial Adaptation to Different Environmental Conditions: Molecular Perspective of Evolved Genetic and Cellular Systems. Arch Microbiol 2022, 204, 144. [Google Scholar] [CrossRef] [PubMed]
- Brumfield, K.D.; Usmani, M.; Chen, K.M.; Gangwar, M.; Jutla, A.S.; Huq, A.; Colwell, R.R. Environmental Parameters Associated with Incidence and Transmission of Pathogenic Vibrio Spp. Environmental Microbiology 2021, 23, 7314–7340. [Google Scholar] [CrossRef] [PubMed]
- Hellberg, R.S.; Chu, E. Effects of Climate Change on the Persistence and Dispersal of Foodborne Bacterial Pathogens in the Outdoor Environment: A Review. Critical Reviews in Microbiology 2016, 42, 548–572. [Google Scholar] [CrossRef] [PubMed]
- Bernardo-Cravo, A.P.; Schmeller, D.S.; Chatzinotas, A.; Vredenburg, V.T.; Loyau, A. Environmental Factors and Host Microbiomes Shape Host–Pathogen Dynamics. Trends in Parasitology 2020, 36, 616–633. [Google Scholar] [CrossRef] [PubMed]
- CDC 2024 C. Auris - Antifungal Susceptibility Testing and Interpretation.
- Luo, G.; Samaranayake, L.P.; Yau, J.Y. Candida Species Exhibit Differential in Vitro Hemolytic Activities. J Clin Microbiol 2001, 39, 2971–2974. [Google Scholar] [CrossRef] [PubMed]
- Price, M.F.; Wilkinson, I.D.; Gentry, L.O. Plate Method for Detection of Phospholipase Activity in Candida Albicans. Med Mycol 1982, 20, 7–14. [Google Scholar] [CrossRef] [PubMed]
- Slifkin, M. Tween 80 Opacity Test Responses of Various Candida Species. J Clin Microbiol 2000, 38, 4626–4628. [Google Scholar] [CrossRef] [PubMed]
- Angiolella, L.; Rojas, F.; Giammarino, A.; Bellucci, N.; Giusiano, G. Identification of Virulence Factors in Isolates of Candida Haemulonii, Candida Albicans and Clavispora Lusitaniae with Low Susceptibility and Resistance to Fluconazole and Amphotericin B. Microorganisms 2024, 12, 212. [Google Scholar] [CrossRef] [PubMed]
- Walsh, T.J.; Hayden, R.T.; Larone, D.H. Larone’s Medically Important Fungi: A Guide to Identification; ASM Press: Washington, DC, USA, 2018; ISBN 978-1-68367-053-7. [Google Scholar]
- Pistoia, E.S.; Cosio, T.; Campione, E.; Pica, F.; Volpe, A.; Marino, D.; Di Francesco, P.; Monari, C.; Fontana, C.; Favaro, M.; et al. All-Trans Retinoic Acid Effect on Candida Albicans Growth and Biofilm Formation. JoF 2022, 8, 1049. [Google Scholar] [CrossRef] [PubMed]
- Ben-Ami, R.; Berman, J.; Novikov, A.; Bash, E.; Shachor-Meyouhas, Y.; Zakin, S.; Maor, Y.; Tarabia, J.; Schechner, V.; Adler, A.; et al. Multidrug-Resistant Candida Haemulonii and C. Auris, Tel Aviv, Israel. Emerg. Infect. Dis. 2017, 23. [Google Scholar] [CrossRef] [PubMed]
- Ghannoum, M.A. Potential Role of Phospholipases in Virulence and Fungal Pathogenesis. Clin Microbiol Rev 2000, 13, 122–143. [Google Scholar] [CrossRef] [PubMed]
- Bravo Ruiz, G.; Ross, Z.K.; Gow, N.A.R.; Lorenz, A. Pseudohyphal Growth of the Emerging Pathogen Candida Auris Is Triggered by Genotoxic Stress through the S Phase Checkpoint. mSphere 2020, 5, e00151–20. [Google Scholar] [CrossRef] [PubMed]
- Chow, E.W.L.; Pang, L.M.; Wang, Y. From Jekyll to Hyde: The Yeast–Hyphal Transition of Candida Albicans. Pathogens 2021, 10, 859. [Google Scholar] [CrossRef] [PubMed]
- Borman, A.M.; Szekely, A.; Johnson, E.M. Comparative Pathogenicity of United Kingdom Isolates of the Emerging Pathogen Candida Auris and Other Key Pathogenic Candida Species. mSphere 2016, 1, e00189-16. [Google Scholar] [CrossRef] [PubMed]
- Chaabane, F.; Graf, A.; Jequier, L.; Coste, A.T. Review on Antifungal Resistance Mechanisms in the Emerging Pathogen Candida Auris. Front. Microbiol. 2019, 10, 2788. [Google Scholar] [CrossRef] [PubMed]
- Forsberg, K.; Woodworth, K.; Walters, M.; Berkow, E.L.; Jackson, B.; Chiller, T.; Vallabhaneni, S. Candida Auris : The Recent Emergence of a Multidrug-Resistant Fungal Pathogen. Medical Mycology 2019, 57, 1–12. [Google Scholar] [CrossRef] [PubMed]
- Zheng, L.; Xu, Y.; Wang, C.; Yang, F.; Dong, Y.; Guo, L. Susceptibility to Caspofungin Is Regulated by Temperature and Is Dependent on Calcineurin in Candida Albicans. Microbiol Spectr 2023, 11, e01790-23. [Google Scholar] [CrossRef] [PubMed]
- Chen, X.-F.; Zhang, H.; Liu, L.-L.; Guo, L.-N.; Liu, W.-J.; Liu, Y.-L.; Li, D.-D.; Zhao, Y.; Zhu, R.-Y.; Li, Y.; et al. Genome-Wide Analysis of in Vivo-Evolved Candida Auris Reveals Multidrug-Resistance Mechanisms. Mycopathologia 2024, 189, 35. [Google Scholar] [CrossRef] [PubMed]
- Khan, Z.; Ahmad, S.; Al-Sweih, N.; Joseph, L.; Alfouzan, W.; Asadzadeh, M. Increasing Prevalence, Molecular Characterization and Antifungal Drug Susceptibility of Serial Candida Auris Isolates in Kuwait. PLoS ONE 2018, 13, e0195743. [Google Scholar] [CrossRef] [PubMed]
- Rosenberg, A.; Ene, I.V.; Bibi, M.; Zakin, S.; Segal, E.S.; Ziv, N.; Dahan, A.M.; Colombo, A.L.; Bennett, R.J.; Berman, J. Antifungal Tolerance Is a Subpopulation Effect Distinct from Resistance and Is Associated with Persistent Candidemia. Nat Commun 2018, 9, 2470. [Google Scholar] [CrossRef] [PubMed]
- Boucherit, Z.; Boucherit, Z.; Seksek, O.; Bolard, J. Dormancy of Candida Albicans Cells in the Presence of the Polyene Antibiotic Amphotericin B: Simple Demonstration by Flow Cytometry. Med Mycol 2007, 45, 525–533. [Google Scholar] [CrossRef] [PubMed]
- Kang, M.; Choi, T.-R.; Ahn, S.; Heo, H.Y.; Kim, H.; Lee, H.S.; Lee, Y.K.; Joo, H.-S.; Yune, P.S.; Kim, W.; et al. Arctic Psychrotolerant Pseudomonas Sp. B14-6 Exhibits Temperature-Dependent Susceptibility to Aminoglycosides. Antibiotics 2022, 11, 1019. [Google Scholar] [CrossRef] [PubMed]
- Pfaller, M.A.; Burmeister, L.; Bartlett, M.S.; Rinaldi, M.G. Multicenter Evaluation of Four Methods of Yeast Inoculum Preparation. J Clin Microbiol 1988, 26, 1437–1441. [Google Scholar] [CrossRef] [PubMed]
- Tahoun, M.K.; Shata, O.H.; Mashalley, R.I.; Abou-Domia, S.A. Influence of Selected Sugars and Temperature on Fatty Acids Composition in Candida Tropicalis. Nahrung 1988, 32, 327–333. [Google Scholar] [CrossRef] [PubMed]
- Boiron, P.; Drouhet, E.; Dupont, B.; Improvisi, L. Entry of Ketoconazole into Candida Albicans. Antimicrob Agents Chemother 1987, 31, 244–248. [Google Scholar] [CrossRef] [PubMed]
- García, M.T.; Llorente, M.T.; Mínguez, F.; Prieto, J. Influence of Temperature and Concentration on the Postantifungal Effect and the Effects of Sub-MIC Concentrations of Four Antifungal Agents on Previously Treated Candida Species. Chemotherapy 2000, 46, 245–252. [Google Scholar] [CrossRef] [PubMed]
- Money, N.P. Fungal Thermotolerance Revisited and Why Climate Change Is Unlikely to Be Supercharging Pathogenic Fungi (Yet). Fungal Biology 2024, 128, 1638–1641. [Google Scholar] [CrossRef] [PubMed]
- Zhang, F.; Aschenbrenner, D.; Yoo, J.Y.; Zuo, T. The Gut Mycobiome in Health, Disease, and Clinical Applications in Association with the Gut Bacterial Microbiome Assembly. The Lancet Microbe 2022, 3, e969–e983. [Google Scholar] [CrossRef] [PubMed]
- Jacobson, E.S.; Tinnell, S.B. Antioxidant Function of Fungal Melanin. J Bacteriol 1993, 175, 7102–7104. [Google Scholar] [CrossRef] [PubMed]
- Alviano, D.S.; Franzen, A.J.; Travassos, L.R.; Holandino, C.; Rozental, S.; Ejzemberg, R.; Alviano, C.S.; Rodrigues, M.L. Melanin from Fonsecaea Pedrosoi Induces Production of Human Antifungal Antibodies and Enhances the Antimicrobial Efficacy of Phagocytes. Infect Immun 2004, 72, 229–237. [Google Scholar] [CrossRef] [PubMed]
- Doering, T.L.; Nosanchuk, J.D.; Roberts, W.K.; Casadevall, A. Melanin as a Potential Cryptococcal Defence against Microbicidal Proteins. Med Mycol 1999, 37, 175–181. [Google Scholar] [CrossRef] [PubMed]
- Rosas, Á.L.; Casadevall, A. Melanization Decreases the Susceptibility of Cryptococcus Neoformans to Enzymatic Degradation. Mycopathologia 2001, 151, 53–56. [Google Scholar] [CrossRef] [PubMed]
- Carvajal, S.K.; Alvarado, M.; Rodríguez, Y.M.; Parra-Giraldo, C.M.; Varón, C.; Morales-López, S.E.; Rodríguez, J.Y.; Gómez, B.L.; Escandón, P. Pathogenicity Assessment of Colombian Strains of Candida Auris in the Galleria Mellonella Invertebrate Model. J Fungi (Basel) 2021, 7, 401. [Google Scholar] [CrossRef] [PubMed]
- Naglik, J.R.; Challacombe, S.J.; Hube, B. Candida Albicans Secreted Aspartyl Proteinases in Virulence and Pathogenesis. Microbiol Mol Biol Rev 2003, 67, 400–428. [Google Scholar] [CrossRef] [PubMed]
- Kean, R.; Delaney, C.; Sherry, L.; Borman, A.; Johnson, E.M.; Richardson, M.D.; Rautemaa-Richardson, R.; Williams, C.; Ramage, G. Transcriptome Assembly and Profiling of Candida Auris Reveals Novel Insights into Biofilm-Mediated Resistance. mSphere 2018, 3, e00334-18. [Google Scholar] [CrossRef] [PubMed]
- Wang, X.; Bing, J.; Zheng, Q.; Zhang, F.; Liu, J.; Yue, H.; Tao, L.; Du, H.; Wang, Y.; Wang, H.; et al. The First Isolate of Candida Auris in China: Clinical and Biological Aspects. Emerging Microbes & Infections 2018, 7, 1–9. [Google Scholar] [CrossRef] [PubMed]
- Sherry, L.; Ramage, G.; Kean, R.; Borman, A.; Johnson, E.M.; Richardson, M.D.; Rautemaa-Richardson, R. Biofilm-Forming Capability of Highly Virulent, Multidrug-Resistant Candida Auris. Emerg. Infect. Dis. 2017, 23, 328–331. [Google Scholar] [CrossRef] [PubMed]
- Rossato, L.; Colombo, A.L. Candida Auris: What Have We Learned About Its Mechanisms of Pathogenicity? Front. Microbiol. 2018, 9, 3081. [Google Scholar] [CrossRef] [PubMed]
Figure 1.
Impact of temperature on C. auris and C. albicans growth.C. auris and C. albicans yeasts cells (20 μL from 1x10⁷ CFU/mL to 1x10³ CFU/mL) were spotted on SDA + CAF and allowed to grow at 25 °C, 37 °C and 42 °C for 24 hr. A representative image out of 4 with similar results is shown.
Figure 1.
Impact of temperature on C. auris and C. albicans growth.C. auris and C. albicans yeasts cells (20 μL from 1x10⁷ CFU/mL to 1x10³ CFU/mL) were spotted on SDA + CAF and allowed to grow at 25 °C, 37 °C and 42 °C for 24 hr. A representative image out of 4 with similar results is shown.
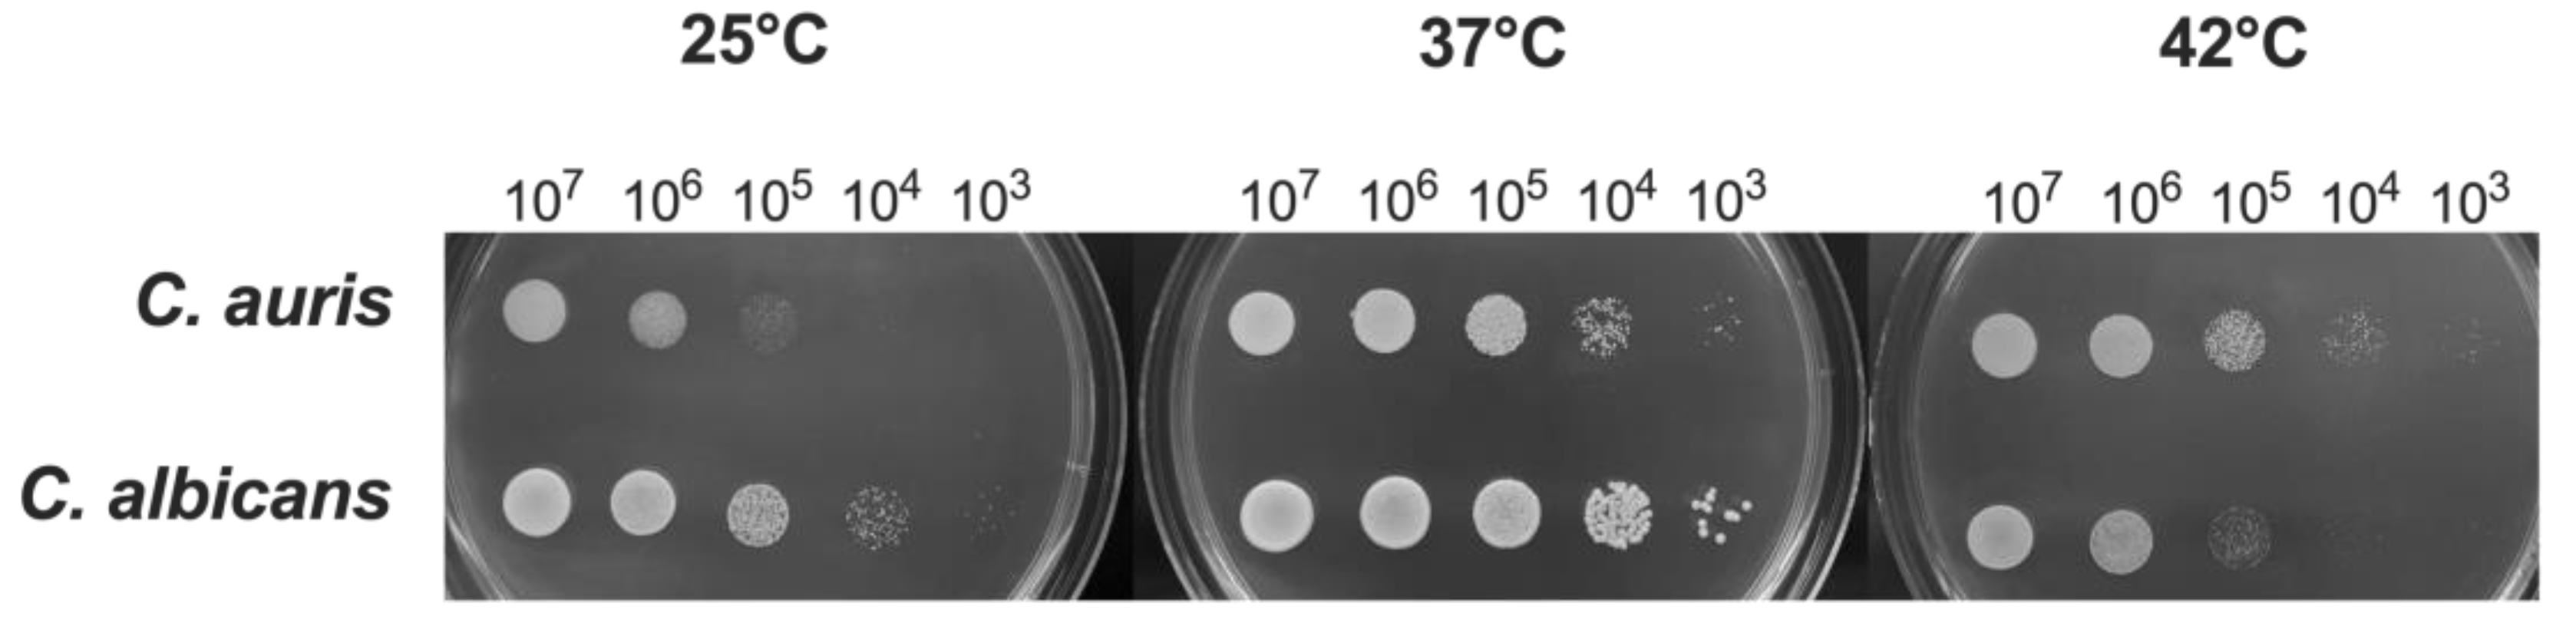
Figure 2.
Impact of temperature on C. auris melanin production.C. auris CDC B11903 melanization capacity after 0, 6 and 9 days at 25 °C, 37 °C and 42 °C. A representative image out of 3 with similar results is shown (A). Mean grey value ± SEM of melanin production by C. auris (B). Differences between groups were analyzed by One-Way ANOVA followed by Tukey's multiple comparisons test. * p<0.05; ** p<0.01; ns, not significant.
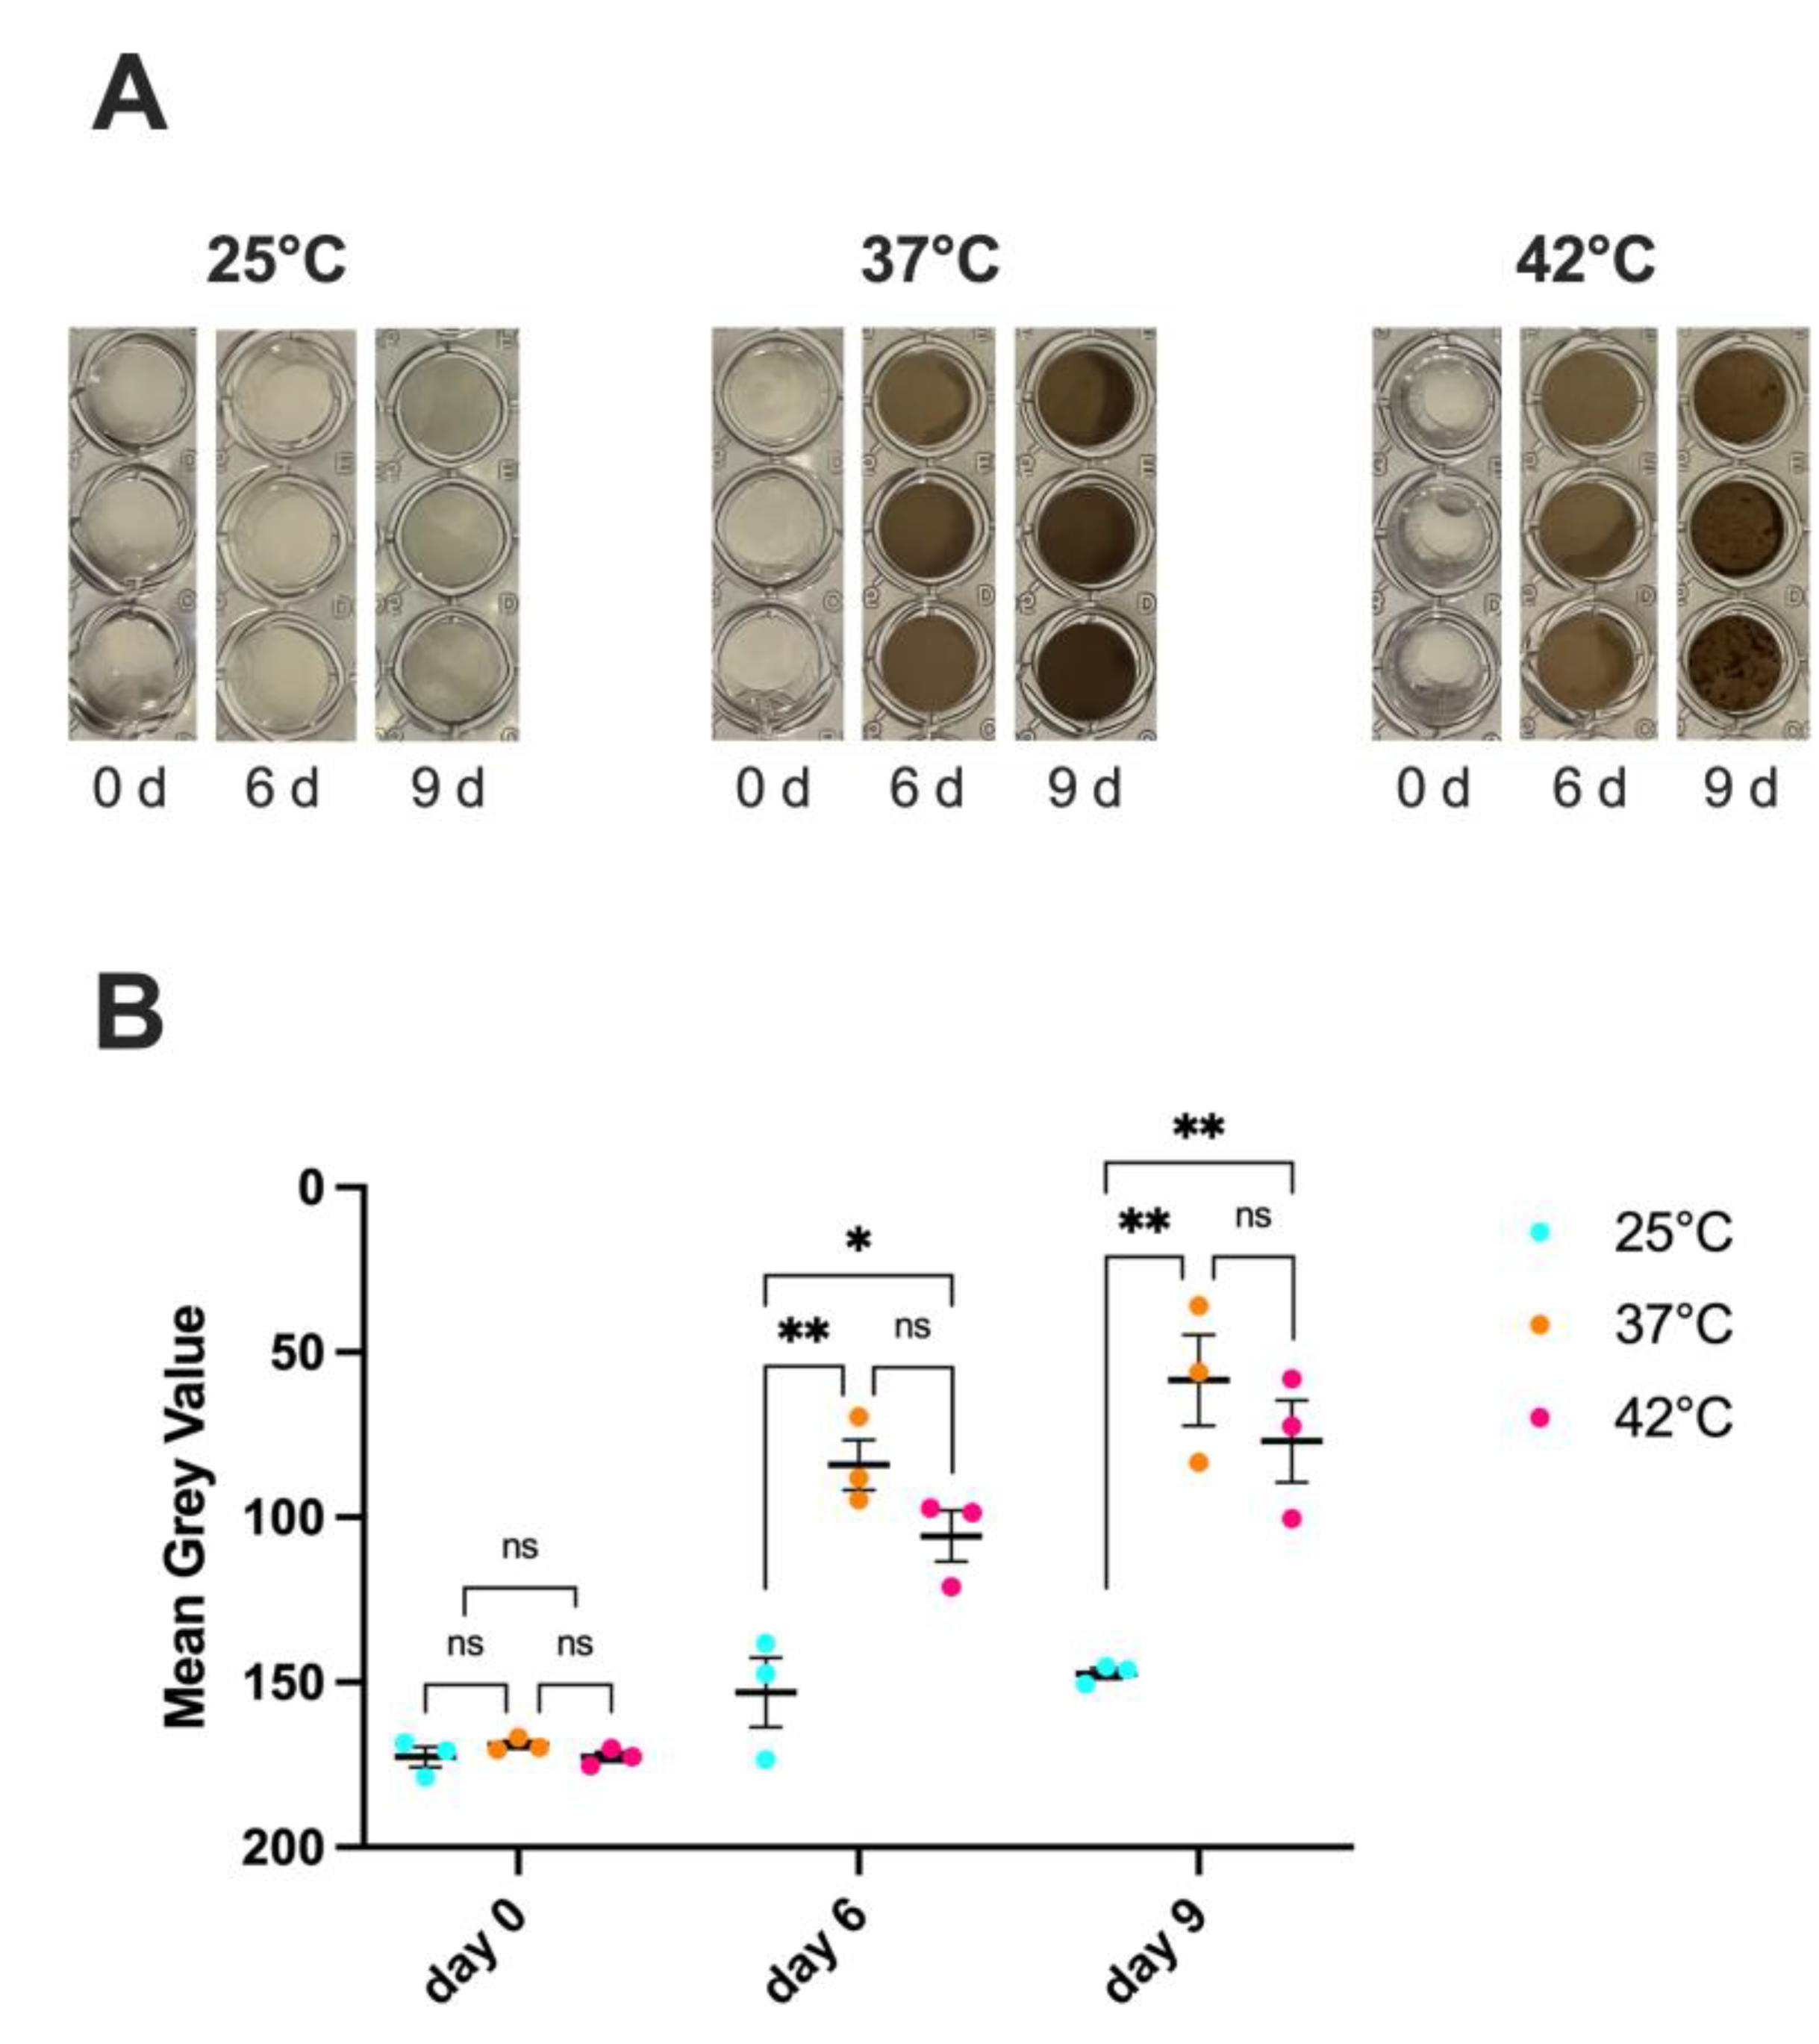
Figure 3.
Impact of temperature on C. auris and C. albicans haemolytic activity. C. auris CDC B11903 and C. albicans B90028 haemolytic activity at 25 °C, 37 °C and 42 °C. A representative image out of 3 with similar results is shown.
Figure 3.
Impact of temperature on C. auris and C. albicans haemolytic activity. C. auris CDC B11903 and C. albicans B90028 haemolytic activity at 25 °C, 37 °C and 42 °C. A representative image out of 3 with similar results is shown.
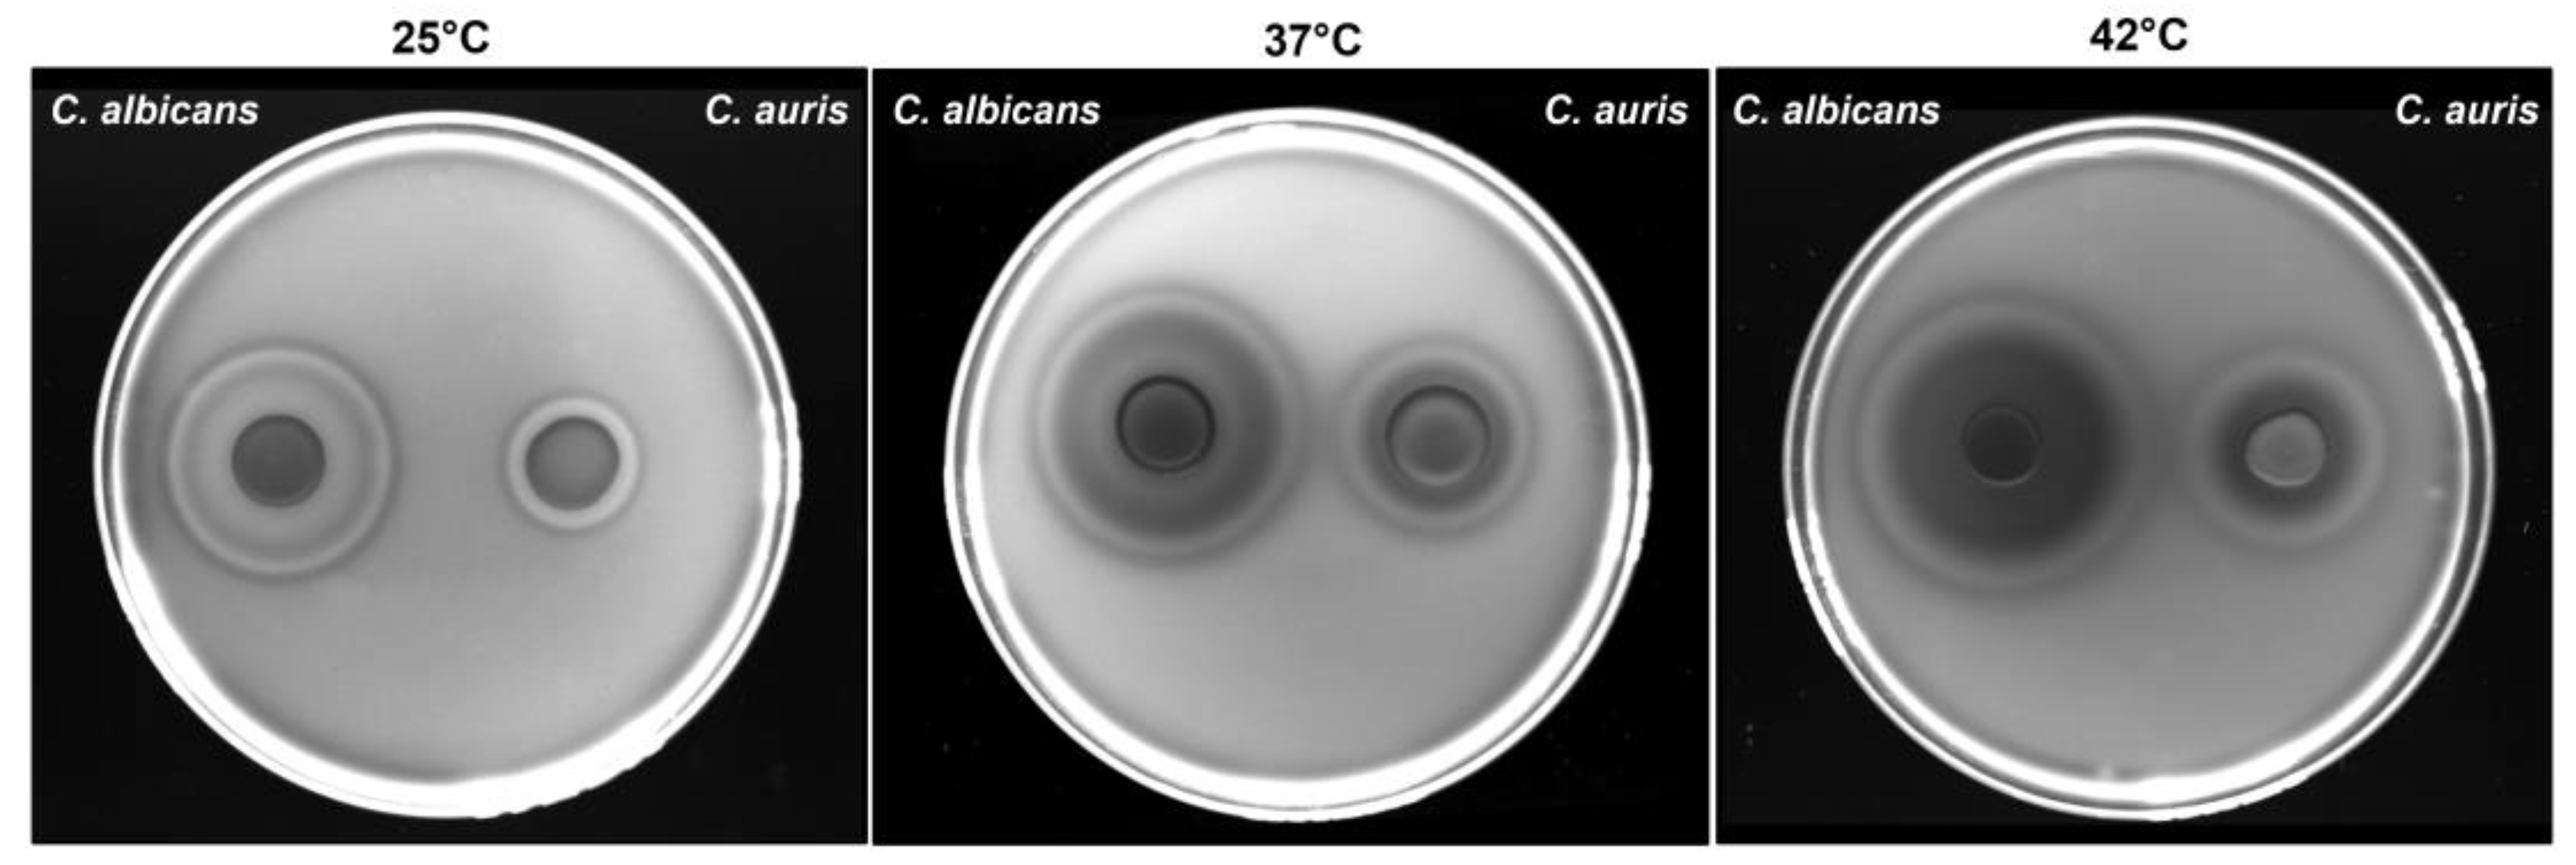
Figure 4.
Impact of temperature on C. auris and C. albicans phospholipase activity.C. auris CDC B11903 and C. albicans B90028 phospholipase activity at 25 °C, 37 °C and 42 °C. A representative image out of 3 with similar results is shown.
Figure 4.
Impact of temperature on C. auris and C. albicans phospholipase activity.C. auris CDC B11903 and C. albicans B90028 phospholipase activity at 25 °C, 37 °C and 42 °C. A representative image out of 3 with similar results is shown.
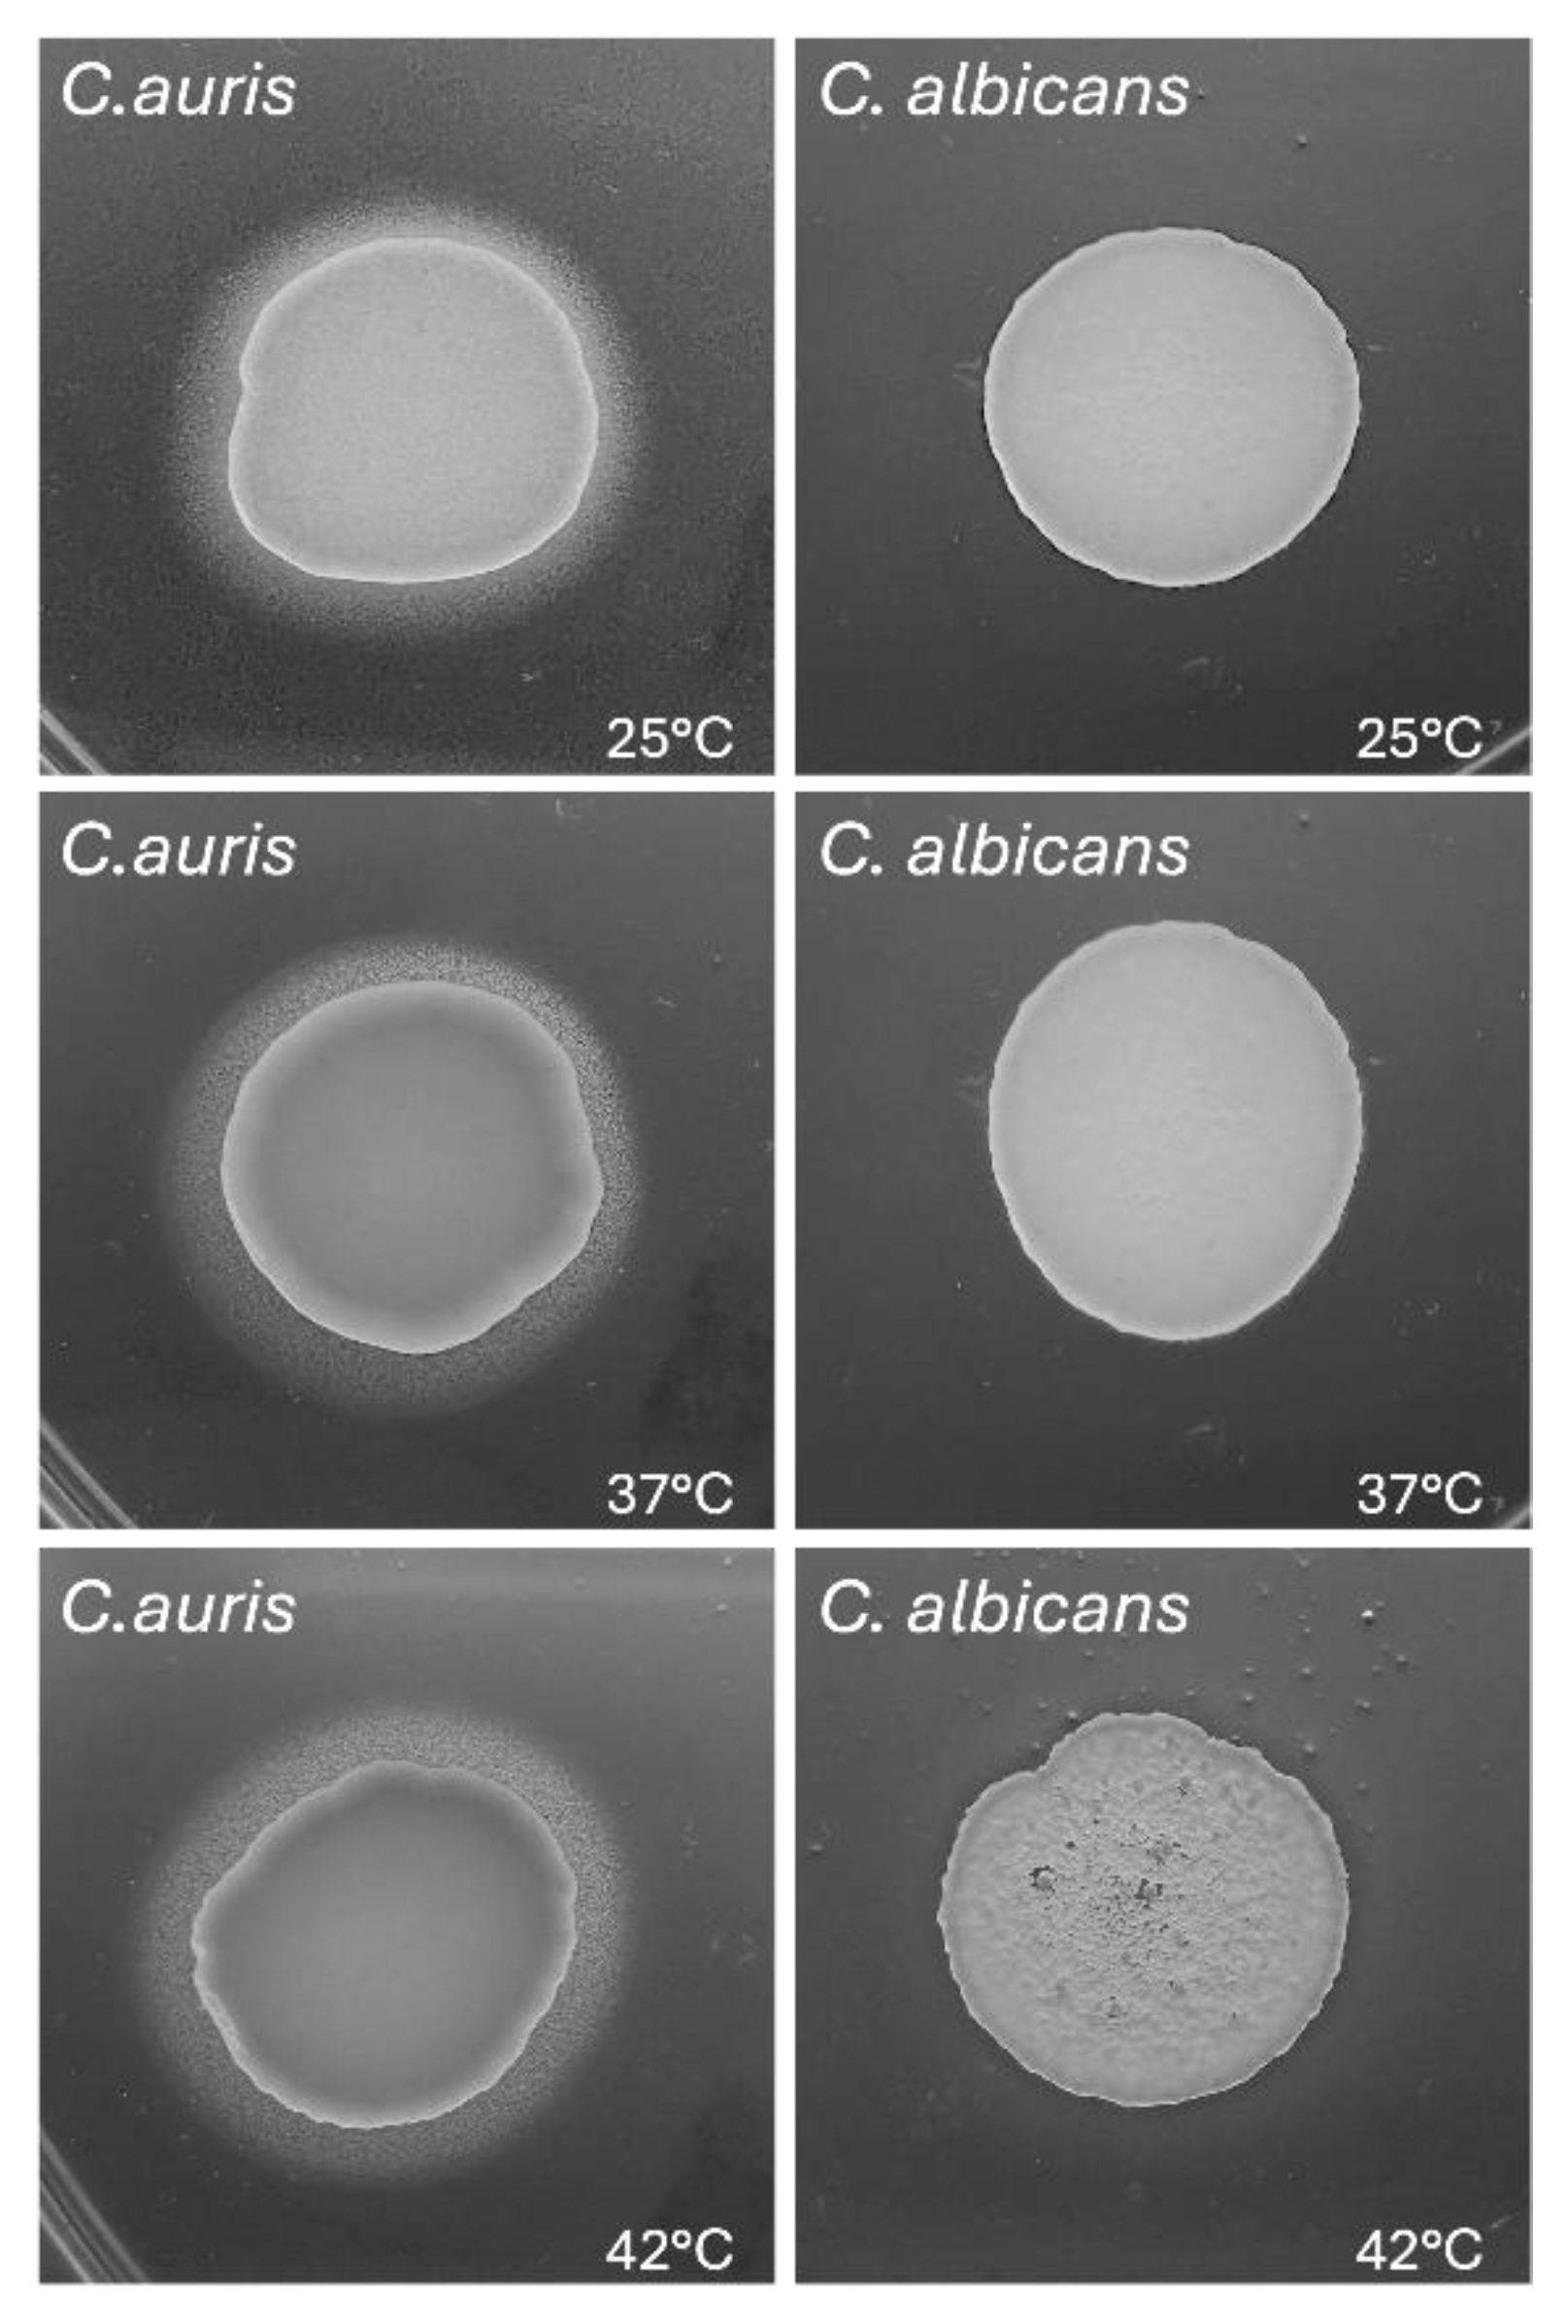
Figure 5.
Impact of temperature on C. auris and C. albicans lipase activity.C. auris CDC B11903 and C. albicans B90028 lipase activity at 25 °C, 37 °C and 42 °C after 48 hr of incubation. A representative image out of 3 with similar results is shown.
Figure 5.
Impact of temperature on C. auris and C. albicans lipase activity.C. auris CDC B11903 and C. albicans B90028 lipase activity at 25 °C, 37 °C and 42 °C after 48 hr of incubation. A representative image out of 3 with similar results is shown.
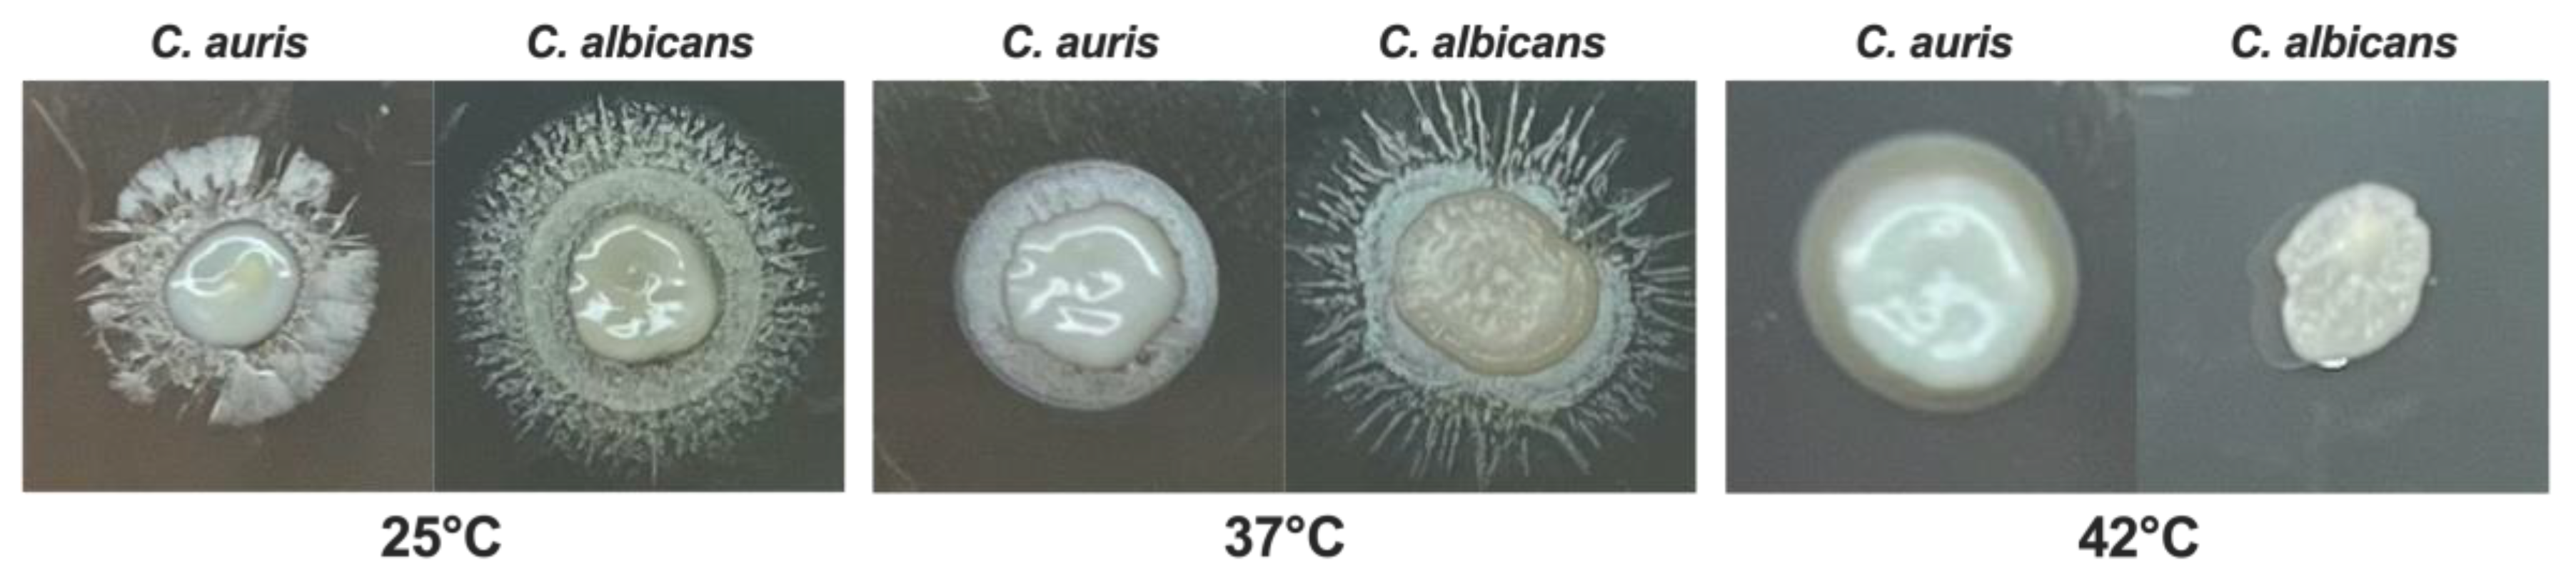
Figure 6.
Effect of temperatures on germ tube formation in C. auris.C. auris cells were cultured in the presence of 100% FCS at 25 °C, 37 °C and 42 °C. The germ tube formation was analysed by light microscopy after 3 hr of incubation. The images were acquired by a light microscope with 40x magnification objective lenses. For each temperature condition, one representative experiment is shown. Scale bar = 10 µm.
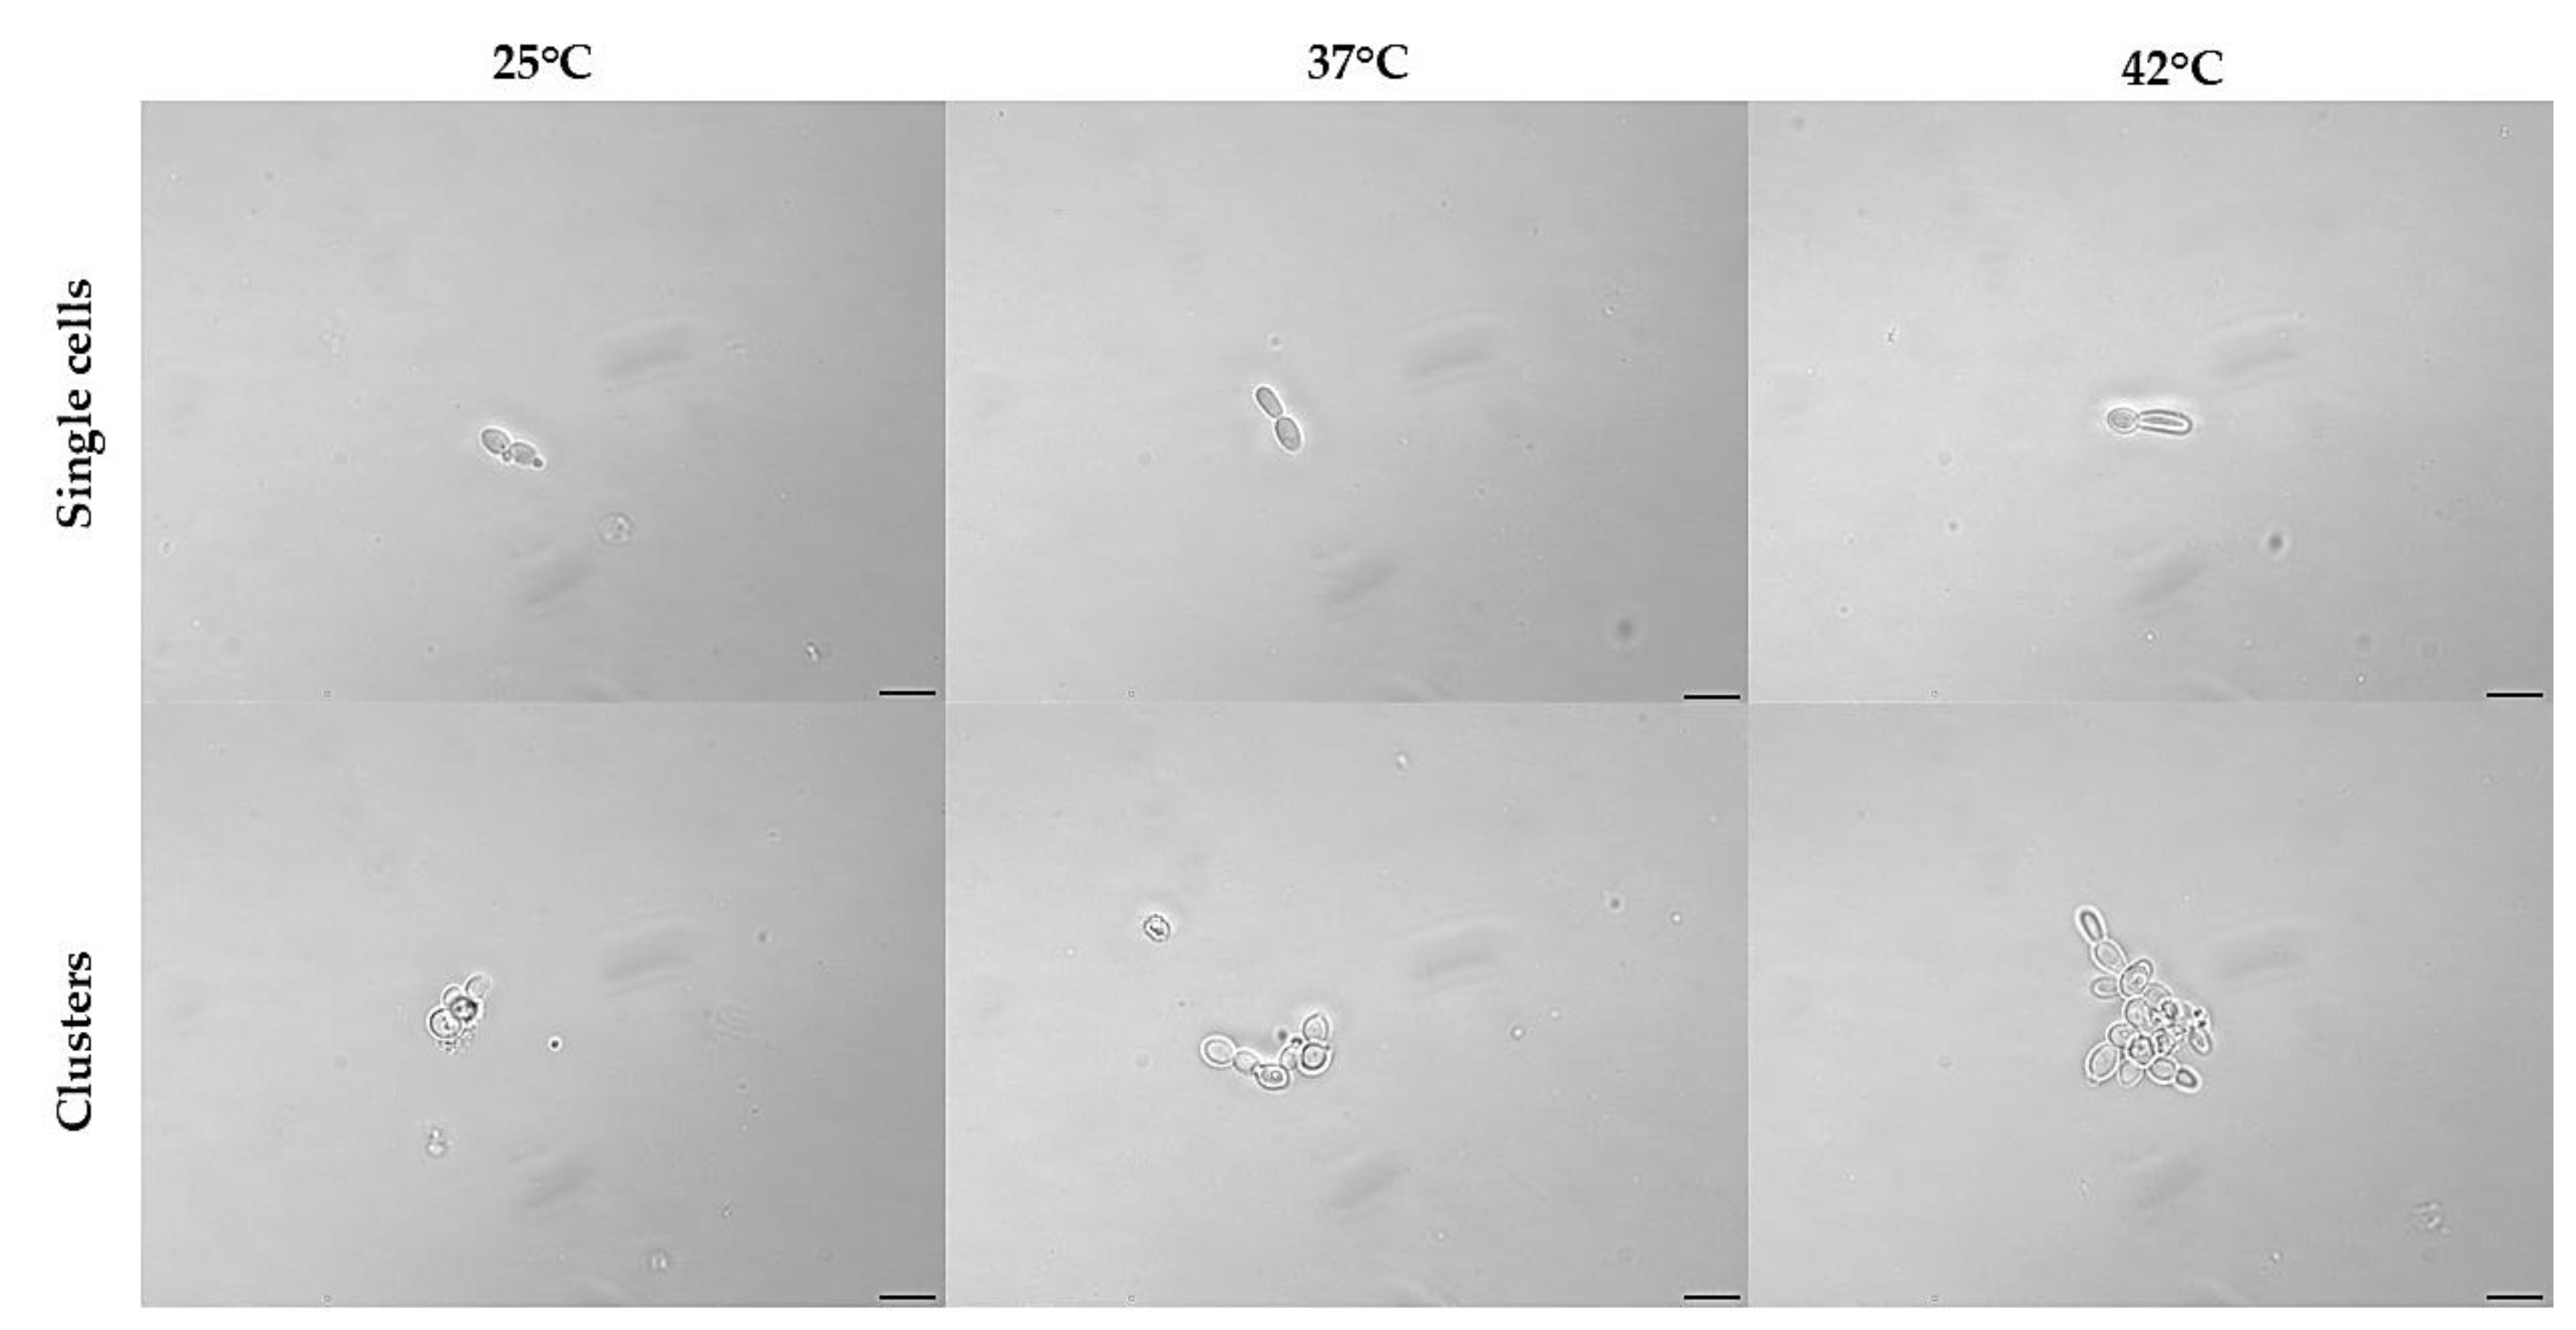
Figure 7.
Effect of temperature on phenotypic switching from yeast to pseudohyphae in C. auris.C. auris cells were cultured in RPMI 1640 supplemented with 10% FCS at 25 °C, 37 °C and 42 °C for 24 hr. The phenotypic transition from yeast-to-hyphal morphotype was analysed by light microscopy at 6 and 24 hr. Arrows point to pseudo-hyphal growth in single and not clustered C. auris cells. Images were acquired by a light microscope with 40x magnification objective lenses. One representative experiment out of three for each temperature is shown. Scale bar: 20 µm.
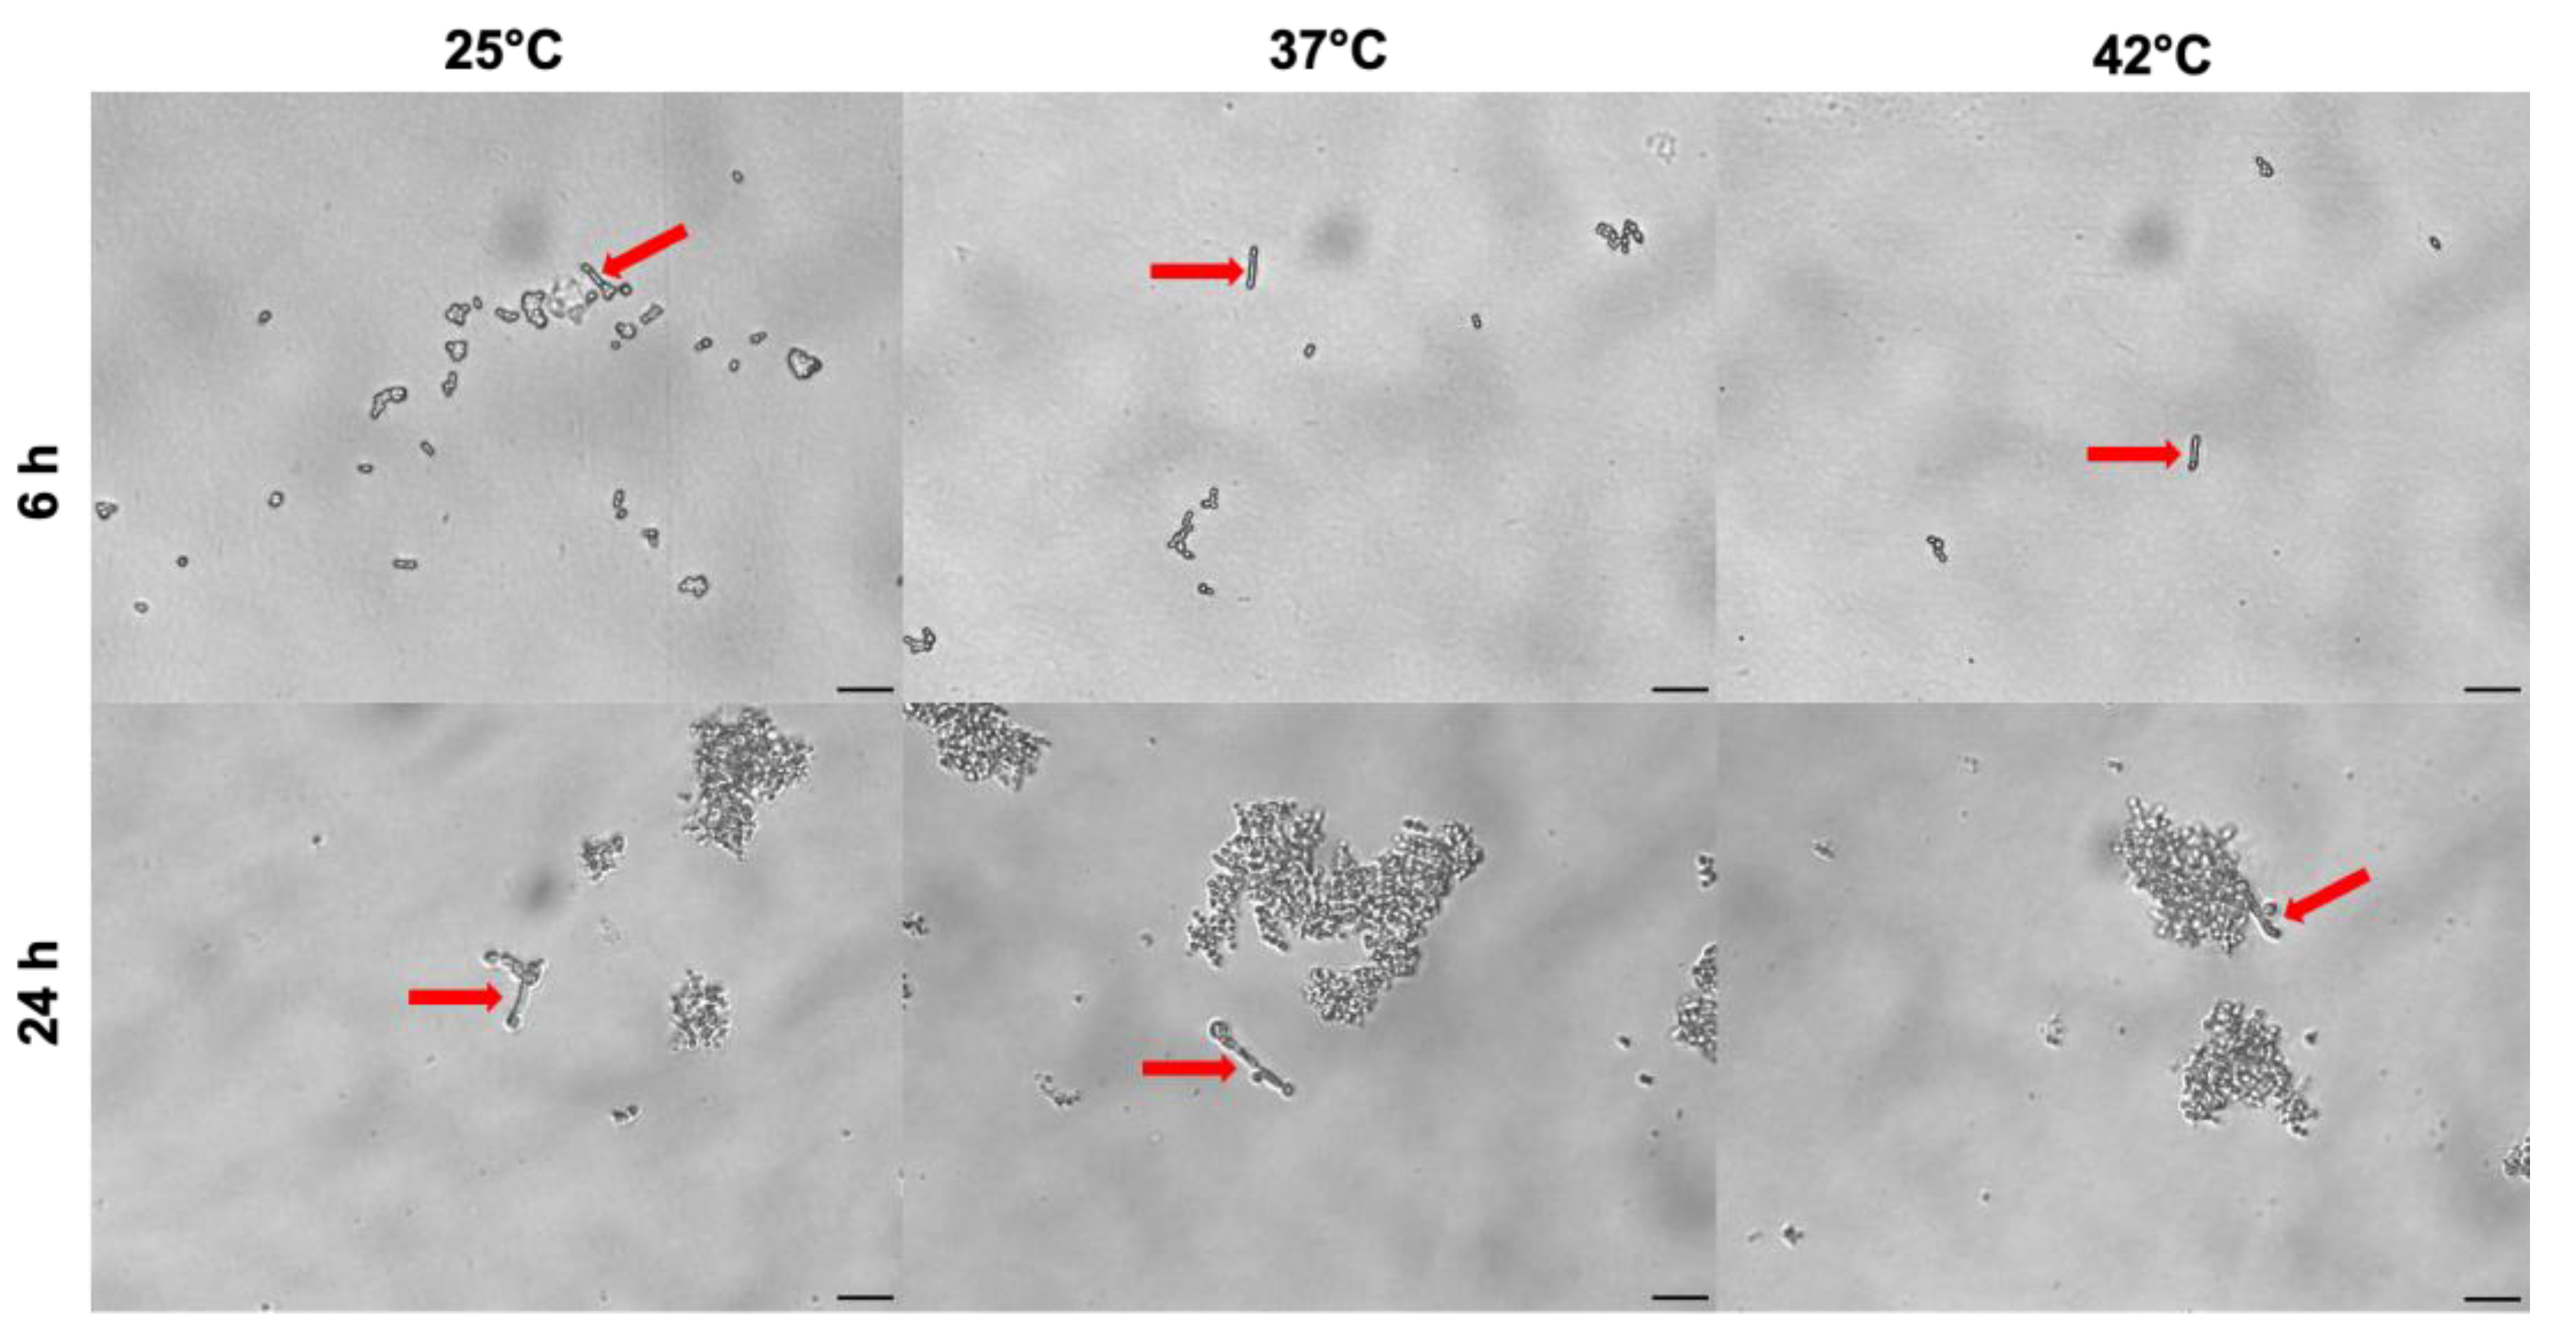
Figure 8.
C. auris and C. albicans adhesion to abiotic surfaces and epithelial cells. The impact of the different temperatures on adhesion of C. auris CDC B11903 and C. albicans 90028 was evaluated on abiotic surfaces (A), T24 urothelial cells (B), and BEAS-2B bronchial epithelial cells (C). Data are the mean ± SEM of three independent experiments performed in triplicate. Differences between groups were analysed by Two-Way ANOVA followed by Sidak’s multiple-comparison test. * p<0.05; ** p<0.01; **** p<0.0001.
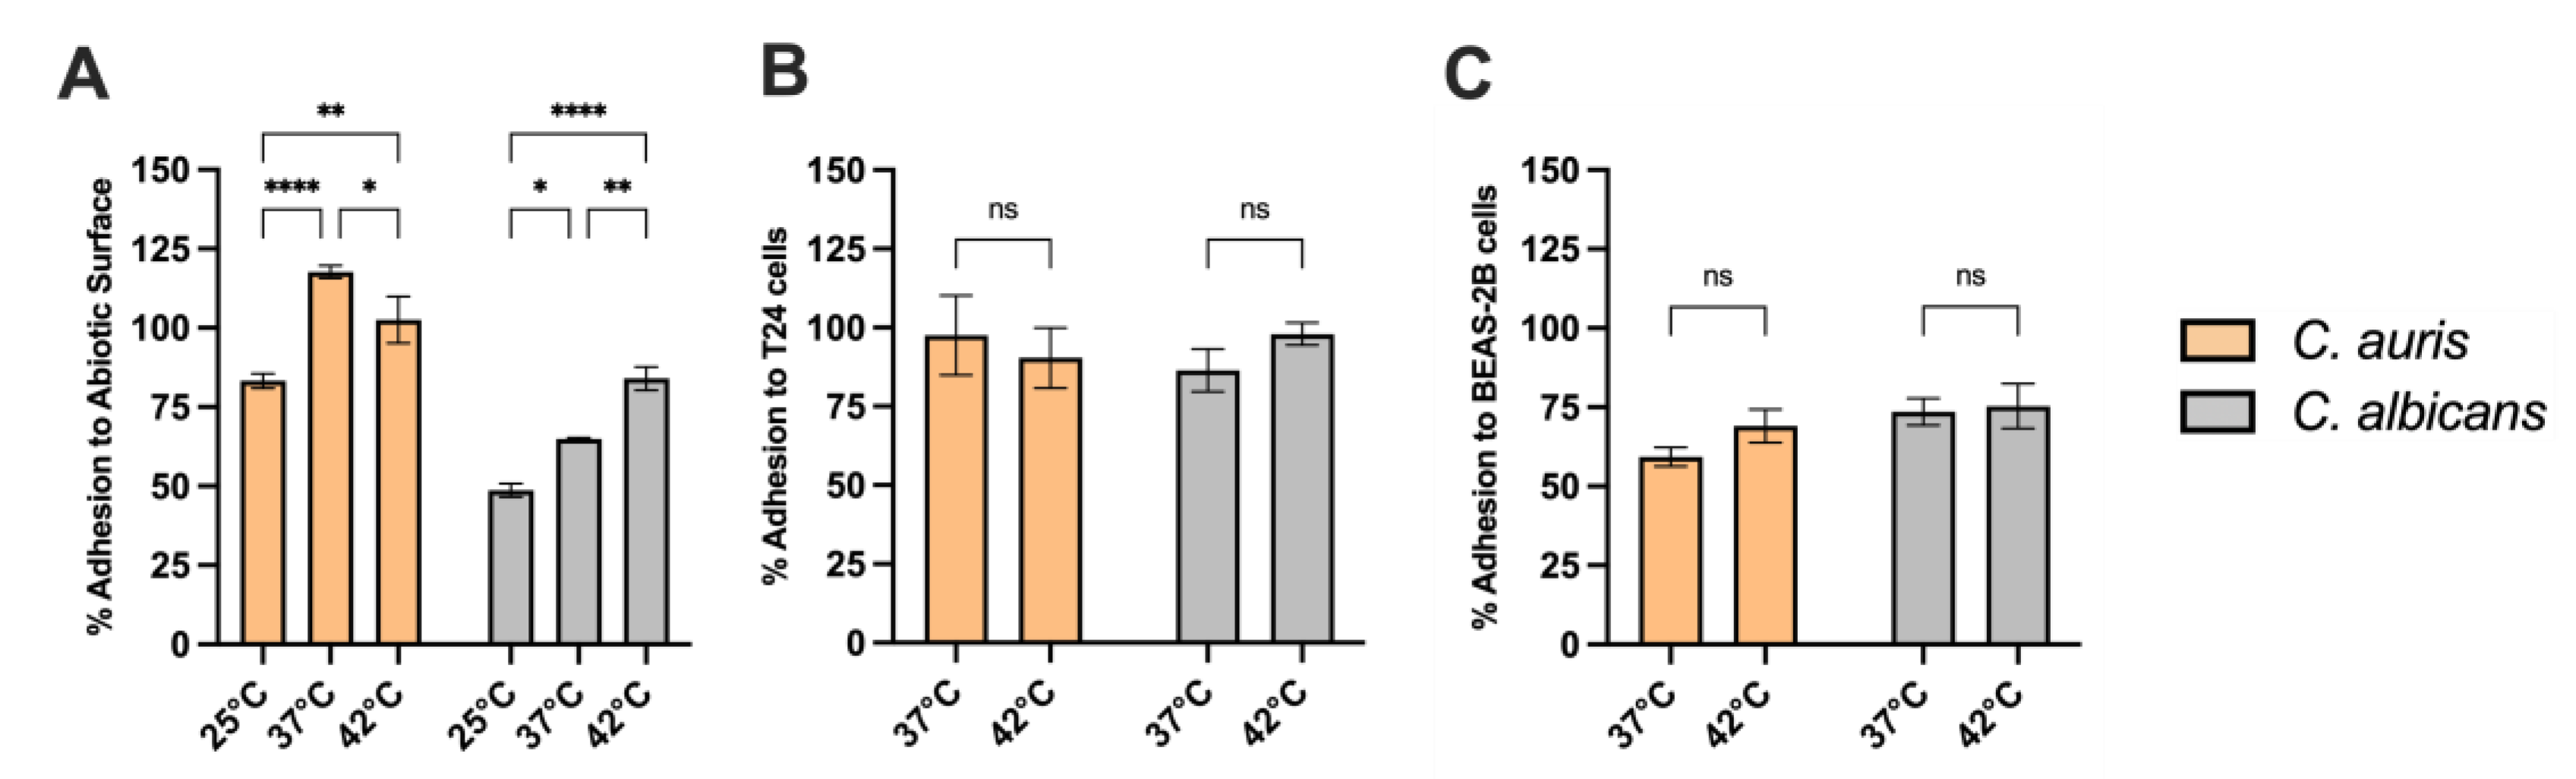

Table 1.
Antifungal susceptibility testing of C. auris CDC B11903 at 25 °C, 37 °C and 42 °C. The values are the geometric means of the MICs (µg/mL).
Table 1.
Antifungal susceptibility testing of C. auris CDC B11903 at 25 °C, 37 °C and 42 °C. The values are the geometric means of the MICs (µg/mL).
| Temperature | 25 °C | 37 °C | 42 °C |
|---|---|---|---|
| Amphotericin B | 0.50 μg/mL | 1.00 μg/mL | 1.00 μg/mL |
| Fluconazole | 4.00 μg/mL | 8.00 μg/mL | 8.00 μg/mL |
| Isavuconazole | 0.008 μg/mL | 0.12 μg/mL | 0.12 μg/mL |
| Itraconazole | 0.03 μg/mL | 0.12 μg/mL | 0.12 μg/mL |
| Posaconazole | 0.015 μg/mL | 0.06 μg/mL | 0.06 μg/mL |
| Voriconazole | 0.015 μg/mL | 0.06 μg/mL | 0.06 μg/mL |
| Micafungin | 0.03 μg/mL | 0.06 μg/mL | 0.06 μg/mL |
| Anidulafungin | 0.06 μg/mL | 0.07 μg/mL | 0.10 μg/mL |
| Caspofungin | 0.06 μg/mL | 0.12 μg/mL | 0.12 μg/mL |
Table 2.
Haemolytic activity of C. auris CDC B11903 and C. albicans B90028 at 2 5°C, 37 °C and 42 °C. Hz: haemolytic index. The results are expressed as the mean ± SD of three independent experiments. Differences between groups were analyzed by One-Way ANOVA followed by Tukey's multiple comparisons test. **** p< 0.0001 (C. auris 25 °C vs 37 °C), #### p<0.0001 (C. auris 25 °C vs 42 °C).
| Temperature | 25 °C | 37 °C | 42 °C | |||
|---|---|---|---|---|---|---|
| Hz | Categorization | Hz | Categorization | Hz | Categorization | |
| C. auris | 0.690±0.073 | low | 0.46±0.020**** | moderate | 0.38±0.003#### | high |
| C. albicans | 0.376±0.011 | high | 0.322±0.036 | high | 0.251±0.011 | high |
Table 3.
Extracellular phospholipase activity of C. auris CDC B11903 and C. albicans B90028 at 25 °C, 37 °C and 42 °C. Pz: phospholipase activity index. The results are the mean ± SD of three independent experiments carried out in duplicate. Differences between groups were analyzed by One-Way ANOVA followed by Tukey's multiple comparisons test. ns (C. auris 25 °C vs 37 °C), ns (C. auris 25 °C vs 42 °C).
| Temperature | 25 °C | 37 °C | 42 °C | |||
|---|---|---|---|---|---|---|
| Pz | Categorization | Pz | Categorization | Pz | Categorization | |
| C. auris | 0. 780±0.055 | moderate | 0.780±0.063 | moderate | 0.770±0.030 | moderate |
| C. albicans | 1 | none | 1 | none | 1 | none |
Table 4.
Lipase activity of C. auris CDC B11903 and C. albicans B90028 at 25 °C, 37 °C and 42 °C. Lz: lipase activity index. The results are the mean ± SD of three different experiments. Differences between groups were analyzed by One-Way ANOVA followed by Tukey's multiple comparisons test. ###p< 0.001 (C. auris 25 °C vs 37 °C and 25 °C vs 42 °C), ###p<0.001 (C. albicans 25 °C vs 42 °C and 37 °C vs 42 °C).
| Temperature | 25 °C | 37 °C | 42 °C | |||
|---|---|---|---|---|---|---|
| Lz score | Categorization | Lz score | Categorization | Lz score | Categorization | |
| C. auris | 0.48±0.014 | High | 0.72±0.059 | Moderate | 0.71±0.044 | Moderate |
| C. albicans | 0.46±0.043 | High | 0.50±0.113 | High | 1.00 | none |
Table 5.
Effect of temperature on C. auris biofilm biomass and metabolic activity. The impact of the different temperatures was evaluated on biofilm biomass and metabolic activity in C. auris. Each value represents the mean ± SD of three independent experiments carried out in triplicate. Statistical analysis was performed by using One-way ANOVA followed by Tukey’s multiple comparisons test. * p<0.05; ** p<0.01; ns: not significant.
| Temperature | Biofilm biomass (OD 595 nm) | p-value | Biofilm metabolic activity (OD 490 nm) |
p-value |
|---|---|---|---|---|
| 25 °C | 0.764 ± 0.234 | - | 0.580 ± 0.112 | - |
| 37 °C | 0.772 ± 0.236 | ns | 0.731 ± 0.083 | **vs 25 °C (p<0.01) |
| 42 °C | 0.749 ± 0.248 | ns | 0.614 ± 0.087 | *vs 37 °C (p<0.05) |
Disclaimer/Publisher’s Note: The statements, opinions and data contained in all publications are solely those of the individual author(s) and contributor(s) and not of MDPI and/or the editor(s). MDPI and/or the editor(s) disclaim responsibility for any injury to people or property resulting from any ideas, methods, instructions or products referred to in the content. |
© 2025 by the authors. Licensee MDPI, Basel, Switzerland. This article is an open access article distributed under the terms and conditions of the Creative Commons Attribution (CC BY) license (http://creativecommons.org/licenses/by/4.0/).
Copyright: This open access article is published under a Creative Commons CC BY 4.0 license, which permit the free download, distribution, and reuse, provided that the author and preprint are cited in any reuse.


