
Submitted:
18 July 2025
Posted:
21 July 2025
You are already at the latest version
Abstract
Background
Gall bladder cancer (GBC) is the most prevalent cancer of the biliary tract with a poor prognosis. Most of the patients are diagnosed at an advanced stage. This is due to a lack of reliable biomarkers and an understanding of the tumour biology in our patient population. This study aims to demonstrate the metabolomic and lipoprotein profiles associated with GBC patients of African ancestry.
Methods: An untargeted metabolomics analysis was conducted on serum obtained from consenting individuals (41 GBC and 29 Benign Biliary Pathology (BBP)). Statisti-cal analysis was conducted in R (v 4.3.2), and Wilcoxon tests were used to compare the groups. Spearman’s rank test was used for correlation analyses. Unsupervised analysis of the groups was carried out using the KODAMA algorithm.
Results: GBC patients showed a significant alteration of the metabolite ethanol as well as lipoproteins such as IDL-C, IDL-TG, LDL-TG, compared to BBP patients. In contrast, decreased levels of HDL-C, HDL-P, medium HDL-P were observed in GBC patients. Both Total and conjugated bilirubin levels showed a strong correlation with lipopro-teins. Furthermore, the altered free cholesterol to cholesterol ester ratio was demon-strated to be linked to abnormal lipid metabolism.
Conclusion: This study demonstrated alterations in key lipoproteins and metabolites in the patient population. These alterations may play a role in disease progression and potentially serve as novel biomarkers for the disease.
Keywords:
gallbladder cancer
; gallstones
; metabolomics
; lipoproteins
; cholelithiasis
; African patients
1. Introduction
Gallbladder Cancer (GBC) is the most prevalent cancer of the biliary tract, accounting for 80-95% of cases, and the overall prognosis remains poor, with a 5-year survival of less than 5–10% [1]. Over 80% of these patients are diagnosed at an advanced stage. Worldwide, GBC is the 22nd most occurring and 17th most deadly cancer [2]. The incidence of GBC worldwide has a geographical variable pattern, with the highest incidence reported in India, Asia and South America [3]. Although epidemiological studies from African countries, including South Africa, Nigeria, Kenya, and Uganda, suggest that the rate of gallstone disease is low in the African population [4], recent studies have demonstrated high rates of incidental GBC in sub-Saharan Africa [5]. Clinical presentations of GBC include loss of appetite, nausea, upper right quadrant abdominal pain, jaundice, and weight loss; however, these are non-specific to GBC and are usually observed at the advanced stage of the disease [6]. About 85% of people who develop GBC have cholelithiasis [7]. Other risk factors include age, sex, gallstones, cholecystitis, family history and genetic factors. Surgery remains the most effective treatment option, especially in the early stages. Although GBC may recur in approximately 60%–70% of patients after surgery, resulting in an unsatisfactory prognosis, with a 5-year survival rate of only 5%–15% [8,9].
Numerous studies have been conducted on other ethnicities across diverse geographical regions to gain insight into the development and progression of GBC [10,11,12]. Hence, further investigations are needed on GBC patients of African descent [13]. Additionally, metabolomics assays on African patients have only recently been conducted for certain diseases [14,15,16]. Metabolite concentrations in the blood may reflect the metabolic adaptation of the tumour and could serve as potential biomarkers [17]. Nuclear Magnetic Resonance (NMR) spectroscopy has been used to identify metabolites which can differentiate GBCs from benign cases such as gallstones [18]. For instance, a metabolomics study on Indian patients showed lower concentrations of alanine, creatinine, tyrosine, and branched-chain amino acids in the GBC group. In contrast, elevated concentrations of pyruvate, glutamate, and formate were observed in GBC compared to benign gallstone diseases [19]. Furthermore, multiple studies have demonstrated an association between gallstone formation and abnormalities in serum lipid levels [20,21].
In this study, we conducted an untargeted metabolomic profiling of GBC patients of African ancestry to identify altered metabolites and lipoproteins that could be linked to the disease in our patient group.
2. Materials and Methods
2.1. Patient Recruitment and Sample Collection
Ethics approval was obtained from the Human Research Ethics Committee (M230780 and M160640). The study site was the Hepatopancreatobiliary Unit at Chris Hani Baragwanath Academic Hospital, Soweto, Johannesburg, South Africa. GBC patients from 18 years old and above, self-reporting of African ancestry, who have been proven clinically and histologically by the clinicians, were included in this study. All GBC patients presented at advanced stages (stage 3 or 4). For the control groups, benign biliary pathologies (BBP) were also recruited from the same hospital. Participants were recruited between January 2019 and December 2020 and provided written informed consent. Demographic and clinical data were captured in the RedCap® database [21]. After collection, blood samples were gently mixed by inverting the tube 3 to 5 times and stored upright at 4ºC until centrifugation.
2.2. Sample Processing
Serum was obtained by centrifuging blood samples collected by venepuncture in vacutainer tubes (BD Biosciences, Franklin Lakes, NJ, USA) without coagulant at 1734 g, 4 °C for 10 min after allowing it to clot for 30–60 min at room temperature. Serum samples were processed within 2 h of the blood collection [23]. The serum was aliquoted into microfuge tubes (500 µL) and stored at −80 °C until analysis.
2.3. Sample Preparation
A working solution was prepared by adding 300 µL of thawed serum to 300 µL of a solution consisting of 0.75 M potassium phosphate buffer (pH 7.4), 5.81 mM trimethylsilyl-2,2,3,3-tetradeuteropropionic acid (TSP; Sigma–Aldrich, St. Louis, MO, USA), and a trace amount of sodium azide (65 mg dissolved in deuterium oxide) to prevent bacterial growth. The samples were vortexed to obtain a homogenous mixture. A final volume of 540 µL of each sample was transferred to a 5 mm NMR tube (Wilmad Lab Glass, Vineland, NJ, USA) for analysis. Sample preparation and analysis were performed at the Centre for Human Metabolomics, Potchefstroom Campus, North-West University, South Africa [14].
2.4. Nuclear Magnetic Resonance Analysis
NMR-based metabolomics using serum samples is described in this study [14,24]. The NMR tubes containing the respective samples were loaded on a 500 MHz Bruker Avance III HD NMR spectrometer equipped with a triple-resonance inverse 1H probe head and x, y, z gradient coils to acquire one-dimensional (1D) proton (1H)-NMR spectra. A standard nuclear Overhauser effect spectroscopy (NOESY) pulse sequence with presat (noesygppr1d.comp) was used on both the metabolite and lipid extract samples. The NOESY was used to detect the signals of both small metabolites and high-molecular-weight macromolecules, such as lipoproteins. Additionally, a standard diffusion-edited (DIFF) pulse sequence (ledbpgppr2s1d) was used to detect only high-molecular-weight macromolecules, such as lipoproteins. Pooled GBC samples were used as a quality control sample and were included in each batch for qualitative assessment of repeatability by overlaying the raw spectra [14,15].
2.5. Nuclear Magnetic Resonance Profiling
NMR spectroscopy was used to quantify signals from the samples, which were subsequently identified and quantified. The peaks of the identified metabolites were fitted by combining a local baseline and Voigt functions based on the multiplicity of the NMR signal. To validate the efficacy of the different deconvolution models, the root-mean-square deviation was determined. The absolute concentration of each metabolite was calculated according to a previously reported equation [25]. The number of protons contributing to the unknown signals was imputed to 1. The concentration of carbohydrates was also estimated by considering the equilibrium between their cyclic forms.
GlycA and GlycB signals were quantified by integrating the areas between 2.00 and 2.05 ppm and between 2.09 and 2.05 ppm, respectively. GlycA is measured as an NMR signal of post-translational modification of glycosylated acute-phase proteins released during inflammation [26]. From our previous research, we demonstrated lipid dysregulation in pancreatic cancer [14]. Hence, we proceeded to quantify the effect of GBC on the lipid profile within this cohort. This was performed using the Liposcale test (Biosfer TesLab, Reus, Spain). The methyl signal of 2D 1H-NMR spectra was deconvoluted with lorentzian functions corresponding to 9 subclasses, i.e., large, medium and small, of main lipoprotein classes: high-density lipoprotein (HDL), low-density lipoprotein (LDL), and very low-density lipoprotein (VLDL) particle number, size, and lipid concentration of each subtype [27]. Lipid content was obtained from the area of each function, whereas the diffusion coefficient of each function was associated with lipoprotein particle size. The lipid volumes were determined using common conversion factors [28,29]. The assay was performed as previously described. Each of the DIFF spectra in the range between 0.1 and 9.5 ppm, excluding the regions corresponding to the water signals between 4.40 and 5.00 ppm, was segmented into 0.001 ppm chemical shift bins, and the corresponding spectral areas under the curve yielded a total of 8800 variable.
2.6. Statistics and Data Analysis
Statistical analysis and graphical illustrations of the data were generated in R (version 4.3.2) and R Studio (version 2023.9.0.463) software using scripts developed in-house. Wilcoxon and rank-sum tests were used to compare differences in numerical covariates (e.g., age and metabolite concentration). Fisher’s exact test was used to assess differences between categorical variables, and Spearman’s rank test was then used to calculate the correlation coefficient (rho) between variables. The p-values < 0.05 were considered significant, and to account for multiple testing, a false discovery rate (FDR) of <10% was applied.
The KODAMA algorithm, which allows for unsupervised extraction of features and enables analysis of noisy datasets of high dimension, was used to facilitate the identification of patterns representing underlying metabolic phenotypes in all samples [30,31,32]. A training set of the PC samples DIFF spectra retrieved from the study by Elebo et al.,[14] and associated information on the FC and CE ratio was then used to build a Partial Least Squares (PLS) model [30]. The PLS model was then applied to the DIFF spectra of samples from GBC patients.
3. Results
3.1. Clinicopathological Features of Gallbladder Cancer and Benign Biliary Pathology Patients
Forty-one GBC and 29 BBP patients were recruited. The clinicopathological features of the patients with GBC and BBP are reported in Table 1. GBC was shown to be prevalent in older people and females compared to BBP patients. The GBC groups displayed elevated bilirubin values compared to the BBP group. GBC patients had elevated levels of alkaline phosphatase (ALP) and gamma-glutamyl transferase (GGT), with the latter not significant, when compared to the BBP patients. Furthermore, the GBC patients have elevated levels of C-reactive protein (CRP) compared to the controls, which might be due to high levels of cholangitis.
3.2. Dysregulated Metabolites and Lipoproteins in Gallbladder Cancer Patients
Lipid content and lipoprotein particle size data were combined to determine the particle number of each lipoprotein subclass (Table 2). Lipoproteins parameters such as IDL-C (p=0.004, FDR=0.017), IDL-TG (p=0.003, FDR=0.017) and LDL-TG (p=0.002, FDR=0.015) were increased in GBC, while HDL-P (p=0.001, FDR=0.017) and HDL-Z (p=0.002, FDR=0.015) decreased significantly when compared to the BBP group.
Metabolites, lipids, proteins and inflammatory markers (GlycA and GlycB) were quantified from the NMR spectra of the serum samples. The metabolite concentrations, as shown in Table 3, revealed significantly elevated levels of ethanol concentration in GBC patients when compared with the BBP group.
To further understand how GBC affects the dysregulation of lipids, PLS analysis was performed to predict the free cholesterol (FC) and cholesterol ester (CE) ratio from the DIFF spectra [14]. Each DIFF spectrum was segmented into 0.001 ppm chemical shift bins in the range between 0.1 and 9.5 ppm, excluding the regions corresponding to the water signals between 4.40 and 5.00 ppm. Correlation between lipoproteins and clinical parameters of GBC showed that both total and conjugated bilirubin have a strong negative or positive association with lipoproteins, as demonstrated in Figure 1A. NMR spectral area of lipoprotein comparing both high and low FC/CE ratios (Table S1) showed the higher ratios at the top, while the lower ones are below (Figure 1C). Furthermore, the lipoprotein profile of GBC patients is dominated by cholestasis (Figure 1D ), as shown in previous studies [14].
Furthermore, a correlation analysis of the metabolites with key clinical parameters was carried out (Figure 2A), and there was no strong correlation observed. Additionally, unsupervised analysis using KODAMA to visualise the metabolic phenotypes and their correlation with high and low FC/CE ratios (Table S2 and Table S3) showed only slight differences between the GBC and BBP groups. However, a larger number of the controls are congregated on the right side, as shown in Figure 2B. Log change of the association of these metabolites with high and low FC/CE ratios showed metabolites such as glycine, ethanol, and histidine have a positive correlation, while creatinine, glutamine, and acetate have a negative correlation with high and low FC/CE ratios (Figure 2C).
4. Discussion
This study presents a comprehensive metabolomic and lipodomic profiling of gall bladder cancer (GBC) in individuals of African ancestry, revealing significant alterations in metabolomic and lipidomic markers associated with disease status and linked to key biological processes. Elevated bilirubin and alkaline phosphatase levels are consistent with cholestasis and biliary obstruction commonly seen in GBC patients, supporting their clinical utility as indicators of the disease [33]. The increase in CRP further highlights the role of systemic inflammation in GBC progression, aligning with previous reports that inflammation contributes to tumour development and metastasis [34]. Interestingly, elevated ethanol levels correlated with worse prognosis, which might indicate metabolic disruptions related to alcohol metabolism or microbial dysbiosis impacting the gallbladder environment [35].
Notably, this study identified significantly increased concentrations of intermediate-density lipoprotein cholesterol (IDL-C), IDL triglycerides (IDL-TG), and low-density lipoprotein triglycerides (LDL-TG) in GBC patients [36]. These findings suggest that an accumulation of atherogenic lipoproteins and triglycerides may be linked to GBC metabolism and tumour microenvironment changes [37]. Elevated IDL and LDL components could reflect altered lipid transport and energy metabolism, potentially supporting the enhanced proliferative and survival demands of malignant cells [38].
Conversely, a significant reduction in high-density lipoprotein cholesterol (HDL-C) and various HDL particle subtypes (total HDL-P, medium HDL-P, and small HDL-P) was observed in GBC cases. HDL is known for its anti-inflammatory and antioxidant properties, and its decrease may compromise protective mechanisms against oxidative stress and inflammation, thereby facilitating tumour progression [39]. The reduction in HDL particles also suggests impaired reverse cholesterol transport, which could contribute to lipid dysregulation in the tumour microenvironment [40].
In GBC patients, an elevated FC/CE ratio indicates inhibited esterification or increased hydrolysis of CE, which leads to accumulation of FC in cellular membranes and altered membrane fluidity and signaling [41]. Cholesterol dysregulation can activate inflammatory responses via NLRP3 inflammasome activation, macrophage recruitment and cytokine release such as IL-1β, TNF-α [42]. This study suggests that a high FC/CE ratio is associated with advanced tumour stages and worse prognosis in GBC.
5. Conclusions
Overall, the study showed the metabolomic and lipodomic profiles in GBC patients compared to the control group. The demonstration of these profiles enhances our understanding of GBC pathophysiology within the patient population, including the identification of potential biomarkers. Future studies with a larger sample size, which should include patients with early disease stages, are critical to investigating the utility of the identified markers as diagnostic and prognostic biomarkers. In addition, more studies are needed to explore the mechanistic underpinnings of lipid metabolism dysregulation in GBC.
Supplementary Materials
The following supporting information can be downloaded at the website of this paper posted on Preprints.org.
Author Contributions
Conceptualization, E.E.N and J.D; methodology, E.E.N., N.E., and S.C; software, N.E. and S.C; validation, M.S, G.C, N.L., and E.E.N.; formal analysis, J.D., N.E., and S.C; investigation, J.D., N.E., and S.C.; resources, M.S, G.C, J.D., and E.E.N.; data curation, J.D., N.E., S.C, A.M. A.P, and E.E.N.; writing—original draft preparation, J.D., N.E., S.C. and E.E.N; writing—review and editing, J.D., N.E., S.C., G.C., M.S, N.L., A.M. A.P and E.E.N.; visualization, N.E., S.C.; supervision, M.S, G.C, and E.E.N.; project administration, E.E.N.; funding acquisition, M.S, G.C, and J.D.. All authors have read and agreed to the published version of the manuscript.
Funding
The study was partially funded by the South African Medical Research Council through a grant awarded to the Wits Common Epithelial Cancer Research Centre.
Institutional Review Board Statement
The study was conducted in accordance with the Declaration of Helsinki, and approved by the Human Research Ethics Committee the University of Witwatersrand (M230780-18/8/2023 and M160640- 31/8/2018).
Informed Consent Statement
Informed consent was obtained from all subjects involved in the study.
Data Availability Statement
All required data are included in the manuscript.
Acknowledgments
The authors would like to acknowledge the clinical staff of the hepatopancreatobiliary unit, Department of Surgery, Chris Hani Baragwanath Academic Hospital, for their assistance with patient recruitment and sample collection.
Conflicts of Interest
The authors declare no conflicts of interest.
Abbreviations
The following abbreviations are used in this manuscript:
| GBC | Gallbladder Cancer |
| BBP | Benign Biliary Pathologies |
| ALP | Alkaline Phosphatase |
| CRP | C-reactive protein |
| GGT | Gamma-Glutamyl Transferase |
| IQR | Interquartile Range |
| FDR | False Discovery Rate |
| VLDL | Very-Low-Density Lipoprotein |
| HDL | High-Density Lipoprotein |
| LDL | Low-Density Lipoprotein |
| PPM | PARTS PER MILLION |
References
- Waller, Giacomo C., and Umut Sarpel. 2024. Gallbladder Cancer. Surgical Clinics of North America 104: 1263–1280. [CrossRef]
- Bray, Freddie, Jacques Ferlay, Isabelle Soerjomataram, Rebecca L. Siegel, Lindsey A. Torre, and Ahmedin Jemal. 2018. Global cancer statistics 2018: GLOBOCAN estimates of incidence and mortality worldwide for 36 cancers in 185 countries. CA: A Cancer Journal for Clinicians 68: 394–424. [CrossRef]
- Torre, Lindsey A., Rebecca L. Siegel, Farhad Islami, Freddie Bray, and Ahmedin Jemal. 2018. Worldwide Burden of and Trends in Mortality From Gallbladder and Other Biliary Tract Cancers. Clinical Gastroenterology and Hepatology 16: 427–437. [CrossRef]
- Abdu, Seid Mohammed, and Ebrahim Msaye Assefa. 2025. Prevalence of gallstone disease in Africa: a systematic review and meta-analysis. BMJ Open Gastroenterology 12: e001441. [CrossRef]
- Khan, Zafar Ahmed, Muhammed Uzayr Khan, and Martin Brand. 2022. Gallbladder cancer in Africa: A higher than expected rate in a “low-risk” population. Surgery 171: 855–858. [CrossRef]
- Siddamreddy, Suman, Sreenath Meegada, Anum Syed, Mujtaba Sarwar, and Vijayadershan Muppidi. 2020. Gallbladder Neuroendocrine Carcinoma: A Rare Endocrine Tumor. Cureus 12: e7487. [CrossRef]
- Rawla, Prashanth, Tagore Sunkara, Krishna Chaitanya Thandra, and Adam Barsouk. 2019. Epidemiology of gallbladder cancer. Clinical and Experimental Hepatology 5: 93–102. [CrossRef]
- Tirca, Luiza, Catalin Savin, Cezar Stroescu, Irina Balescu, Sorin Petrea, Camelia Diaconu, Bogdan Gaspar, Lucian Pop, Valentin Varlas, Adrian Hasegan, and et al. 2024. Risk Factors and Prognostic Factors in GBC. Journal of Clinical Medicine 13: 4201. [CrossRef]
- Zhou, Yanzhao, Kun Yuan, Yi Yang, Zemin Ji, Dezheng Zhou, Jingzhong Ouyang, Zhengzheng Wang, Fuqiang Wang, Chang Liu, Qingjun Li, and et al. 2023. Gallbladder cancer: current and future treatment options. Frontiers in Pharmacology, 14. [CrossRef]
- Shaffer, Eldon, and Rajveer Hundal. 2014. Gallbladder cancer: epidemiology and outcome. Clinical Epidemiology 6: 99–109. [CrossRef]
- Schmidt MA, Marcano-Bonilla L, Roberts LR. Gallbladder cancer: epidemiology and genetic risk associations. Chin Clin Oncol Vol 8 No 4 August 27 2019 Chin Clin Oncol Gallbladder Cancer 2019.
- Raza, Syed Ahsan., Wilson L. da Costa, and Aaron P. Thrift. 2022. Increasing Incidence of Gallbladder Cancer among Non-Hispanic Blacks in the United States: A Birth Cohort Phenomenon. Cancer Epidemiology, Biomarkers & Prevention 31: 1410–1417. [CrossRef]
- Baichan, Pavan, Previn Naicker, Tanya Nadine Augustine, Martin Smith, Geoffrey Candy, John Devar, and Ekene Emmanuel Nweke. 2023. Proteomic analysis identifies dysregulated proteins and associated molecular pathways in a cohort of gallbladder cancer patients of African ancestry. Clinical Proteomics 20: 1–14. [CrossRef]
- Elebo, Nnenna, Jones Omoshoro-Jones, Pascaline N. Fru, John Devar, Christiaan De Wet van Zyl, Barend Christiaan Vorster, Martin Smith, Stefano Cacciatore, Luiz F. Zerbini, Geoffrey Candy, and et al. 2021. Serum Metabolomic and Lipoprotein Profiling of Pancreatic Ductal Adenocarcinoma Patients of African Ancestry. Metabolites 11: 663. [CrossRef]
- Mazibuko, Jeanet, Nnenna Elebo, Aurelia A. Williams, Jones Omoshoro-Jones, John W. Devar, Martin Smith, Stefano Cacciatore, and Pascaline N. Fru. 2024. Metabolites and Lipoproteins May Predict the Severity of Early Acute Pancreatitis in a South African Cohort. Biomedicines 12: 2431. [CrossRef]
- Cacciatore, Stefano, Martha Wium, Cristina Licari, Aderonke Ajayi-Smith, Lorenzo Masieri, Chanelle Anderson, Azola Samkele Salukazana, Lisa Kaestner, Marco Carini, Giuseppina M. Carbone, and et al. 2021. Inflammatory metabolic profile of South African patients with prostate cancer. Cancer & Metabolism 9: 1–14. [CrossRef]
- Elia, Ilaria, and Marcia C. Haigis. 2021. Metabolites and the tumour microenvironment: from cellular mechanisms to systemic metabolism. Nature Metabolism 3: 21–32. [CrossRef]
- Du, Yanzhang, Wennie A. Wijaya, and Wei Hui Liu. 2024. Advancements in metabolomics research in benign gallbladder diseases: A review. Medicine 103: e38126. [CrossRef]
- Sonkar, Kanchan, Anu Behari, V. K. Kapoor, and Neeraj Sinha. 2012. 1H NMR metabolic profiling of human serum associated with benign and malignant gallstone diseases. Metabolomics 9: 515–528. [CrossRef]
- Alam, Mohammad Shaha, A.K.M. Harun-Ar-Rashid, Md. Nazrul Islam, and Fatima Jannat. 2021. The Association of the Serum Lipid Abnormalities in Cholelithiasis Patients. Scholars Journal of Applied Medical Sciences 9: 109–112. [CrossRef]
- Hayat, Sikandar, Zarbakht Hassan, Shabbar Hussain Changazi, Anam Zahra, Muhammad Noman, Muhammad Zain Ul Abdin, Haris Javed, and Armghan Haider Ans. 2019. Comparative analysis of serum lipid profiles in patients with and without gallstones: A prospective cross-sectional study. Annals of Medicine & Surgery 42: 11–13. [CrossRef]
- Harris, Paul A., Robert Taylor, Robert Thielke, Jonathon Payne, Nathaniel Gonzalez, and Jose G. Conde. 2009. Research electronic data capture (REDCap)—A metadata-driven methodology and workflow process for providing translational research informatics support. Journal of Biomedical Informatics 42: 377–381. [CrossRef]
- Elebo, Nnenna, Ebtesam A. Abdel-Shafy, Jones A. O. Omoshoro-Jones, Zanele Nsingwane, Ahmed A. A. Hussein, Martin Smith, Geoffrey Candy, Stefano Cacciatore, Pascaline Fru, and Ekene Emmanuel Nweke, and et al. 2024. Comparative immune profiling of pancreatic ductal adenocarcinoma progression among South African patients. BMC Cancer 24: 1–14. [CrossRef]
- Nunes, Sofia C., Joana Sousa, Fernanda Silva, Margarida Silveira, António Guimarães, Jacinta Serpa, Ana Félix, and Luís G. Gonçalves. 2023. Peripheral Blood Serum NMR Metabolomics Is a Powerful Tool to Discriminate Benign and Malignant Ovarian Tumors. Metabolites 13: 989. [CrossRef]
- Serkova, Natalie, T. Florian Fuller, Jost Klawitter, Chris E. Freise, and Claus U. Niemann. 2005. 1H-NMR–based metabolic signatures of mild and severe ischemia/reperfusion injury in rat kidney transplants. Kidney International 67: 1142–1151. [CrossRef]
- Otvos, James D, Irina Shalaurova, Justyna Wolak-Dinsmore, Margery A Connelly, Rachel H Mackey, James H Stein, and Russell P Tracy. 2015. GlycA: A Composite Nuclear Magnetic Resonance Biomarker of Systemic Inflammation. Clinical Chemistry 61: 714–723. [CrossRef]
- Mallol, Roger, Núria Amigó, Miguel Angel Rodriguez, Mercedes Heras, Maria Vinaixa, Núria Plana, Edmond Rock, Josep Ribalta, Oscar Yanes, Lluís Masana, and et al. 2015. Liposcale: a novel advanced lipoprotein test based on 2D diffusion-ordered 1H NMR spectroscopy. Journal of Lipid Research 56: 737–746. [CrossRef]
- Jeyarajah, Elias J., William C. Cromwell, and James D. Otvos. 2006. Lipoprotein Particle Analysis by Nuclear Magnetic Resonance Spectroscopy. Clinics In Laboratory Medicine 26: 847–870. [CrossRef]
- Rodríguez-Tomàs, Elisabet, Mauricio Murcia, Meritxell Arenas, Mònica Arguís, Miriam Gil, Núria Amigó, Xavier Correig, Laura Torres, Sebastià Sabater, Gerard Baiges-Gayà, and et al. 2019. Serum Paraoxonase-1-Related Variables and Lipoprotein Profile in Patients with Lung or Head and Neck Cancer: Effect of Radiotherapy. Antioxidants 8: 213. [CrossRef]
- Cacciatore, Stefano, Leonardo Tenori, Claudio Luchinat, Phillip R Bennett, David A MacIntyre, and Jonathan Wren. 2016. KODAMA: an R package for knowledge discovery and data mining. Bioinformatics 33: 621–623. [CrossRef]
- Cacciatore, Stefano, Claudio Luchinat, and Leonardo Tenori. 2014. Knowledge discovery by accuracy maximization. Proceedings of the National Academy of Sciences 111: 5117–5122. [CrossRef]
- Abdel-Shafy EA, Kassim M, Vignoli A, Mamdouh F, Tyekucheva S, Ahmed D, et al. KODAMA enables self-guided weakly supervised learning in spatial transcriptomics. BioRxiv 2025:2025–05.
- Shah R, Grant LM, John S. Cholestatic Jaundice. StatPearls Publishing, Treasure Island (FL); 2025.
- Kim, Eun-Sook, Sun Young Kim, and Aree Moon. 2023. C-Reactive Protein Signaling Pathways in Tumor Progression. Biomolecules & Therapeutics 31: 473–483. [CrossRef]
- Caputo, Fabio, Matteo Guarino, Alberto Casabianca, Lisa Lungaro, Anna Costanzini, Giacomo Caio, Giorgio Zoli, and Roberto De Giorgio. 2024. Effects of Ethanol on the Digestive System: A Narrative Review. Journal of Translational Gastroenterology 000: 000–000. [CrossRef]
- Yoshida, Hiroshi, Kumie Ito, Daisuke Manita, Ryo Sato, Chika Hiraishi, Sadako Matsui, and Yuji Hirowatari. 2021. Clinical Significance of Intermediate-Density Lipoprotein Cholesterol Determination as a Predictor for Coronary Heart Disease Risk in Middle-Aged Men. Frontiers in Cardiovascular Medicine, 8. [CrossRef]
- Maran, Logeswaran, Auni Hamid, Shahrul Bariyah Sahul Hamid, and Philip W. Wertz. 2021. Lipoproteins as Markers for Monitoring Cancer Progression. Journal of Lipids 2021: 1–17. [CrossRef]
- Delmas, Dominique, Aurélie Mialhe, Alexia K. Cotte, Jean-Louis Connat, Florence Bouyer, François Hermetet, and Virginie Aires. 2025. Lipid metabolism in cancer: Exploring phospholipids as potential biomarkers. Biomedicine & Pharmacotherapy 187: 118095. [CrossRef]
- Feingold KR. Introduction to Lipids and Lipoproteins. MDText.com, Inc., South Dartmouth (MA); 2000.
- Madaudo, Cristina, Giada Bono, Antonella Ortello, Giuseppe Astuti, Giulia Mingoia, Alfredo Ruggero Galassi, and Vincenzo Sucato. 2024. Dysfunctional High-Density Lipoprotein Cholesterol and Coronary Artery Disease: A Narrative Review. Journal of Personalized Medicine 14: 996. [CrossRef]
- Ding, Xiao, Weihua Zhang, Song Li, and Hui Yang. 2019. The role of cholesterol metabolism in cancer. 9: 219–227.
- Rajamäki, Kristiina, Jani Lappalainen, Katariina Öörni, Elina Välimäki, Sampsa Matikainen, Petri T. Kovanen, Kari K. Eklund, and Derya Unutmaz. 2010. Cholesterol Crystals Activate the NLRP3 Inflammasome in Human Macrophages: A Novel Link between Cholesterol Metabolism and Inflammation. PLOS ONE 5: e11765–e11765. [CrossRef]
Figure 1.
Overview of the Lipoprotein Profiles in Gallbladder Cancer and Benign Biliary Pathology Patients. A) Correlation between lipoprotein features and clinical parameters. Both total and conjugated bilirubin have a strong negative or positive association with lipoproteins B) Box and Whiskers plot comparing LDL, Triglycerides and HDL cholesterol for GBC and Controls. C) NMR spectral area of lipoprotein comparing high and low FC/CE ratios. The dark blue lines indicate the high ratios, while the light blue lines indicate the lower ratios. D) Unsupervised analysis using KODAMA showed that the GBC group in the lower right quadrant have a different NMR profile from others, and this may be linked to cholestasis. ALP, alkaline phosphatase; C, cholesterol; CE, cholesterol ester; Conj Bili, conjugated bilirubin; CRP, C-reactive protein; FC, free cholesterol; GBC, gallbladder cancer; GGT, gamma-glutamyl transferase; HDL, high-density lipoprotein; LDL, low-density lipoprotein; P, particle; Tbili, total bilirubin; ppm, parts per million; TG, triglycerides; VLDL, very-low-density lipoprotein.
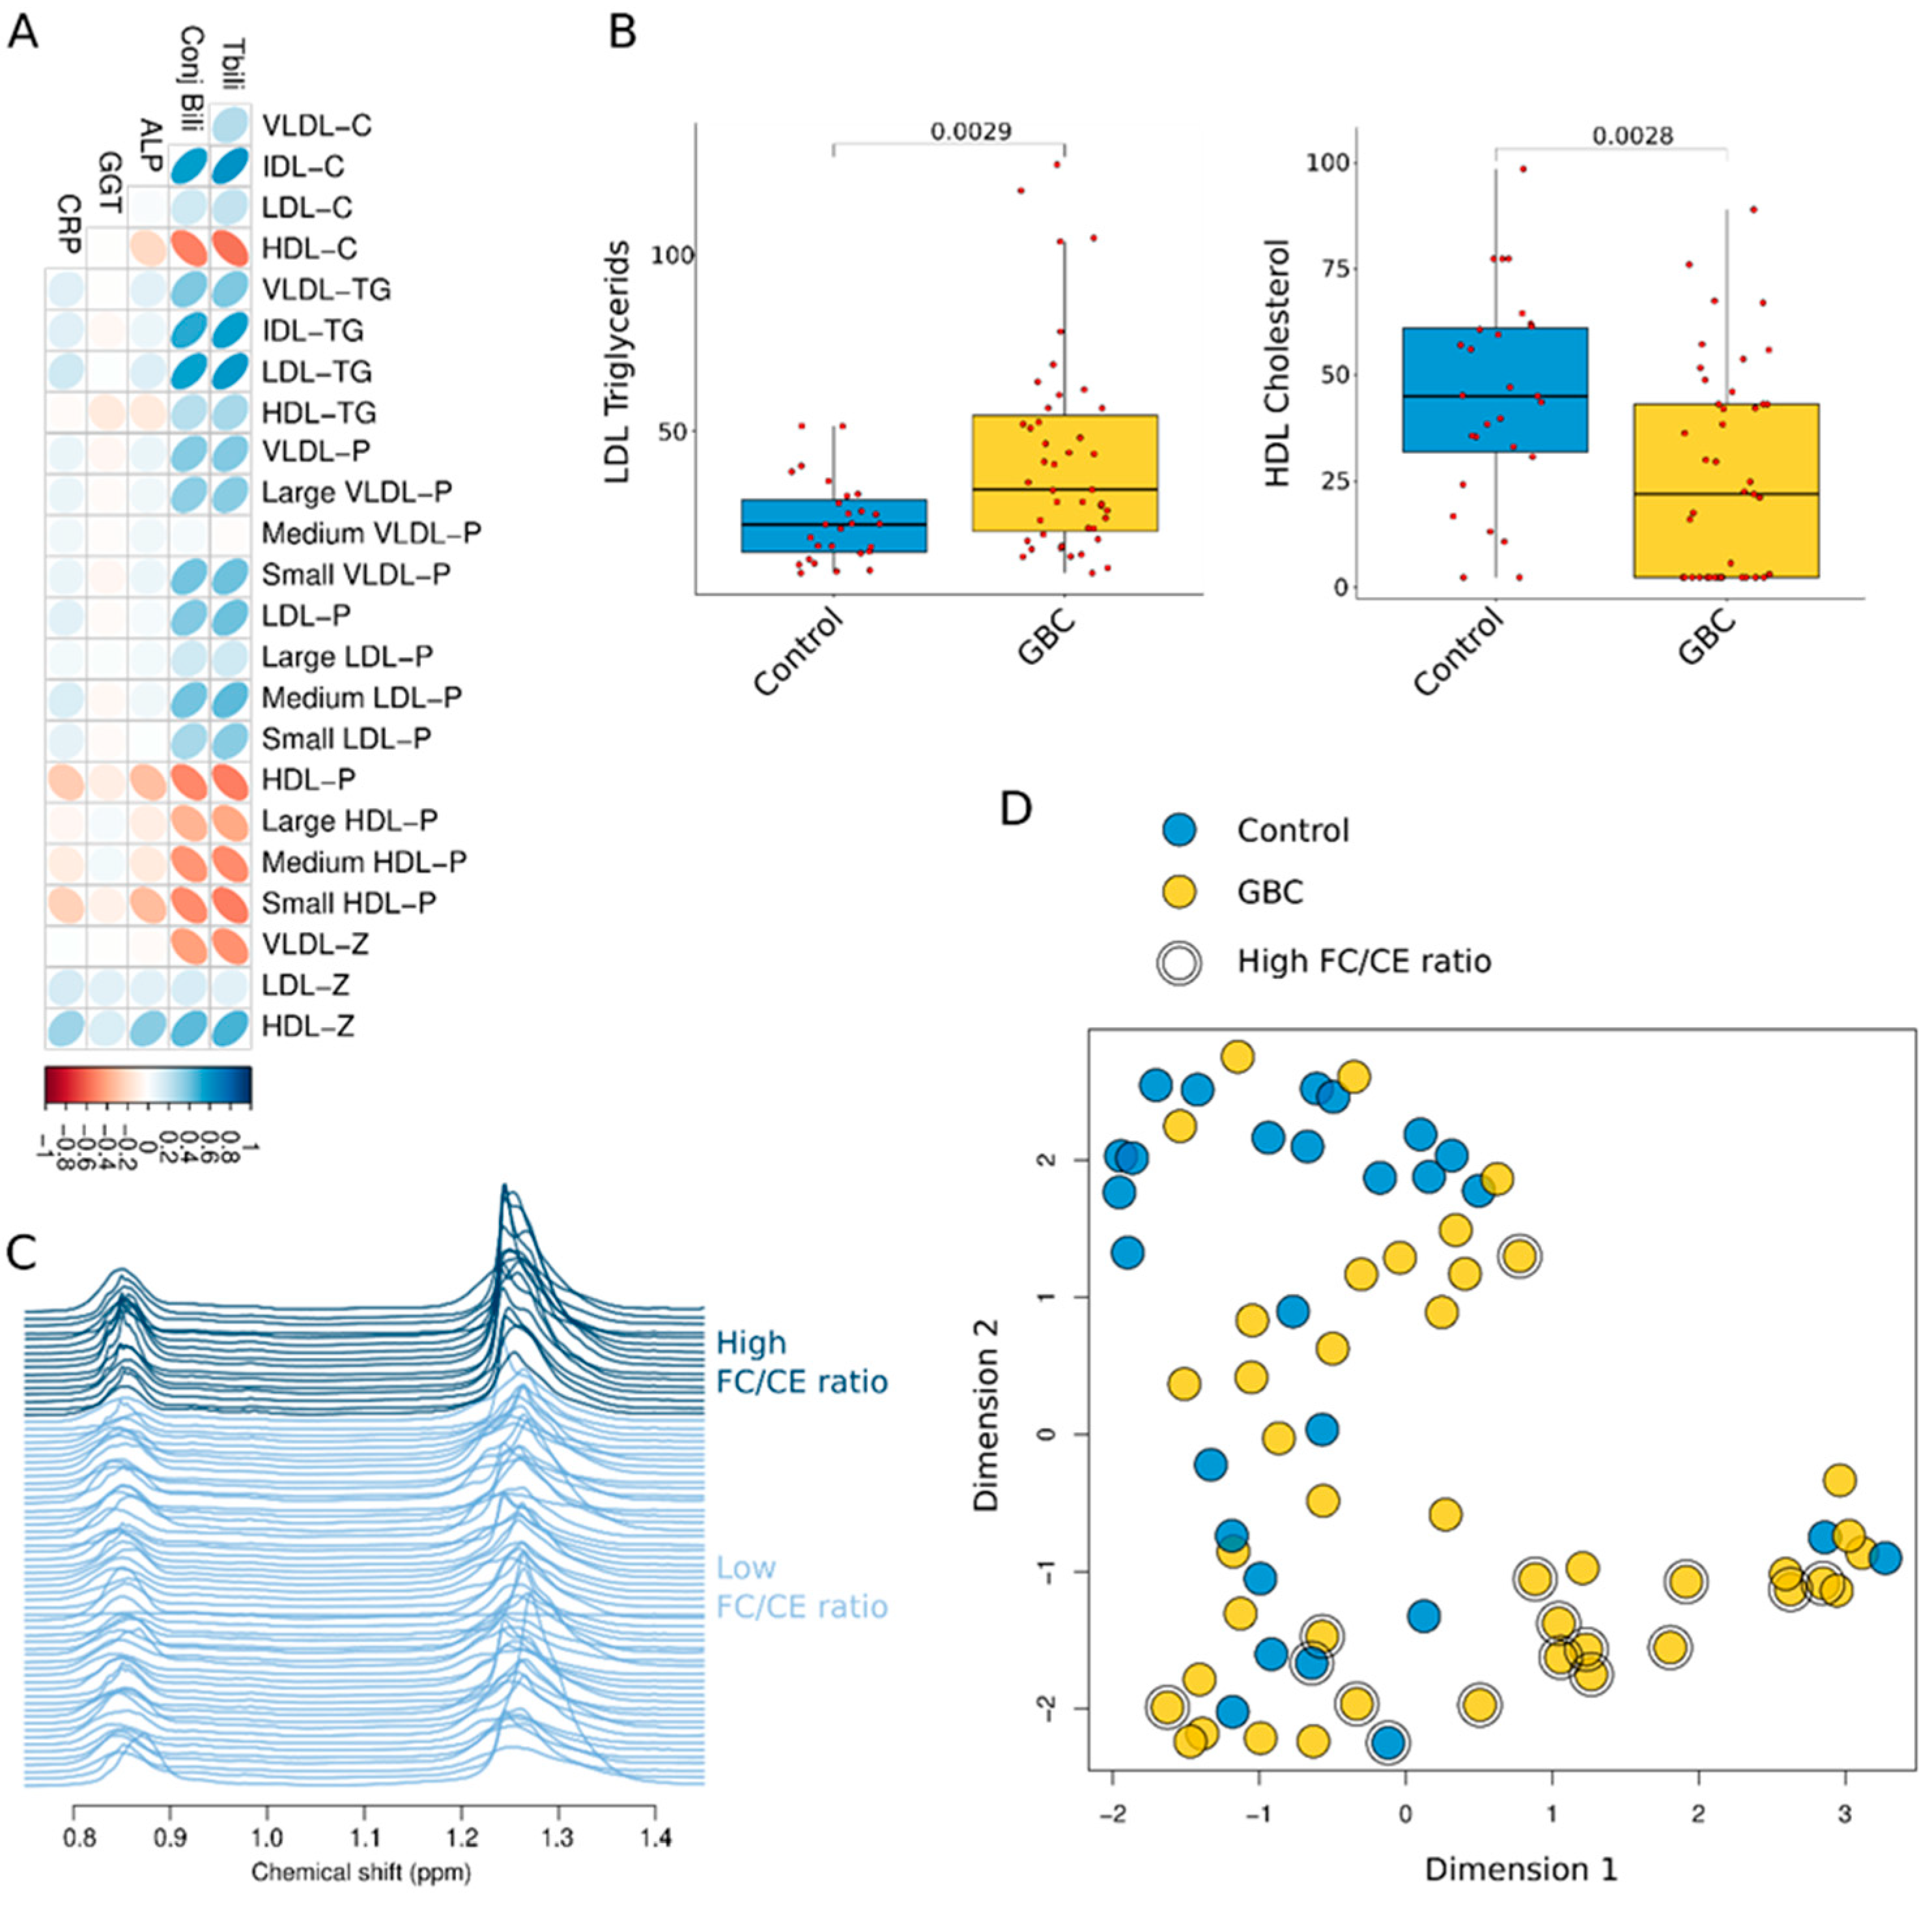
Figure 2.
Overview of the Metabolic Phenotypes in GBC A) Correlation between metabolic profiles and clinical parameters. There was no strong correlation observed. B) Unsupervised analysis using KODAMA showed little difference between the controls and GBC. However, a larger number of the controls are on the right side. C) Log change of the association of these metabolites with high (blue) and low (yellow) FC/CE ratios showed metabolites with strong positive/negative correlation with high and low FC/CE ratios. ALP, alkaline phosphatase; C, cholesterol; CE, cholesterol ester; Conj Bili, conjugated bilirubin; CRP, C-reactive protein; FC, free cholesterol; GBC, gallbladder cancer; GGT, gamma-glutamyl transferase; Tbili, total bilirubin; ppm, parts per million.
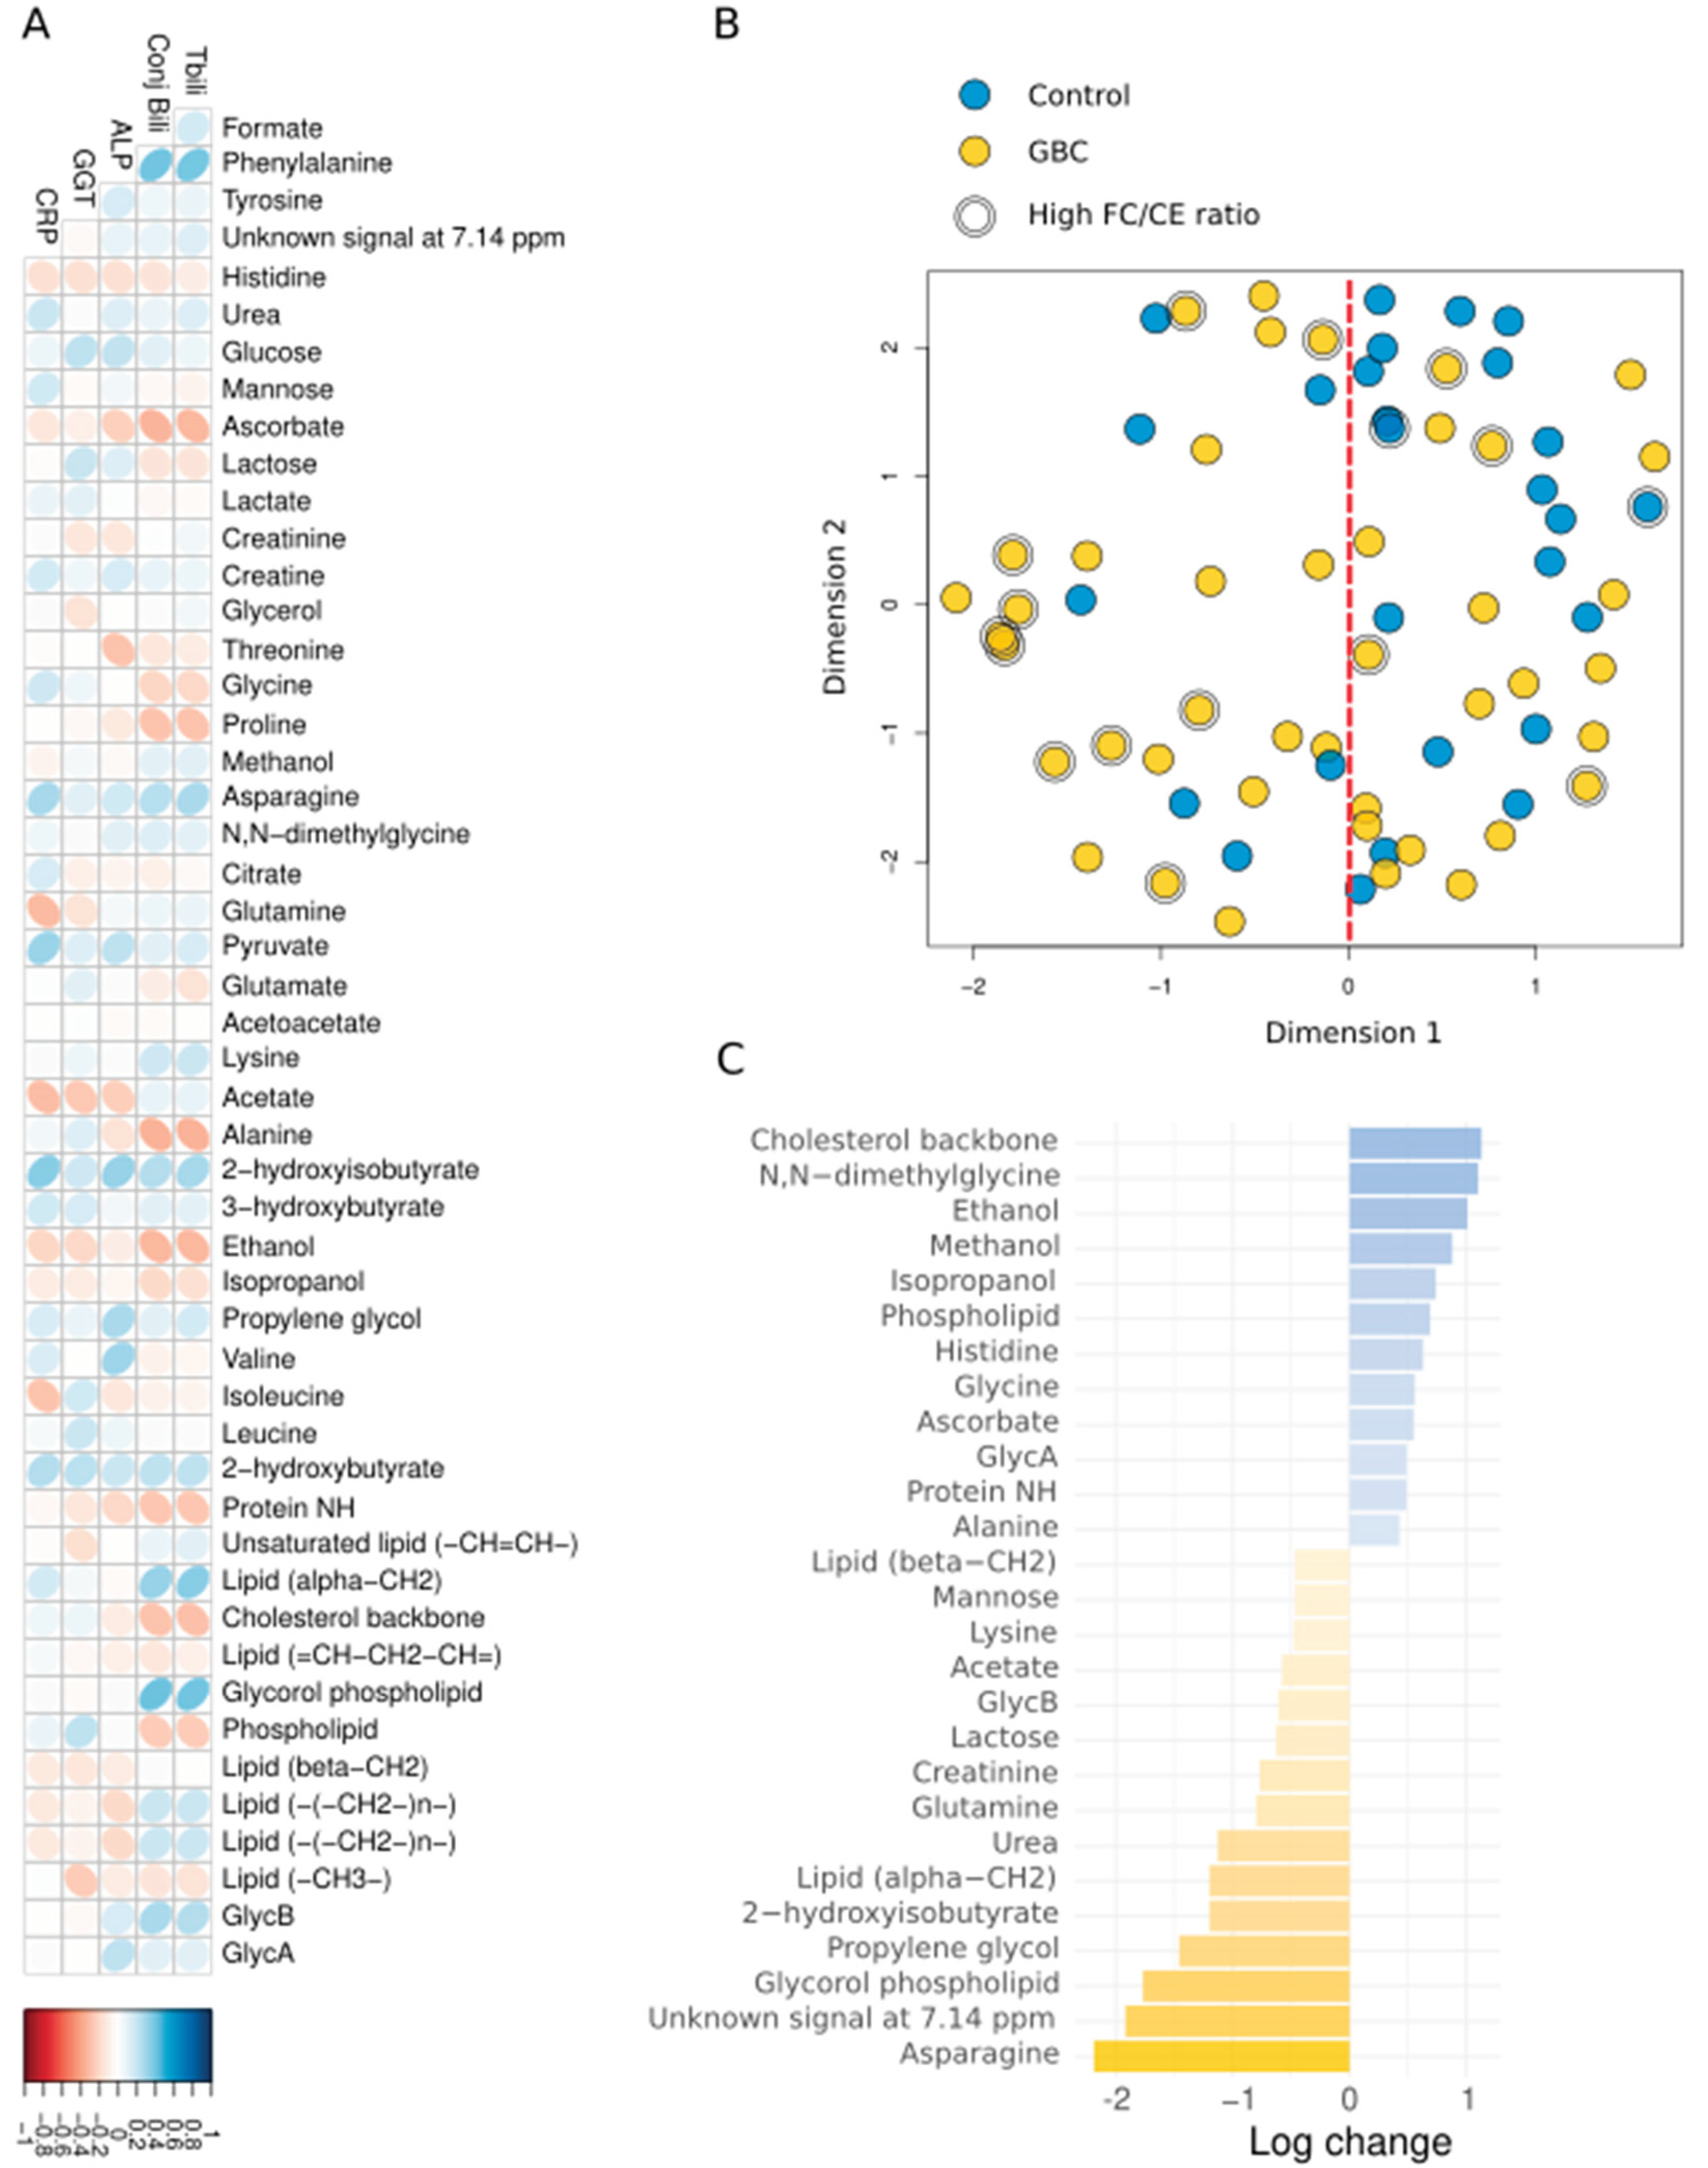

Table 1.
Clinicopathological Features of Gallbladder Cancer and Benign Biliary Pathology Control Patients.
Table 1.
Clinicopathological Features of Gallbladder Cancer and Benign Biliary Pathology Control Patients.
| Feature |
Control (BBP) (n=27) |
GBC (n=43) |
p-value |
| Age (year), median [IQR] | 53 [42 66] | 61.5 [55.75 72] | 0.0795 |
| Gender | 0.610 | ||
| Female, n (%) | 18 (66.7) | 23 (57.5) | |
| Male, n (%) | 9 (33.3) | 17 (42.5) | |
| Total bilirubin, median [IQR] | 16.5 [12 31] | 216.5 [93.5 322.75] | <0.001 |
| Conjugated bilirubin, median [IQR] | 13.5 [4.75 26] | 174.5 [76.25 252.75] | <0.001 |
| ALP, median [IQR] | 308.5 [127.25 499.25] | 564 [323.25 909.25] | 0.0396 |
| GGT, median [IQR] | 452 [159 612] | 490 [234 693.5] | 0.436 |
| CRP, median [IQR] | 22.5 [7.25 83.25] | 74 [40 191] | 0.0234 |
Abbreviations: ALP, alkaline phosphatase; CRP, C-reactive protein; GBC, gallbladder cancer; GGT, gamma-glutamyl transferase; IQR, interquartile range.
Table 2.
Comparison of Lipoprotein Analyses in Benign Biliary Pathology and Gallbladder Cancer Patients.
Table 2.
Comparison of Lipoprotein Analyses in Benign Biliary Pathology and Gallbladder Cancer Patients.
| Feature |
Control (BBP) median [IQR] |
GBC median [IQR] |
p-value | FDR |
| VLDL-C (nmol/L) | 16.80 [8.45 21.14] | 17.39 [9.83 26.65] | 0.356 | 0.431 |
| IDL-C (nmol/L) | 16.74 [10.03 23.09] | 31.39 [15.60 54.00] | 0.004 | 0.016 |
| LDL-C (nmol/L) | 128.24 [111.14 151.88] | 135.07 [108.15 158.03] | 0.596 | 0.623 |
| HDL-C (nmol/L) | 45.05 [31.93 61.11] | 21.96 [2.33 43.16] | 0.003 | 0.014 |
| VLDL-TG (nmol/L) | 58.23 [41.02 80.58] | 72.52 [54.64 103.61] | 0.122 | 0.227 |
| IDL-TG (nmol/L) | 16.54 [10.44 19.51] | 21.76 [13.97 37.01] | 0.008 | 0.028 |
| LDL-TG (nmol/L) | 23.69 [15.76 30.69] | 33.52 [21.67 54.59] | 0.003 | 0.014 |
| HDL-TG (nmol/L) | 16.75 [13.19 22.18] | 18.77 [14.13 23.88] | 0.469 | 0.539 |
| VLDL-P (nmol/L) | 43.80 [29.76 59.27] | 51.90 [38.16 74.81] | 0.138 | 0.227 |
| Large VLDL-P (nmol/L) | 0.99 [0.77 1.38] | 1.29 [0.90 1.62] | 0.158 | 0.227 |
| Medium VLDL-P (nmol/L) | 4.57 [3.59 6.19] | 5.06 [3.60 6.64] | 0.699 | 0.699 |
| Small VLDL-P (nmol/L) | 37.02 [26.24 52.90] | 47.74 [32.25 65.59] | 0.144 | 0.227 |
| LDL-P (nmol/L) | 1342.60 [1108.71 1514.31] | 1507.93 [1181.12 1871.08] | 0.087 | 0.199 |
| Large LDL-P (nmol/L) | 211.87 [175.09 248.48] | 229.47 [165.51 280.72] | 0.341 | 0.431 |
| Medium LDL-P (nmol/L) | 457.87 [325.68 610.36] | 657.09 [429.20 841.00] | 0.031 | 0.079 |
| Small LDL-P (nmol/L) | 642.81 [547.50 731.08] | 668.13 [558.67 754.12] | 0.554 | 0.607 |
| HDL-P (mol/L) | 22.67 [13.70 31.15] | 13.21 [5.18 22.18] | 0.002 | 0.014 |
| Large HDL-P (mol/L) | 0.30 [0.26 0.35] | 0.27 [0.21 0.34] | 0.141 | 0.227 |
| Medium HDL-P (mol/L) | 9.98 [9.47 12.17] | 8.72 [6.28 11.39] | 0.013 | 0.039 |
| Small HDL-P (mol/L) | 12.35 [2.43 20.22] | 4.06 [0.07 9.99] | 0.003 | 0.014 |
| VLDL-Z (nm) | 42.19 [42.17 42.22] | 42.18 [42.16 42.20] | 0.334 | 0.431 |
| LDL-Z (nm) | 21.28 [21.16 21.50] | 21.41 [21.17 21.57] | 0.155 | 0.227 |
| HDL-Z (nm) | 8.40 [8.31 8.92] | 8.76 [8.53 9.56] | 0.003 | 0.014 |
Abbreviations: C, cholesterol; GBC, gallbladder cancer; FDR, false discovery rate; HDL, high-density lipoprotein; IQR, interquartile range; LDL, low-density lipoprotein; P, particle; TG, triglycerides; VLDL, very-low-density lipoprotein.
Table 3.
Comparison of Metabolite Concentrations in Benign Biliary Pancreatitis Controls and Gallbladder Cancer Patients.
Table 3.
Comparison of Metabolite Concentrations in Benign Biliary Pancreatitis Controls and Gallbladder Cancer Patients.
| Feature | BBP (median [IQR]) | GBC (median [IQR]) | p-value | FDR |
| Formate | 0.01 [0.01 0.02] | 0.02 [0.01 0.02] | 0.499 | 0.713 |
| Phenylalanine | 0.14 [0.09 0.23] | 0.26 [0.14 0.33] | 0.013 | 0.276 |
| Tyrosine | 0.08 [0.05 0.12] | 0.08 [0.04 0.12] | 0,828 | 0.920 |
| Unknown signal at 7.14 ppm | 0 [0 0.02] | 0.01 [0 0.10] | 0.044 | 0.276 |
| Histidine | 0.07 [0.03 0.09] | 0.06 [0.02 0.08] | 0.138 | 0.459 |
| Urea | 0.26 [0.11 0.45] | 0.25 [0.15 0.34] | 0.894 | 0.932 |
| Glucose | 1.89 [1.40 2.40] | 1.71 [0.91 2.34] | 0.579 | 0.762 |
| Mannose | 0.04 [0.02 0.06] | 0.04 [0.02 0.06] | 0.933 | 0.942 |
| Ascorbate | 0.01 [0 0.01] | 0 [0 0.004] | 0.243 | 0.534 |
| Lactose | 0.02 [0.01 0.03] | 0.02 [0.01 0.03] | 0.476 | 0.700 |
| Lactate | 1.64 [0.80 2.19] | 1.44 [0.91 2.38] | 0.942 | 0.942 |
| Creatinine | 0.11 [0.05 0.13] | 0.12 [0.07 0.15] | 0.278 | 0.534 |
| Creatine | 0.03 [0.02 0.06] | 0.06 [0.02 0.09] | 0.162 | 0.475 |
| Glycerol | 0.27 [0.12 0.33] | 0.23 [0.08 0.36] | 0.625 | 0.765 |
| Threonine | 0.18 [0.10 0.24] | 0.10 [0.07 0.15] | 0.021 | 0.276 |
| Glycine | 0.72 [0.58 0.92] | 0.58 [0.27 0.76] | 0.038 | 0.276 |
| Proline | 0.12 [0.02 0.22] | 0.06 [0.02 0.14] | 0.149 | 0.464 |
| Methanol | 0.06 [0.04 0.09] | 0.05 [0.02 0.10] | 0.419 | 0.654 |
| Asparagine | 0 [0 0.01] | 0.006 [0 0.02] | 0.022 | 0.276 |
| N,N-dimethylglycine | 0.02 [0.01 0.04] | 0.03 [0.01 0.05] | 0.278 | 0.534 |
| Citrate | 0.09 [0.02 0.23] | 0.04 [0 0.16] | 0.267 | 0.534 |
| Glutamine | 0.34 [0.22 0.51] | 0.33 [0.14 0.54] | 0.642 | 0.765 |
| Pyruvate | 0.06 [0.03 0.1] | 0.11 [0.04 0.19] | 0.030 | 0.276 |
| Glutamate | 0.42 [0.27 0.81] | 0.39 [0.21 0.73] | 0.530 | 0.717 |
| Acetoacetate | 0.13 [0.08 0.20] | 0.1 [0.05 0.20] | 0.334 | 0.567 |
| Lysine | 0.02 [0.01 0.03] | 0.02 [0.01 0.03] | 0.847 | 0.921 |
| Acetate | 0.10 [0.06 0.13] | 0.09 [0.05 0.13] | 0.523 | 0.717 |
| Alanine | 1.06 [0.39 1.30] | 0.78 [0.38 1.08] | 0.197 | 0.534 |
| 2-hydroxyisobutyrate | 0.01 [0.002 0.02] | 0.01 [0.004 0.02] | 0.340 | 0.567 |
| 3-hydroxybutyrate | 0.18 [0.01 0.68] | 0.19 [0.11 0.62] | 0.299 | 0.534 |
| Ethanol | 0.55 [0.13 1.23] | 0 [0 0.31] | <0.001 | 0.033 |
| Isopropanol | 0.07 [0.001 0.27] | 0 [0 0.13] | 0.073 | 0.367 |
| Propylene glycol | 0.01 [0 0.02] | 0.01 [0 0.03] | 0.622 | 0.765 |
| Valine | 0.38 [0.23 0.50] | 0.43 [0.17 0.52] | 0.791 | 0.919 |
| Isoleucine | 0.1 [0.03 0.14] | 0.04 [0.01 0.11] | 0.133 | 0.459 |
| Leucine | 0.45 [0.25 0.67] | 0.41 [0.19 0.54] | 0.252 | 0.534 |
| 2-hydroxybutyrate | 0.03 [0 0.05] | 0.05 [0.01 0.09] | 0.095 | 0.432 |
| Protein NH | 130.19 [59.36 160.12] | 123.42 [58.31 143.17] | 0.440 | 0.667 |
| Unsaturated lipid (-CH=CH-) | 17.08 [9.57 31.18] | 19.79 [10.97 27.96] | 0.819 | 0.920 |
| Lipid (alpha-CH2) | 3.06 [1.34 4.74] | 3.42 [1.61 8.74] | 0.214 | 0.534 |
| Cholesterol backbone (-C(18)H3), | 2.69 [1.89 3.53] | 1.62 [0.79 2.90] | 0.039 | 0.276 |
| Lipid (=CH-CH2-CH=) | 10.42 [5.84 14.19] | 8.68 [4.55 11.11] | 0.205 | 0.534 |
| Glycorol phospholipid | 0.29 [0.12 0.68] | 0.52 [0.16 1.26] | 0.068 | 0.367 |
| Phospholipid | 4.07 [2.53 5.14] | 3.24 [1.54 4.56] | 0.111 | 0.459 |
| Lipid (beta-CH2) | 15.39 [10.21 17.51] | 11.89 [6.02 19.75] | 0.385 | 0.621 |
| Lipid (-(-CH2-)n-) | 104.28 [45.91 158.99] | 126.27 [59.81 188.26] | 0.294 | 0.534 |
| Lipid (-(-CH2-)n-) | 104.28 [45.91 158.99] | 126.27 [59.81 188.26] | 0.294 | 0.534 |
| Lipid (-CH3-) | 77.767 [34.58 96.66] | 71.65 [32.79 99.77] | 0.875 | 0.931 |
| GlycB | 0.89 [0.48 1.27] | 1.12 [0.75 1.50] | 0.138 | 0.459 |
| GlycA | 4.51 [3.21 5.69] | 4.63 [2.58 7.11] | 0.629 | 0.765 |
Abbreviations: FDR, false discovery rate; GBC, gallbladder cancer; ppm, parts per million.
Disclaimer/Publisher’s Note: The statements, opinions and data contained in all publications are solely those of the individual author(s) and contributor(s) and not of MDPI and/or the editor(s). MDPI and/or the editor(s) disclaim responsibility for any injury to people or property resulting from any ideas, methods, instructions or products referred to in the content. |
© 2025 by the authors. Licensee MDPI, Basel, Switzerland. This article is an open access article distributed under the terms and conditions of the Creative Commons Attribution (CC BY) license (http://creativecommons.org/licenses/by/4.0/).
Copyright: This open access article is published under a Creative Commons CC BY 4.0 license, which permit the free download, distribution, and reuse, provided that the author and preprint are cited in any reuse.


