Submitted:
18 July 2025
Posted:
22 July 2025
You are already at the latest version
Abstract
Background: Unlike melanoma, cancer cell lines like Hepa 1-6 liver cancer line, A549 lung cancer line, Hela cervical cancer line, and MCF7 breast cancer line do not have over expressed tyrosinase to convert quercetin into its active o-quinone. Furthermore, they do not need extracellular supply of tyrosine for growth, since they can produce this intracellularly. Method: In this study we used (1) nanocapsules containing polyhemoglobin-tyrosinase (PolyHb-Tyr-nano) to activate the prodrug quercetin. (2) We also located these nanocapsules intracellularly to remove the tyrosine produced intracellularly. We studied this in 4 cancer cell lines: Hepa 1-6 liver cancer line, A549 lung cancer Hela cervical cancer line, and MCF7 breast cancer line. Results: (1) Nanocapsules containing polyhemoglobin-tyrosinase (PolyHb-Tyr-nano) activate the prodrug resulting in increased intracellular o-quinone and suppression of the cancer cell lines. (2) Intracellular located nanocapsules containing polyhemoglobin-tyrosinase (PolyHb-Tyr-nano) were able to lower intracellular tyrosine and suppressed the growth of these cancer cell lines. Furthermore, for PolyHb-Tyr-nano, the dosage needed to suppress 50% of the liver cancer cells (LD50), is 0.7808 mg/ml. In the normal liver cells, the LD50 is 84181 mg/ml. Compared to the result of quercetin activation of LD50 (2.73mg/ml in liver cancer, and 74.18mg/ml in normal hepatocytes). Conclusion: Promising result of using nanocapsules containing polyhemoglobin-tyrosinase (PolyHb-Tyr-nano) to (1) activate the prodrug quercetin and (2) locating these nanocapsules intracellularly to remove the tyrosine produced intracellularly. Method (2) appears to be effective with virtually no adverse effects compared to activation of quercetin.
Keywords:
artificial cells
; nanocapsules
; nanobiotherapeutic
; cancers
; prodrug
; tyrosine
; quercetin. o-quinone
; intracellular targeting
; liver
; lung
; breast
; cervix
1. Introduction
In 1964, Chang reported the idea of “artificial cells” nanocapsules: ultrathin polymer membrane bioencapsulation of biological materials, such as cells, hemoglobin, enzymes, and other biological materials, that could act on external permeant molecules in order to replace or replenish cells that were missing functions [1]. This concept has led to novel approaches, applications, and variations in configurations, including capsules of micro and nanodimensions, nanoparticles, nanocapsules, liposomes, nanobiotherapeutics and others [Figure 1] [2]. He reported the first successful use of bioencapsulated asparaginase to deplete asparagine and thus suppress the growth of lymphosarcoma in a mice model [3].
Meadows’ group showed that melanoma, a skin cancer, has a higher need for tyrosine for growth than normal cells [4]. They showed that a tyrosine depletion diet has an antitumor effect in mice. However, their early clinical trials of a tyrosine depletion diet demonstrated that it led to weight loss, appetite suppression, nausea, and malnutrition [5]. Instead of dietary tyrosine depletion, Chang’s group introduced a new approach by using a polyhemoglobin–tyrosinase (PolyHb-Tyr). This delay but not suppress the growth of melanoma in mice [6]. They found that PolyHb-Tyr-nanocapsules (PolyHb-Tyr-nano) [7] could stay longer at the injection sites to effectively lowered tyrosine levels in the tumor microenvironment (TME) [7]. Further studies on the B16F10 melanoma line show the effectiveness of PolyHb-Tyr-nano in inhibiting metastasis, proliferation, migration, and colonization [8]. Their in-vivo studies on mice showed the safety and effectiveness of this approach, there was no change in the body weight or in the histological analysis of major organs.
Due to tumors having high amino acid demands—in order to fulfill their fast proliferation and energy requirements—there is an increasing amount of interest in the new field of targeting tumor metabolism and interfering with amino acid availability [9]. To accomplish amino acid depletion therapy, researchers have been modifying enzymatic drugs to remove amino acids [10,11]. To date, various metabolic inhibitors and nutrient-depleting enzymes have been tested for their antitumor activities, including glutamine, asparagine, and arginine depletions [12,13,14]. However, some tumours do not depend on the supply of external tyrosine for growth, since they can synthesize their own tyrosine. In this paper instead of targeting the extracellular supply of tyrosine we study the intracellular targeting to remove the tyrosine produced by 4 cancer cell lines: Hepa 1-6 liver cancer line, A549 lung cancer Hela cervical cancer line, and MCF7 breast cancer line using nanobiotherapeutic PolyHb-Tyr-nanocapsules.
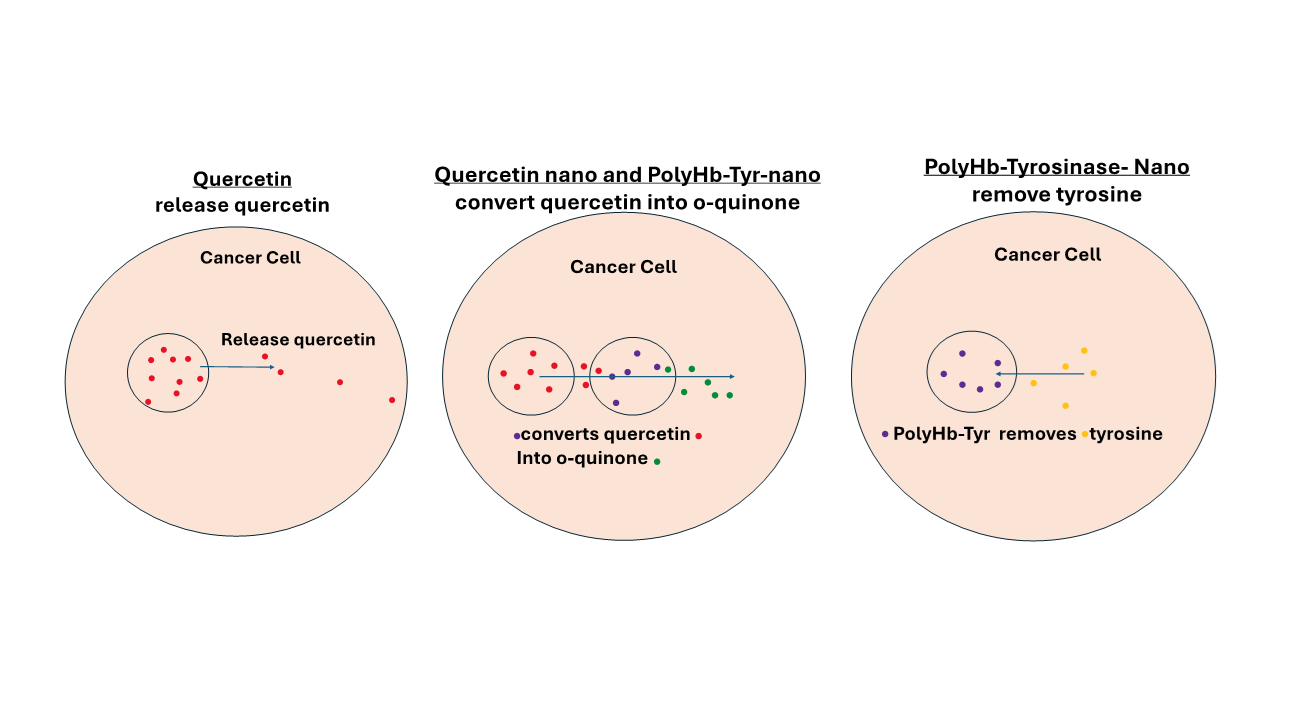
Quercetin [15,16,17,18] is an anticancer flavonoid that we also investigated for melanoma treatment. We nanoencapsulated quercetin into quercetin nanocapsules. As a result, demonstrated significantly prolonged and enhanced antitumor effects against multiple melanoma cell lines [19]. However, the prodrug quercetin has to be activated into its active form o-quinone. O-quinone induce reactive oxygen species (ROS) oxidative stress, genotoxicity, and p53 apoptotic pathways, which leads to tumor inhibition [16,17,18]. However, many tumors do not express enough tyrosinase to activate the prodrug into o-quinone. Thus, in this study, we combined quercetin nanocapsules with PolyHb-Tyr-nanoapsules, to convert this prodrug, in cancers that do not express enough tyrosinase. The four cancer cell lines were carefully selected (liver, lung, cervical, and breast) for this study based on their high occurrence rates globally. Moreover, there were no prior studies examining the effects of quercetin activation by PolyHb-Tyr-nano on these cancers.
2. Materials and Methods
Materials
Purified ultrapure bovine hemoglobin was purchased from the Biopure company. Hepa1-6, A549, HeLa, and MCF7 cancer lines were purchased from the Creative Bio-gene company. Glutaraldehyde (25%) (cat# 00376-500) was obtained from Polysciences. Quercetin flavonoid was obtained from Abcam Inc (cat# ab120247-100MG). Poly(D,L-lactic acid), IV 0.4 dl/g, was obtained from Polysciences Inc. (cat# 16585-10). L-Lysine monohydrochloride (SigmaUltra >99%) (cat# L8662-1KG), L-tyrosine [98% thin layer chromatography (TLC)] (cat# T2006-1G), and Tyrosinase from mushroom (EC 1.14.18.1, 3000 units/mg stated activity) were obtained from Sigma-Aldrich (cat# T3824-50KU). Phenylalanine ammonia-lyase (PAL) was obtained from MilliporeSigma Canada Ltd. (cat# P1016-10UN). Bisbenzimide H 33342 was obtained from Abcam Inc (cat# ab145597-25MG). Coumarin 6, 99+%, was obtained from MilliporeSigma Canada Ltd. (cat# 546283-100MG). CellMask Deep Red Plasma Membrane Stain was obtained from Life Technologies Inc (cat# C10046). Collagen I rat tail was obtained from Thermo Fisher Scientific (cat# A1048301). Nutrient agar plates were obtained from Thermo Fisher Scientific (cat# 50948606). Human Plateable Hepatocytes, Uptake Qualified were obtained from Life Technologies Inc (cat# HMCPUS). Primary Hepatocyte Maintenance Supplements were obtained from Life Technologies Inc cat# CM4000.
Cell Culture
The Hepa 1-6 mice liver cancer line was cultured in standard Dulbecco’s Modified Eagle’s Medium (DMEM) supplemented with 10% fetal bovine serum (FBS). The A549 human lung cancer line was cultured in DMEM/F-12 (Dulbecco’s Modified Eagle Medium/Nutrient Mixture F-12) supplemented with 5% HI FBS. The HeLa human cervical cancer line was cultured in DMEM supplemented with 10% FBS. The MCF7 human breast cancer line was cultured in Minimum Essential Medium (MEM) supplemented with 10% HI FBS 1% non-essential amino acid (NEAA). All cancer lines were cultured under 37 degrees Celsius and 5% CO2 in a humidified atmosphere in a HERAcell VIOS 160i CO2 incubator (2021 model with serial no. 42621149).
Preparation of PolyHb-Tyr
Reaction mixtures were prepared containing hemoglobin (10 g/dl) and tyrosinase (6000 U/ml) in 0.1 M of potassium phosphate buffer, pH 7.6. In the PolyHb mixtures, an equivalent volume of buffer replaced the enzyme. Prior to the start of cross-linking, 1.3 M of lysine was added at a molar ratio of 7:1 lysine/hemoglobin. The cross-linking reaction was started with the addition of glutaraldehyde (5%) at a molar ratio of 16:1 glutaraldehyde/hemoglobin [6]. Glutaraldehyde was added in four equal aliquots over a 15 min period. After 3.5–48 h at 4°C under aerobic conditions with constant stirring, the reaction was stopped with 2.0 M of lysine at a molar ratio of 200:1 lysine/hemoglobin. Solutions were dialyzed in physiological saline solution and passed through a sterile 0.45 μM filter. Aliquots (500 μl) of the 16:1 cross-linked preparation were concentrated using 100 kDa microconcentrators. Samples were centrifuged at 2500 g for 55 min at 23 °C, and the retentate was collected. The hemoglobin concentration was determined using cyanomethaemoglobin at 540 nm. We nanoencapsulated the PolyHb-Tyr (38.25 mg/ml, 4500 U Tyrosinase) in the aqueous phase, with 90 mg of poly-dl-lactic acid (PLA) considered as the organic phase, following the nanoprecipitation method described previously [8]. The final concentration used as 1X PolyHb-Tyr-nano solution in the viability studies was 6.4 mg/ml + 225 U of tyrosinase.
Preparation of Quercetin Nanocapsules
Based on the high solubility of quercetin in acetone (80mmol/L), 77.37 mg of quercetin (Abcam, 302,236 Da) and 90 mg of PLA was dissolved to form a saturated solution with 3.2 mL of acetone and 1.6 ml of ethanol. Since there was precipitation formed, a half-maximal of quercetin (38.5mg) was used. This quercetin–PLA organic phase was injected dropwise via a 26G needle, at the rate of 3 ml/min, into 10 ml of an aqueous phase under a stir speed of 600 rpm [7]. After complete injection of the organic phase into the aqueous phase, we stirred the sample at a speed of 6, under well-ventilated conditions, for 1 h to allow evaporation of the organic solvent and to allow PLA nanocapsules to form around the quercetin molecules. This is because hydrophobic substances will stay together due to electrostatic forces in water. After 1 h of stirring, we stabilized the quercetin nanocapsule solution with 150 μl of Tween 20. Then, we placed thin drops of the sample onto microscope slides to study the size and morphology of the PLA nanocapsules.
Measurement of Tyrosinase Activity
Tyrosinase activity was assessed through the enzymatic reaction of tyrosinase converting tyrosine to form the enzymatic product dopaquinone, which can be measured at 300 nm. The absorbance at 300 nm was followed continuously for 8–14 min using a Perkin Elmer Lambda 4B spectrophotometer, and the changes in optical density per minute were used to analyze the activity of the enzyme [7].
3D culture Studies
We detached and resuspended 90% confluency cells with trypsin express and 1 mL of DMEM/FBS. On a 24-well plate, 71 μl of the corresponding drug solution and 35 μl of cell suspension were added for the treatment used in the Q-nano group and the PolyHb-Tyr-nano group. The sample was incubated for 20 minutes to allow excess water to evaporate. For the treatment used in the combination therapy group, Q-nano + PolyHb-Tyr-nano and 35.5 μl each of Q-nano and PolyHb-Tyr-nano were added. On ice, we prepared the type I collagen mixture with rat tail collagen type I (355ul/well) [8], 10x PBS (50ul/well), and 1N NaOH(~8.5ul/well) and adjusted the pH so that it was neutral with pH testing strips. We added the neutral collagen mix to each well and slowly stirred the sample in a clockwise direction to finely mix the cells, drugs, media, and collagen. We incubated the sample for 30 minutes at 37 degrees Celsius in a cell incubator to allow the drug-embedding collagen to form a firm gel. In its final concentration, each well had 106.5 μl of drug–cell mixture, 355 μl of type I collagen, 50 μl of 10X PBS buffer, and 8.5 μl of 1N NaOH. After the successful formation of a firm 3D gel, the medium was gently added over the course of 1 hour. We washed the sample to al-low diffusion of the drugs. Then, we repeated the washing five times. We changed the medium once per day to stimulate the body’s fluid metabolism and allow cellular growth for ~ 7 days. After 7 days, the collagen gel matrix was digested with 1000 μl of collagenase type I per well at a concentration of 4 mg/mL. Subsequently, we incubated the sample for 30 min, with gentle mixings in between to allow fast digestion. Then, 100 μl of the cell suspension was transferred into an Eppendorf tube with 400 μl of trypan blue, and we measured the cell viability using a hemocytometer.
Tyrosine and Phenylalanine Concentration Measurement
To measure the tyrosine concentration in the intracellular environment, we diluted the sample with 1 mL of DMEM/FBS to inactivate the collagenase and centrifuged the cell suspensions at 16,000 x g for 20 min at 4 °C to lyse the cells and expose the sample’s intracellular tyrosine. Then, we collected the supernatant in fresh Eppendorf tubes and placed it on ice, discarded the pellet, and performed phenylalanine ammo-nia-lyase (PAL) enzyme analysis for Tyr and Phe; these are able to convert Tyr to trans-coumarate, which is detectable at 315 nm.
O-quinone Concentration Measurement
Four experimental groups were defined based on which of the following was used: empty nanocapsules (E-nano), free quercetin solution (Free Q), quercetin nanocapsules (Q-nano), or PolyHb-Tyr-nano combined with quercetin nanocapsules (PolyHb-Tyr-nano + Q-Nano). To measure the intracellular o-quinone concentrations, we collected 1 ml of the cell suspensions. We centrifuged the cell suspensions at 16,000 x g for 20 min at 4 °C to lyse the cells. We collected the supernatant in fresh Eppendorf tubes and placed these on ice. Then, we discarded the pellet. Soluble o-quinones can be homogenized with methanol (100 μl of supernatant + 1000 μl of methanol) and centrifuged at 2000 rpm for 5 min; the supernatant is used directly to measure the soluble o-quinones at the wavelength of 437 nm over time periods of 0 h, 24 h, and 48 h in 2D cell cultures. Four cancer lines (n=5) were tested: the Hepa 1-6 mice liver cancer line, A549 human lung cancer line, HeLa human cervical cancer line, and MCF7 human breast cancer line.
Colony Study
We seeded the cancer cell lines (Hepa 1-6, A549, HeLa, and MCF7) using a cell spreader in prepared nutrient agar plates and allowed a 24-hour growth period. Then, we added different treatments to the agar plates and cultured the cells following standard culture protocols at 5% CO2 and 37 °C in a HERAcell VIOS 160i CO2 incubator. We changed the medium every 2 days until visible colonies formed (after 1 week). On day 7, we gently aspirated the cell culture medium from the plates and washed the medium three times with 2 ml of PBS to remove residual medium. Then, we added 70% ethanol to cover the cells and incubated the sample for 15 minutes to fix the cells. We carefully removed the ethanol and added 0.5% crystal violet solution to cover each plate to stain the cells. The resulting sample was incubated for 30 minutes. After the agar was well stained, we removed the crystal violet and washed the sample three times with PBS. We set the plates to air-dry and then added 10% acetic acid to cover each plate and thus detain the excess crystal violet for clearer visualization. After 15 minutes of incubation and the removal of the acetic acid, we placed the plates under a light microscope for colony counting and measured the absorbance of crystal violet dye in 10% acetic acid at 590 nm using a UV spectrometer.
Multi-Dose Viability Study
Healthy human hepatocytes were purchased from Thermo Fisher Scientific and maintained following manufacturer-provided protocols: the Willams E medium was supplemented with dexamethasone and with supplement cocktails including various proteins to mimic their physiological environments. The four cancer lines were maintained as described earlier. The studies were performed in the same manner as the previously described 3D cell culture protocol but with various drug group concentrations: Q-nano, PolyHb-Tyr-nano, combined nano, E-nano, and PolyHb at 1/4x, 1/2x, 1x, 2x, and 3x concentrations were added to the 3D cell culture collagen mix for 48 hours. The drugs were then removed from the culture plates, and a fresh medium was put in place. After incubation and allowing for cell growth over 7 days, the collagen was digested with 4 mg/mL collagenase, and the cell viability was measured using a hemocytometer.
Fluorescence Nanocapsule Entry Study
Preparation of coumarin6-incorporated nanocapsules was carried out by dissolving coumarin6 in the organic phase solution, together with the dissolved poly-lactic acid, at a dye/PLA ratio of 1:150, followed by the nanoprecipitation method described earlier to form PolyHb-Tyr-nanocapsules. The fluorescent nanocapsules were added to the cell cultures, followed by consecutive washings. After incubation, Hoechst dye was added to stain the cell nucleus, (Wang and Chang 2021) and cell plasma membrane dye was added to mark cell borders. The cells were then subjected to Axio Vert A1 fluorescence microscopy for analysis. The following reflectors were used: 49DAPI for H3258 dye, 10Alexa Fluor 489 for Coum6 dye, and 50 Cy 5 for AF647 dye. The light source intensity was 2%, and the exposure time was set to the standard 150 ms.
Statistical Analysis
Statistical analysis was performed using one-way ANOVA followed by Tukey’s HSD tests. Results were considered significant at a p-value of <0.05. Significant level in comparison to the control group: p-values are indicated by *<0.05, **<0.01,***<0.005.
3. Results
Quercetin-Nano, PolyHb-Tyr-Nano, and Combination of Both: Effect on 4 Cancer Cell Lines
Cell Viability Study
Hepa 1-6 mice liver cancer line: Compared to the control group (Empty-nano), in all three drug treatment groups (Q-nano, PolyHb-Tyr-nano, and the combined group), significant reductions were demonstrated in average cell viability of Hepa 1-6 cells seeded in 3D matrix culture. In all four cancer lines, the PolyHb-Tyr-nano had the lowest viability compared to the Quercetin nanocapsules (Q-nano) group: 25% viability in liver CA and lung CA [Figure 2a, b], 29% in cervical CA, and 22% in breast CA [Figure 2c, d]. The viability of liver CA and breast CA in the PolyHb-Tyr-nano group was also significantly lower than that in the combined group [Figure 2a, d].
Average Live Cell Count
The average live cell counts of the multi-cancer lines demonstrated results that were similar to the cell viability results. Compared to the control group (Empty-nano), significantly reduced live cell counts were exhibited in all three treatment groups [Figure 3a-d]. In Hepa 1-6 cells, results from the combined treatment group and PolyHb-Tyr-nano group had the least live cells [Figure 3a]. In the A549 and HeLa cell lines, the results for all three treatment groups demonstrated significantly reduced cell counts [Figure 3b-c]. In the MCF7 line, the results in the PolyHb-Tyr-nano group demonstrated the lowest live cell counts [Figure 3d].
Colony Study
To use another method to confirm the cell viability results, a colony study was performed on nutrient agar plates for 7 days, using crystal violet stains. Surviving cells can form visible colonies on agar plates; the number and size of the colonies can indicate the efficacy of PolyHb-Tyr-nano in tumor inhibition. We compared the results from the PolyHb-Tyr-nano group with those from the empty nanocapsules group across all cancer lines: Hepa 1-6, A549, HeLa, and MCF7. On day 7, there were fewer colonies in the PolyHb-Tyr-nano group across all tested cancer lines; however, there were no colony size differences [Figure 4a, b]. The results were confirmed via absorbance measurement using acetic acid destaining. In all tested cancer lines, the results from the PolyHb-Tyr-nano group demonstrated lower crystal violet absorbances than those from the Empty-nano control group, suggesting that PolyHb-Tyr-nano’s higher antitumor effect led to fewer colonies [Figure 4c].
Quercetin-Nano and PolyHb-Tyr-Nano Exert Antitumor Activities by Activating Prodrug to o-Quinone and Reducing Intracellular Tyrosine
Intracellular Tyrosine Measurement Study
To confirm the mechanism of action of the PolyHb-Tyr-nano in the multiple cancer lines, intracellular tyrosine levels were measured via PAL assay. The tyrosine levels were tracked at 0 h, 24 h, and 48 h and compared with the control group. In all cases, treatment with PolyHb-Tyr-nano resulted in significantly lower intracellular tyrosine levels at 24 hours. At 48 h, PolyHb-Tyr-nano continued to reduce intracellular tyrosine levels compared to the Tyr group. This shows a long-lasting enzymatic effect in the PolyHb-Tyr-nano, and nanoencapsulation protects tyrosinase from enzymatic degradation [Figure 5a-d].
O-Quinone Measurement Study
O-quinone, the active form of the prodrug quercetin, is detected via UV spectrometry. The combination of quercetin nanocapsules with PolyHb-Tyrosinase-nanocapsules could theoretically form a combination therapy. Tyrosinase can activate the prodrug quercetin to its active form, O-quinone, which triggers downstream reactive oxygen species-mediated apoptotic pathways. In all cancer lines, a result matching the cell viability trend was observed, further proving the effect of this combination therapy [Figure 6a-d]. Starting at 24 h, increased absorbance, indicating intracellular o-quinone levels, was observed in the combination group. This effect became increasingly dramatic at 48 h and significantly higher than that in other treatment groups (p-values < 0.0005).
PolyHb-Tyr-Nano Suppresses Liver Cancer Cells Without Cytotoxicity in Normal Liver Cells
We carried out tests to assess the proposed drug’s safety and to test whether the effective antitumor drug dosage was cytotoxic to normal cells compared to cancer cells. The liver is one of the most sensitive major metabolic organs; therefore, human hepatocytes were purchased. Various drug concentrations were tested for their effects on hepatocyte and Hepa 1-6 liver cancer line cell viability. The study was performed in 3D culture for 7 days.
In the liver cancer line, a dose-dependent antitumor effect was observed in all drug treatments. Cell viability decreases as the drug concentration increases; however, even at 1/4x concentration, the proposed treatment was able to significantly reduce Hepa 1-6 liver cancer cell viability compared to the control groups or normal hepatocytes, (p < 0.05), suggesting a high drug efficacy against tumors. Among the treatments, results from the PolyHb-Tyr-nano group and the combined nano group demonstrated 100% cell viability at 3X concentrations; by comparison, results from the 3X quercetin nano group demonstrated cell viability of 11%, suggesting that the tumor dependency on tyrosine is more lethal. The E-nano and PolyHb groups served as control groups, and no effect on cell viability was found in these groups; significantly high cell viabilities of above 80% remained even at 3X concentrations [Figure 7a].
The effects of dose escalation on normal hepatocytes’ viabilities are shown in Figure 7b. With drug treatments at 1X concentration, the drugs are relatively safe for normal hepatocytes. Even at 3X concentration, the results from the PolyHb-Tyr-nano group did not show significant cytotoxicity against normal hepatocytes. However, the results from those groups using therapy containing quercetin demonstrated significantly decreased cell viability at 3X dosage. Thus, the effects of PolyHb-Tyr-nano are much stronger in tumor cells, and these effects specifically target the tumor and not normal cells [Figure 7b].
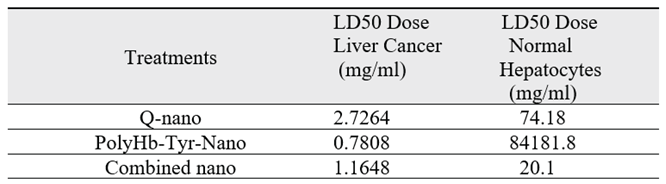
LD50: The results for both the Hepa 1-6 liver cancer line and normal hepatocytes were further quantified by computing their 50% lethal dosage values (LD50) [Table 1]. In the liver cancer line, the PolyHb-Tyr-nano has the lowest LD50, of 0.122 times 1X dosage (0.7808 mg/ml), compared to the Q-nano (2.7264mg/ml) and the combination group (1.1648 mg/ml). This means that a lower dosage is required for PoyHb-Tyr-Nano to reduce 50% of the tumor cell viability. In normal hepatocytes, a higher LD50 for PolyHb-Tyr-Nano was observed, matching the trend in the multi-dose viability in the hepatocytes graph [Figure 7b] and indicating that PolyHb-Tyr-nano is not toxic and can be safely used for normal hepatocytes. Compared to the PolyHb-Tyr-nano, the Q-nano had a lower LD50 in normal hepatocytes, indicating its potential toxicity.
Confirmation of Effective Nanocapsule Cell Entry
To show that the nanocapsules can enter the cells rather than accumulate in the tumor microenvironment and risk clearance from the body, inverted microscopy was first used. It showed that the circular nanocapsules surround and co-localize with the cells, but this cannot confirm their entry into cells [Figure 8a]. The entry of nanocapsules into cells was thus confirmed using fluorescence confocal microscopy. Fluorescent dyes were applied as follows: Hoechst 33342 (blue) was applied for the cell nucleus and Coumarin 6 (green) for nanocapsules. The confocal images showed that nearby green fluorescent nanocapsules co-localize with the blue fluorescent nucleus, not randomly in the cell–cell junctions, indicating that nanocapsules are effectively taken in by the cells [Figure 8b]. When adding an additional plasma membrane dye (Red) to mark the cell borders, it becomes clear that the cell nucleus and nanocapsules are all within the cell membrane, and the green and blue fluorescence are not overlapping with each other, indicating that the intake of nanocapsules is settled inside the cell cytoplasm [Figure 8c].
4. Discussion
Our results show that quercetin-loaded nanocapsules has significant anti-tumor effects, and further enhanced when activated with PolyHb-Tyr-nano, across all the tested cancer lines: Hepa 1-6 liver cancer line, A549 lung cancer line, HeLa cervical cancer line, and MCF7 breast cancer line. However, surprisingly, the nanobiotherapeutic PolyHb-Tyrosinase group alone showed significant anti-tumor effect. To investigate this further, we compared the results and mechanisms of action among the PolyHb-Tyr-nano, quercetin nanocapsules, and the combination therapy. All treatment groups demonstrated reduced cell viability, lower live cell counts, and diminished colony-forming ability [Figure 2, 3, 4]. Among them, the PolyHb-Tyr-nano group consistently showed the strongest inhibitory effect across all four cancer lines. The antitumor mechanism of PolyHb-Tyr-nano in these cancers operates via tyrosine depletion. Significantly reduced intracellular tyrosine levels (down to only 20%-30% of the original cellular tyrosine level) were observed in the PolyHb-Tyr-nano group]. Significant anti-tumor effects were also found in the combined therapy group [Figure 2], the mechanism operates by tyrosinase-mediated oxidation of the prodrug quercetin into its active metabolite o-quinone, resulting in increased intracellular concentrations than the quercetin nanocapsules group or free quercetin alone. This indicates the success establishment of the combination therapy with PolyHb-Tyr-nano [Figure 6]. Free quercetin was not focused in the current study due to its rapid metabolic clearance, as previously demonstrated in our submitted melanoma manuscript. In that study, nanoencapsulation significantly improved quercetin’s bioavaliability and therapeutic efficacy in murine B16F10 and human SK-MEL-28 melanoma lines. [19]
The potential of o-quinone to trigger oxidative stress and various apoptotic pathways has been extensively studied by researchers. [16,17,18] In order to study the drug–dosage relationship and the drug effects on normal cells, we carried out a multi-dosage cell viability study on the Hepa 1-6 liver cancer line and human hepatocytes. For the normal liver line, reduced cell viabilities, indicating cytotoxicity, were found in the Q-nano group and combination group. Whereas the PolyHb-Tyr-nano group retained more than 80% cell viabilities, even at higher concentrations, similar to the control groups, indicating the PolyHb-Tyr-nano’s safety for normal hepatocytes and tumor specificity [Figure 7b]. As can be observed in Table 1, where we compared the LD50 values for cancer liver cells and normal liver cells, for the Hepa 1-6 liver cancer line, the PolyHb-Tyr-nano has the lowest LD50, of 0.122 times the 1X dosage (0.7808 mg/ml), compared to the Q-nano (2.7264 mg/ml) and the combination group (1.1648 mg/ml). Thus, a lower dosage is needed for PolyHb-Tyr-Nano to reduce 50% of the viability of the tumor cells. In normal hepatocytes, the LD50 for the quercetin-related groups are 20.1 mg/ml and 74.18 mg/ml, suggests the hepatocyte toxicity of the quercetin and combined group. The findings from the PolyHb-Tyr-nano group, where the highest LD50 values were observed (of 84181 mg/ml, which is 13153 times the 1X dose used in the study), demonstrates the drug’s lack of toxicity and adverse effects in normal hepatocytes. PolyHb-Tyr-nano is safe to use because it does not release any toxic drugs into the body. Instead, it acts by depleting tyrosine. Normal hepatocytes do not have the same tyrosine requirement as the rapidly growing liver cancer cells. After use, the nanocapsule membrane is biodegradable. The polylactic acid outer layer hydrolyses into carbon dioxide and water [20,21], while polyhemoglobin and tyrosinase biodegrades into essential components and are naturally eliminated from cells. We have reported superparamagnetic nanocapsules that allow external magnetic field to retain them at the site of injection. This gives them more time to enter the cancer cells to target intracellularly. [22]
5. Conclusions
The results showed that the combined use of Quercetin-nano and PolyHb-Tyr-nano can reduce the cell viabilities in multiple cancer lines. Intracellularly located PolyHb-Tyr-nano also has a tumor inhibitory effect on Hepa 1-6 liver cancer, A549 lung cancer, HeLa cervical cancer, and MCF7 breast cancer via intracellular tyrosine depletion. Additionally, PolyHb-Tyr-nano has a higher LD50 in normal hepatocytes compared to quercetin-related approach. These promising results encourage more experiments, including experiments using in vivo animal models and organs on chips. While more research is needed to fully understand the potential of PolyHb-Tyr nanocapsules by themselves or in combination with quercetin nanocapsules.
Author Contributions
CZ: Data curation, Formal Analysis, Investigation, Methodology, Project administration, Software, Validation, Writing– original draft, Writing– review and editing. TMSC: Conceptualization, Data curation, Formal Analysis, Funding acquisition, Investigation, Methodology, Project administration, Resources, Supervision, Validation, Visualization, Writing– original draft, Writing– review and editing.
Funding
Professor Chang’s laboratory is supported by the Virage Centre of Excellence in High Technology award from the Quebec Ministry of Science and Education and by an unrestricted donation to McGill University from Pro-Heme Biotechnology.
Data Availability Statement
The data supporting the conclusions of this article will be made available upon request.
Conflicts of Interest
No conflict of interest.
References
- Chang, T.M. (1964) ‘Semipermeable microcapsules’, Science, 146(3643), pp. 524–525. [CrossRef]
- T.M.S, Chang. (2019). ARTIFICIAL CELL evolves into nanomedicine, biotherapeutics, blood substitutes, drug delivery, enzyme/gene therapy, cancer therapy, cell/stem cell therapy, nanoparticles, liposomes, bioencapsulation, replicating synthetic cells, cell encapsulation/scaffold, biosorbent/immunosorbent haemoperfusion/plasmapheresis, regenerative medicine, encapsulated microbe, nanobiotechnology, nanotechnology. Artificial Cells, Nanomedicine, and Biotechnology, 47(1), pp.997–1013. [CrossRef]
- T.M, CHANG. (1971) ‘The in vivo effects of semipermeable microcapsules containing L-asparaginase on 6c3hed lymphosarcoma’, Nature, 229(5280), pp. 117–118. [CrossRef]
- G. G, Meadows. H. F, Pierson. R. M, Abdallah. & P. R, Desai. (1982). Dietary influence of tyrosine and phenylalanine on the response of B16 melanoma to carbidopa-levodopa methyl ester chemotherapy. Cancer research, 42(8), 3056–3063.
- G.G, Meadows. And Y.-M, Fu. (2005) ‘Dietary restriction of specific amino acids modulates tumor and host interactions’, Cancer Growth and Progression, pp. 271–283. [CrossRef]
- B, Yu. and T.M, Chang. (2004) ‘In vitro and in vivo effects of polyhaemoglobin–tyrosinase on Murine B16F10 melanoma’, Melanoma Research, 14(3), pp. 197–202. [CrossRef]
- Y, Wang. and T.M,Chang. (2012) ‘Nanobiotechnological nanocapsules containing polyhemoglobin-tyrosinase: Effects on murine B16F10 melanoma cell proliferation and attachment’, Journal of Skin Cancer, 2012, pp. 1–9. [CrossRef]
- Y, Wang & TMS, Chang. (2021) A polymer–lipid membrane artificial cell nanocarrier containing enzyme–oxygen biotherapeutic inhibits the growth of B16F10 melanoma in 3D culture and in a mouse model, Artificial Cells, Nanomedicine, and Biotechnology, pp. 49-1, 461-470. [CrossRef]
- M, Butler. L.T, van der Meer. and F.N, van Leeuwen. (2021) ‘Amino acid depletion therapies: Starving cancer cells to death’, Trends in Endocrinology & Metabolism, 32(6), pp. 367–381. [CrossRef]
- C. S, Wilder. Z, Chen. and J, DiGiovanni. (2022). Pharmacologic approaches to amino acid depletion for cancer therapy. Molecular carcinogenesis, 61(2), pp. 127–152. [CrossRef]
- M.K, Fung. and G.C.-F Chan. (2017) ‘Drug-induced amino acid deprivation as strategy for cancer therapy’, Journal of Hematology & Oncology, 10(1). [CrossRef]
- Y, Xiang. ZE, Stine. JS, Xia. YQ, Lu. RS, O’Connor. BJ, Altman. AL, Hsieh. AM, Gouw. AG, Thomas. P, Gao. LC, Sun. LB, Song. B, Yan. BS, Slusher. JL, Zhuo. LL, Ooi. CGL, Lee. A, Mancuso. AS, McCallion. A, Le. MC, Milone. S, Rayport. D W, Felsher. CV, Dang. (2015) ‘Targeted inhibition of tumor-specific glutaminase diminishes cell-autonomous tumorigenesis’, Journal of Clinical Investigation, 125(6), pp. 2293–2306. [CrossRef]
- B, Delage. DA, Fennell. L, Nicholson. I, McNeish. NR, Lemoine. T, Crook. PW, Szlosarek. (2010) ‘Arginine deprivation and argininosuccinate synthetase expression in the treatment of cancer’, International Journal of Cancer, 126(12), pp. 2762–2772. [CrossRef]
- Iu Abakumova, O V Podobed, P A Karalkin, L I Kondakova, N N Sokolov. (2013) ‘Antitumor activity of L-asparaginase from erwinia carotovora from against different leukemic and solid tumours cell lines’, Biomeditsinskaya Khimiya, 59(5), pp. 498–513. [CrossRef]
- P Asgharian. AP Tazekand. K Hosseini. H Forouhandeh. T Ghasemnejad. M Ranjbar. M Hasan. M Kumar. SM Beirami. V Tarhriz. SR Soofiyani. L Kozhamzharova. J Sharifi-Rad. D Calina. W,C Cho. (2022) ‘Potential mechanisms of quercetin in cancer prevention: Focus on Cellular and molecular targets’, Cancer Cell International, 22(1). [CrossRef]
- J, L, Bolton. and T, Dunlap. (2016) ‘Formation and biological targets of quinones: Cytotoxic versus cytoprotective effects’, Chemical Research in Toxicology, 30(1), pp. 13–37. [CrossRef]
- J, L, Bolton. T.L Dunlap. and B.M. Dietz (2018) ‘Formation and biological targets of botanical o-quinones’, Food and Chemical Toxicology, 120, pp. 700–707. [CrossRef]
- D, Yu. J, A, Berlin. T. M. Penning, & J. Field. (2002). Reactive oxygen species generated by PAH o-quinones cause change-in-function mutations in p53. Chemical research in toxicology, 15(6), pp. 832–842. [CrossRef]
- Zhao, C. and Chang, T.M. (2025) ‘Biodegradable polylactide nanocapsules containing quercetin for in vitro suppression of mouse B16F10 and human SK-mel-28 melanoma cell lines’, Pharmaceuticals, 18(7), p. 980. [CrossRef]
- T Angelin Swetha, V Ananthi, A Bora, N Sengottuvelan, K Ponnuchamy, G Muthusamy, A Arun. (2023) ‘A review on biodegradable polylactic acid (PLA) production from fermentative food waste - its applications and degradation’, International Journal of Biological Macromolecules, 234, p. 123703. [CrossRef]
- Y, Luo. Z, Lin. and G, Guo. (2019) ‘Biodegradation assessment of poly (lactic acid) filled with functionalized titania nanoparticles (PLA/tio2) under compost conditions’, Nanoscale Research Letters, 14(1). [CrossRef]
- Zhao, C. and Chang, T.M. (2025) ‘Superparamagnetic polyhemoglobin-tyrosinase nanocapsules: A novel biotherapeutic with enhanced tumor suppression with control by external magnetic field’, Frontiers in Bioengineering and Biotechnology, 13. [CrossRef]
Figure 1.
Concludes the history of artificial cells nanocapsules, its variations in configurations, applications, and uses. From (Chang, 2019) with copyright permission from Francis & Taylor Publisher.
Figure 1.
Concludes the history of artificial cells nanocapsules, its variations in configurations, applications, and uses. From (Chang, 2019) with copyright permission from Francis & Taylor Publisher.
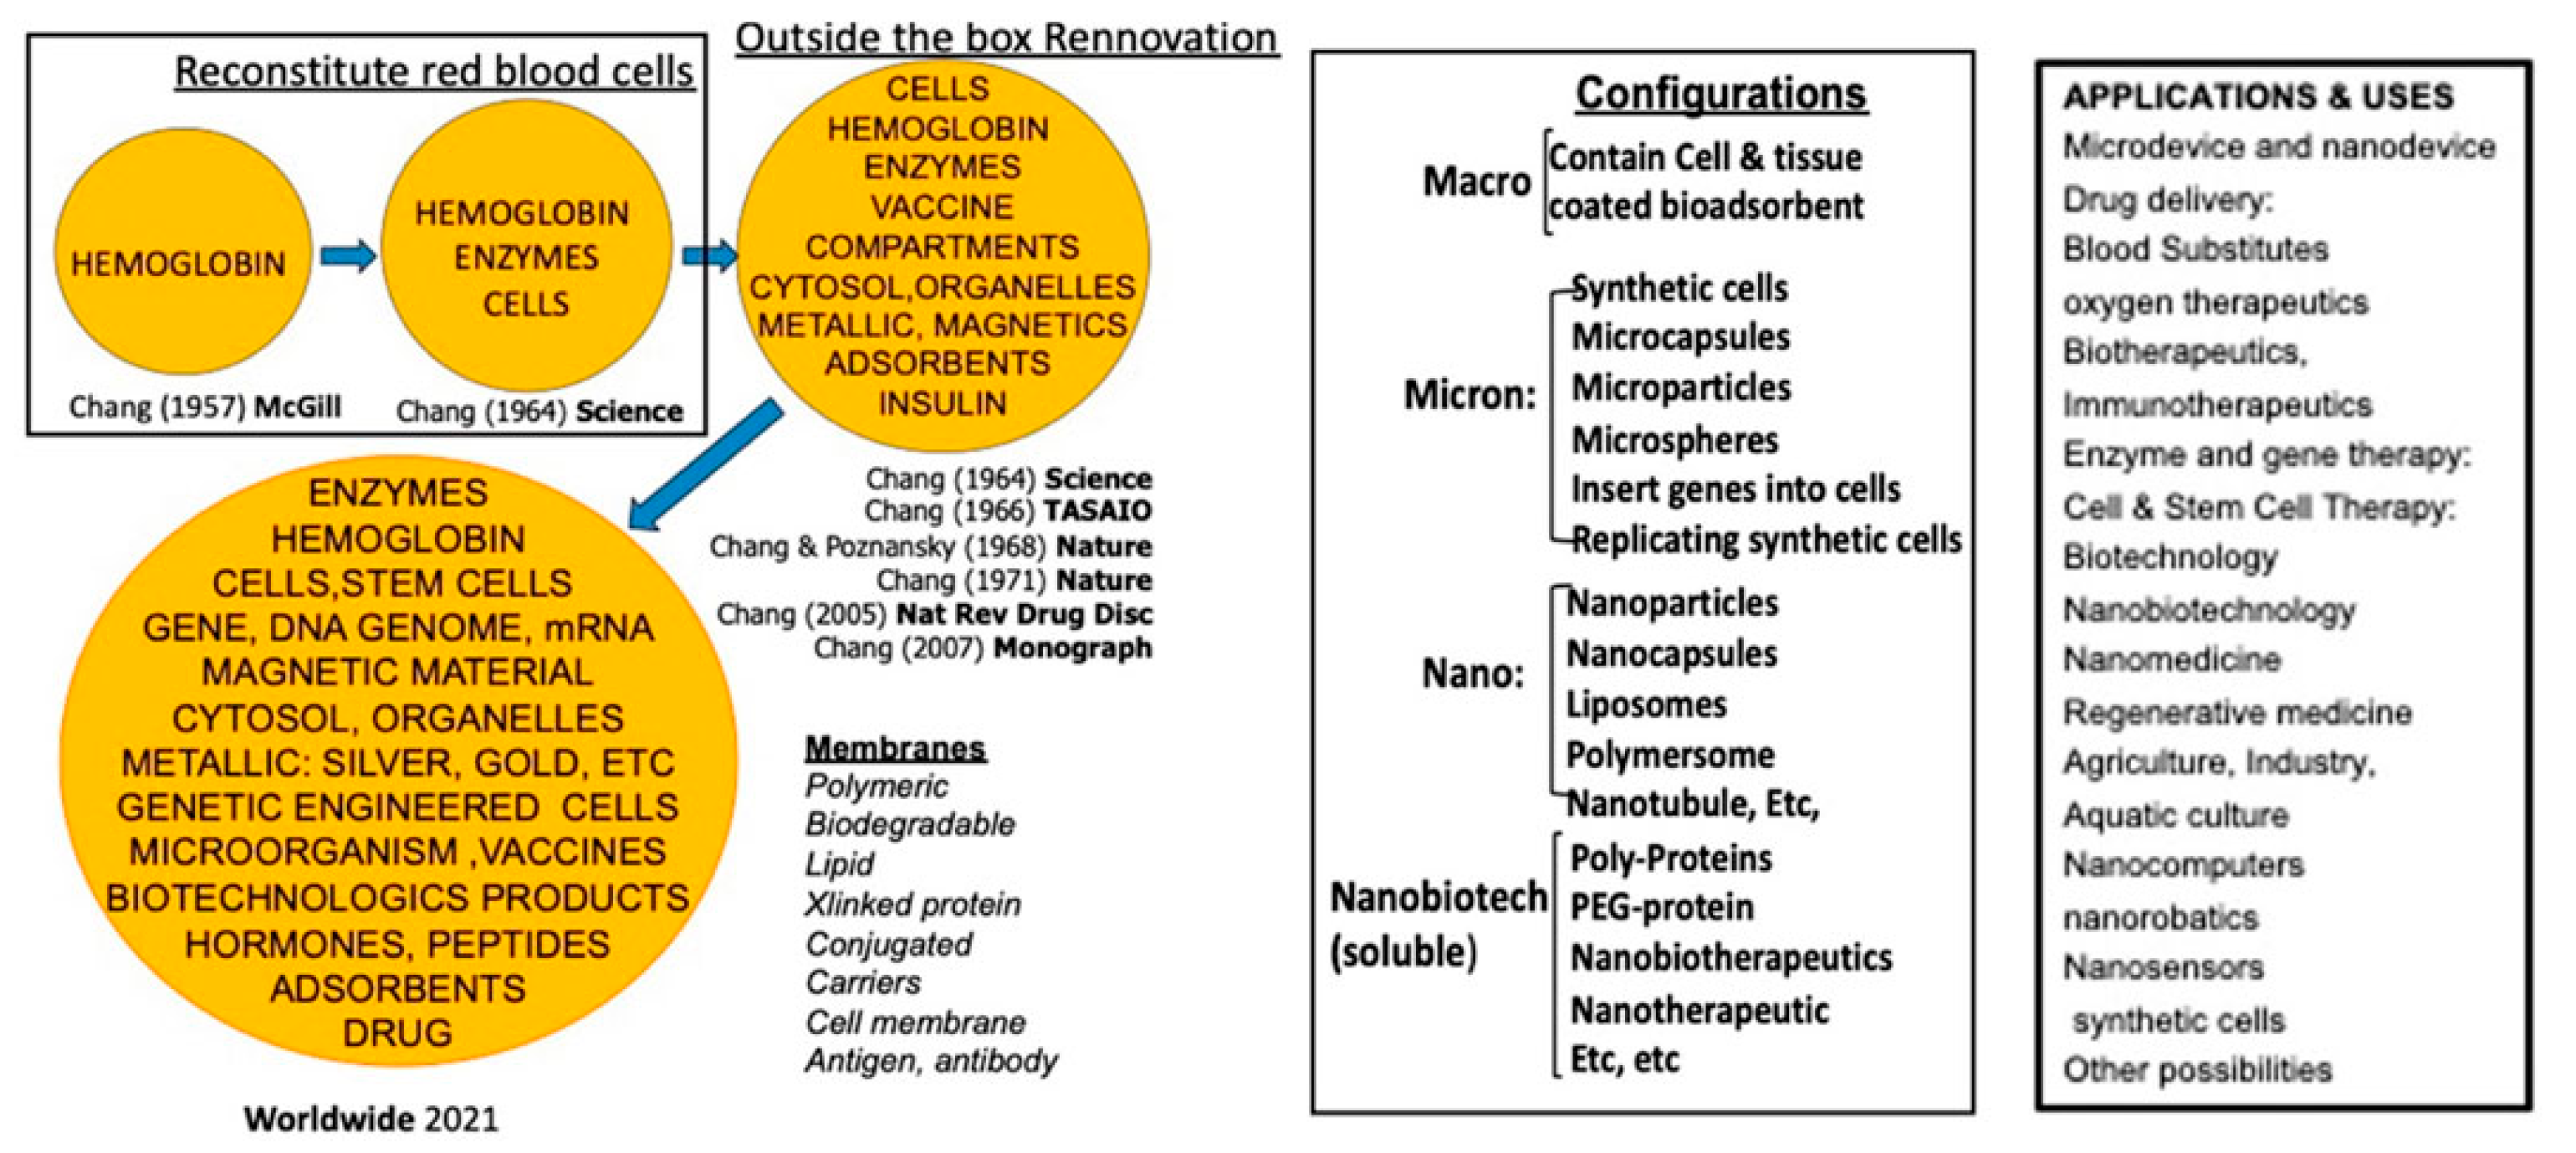
Figure 2.
Cell viability of multiple cancer lines (Hepa1-6, A549, HeLa, MCF7) over 1 week with each treatment. (a–d): Cell viability of Hepa 1-6, A549, HeLa, and MCF7 in 3D culture for 1 week. Compared to the control group (Empty-nano), significant cell viability reductions were observed for Q-nano, PolyHb-Tyr-nano, and Combined group (Q-nano+PolyHb-Tyr-nano). In Hepa 1-6 and MCF7, PolyHb-Tyr-nano has the lowest viability. In A549 and HeLa, the PolyHb-Tyr-nano and the combined group both have the lowest viability (significant level in comparison to the control group; p-values are indicated by *<0.05, **<0.01,***<0.005).
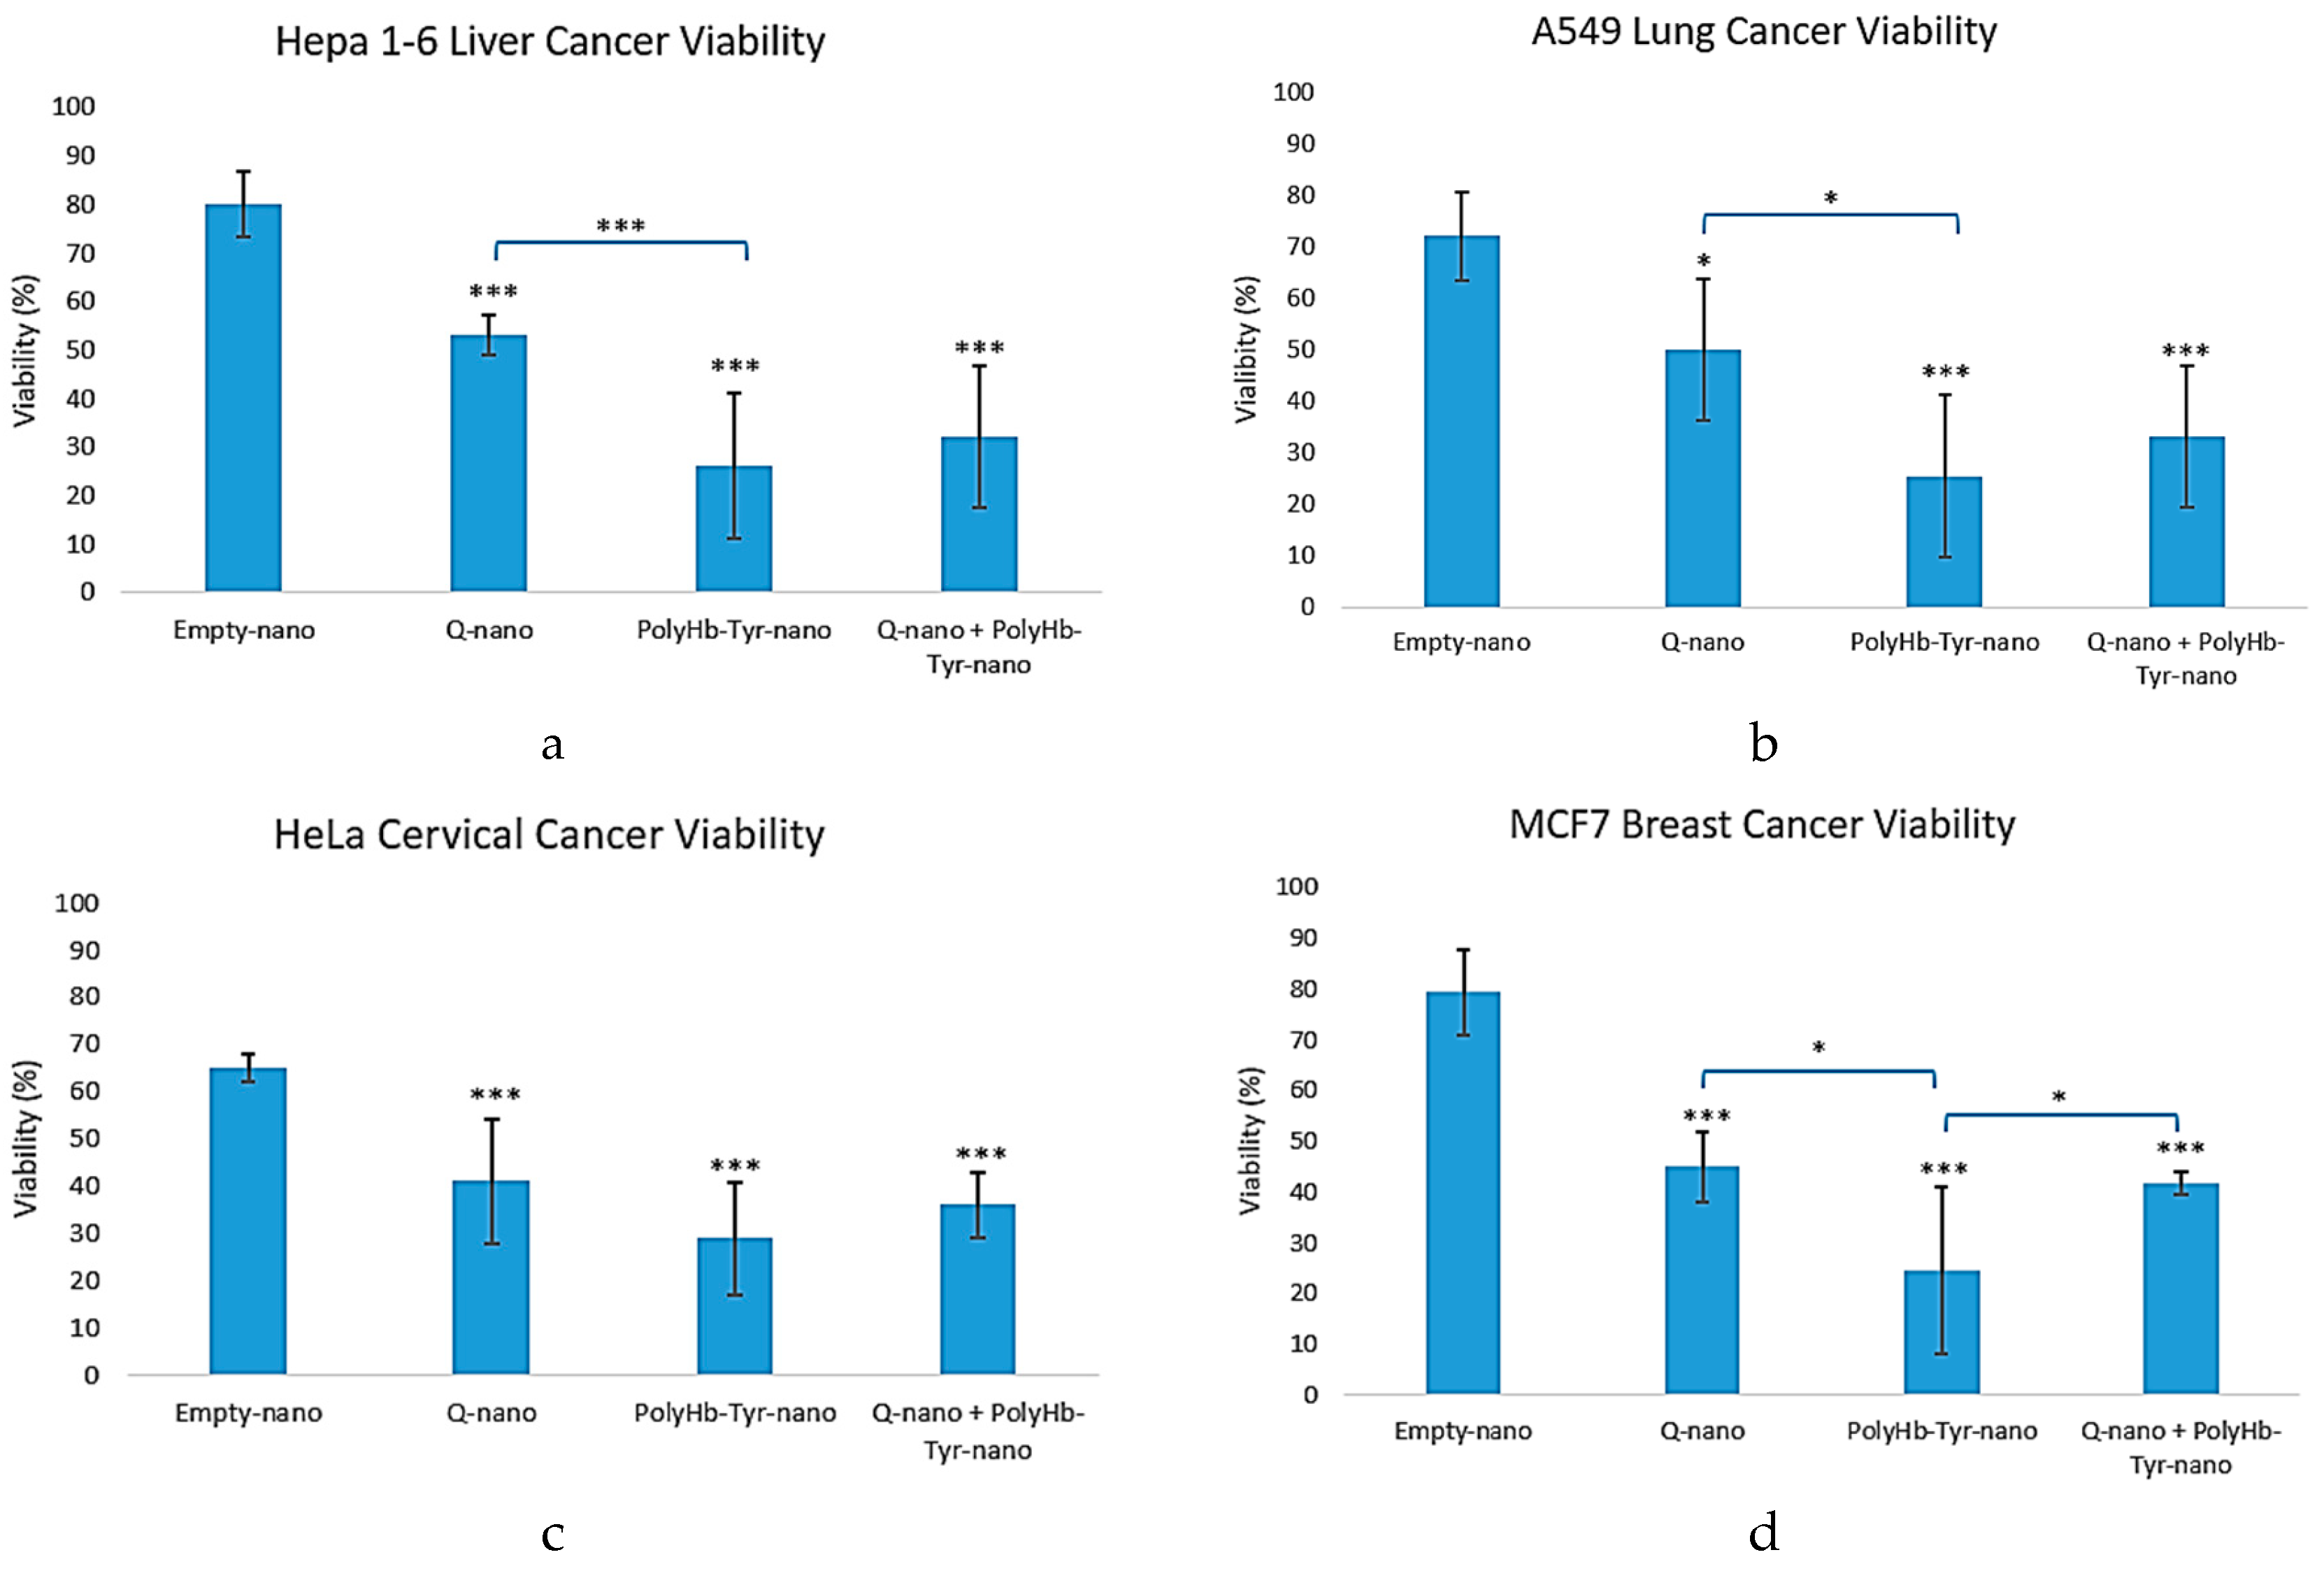
Figure 3.
Cell counts of multiple cancer lines (Hepa1-6, A549, HeLa, MCF7) over 1 week with each treatment. (a–d): Cell counts of Hepa 1-6, A549, HeLa, and MCF7 in 3D culture for 1 week. Compared to the control group (Empty-nano), significant cell count reductions were observed for Q-nano, PolyHb-Tyr-nano, and the Combined group (Q-nano+PolyHb-Tyr-nano). In the Hepa 1-6, A549, and HeLa lines, the PolyHb-Tyr-nano group and combined group had the lowest cell counts. In MCF7, the PolyHb-Tyr-nano group had the lowest cell count compared to other treatment groups.
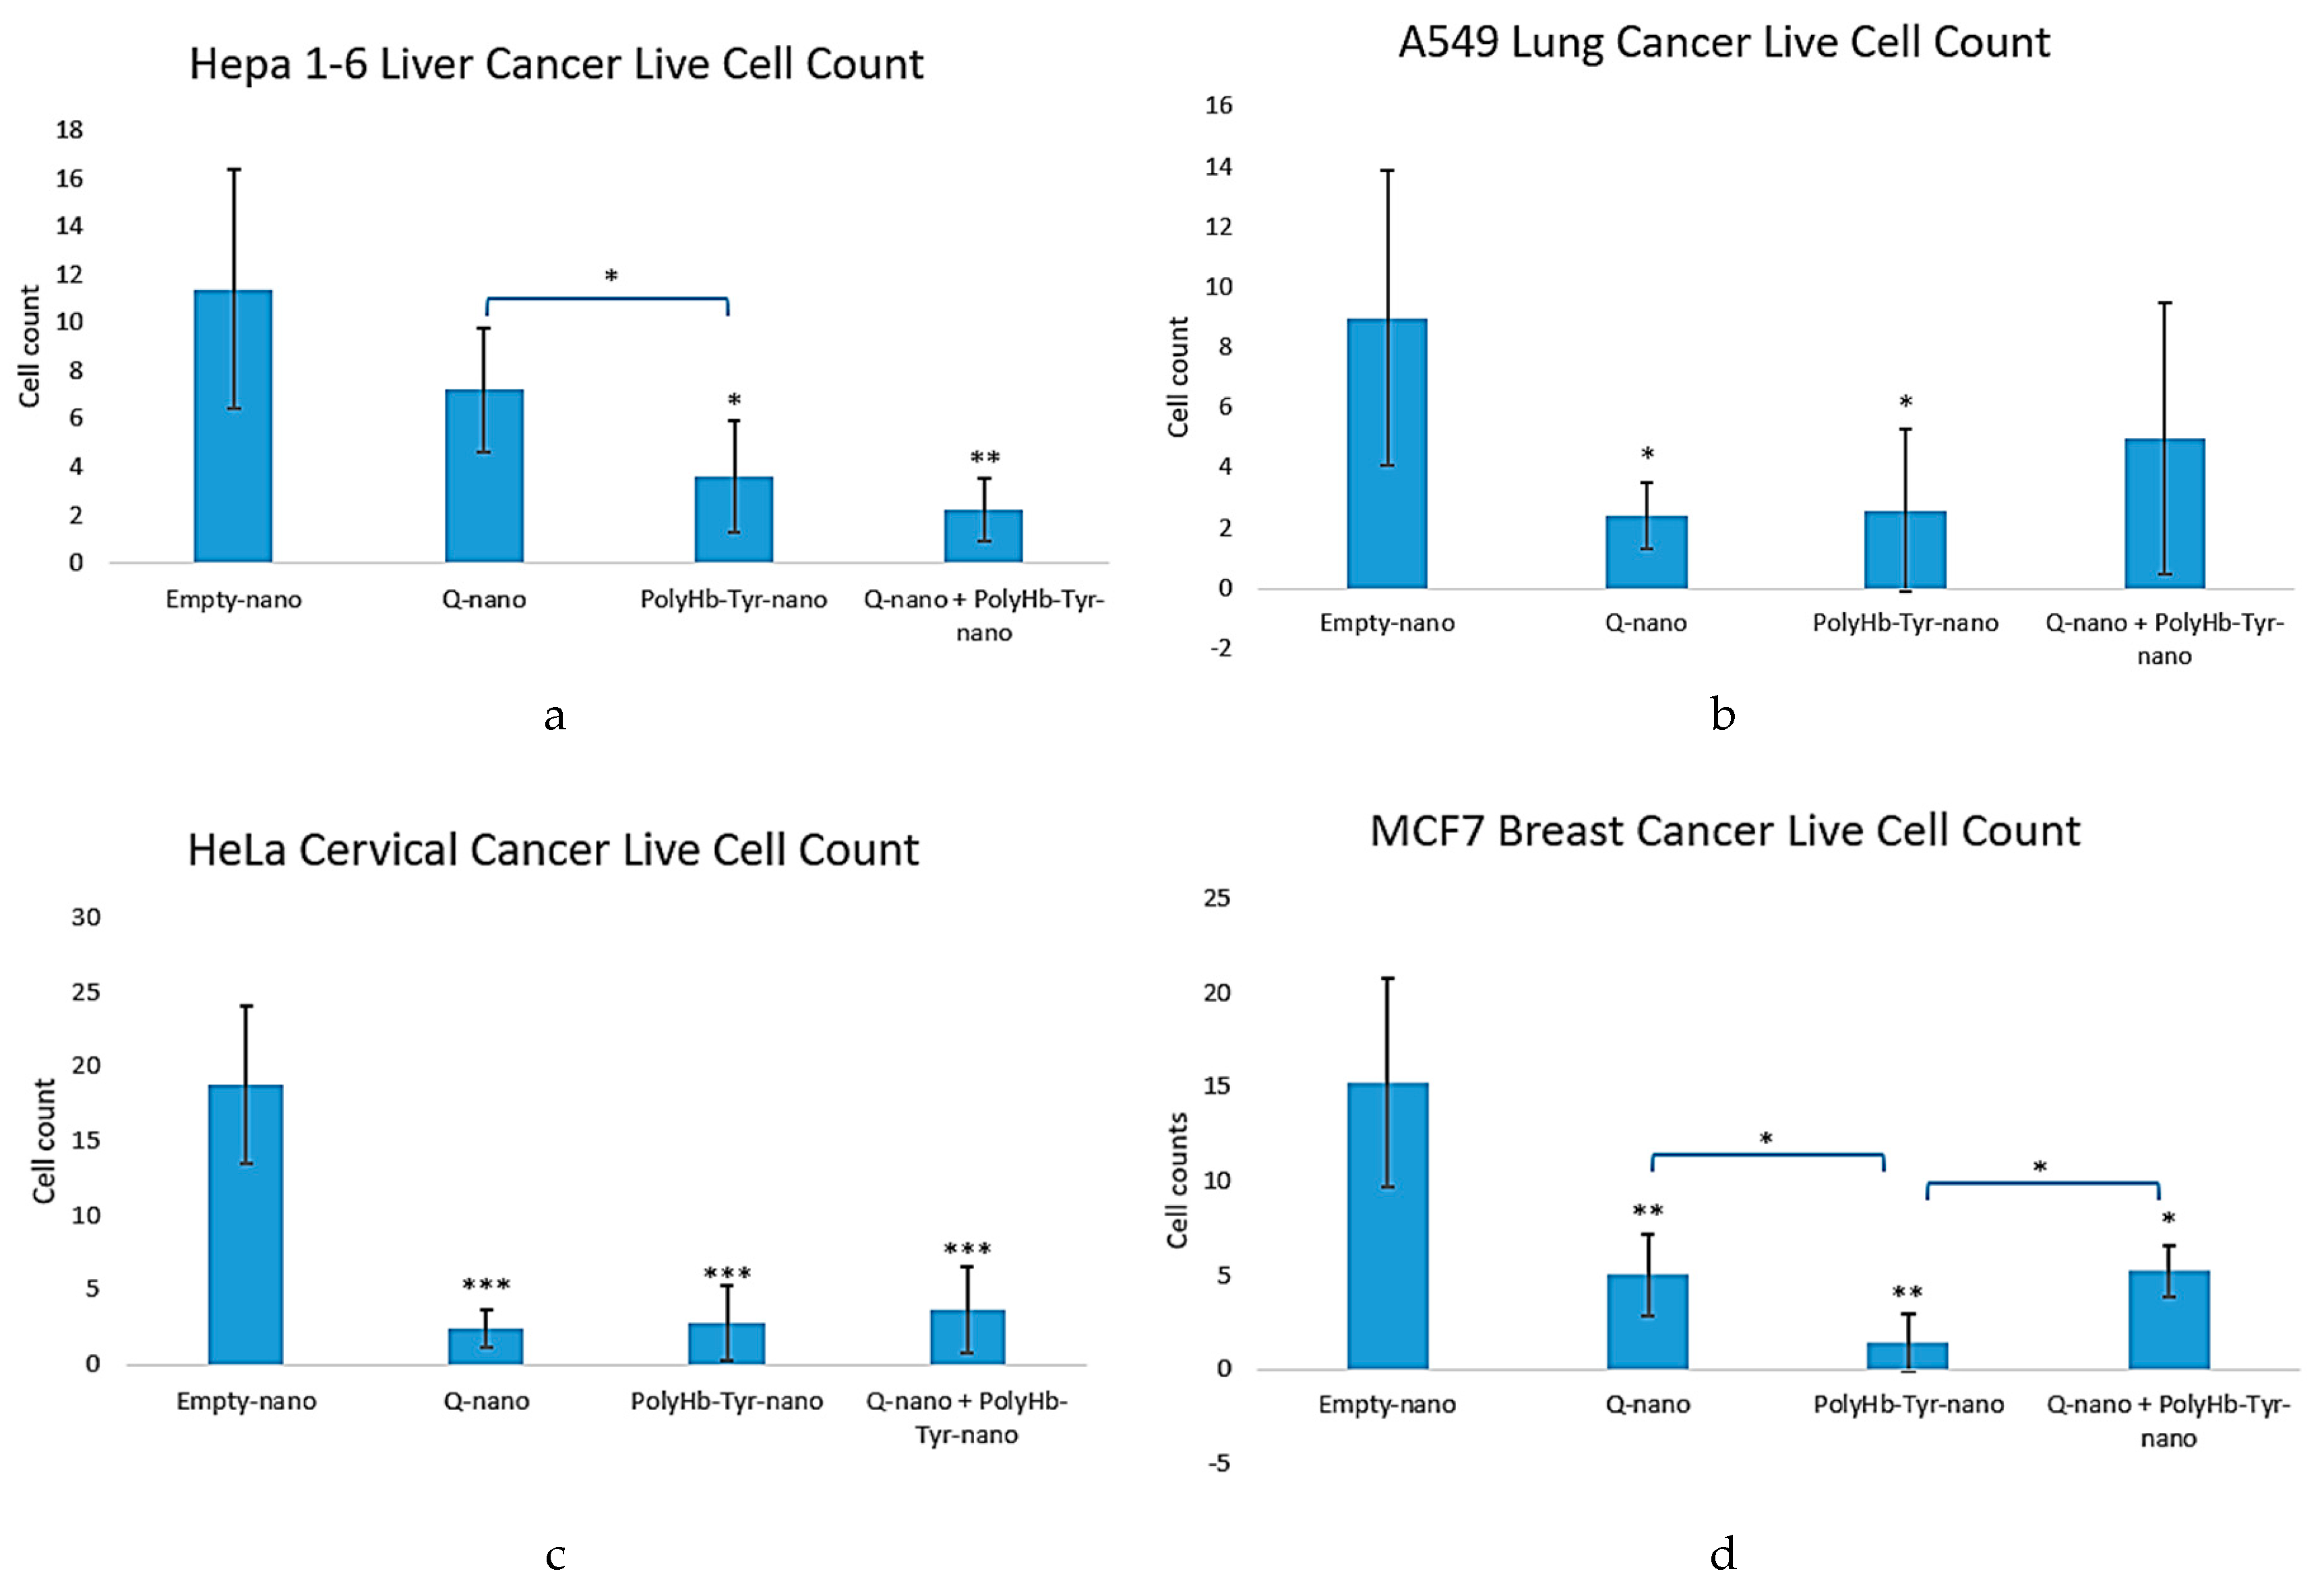
Figure 4.
Graphs of the colony, confirmed by crystal violet measurements. Figure 4a: Colony count for PolyHb-Tyr-nano vs. Empty-nano in all cancer lines. Figure 4b: Photos of the colony study. Pannel A represents PolyHb-Tyr-nano group showing fewer dots/colonies, pannel B represents E-nano group showing more dots/colonies. Figure 4c: After acetic acid treatment, more colonies remained in the E-nano group; thus, more crystal violet was released when compared to the more effective PolyHb-Tyr-nano group (p-values are indicated by *<0.05, **<0.01,***<0.005).
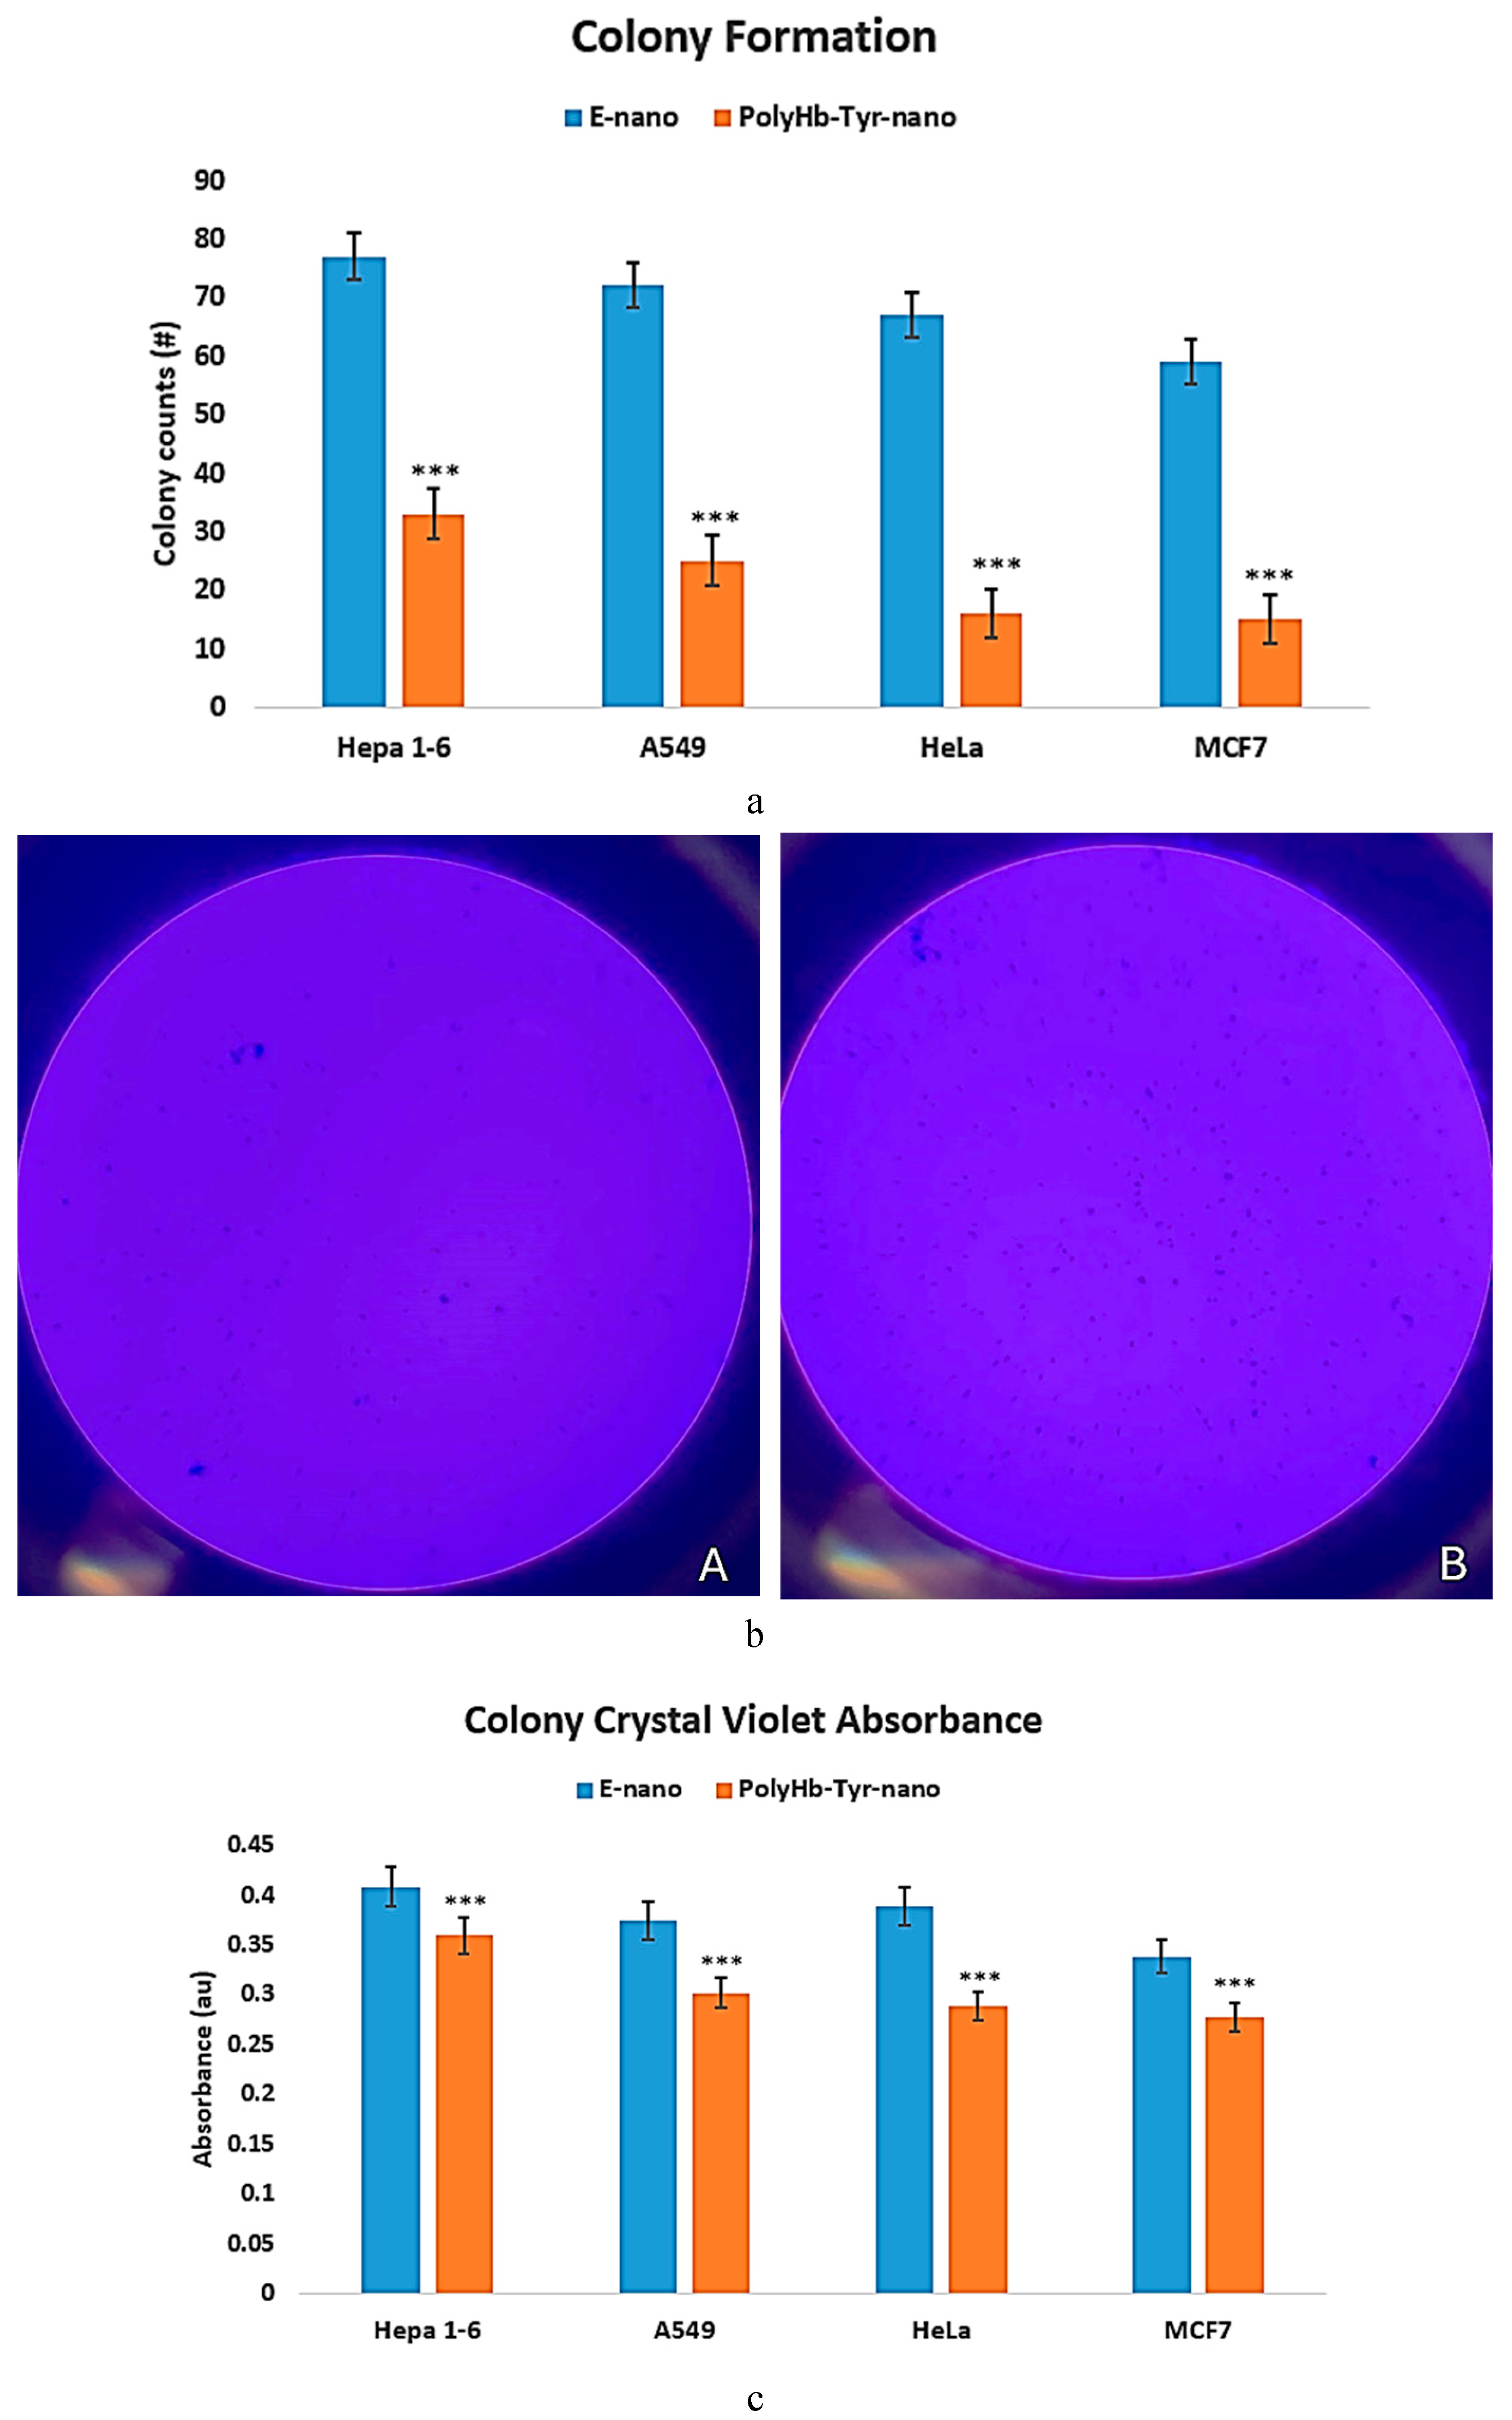
Figure 5.
Intracellular measurement of tyrosine levels in the multiple cancer lines following treatment of PolyHb-Tyrosinase-nano vs. free tyrosinase. Figure 5a-d: Intracellular tyrosine of Hepa 1-6, A549, HeLa, and MCF7 in 2D culture for 24 h and 48 h. Compared to the control group (Empty-nano), significant tyrosine level reductions were observed for PolyHb-Tyr-nano and Tyr. In the A549 line, the PolyHb-Tyr-nano treatment group had the lowest tyrosine levels at 48 h. In the Hepa 1-6, HeLa, and MCF7 lines, the PolyHb-Tyr-nano treatment group had the lowest tyrosine levels at all times (24 h and 48 h).
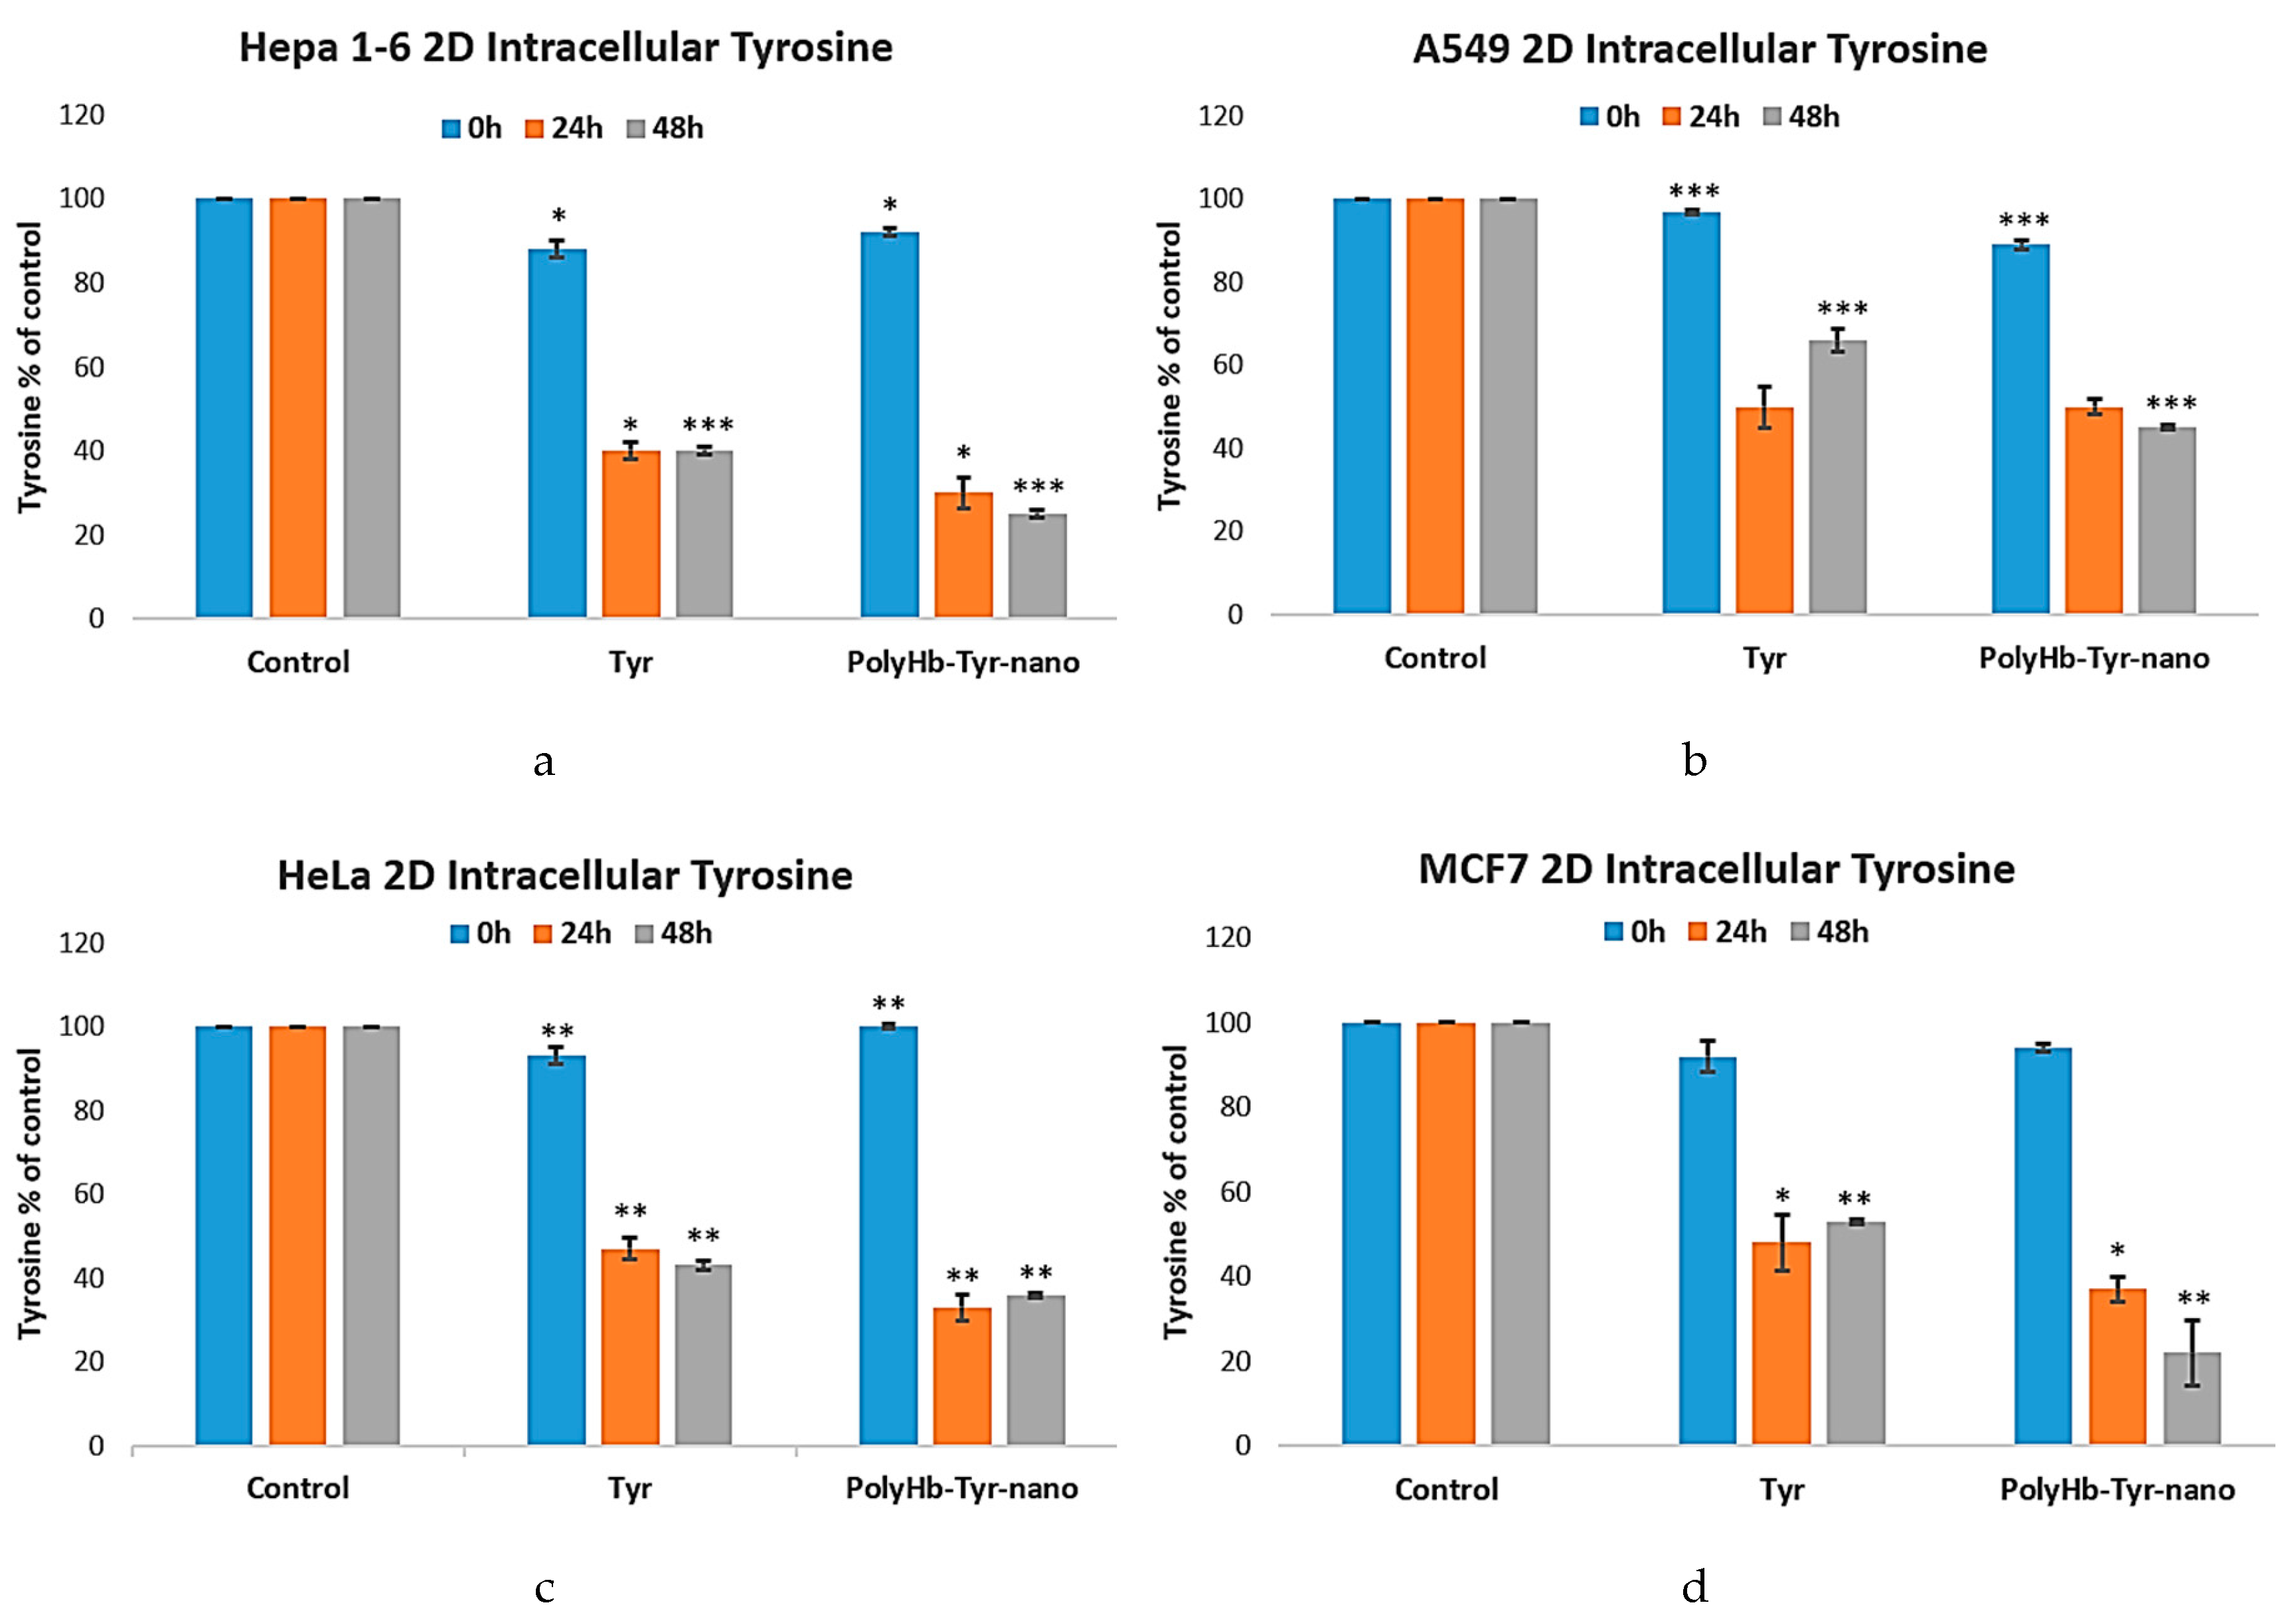
Figure 6.
The intracellular o-quinone levels of Hepa 1-6, A549, HeLa, and MCF7 cancer lines in 2D culture were measured via methanol homogenization at 0 h, 24 h, and 48 h at 437 nm. Groups: control group (Empty-nano), free quercetin group (Free Q), and quercetin nanocapsules group (Q-nano). Figure 6a-d: Intracellular o-quinone levels of Hepa 1-6, A549, HeLa, and MCF7. Compared to other treatment groups, the combination group (PolyHb-Tyr-nano + Q-nano) showed significantly higher intracellular o-quinone levels at both 24 h and 48 h.
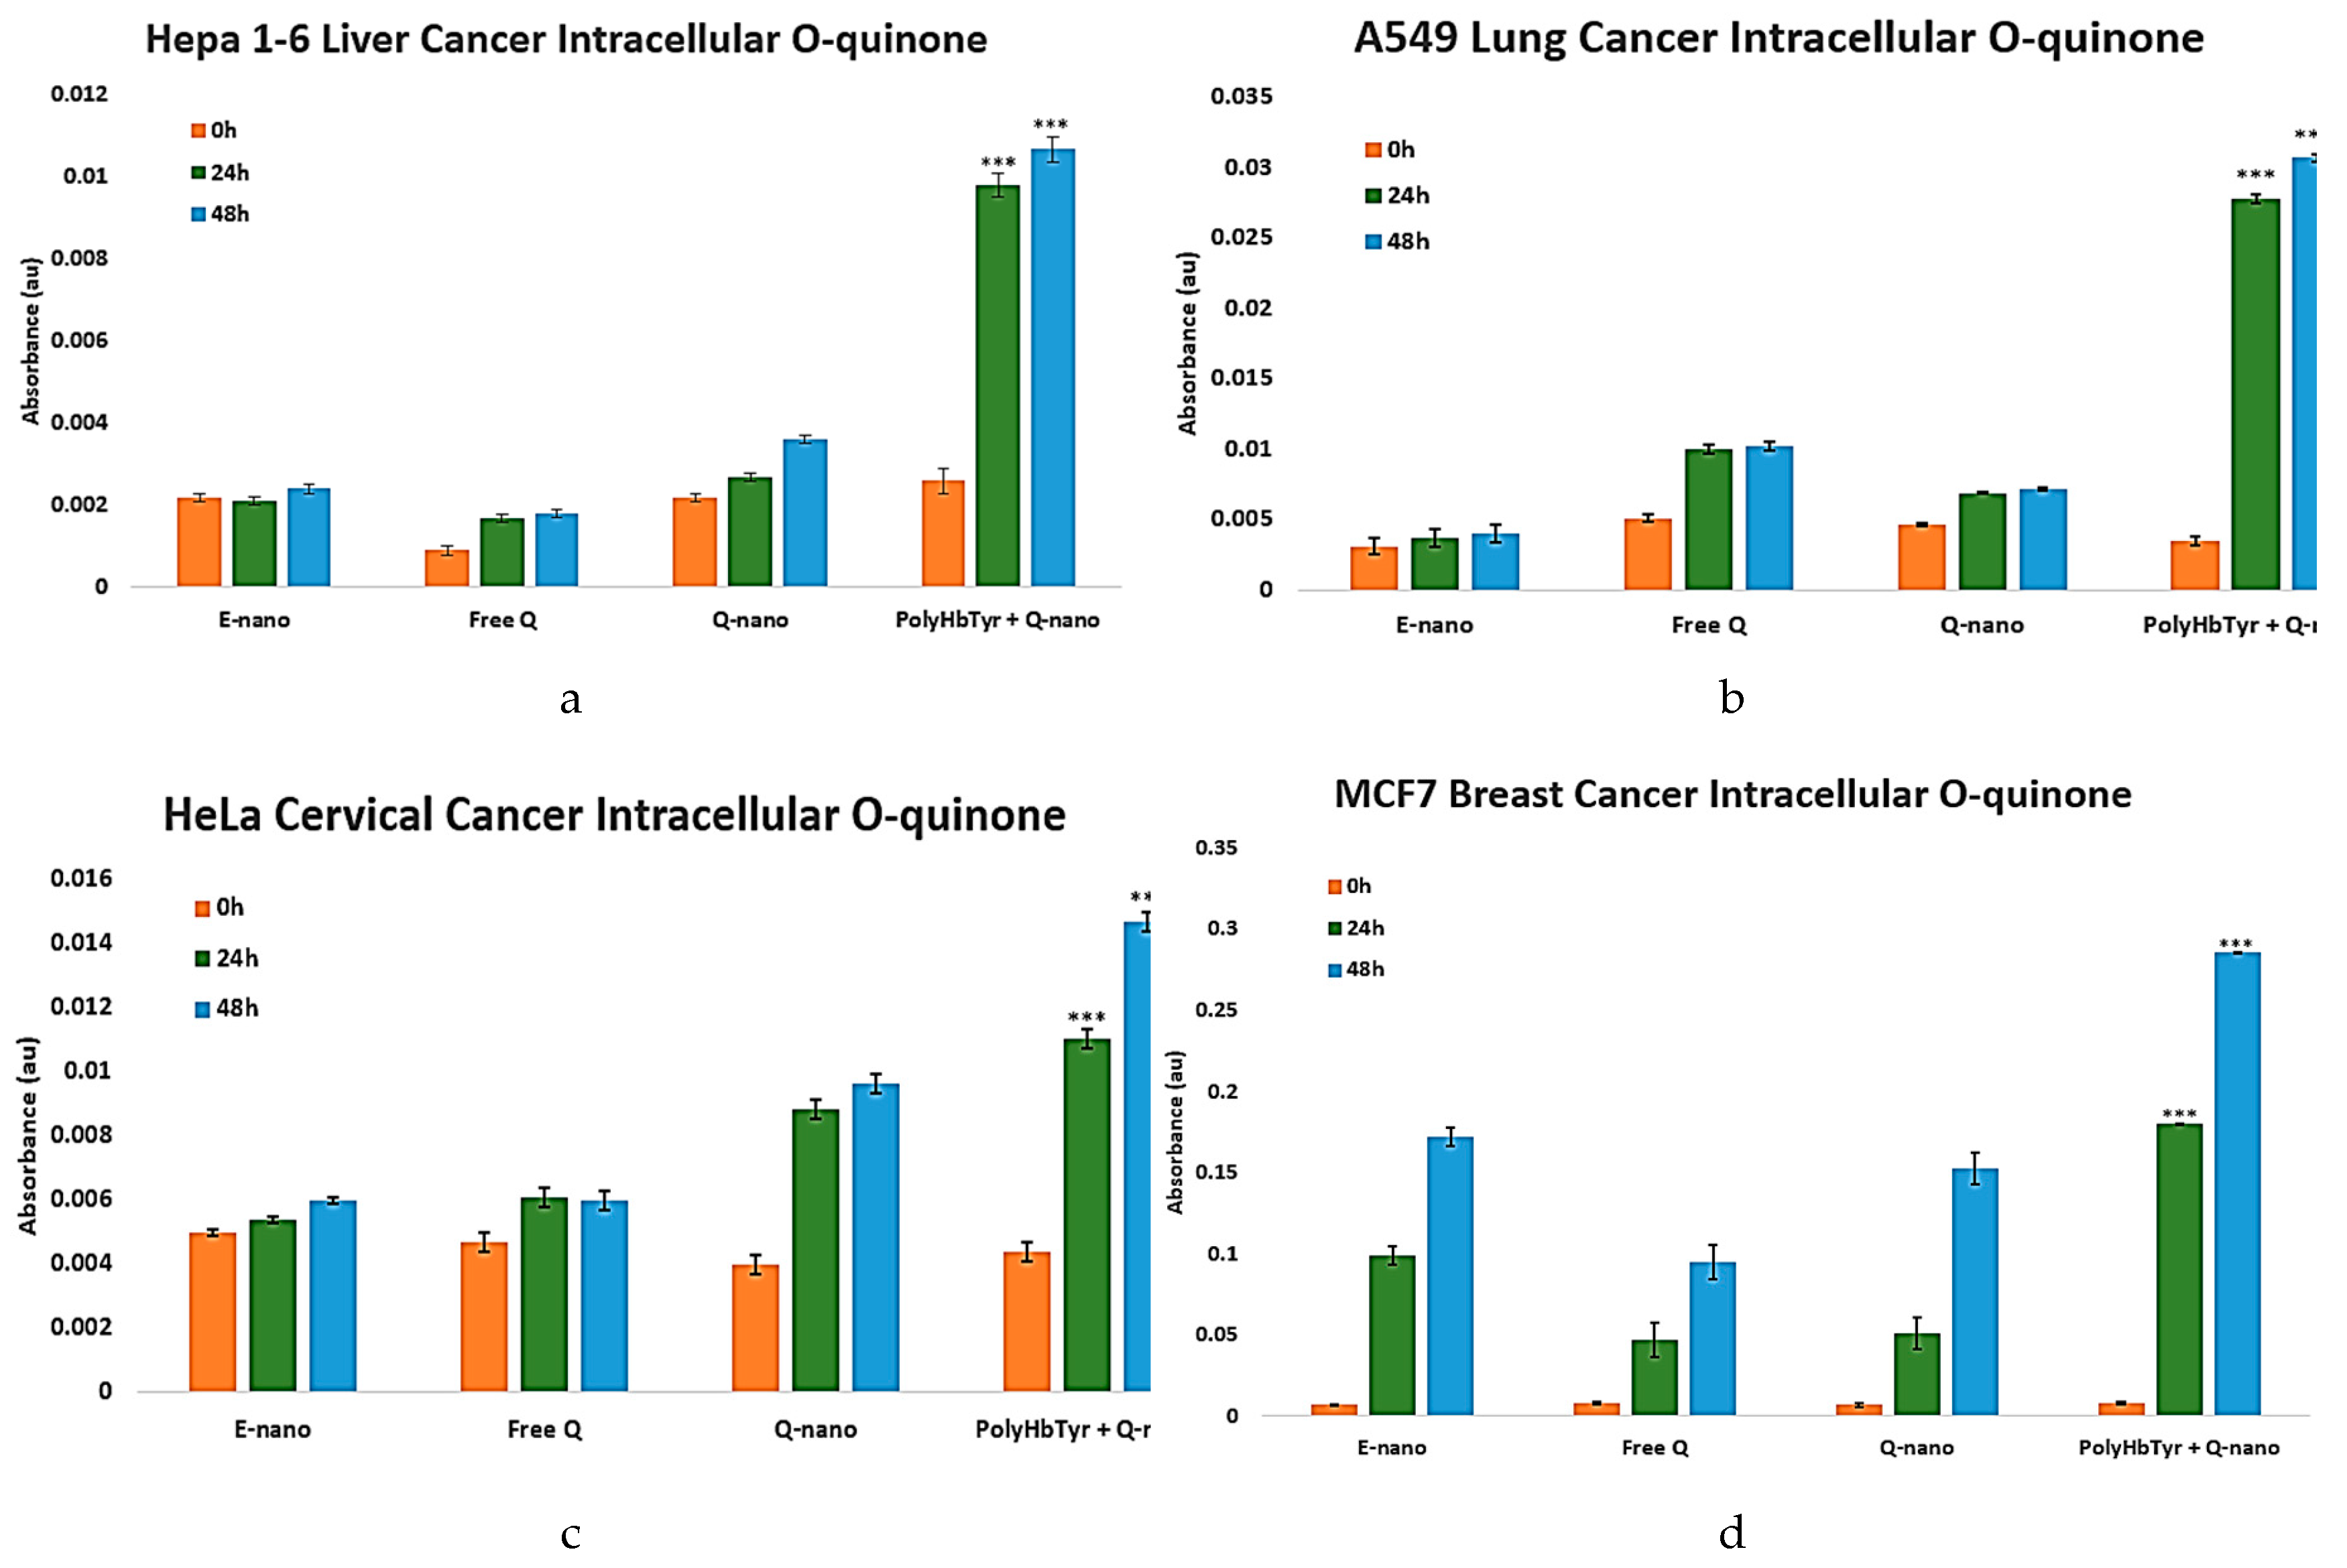
Figure 7.
Drug dosage safety screening test carried out on cancer line and human hepatocytes. Figure 7a: Liver cancer line Hepa 1-6 was tested for cytotoxicity at different drug concentrations consisting of 1/4x, 1/2x, 1x, 2x, and 3x on day 7 in 3D culture. We used quercetin nanocapsules (Q-nano), PolyHb-Tyr-nano, and a combination of PolyHb-Tyr-nano and quercetin nanocapsules (Combined nano), and the control groups used empty nanocapsules (E-nano) and polyHb. Figure 7b: Normal human hepatocytes were tested for cytotoxicity at different drug concentrations consisting of 1/4x, 1/2x, 1x, 2x, and 3x on day 7 in 3D culture. We used quercetin nanocapsules (Q-nano), PolyHb-Tyr-nano, and a combination of PolyHb-Tyr-nano and quercetin nanocapsules (Combined nano), and the control groups used empty nanocapsules (E-nano) and polyHb. The cell viabilities were obtained using hemocytometer with n=5, and statistical tests were carried out by one-away ANOVA. The concentration of the 1X solution is 6.4 mg/ml. Significance levels were compared to the 1X control groups; p-values are indicated by *<0.05, **<0.01,***<0.005.
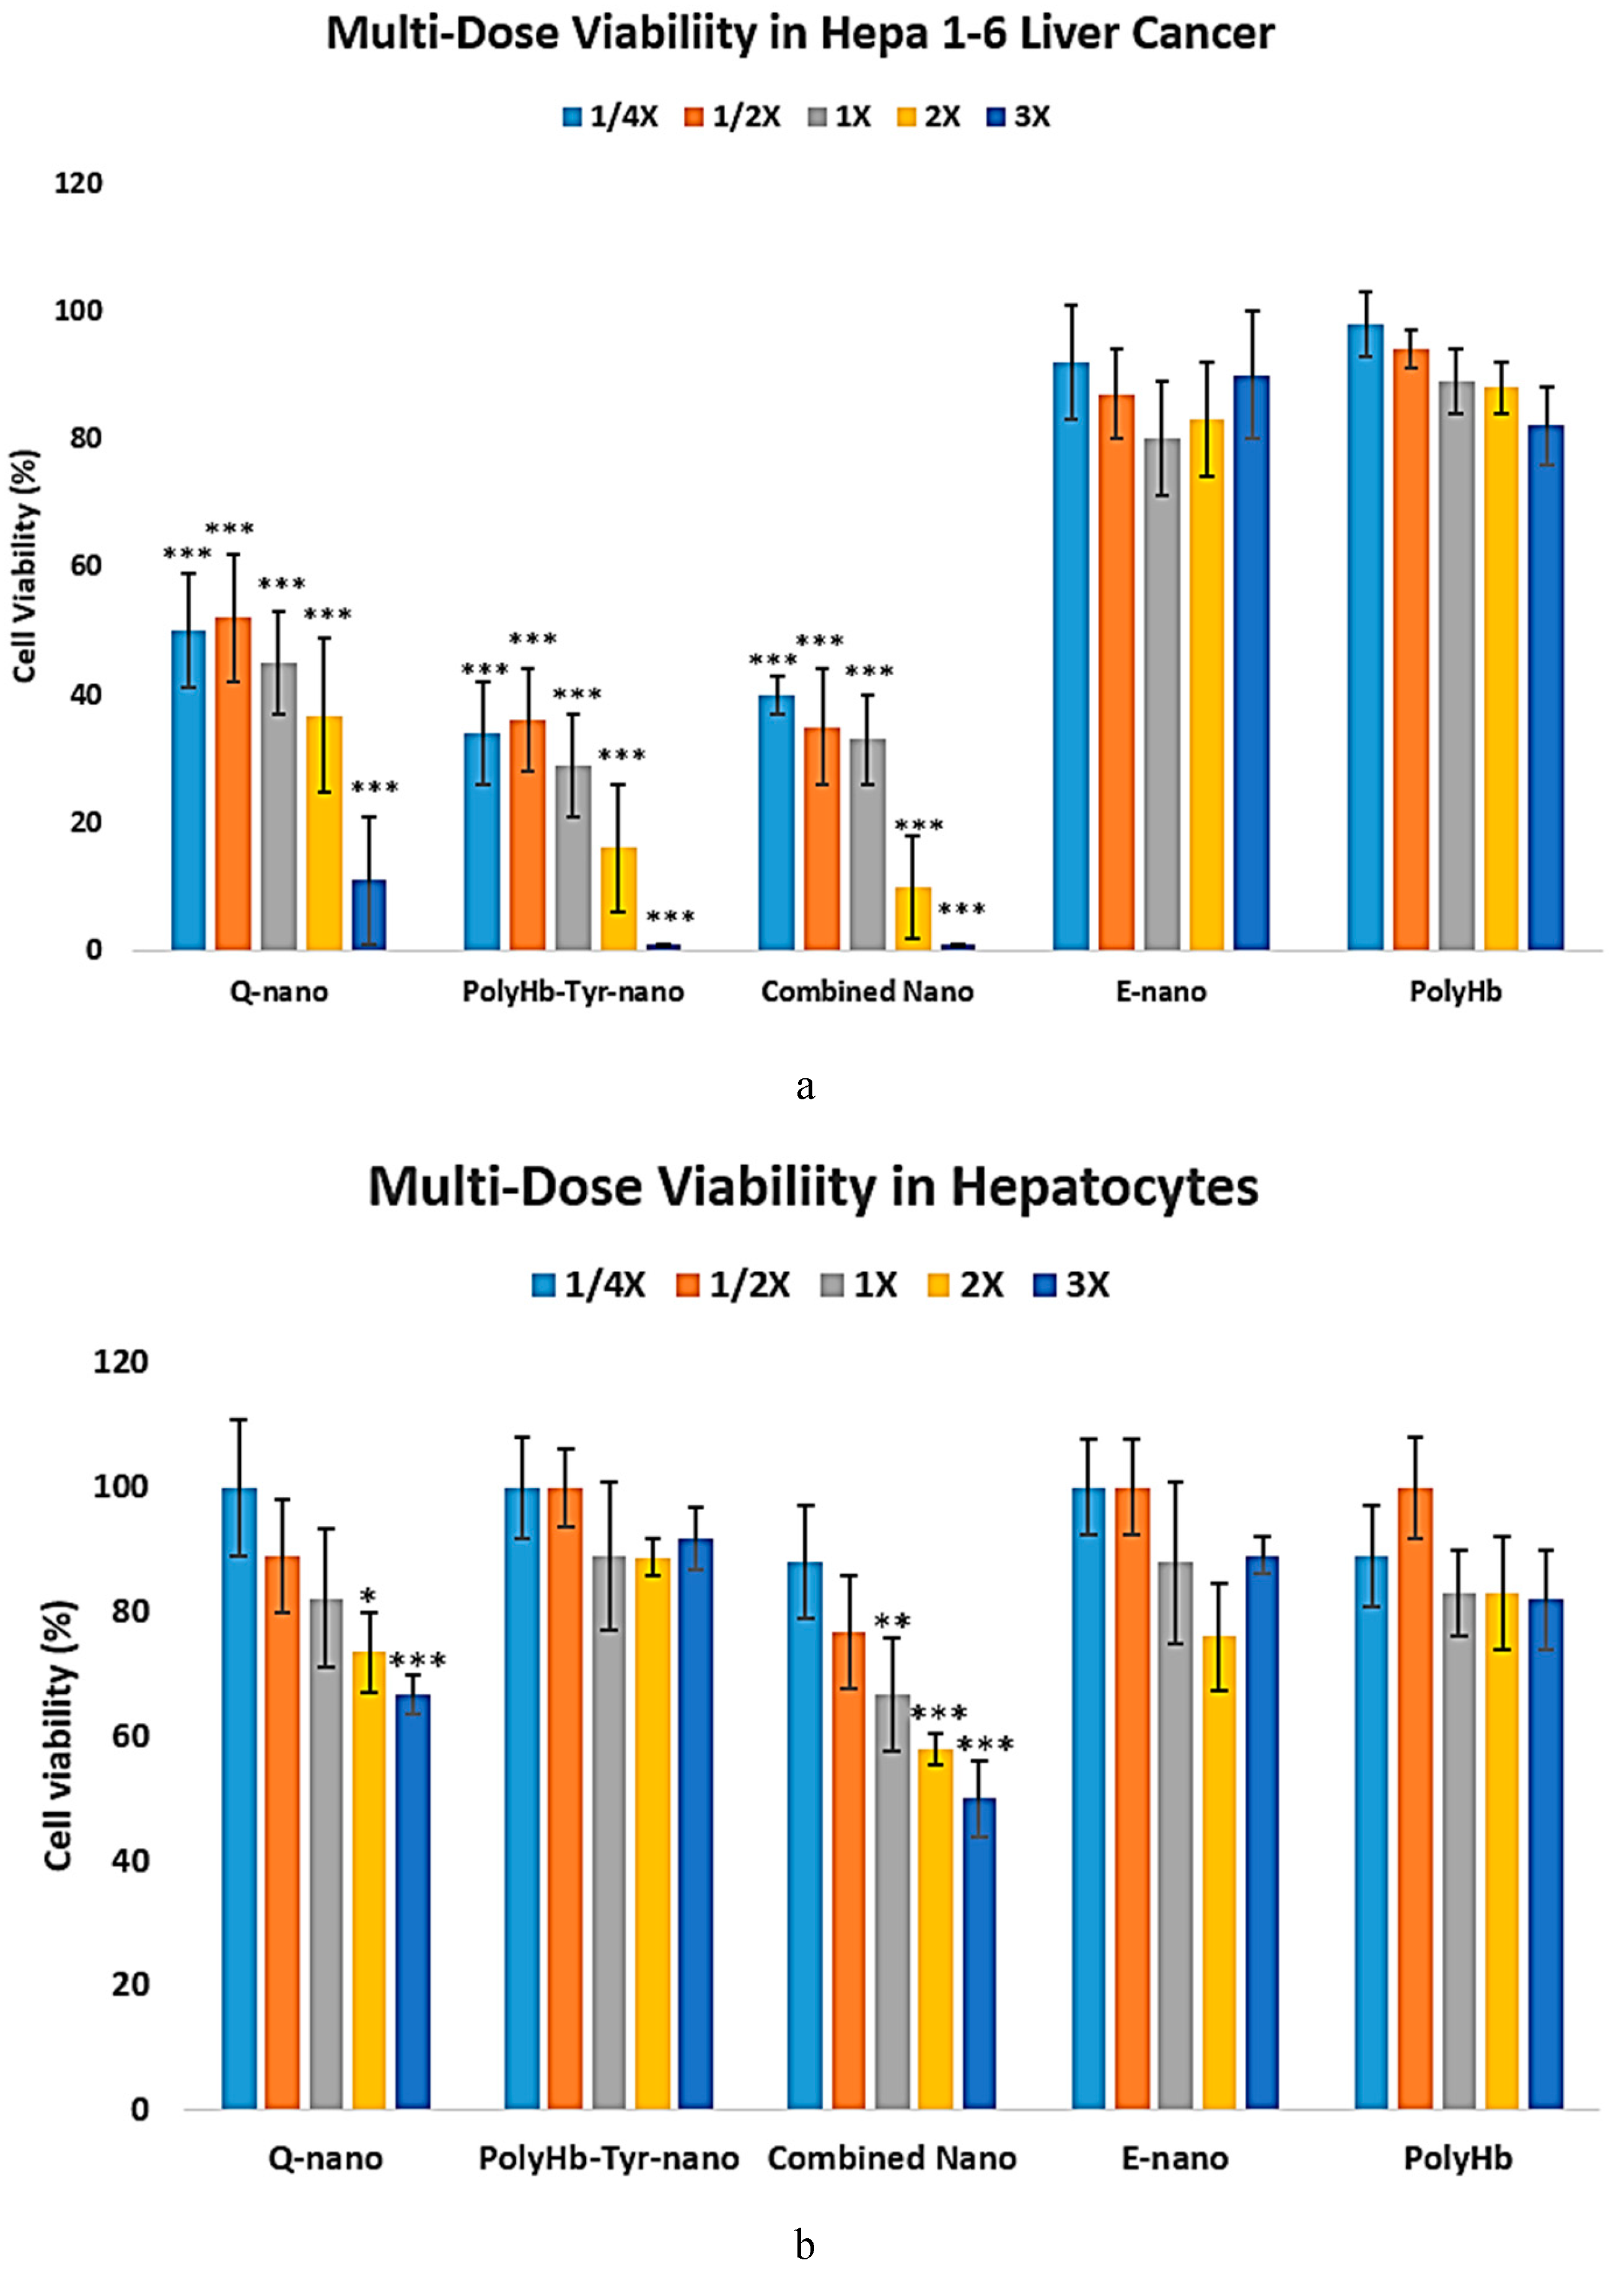
Figure 8.
To show that the nanocapsules are able to enter the Hepa 1-6 cells and not simply accumulate in the tumor microenvironment, the entry of nanocapsules into cells was confirmed using fluorescence microscopy. Fluorescent dyes were applied as follows: Hoechst 33342 for cells, Coumarin 6 for nanocapsules, and red plasma membrane dye for cell membrane staining. The objective was 20x, the light source intensity was 2%, and the exposure time was set to the standard 150 ms. Figure 8a: Inverted microscopy showing non-dyed cells and nanocapsules, both co-localizing with the cell and in the tumor microenvironment. Figure 8b: Co-localization of the blue fluorescent cell nucleus and green fluorescent nanocapsules in the cytoplasm and of green fluorescence surrounding the nucleus, showing nanocapsules that entered the cell but stayed in the cytoplasm instead of entering the cell nucleus. Figure 8c: Red plasma membrane dye marks the border of cells, confirming the entry of green nanocapsules inside the cell cytoplasm, around cell nucleus and showing the nanocapsules inside the tumor microenvironment.
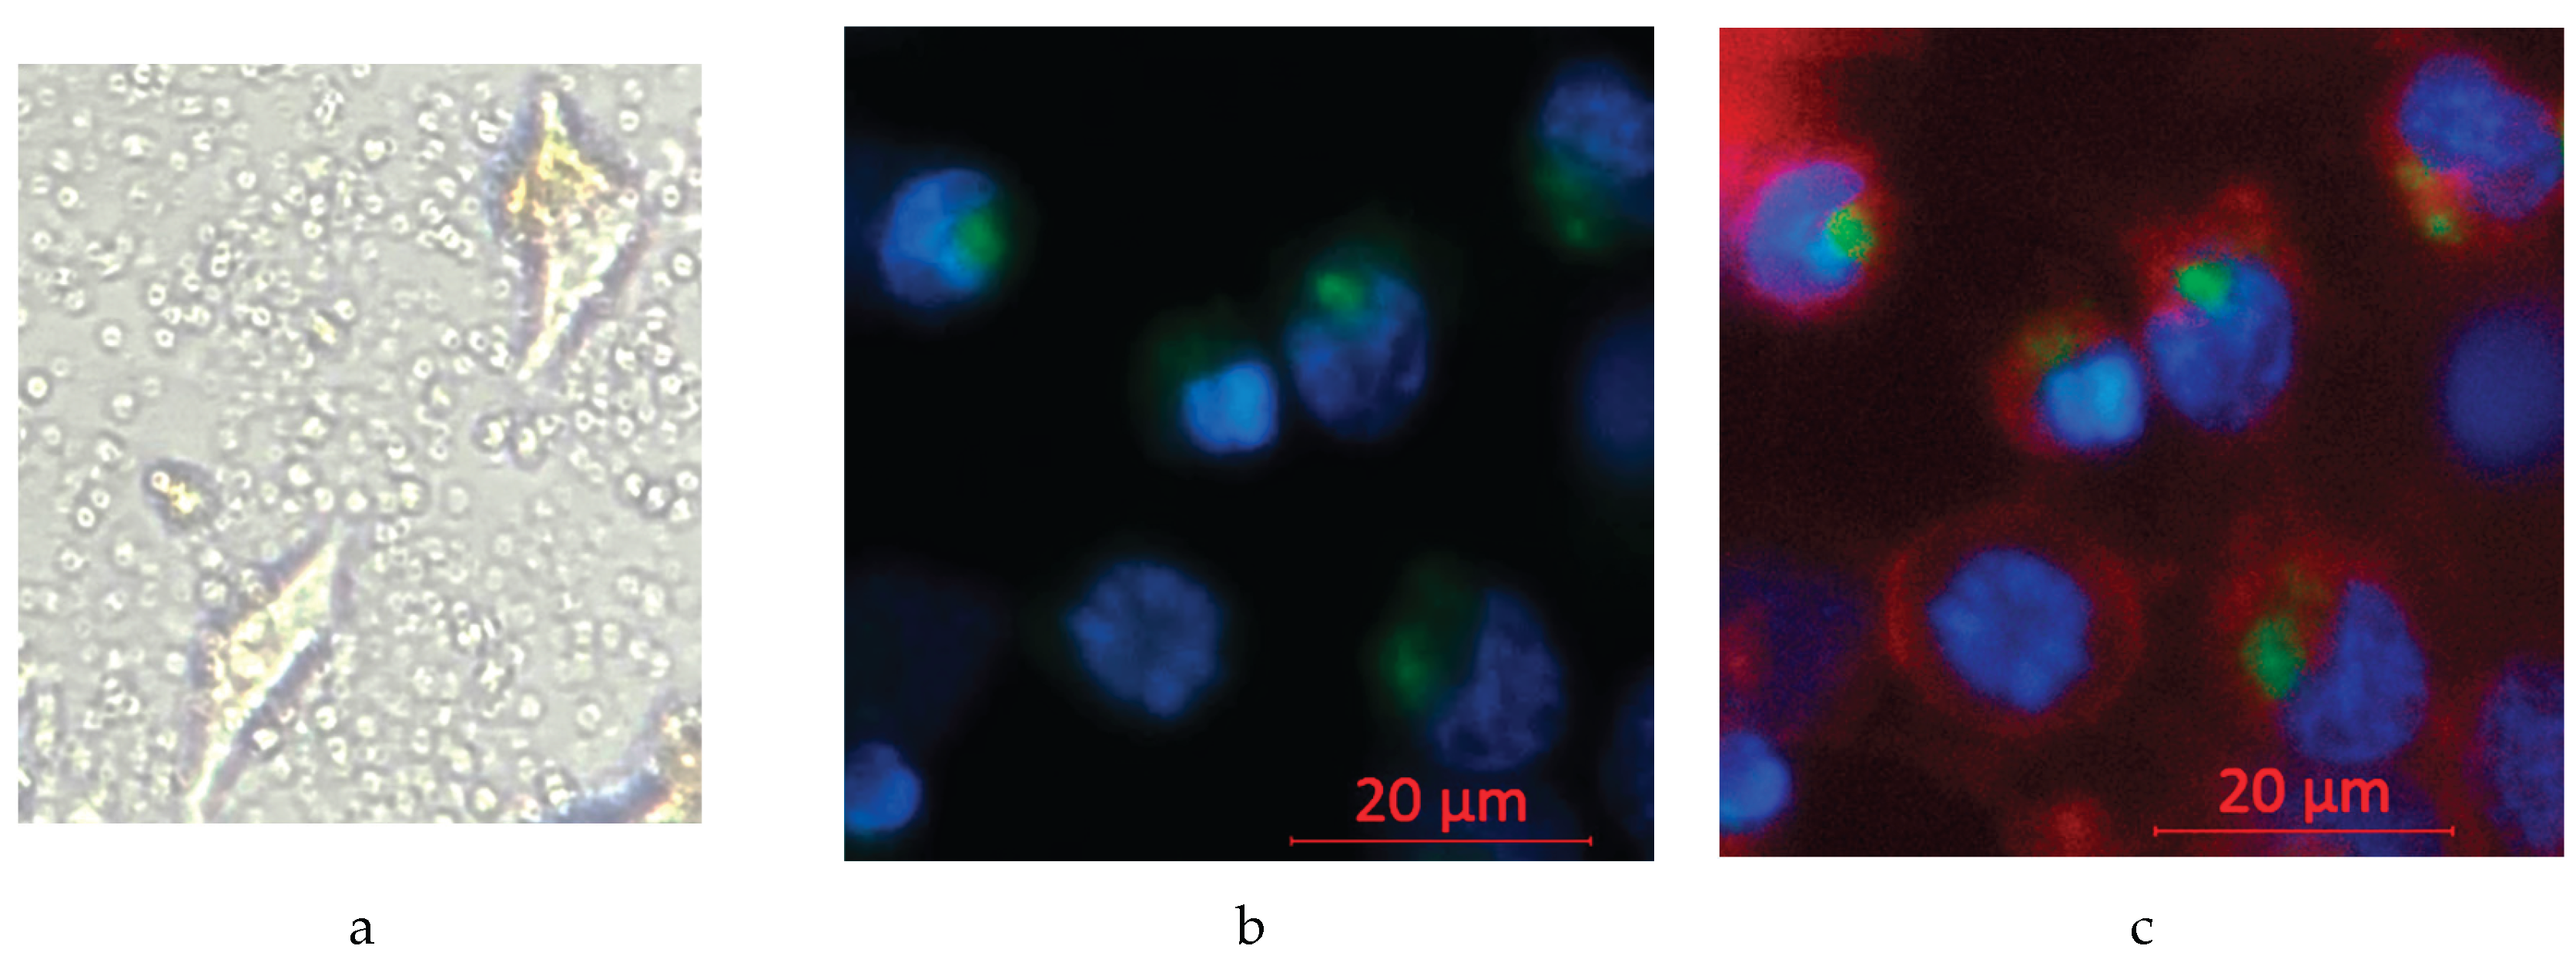

Table 1.
Table showing the 50% lethal dosage (LD50) values in liver cancer Hepa 1-6 lines and normal hepatocytes for quercetin nanocapsules (Q-nano), PolyHb-Tyrosinase-nanocapsules (PolyHb-Tyr-Nano), and the combined (Q-nano + PolyHb-Tyr-nano) nanocapsules.
Table 1.
Table showing the 50% lethal dosage (LD50) values in liver cancer Hepa 1-6 lines and normal hepatocytes for quercetin nanocapsules (Q-nano), PolyHb-Tyrosinase-nanocapsules (PolyHb-Tyr-Nano), and the combined (Q-nano + PolyHb-Tyr-nano) nanocapsules.
Disclaimer/Publisher’s Note: The statements, opinions and data contained in all publications are solely those of the individual author(s) and contributor(s) and not of MDPI and/or the editor(s). MDPI and/or the editor(s) disclaim responsibility for any injury to people or property resulting from any ideas, methods, instructions or products referred to in the content. |
© 2025 by the authors. Licensee MDPI, Basel, Switzerland. This article is an open access article distributed under the terms and conditions of the Creative Commons Attribution (CC BY) license (http://creativecommons.org/licenses/by/4.0/).
Copyright: This open access article is published under a Creative Commons CC BY 4.0 license, which permit the free download, distribution, and reuse, provided that the author and preprint are cited in any reuse.


