Submitted:
20 July 2025
Posted:
21 July 2025
You are already at the latest version
Abstract
Pulsatile signal detection plays an important role in monitoring various physiological parameters, primarily heart rate and blood oxygen saturation. Their applications range from clinical settings to personal health and wellness monitoring. PPG (photoplethysmography) can provide non-invasive optical measurements to detect blood volume changes in peripheral tissues. Yet, it suffers from low spatial resolution to precisely detect the pulsatile signal originating over 2mm in human tissue. Ultrasound provides a deep detectable range compared to the pure optical method. However, its low contrast to red blood cells and cluster artifacts makes it only detect the indirect pulsation from the surrounding tissue of blood vessels. Recent advances in PA imaging show its capability to precisely measure pulsatile signals originating from blood vessels in deep regions (over 10 mm) and its potential to accurately record blood oxygen saturation with high spatial and temporal resolution. This review article will summarize studies on photoacoustic (PA) pulsatile signal monitoring, highlight the technical advances, and compare it against optical and ultrasonic approaches.
Keywords:
photoacoustic imaging
; hemodynamics
; pulsatile signal monitoring
; PPG
1. Introduction
1.1. Background of Pulsatile Signal Detection
In vivo pulsatile signal detection is a scientific and medical technique used to monitor and study various physiological processes that exhibit rhythmic or pulsatile behavior within living organisms, typically humans or animals. This technique involves the measurement and analysis of signals or changes in physiological parameters over time, focusing on capturing the periodic variations occurring naturally within the body [1,2]. The significance of in vivo pulsatile signal detection lies in its ability to provide valuable insights into several important aspects of biology and medicine, including cardiovascular research, hemodynamics, and respiratory studies. The detected pulsatile signal can help researchers monitor heart rate, and arterial pulse waveforms, providing critical information for cardiovascular health assessment, disease diagnosis, and effectiveness of treatment evaluation [3,4]. By acquiring pulsatile signals in blood vessels, researchers can study blood flow dynamics, identify abnormalities such as atherosclerosis or vascular stenosis, and assess the impact of interventions like medications or surgeries on blood circulation [5,6,7]. In addition, pulsatile signal detection can be employed to study respiratory patterns and lung function. It allows researchers to assess various parameters, such as the breathing rate and the regularity of respiration cycles [8]. In general, in vivo pulsatile signal allows researchers and clinicians to gain insights into the dynamic nature of physiological processes, leading to improved diagnosis, treatment, and understanding of various diseases and biological systems.
1.2. Existing Detection Approaches of Pulsatile Signals
Using optical approach to extract pulsatile signal from human tissue has been widely investigated for decades. PPG is an optical technique which monitors optical absorption difference over time, resulting from variations in blood volume within the imaging region. Typically, the PPG device comprises a light source and a photodiode. The light illuminates into the human tissue and the photodiode captures the fluctuation in light amplitude over time, revealing the pulsatile signal from the subject. Kao et al. [9] designed and validated a new PPG module for high-accuracy biomedical sensing. The module contains four light emitting diodes (LEDs) in different wavelengths. The PPG signal was optimized by achieving a simulated optical model under user’s skin, maximizing the ratios of pulsatile to non-pulsatile components in PPG waveforms. The optimized PPG device enables high accuracy in blood pressure estimation. However, the proposed method assumed PPG signal captured from longer wavelengths only contains deep region signal, which is not true in this case. Lai et al. [10] utilized imaging photoplethysmography (iPPG) to detect the perfusion levels of the microvasculature tissue bed in different perfusion conditions during intestinal surgeries. iPPG perfusion maps were successfully extracted from the intestine microvasculature, demonstrating that iPPG can be successfully used for detecting perturbations and perfusion changes in intestinal tissues during surgery. While iPPG possesses real-time imaging with large field of view, the detectable depth of image acquisition is limited to superficial tissue, resulting in a restricted capture of perfusion information from deeper tissue layers.
Apart from optical methods, there have been explorations into utilizing ultrasonic approaches for extracting pulsatile signals. Jimenez et al. [11] presents a method using pulsatile signals from temporal ultrasonic imaging for continuous, noninvasive blood pressure monitoring. The method uses ultrasound imaging to measure arterial dimension variation over time, which provides pulsatile signal containing cross-sectional area information. In the meanwhile, the artery wall resonances are measured to further assist the blood pressure estimation without calibration. Wang et al. [12] proposes an ultrasonic device that can continuously monitor the central blood pressure (CBP) waveform from deeply embedded vessels. The device is ultrathin, stretchable, and conformal to the skin, enabling non-invasive, continuous, and accurate monitoring of cardiovascular events from multiple body locations. This capability addresses the limitations of existing non-invasive approaches, which can only access the superficial peripheral vasculature for pulsatile signal acquisition. While measuring pulsatile waveform from vessel using ultrasonic technique has been a sophisticated solution for decades, the pulsatile waveform is indirectly measured from the movement of the vessel wall, which is an indirect measure of blood volume. Therefore, due to the resolution restrictions, the pulsatile signal is mainly captured from the large carotid artery, hindering the potential for practical translation.
1.3. Introduction to Photoacoustic Imaging
Photoacoustic imaging (PAI) takes advantage of both optics and ultrasound. The optical contrast is detected by a nanosecond laser pulse and transmitted acoustically. Therefore, it provides high spatial resolution without compromising the detectable depth due to the relatively weak acoustic scattering in human tissue [13,14]. In the meanwhile, the temporal resolution of PAI mainly depends on the pulse repetition frequency (PRF) of the laser and the arrival time of acoustic waves from the subject to the receiver [15]. Hence, precise pulsatile signals from deep regions with high spatial resolution can be acquired by applying a high PRF laser. To date, Photoacoustic Imaging (PAI) has two major implementations [16]. The first, known as photoacoustic microscopy (PAM), provides high-resolution imaging and image reconstruction is typically not needed [17]. Based on the determining factor of spatial resolution, PAM can be further categorized into two subtypes: optical-resolution PAM (OR-PAM) and acoustic-resolution PAM (AR-PAM). The second PAI implementation, commonly known as photoacoustic computed tomography (PACT), utilizes wide-field light illumination and acoustic detection through a multi-element ultrasound transducer array. Due to the wide acceptance angle of the transducer elements, image reconstruction is required [18]. In comparison to PAM, PACT generally offers high imaging speed and greater penetration capabilities, albeit at the expense of lower spatial resolutions. Over the past few years, both PAM and PACT have been used to extract pulsatile signals in various imaging applications [19]. Due to their differences in spatial resolution, the following context will be split into PAM and PACT sections.
2. Photoacoustic Pulsatile Signal Extraction and Applications
2.1. PAM-Based Dynamic Photoacoustic Imaging
This section summarizes recent advances in pulsatile signal detection and applications using PAM systems. While PPG systems can extract hemodynamic signals from tissue using both visible and NIR light source, the strong optical absorption of visible light limits their penetration depth, and the light scattering reduces spatial resolution. Compared to PPG system, PAM system capitalizes on photoacoustic effect and therefore break through the scattering limit to capture hemodynamics in a deeper region. Thanks to the advancement in high-speed scanning, high PRF light source and high-throughput data acquisition, PAM systems are able to sample the heartrate waveform at a sampling frequency far exceeding the required rate. Moreover, PAM enables detailed sO2 mapping with high spatiotemporal resolution. By utilizing PAM systems, various groups were able to reveal the hemodynamics underneath the human dermal layers, extracting pulsatile signals from a specific vessel region. In high-speed PAM imaging systems imaging systems, studies further revealed blood oxygenation dynamics in pulsatile arteries. In addition, blood pulse wave velocity measurement was proposed by measuring the ECG and local blood flow velocity using PAM.
2.1.1. Measurement of Heart Rate Waveform and Vascular Dynamics
Ahn et al. [20] used high-resolution and high-speed PAM to monitor vascular dynamics in human fingers. The authors demonstrate the ability of PAM to visualize and measure various parameters of microvasculature networks in human finger. They specifically focus on monitoring the position displacement of blood vessels associated with arterial pulsation and quantifying oxygen saturation and blood perfusion during and after arterial occlusion. It should be noted that the extracted pulsatile signal primarily originates from axial displacement, which is consistent with observations from ultrasound imaging [21].
The proposed system is modified from a commercial PAM and employs two nanosecond pulsed lasers with wavelengths of 532 nm and 559 nm to measure oxygen saturation. PA waves generated on the target are captured by a 50-MHz US transducer and amplified. The signals are digitized and transferred to a computer for further analysis. The system includes motorized linear stages to expand the field of view and uses a multi-functional data acquisition board for synchronization. The system achieved lateral and axial resolutions of 5 μm and 30 μm, respectively, and an imaging speed of 50 Hz, which is suitable for capturing the heart rate.
Figure 1A,B demonstrate the PA B-mode images of the finger during the systole and diastole phases, respectively. Skin and vessel layers can be clearly visualized. Figure 1C,D show the blood vessels’ position displacement over time and the corresponding frequency spectrum, respectively. The subject heart rate can be clearly captured and represented in the frequency spectrum. It should be noticed that the heart-rate waveform was extracted explicitly from a desired region of interest, which demonstrates the potential for precise local hemodynamic monitoring. These findings demonstrate that high-resolution functional PAM can be a valuable tool in assessing vascular dynamics during peripheral vascular examinations, with the potential to measure parameters such as heart rate, oxygen saturation, and blood perfusion.
In a subsequent study, the same group [22] developed another integrated system combining PAM and PPG to understand hemodynamic features in detail. As a commonly used clinical tool, PPG provides visualization of the hemodynamic waveforms. However, PPG could not provide any images of the blood vessel. The proposed fully integrated PAM-PPG system enabled simultaneous acquisition of vascular images (by PAM) and hemodynamic waveforms (by PPG) from human fingers. The OR-PAM system utilized a 532 nm pulsed laser that is coupled and delivered through a single-mode filter. A customized 15 MHz flat ring-shaped US transducer is submerged in a water tank to receive PA signals generated from the subject. The subject’s finger is compressed against the membrane sealed at the bottom opening of the water tank during scanning. In the meanwhile, a PPG printed circuit board (PCB) composed of a 532 nm LED and a photodiode is aligned with the PA probe described above. Authors also programmed the sampling intervals of PAM and PPG to synchronize the data acquisition sequence. With a different scanning probe design [20], this system possesses 2.5 µm and 68.4 µm resolution along lateral and axial directions, respectively. The maximum scanning speed of 2D PA imaging is 100 Hz.
Results from the system are shown in Figure 2. Skin and vessel can be clearly observed in Figure 2a, the acquired vessel movement from PPG signal are shown in Figure 2b, which match well with each other. Figure 2c,d shows the frequency domain spectrum of vessel movement and PPG signal, respectively. PPG signals acquired from three subjects agree well with vessel movement obtained from PAM (shown in Figure 2e). The presented results indicate that the integrated PAM-PPG system is capable of simultaneously capturing PA images and PPG signals. The vascular images and PPG signals from live human finger were continuously recorded to validate the system’s efficacy. Heart rate (HR) from the vascular movement, as detected by PAM, is derived, and directly compared with the one derived from blood volume changes. The two results exhibited strong consistency. Consistent with prior findings, the pulsatile signals detected by PAM originate exclusively from vessel movement rather than changes in PA intensity within a localized region. Figure 2f demonstrates the vessel position variation and Figure 2g shows PPG signal with and without arterial occlusion marked with red and blue line, respectively. The corresponding frequency domain spectra are shown in Figure 2h,i. The results indicate that the hemodynamic changes mentioned above were not observable during arterial occlusion when blood flow was temporarily blocked. Leveraging the monitoring of hemodynamic variations in deep tissue, the proposed system offers the potential to accurately differentiate between arteries and veins, enabling precise arterial mapping within the imaging region. This capability is made possible by advancements in high spatial and temporal resolution PAM, which analyzes subtle distinctions in blood flow dynamics, and pulsatile characteristics between arterial and venous structures.
2.1.2. Measurement of Dynamics in Blood Oxygenation
Li et al. presented the use of PAM to study the blood oxygenation dynamics of arteries from animal experiment [23]. The system was constructed based on the confocal OR-PAM design [24]. It utilized a pulsed dye laser whose light passed through a neutral density filter. The reflected light from the filter was directed to a photodiode for data synchronization and monitoring laser pulse energy fluctuations. An ultrasound transducer with 30 MHz central frequency was attached to the rhomboid prism for detecting PA signals. During imaging, the acoustic lens was submerged in a water tank filled with deionized water, with the tank’s bottom being a transparent high-density polyethylene membrane. Unlike previous studies [20,22], pulsatile signal can be extracted from both vessel movement and PA amplitude fluctuation. One potential reason is that the artery examined here has a larger diameter, making PA intensity variations caused by blood volume changes more pronounced and easier to detect. The PA signal amplitude of an artery at two different wavelengths (570 & 578 nm) is depicted in Figure 3A. To enhance the accuracy of sO2 measurement, the team divided the signal at each wavelength into single-period segments. These segments were then synchronized based on their lowest points to calculate the average signal amplitude over a cardiac cycle, as demonstrated in Figure 3B. The average signal amplitude during each cardiac cycle at the respective wavelengths was utilized to compute the temporal variation in sO2. As depicted in Figure 3C, during one cardiac cycle, the sO2 in a pulsating artery experiences a rapid increase as fresh blood is pumped through the artery. This increase in sO2 corresponds to the rise in blood volume within the vessel before it eventually stabilizes to a steady state. The proposed study highlights the feasibility of measuring dynamic sO2 in arteries, which could provide valuable information about oxygen metabolic rate. Besides dynamic sO2 monitoring, authors also discuss the potential of PAM in quantifying metabolic rate of oxygen in various organs and its applications in ophthalmic research.
2.1.3. Measurement of Pulse Wave Velocity
Yeh et al. [25] discussed the measurement of blood pulse wave velocity (PWV) using PAM. PWV is an important indicator of vascular stiffness and is commonly used in evaluating vascular diseases. Traditional imaging modalities have limitations in measuring PWV, but PAM offers a noninvasive and high-resolution solution. The proposed system comprises an OR-PAM system and a custom-made ECG recorder. In the system, two lasers were combined using a beam splitter to enable pulse-to-pulse wavelength switching for measuring sO2. The generated PA wave was focused by an acoustic lens, detected by an unfocused ultrasonic transducer, and amplified by two cascaded electrical amplifiers. Simultaneously, electrocardiograms (ECG) were recorded using three electrodes—one connected to the ground, one to a front leg, and one to the hind leg of a mouse. The ECG signals were amplified by a high-gain differential amplifier. Both the acquired PA and ECG signals were digitized using a dual-channel high-resolution digitizer and stored in a computer for subsequent offline data processing.
The team first identified major arteries and veins within a 5 × 2.5 mm2 region of interest in a mouse ear using dual-wavelength (532 & 563 nm) OR-PAM measurement. They then selected two cross sections, one from an artery and one from a vein, for a 30-second OR-PAM monitoring of blood flow while simultaneously recording an electrocardiogram (ECG). Representative one-second segments of the recorded blood flow and ECG patterns in the artery and vein are displayed in Figure 4a,b, respectively. The Fourier analysis of the entire 30-second blood flow pattern and ECG revealed a notable pulsation-induced oscillation tone in the arterial blood flow, as depicted in Figure 4c. Conversely, such oscillations were absent in the venous flow, as shown in Figure 4d. Therefore, the PWV measurement was only conducted in peripheral arteries and arterioles. Figure 4e demonstrated the measured PWV versus vessel diameters. A linear correlation between the PWV and the vessel diameter was observed. The proposed study integrates PAM with ECG to measure PWV in the peripheral regions of mice. The results reveal a strong correlation between blood flow speed and ECG signals in arteries, whereas no such correlation is observed in veins. These findings highlight the potential of PAM for precise in vivo measurement of PWV.
2.2. PACT-Based Dynamic Photoacoustic Imaging
This section discusses the recent applications of pulsatile signal measurement using PACT. Overall, PACT systems offer a larger field of view than PAM systems. It can image different organs and differentiate arteries and veins based on the pulsatile amplitude distribution in the image. Moreover, by combining ultrasound technique, the artery position can be precisely allocated using information from both modalities.
2.2.1. Measurement of Cardiac Dynamics with Volumetric PACT in a Isolated Heart
Lin et al. [26] present an ultrafast volumetric photoacoustic imaging system for visualizing an Langendorff-perfused heart. The system excites PA signal using an 800 nm laser at a 100 Hz PRF, which are then captured by a spherical matric ultrasound array and reconstructed into volumetric images. The system provides a large field of view (FOV) to comprehensively capture cardiac motion while maintaining sufficient spatial resolution to resolve fine cardiac structures. By leveraging the high-frame-rate (100 Hz) volumetric imaging capability, detailed heartbeat dynamics can be extracted through temporal analysis of the reconstructed image sequences. Additionally, the inherent depth advantage of photoacoustic imaging is further enhanced by the Langendorff perfusion protocol, which replaces blood with clear perfusate. This configuration minimizes optical attenuation from blood, allowing the residual hemoglobin in the myocardium to serve as the primary contrast mechanism. As a result, the system achieves detailed visualization of regional cardiac muscle activity throughout the heart. Figure 5 demonstrates these capabilities, showing both the cardiac waveform and signal intensity profiles from voxels selected at the pulmonary, mitral, and tricuspid valves. This performance enables not only real-time monitoring of cardiac mechanics but also reveals functional and pathological features previously challenging to capture in intact hearts.
2.2.2. Real-Time Measurement of Pulsatile Dynamics in Human
Song et al. [21] developed a high-resolution PA imaging system by using a transducer array with 30 MHz central frequency. The proposed system demonstrates the feasibility of using a PACT to noninvasively image human pulsatile dynamics in vivo. The system is capable of real-time B-scan imaging at 50 Hz and high-speed 3D imaging, enabling the visualization of subcutaneous microvasculature in rats and humans. The system was used to monitor the pulsatile motion and changes in hemoglobin concentration of a human artery around the palm-wrist area with 20-ms temporal resolution, providing the first real-time PAI of human physiological dynamics. To maximize the PA sensitivity, authors used light at 570 nm to excite PA signal, where oxy and deoxyhemoglobin molecules have the same molar optical absorption coefficient. To couple the generated PA signal with an ultrasound transducer array, a water container filled with deionized water and a low-density polyethylene (LDPE) film window were used, minimizing direct contact with the skin surface. This system provides real-time imaging of microvasculature in humans with large field of view, capturing hemoglobin changes and arterial pulsations. These results open up new avenues for studying physiological dynamics in preclinical and clinical settings.
The team conducted scans on a palm region near the wrist where a prominent artery at 1mm deep was used to investigate pulsatile dynamics as shown in Figure 6a. The 3D image was first captured and then the scanning probe was affixed to conduct a real-time B-scan lasting 10 seconds (see Figure 6b). Due to the strong light absorption of hemoglobin at 570 nm, the lower portion of the artery was less visible. Nevertheless, the team successfully recorded the motion dynamics of arterial pulsation. An M-mode image through the artery’s center is displayed in Figure 6c. The estimated pulsatile rate from this image was 66 beats per minute, consistent with the 65 ± 2 beats per minute measured by a pulse oximeter. For comparison, an M-mode image of a vein was shown in Figure 6d, which disclosed relatively weak motion in the vein, presumably induced by skin movement caused by arterial pulsation. The team also noted that in the ultrasound image (Figure 6e), the M-mode image revealed that the artery predominantly expanded in a direction perpendicular to the skin surface, with only minimal expansion observed parallel to the skin surface. Although both PA and US M mode can detect pulsatile activity, the waveform origins differ. Pulsatile signals from PA M mode included both arterial position vibration and optical absorption while that of US M mode induced by tissue movement from the same region.
In general, with this system, hemoglobin concentration dynamics and arterial pulsatile motion were captured in real-time, the authors envision that the system will open up many new possibilities for studying functional and physiological dynamics in both preclinical and clinical imaging settings.
2.2.3. Quantification of Arteries and Veins in Human Breast Based on Pulsatile Signal
Lin et al. [27] developed a single-breath-hold PACT (SBH-PACT), for high spatiotemporal resolution PA imaging with large field of view. SBH-PACT overcomes the limitations of previous breast PACT systems by achieving sufficient penetration depth, high spatial and temporal resolutions, minimal limited-view artifacts, and high sensitivity to detect breast masses. The system uses 1064-nm light illumination and a 512-element full-ring ultrasonic transducer array to obtain a volumetric 3D image of the entire breast within a single breath-hold (~15 s). SBH-PACT was able to clearly identify tumors in breast cancer patients by delineating angiographic anatomy, even in radiographically dense breasts. The high imaging speed also enabled dynamic studies such as PA elastography to further improve tumor detection.
The system employs 1064 nm light and 2.25 MHz unfocused ultrasonic transducer array, enabling up to 4 cm in vivo imaging depth. Second, SBH-PACT incorporates one-to-one element to channel amplification and data acquisition circuits, allowing it to acquire a full 2D cross-sectional breast image with a single laser pulse or create a volumetric 3D image of the entire breast within a single breath-hold of 10 seconds. It’s 10 Hz 2D frame rate permits the observation of biological dynamics in a cross-section.
Using SBH-PACT in 2D mode with a 10 Hz frame rate, the team continuously monitored the pulsatile deformation of arteries inside the breast by fixing the transducer array at a specific elevation. After that, the PA signals were analyzed pixel by pixel in the frequency domain to distinguish arteries and veins based on the heartbeat frequency. As shown in Figure 7a., the authors chose a single pixel from an artery and another from a vein, denoted by circular markers 1 and 2, respectively. They then quantified the variation in pixel values as shown in Figure 7b. The consistent cyclic patterns observed in the artery pixel values suggest that these changes can be attributed to the propagation of pulse waves within the arterial network. In contrast, those vessels without pixel value variation belong to the venous network. Moreover, the frequency of these oscillations, as depicted in Figure 7c, agrees with the subject’s heart rate at approximately 1.2 Hz. Leveraging the high spatial and temporal resolutions, a depth-resolved pulsatile mapping from the scanning region can be derived to identify arteries and veins, respectively. The uniqueness of this PA imaging technique enables vessel category differentiation at a specific depth.
Moreover, given that arterial blood typically maintains a relatively narrow range of sO2, it is possible to leverage average PA signals obtained from arteries as a guide star to calibrate local optical fluence deep within the breast. This calibration process can facilitate the precise quantification of functional parameters using multi-wavelength PACT.
2.2.4. Measurement of Pulsatile Signals Using Dual Modal Ultrasound and Photoacoustic Computed Tomography
Zhang et al. [28] reported a video-rate dual-modal imaging platform that combines wide-beam harmonic ultrasound (WBHUS) and PACT. The system uses a clinical-grade linear-array transducer for both animal and human imaging. The harmonic US imaging provides high-resolution anatomical references to locate PA features and also enhances PA image quality by reducing artifacts. To achieve high imaging speed, the system employs a collaborative scheme of wide-beam transmission and pulse phase inversion. The system enables high-resolution co-registered US/PA tomographic imaging and single-breath-holding 3D imaging, and has been demonstrated for dual-contrast anatomical imaging, visualizing interventional procedures, and monitoring hemodynamics in animals and humans.
The platform uses a clinical-grade linear-array transducer and aims to improve the imaging quality and speed of ultrasound/photoacoustic imaging. A laser with 410-2500 nm tunable range and 20 Hz PRF is applied for PA imaging. The harmonic ultrasonography employs pulse phase inversion to reduce clutter and improve spatial resolution, while wide-beam ultrasound transmission enables a 20 Hz imaging rate with better image quality than plane wave imaging. By combining these two techniques simultaneously, the system effectively achieves high-resolution anatomical imaging while monitoring hemodynamics in both animals and humans through integrated dual-modal ultrasound and PA imaging.
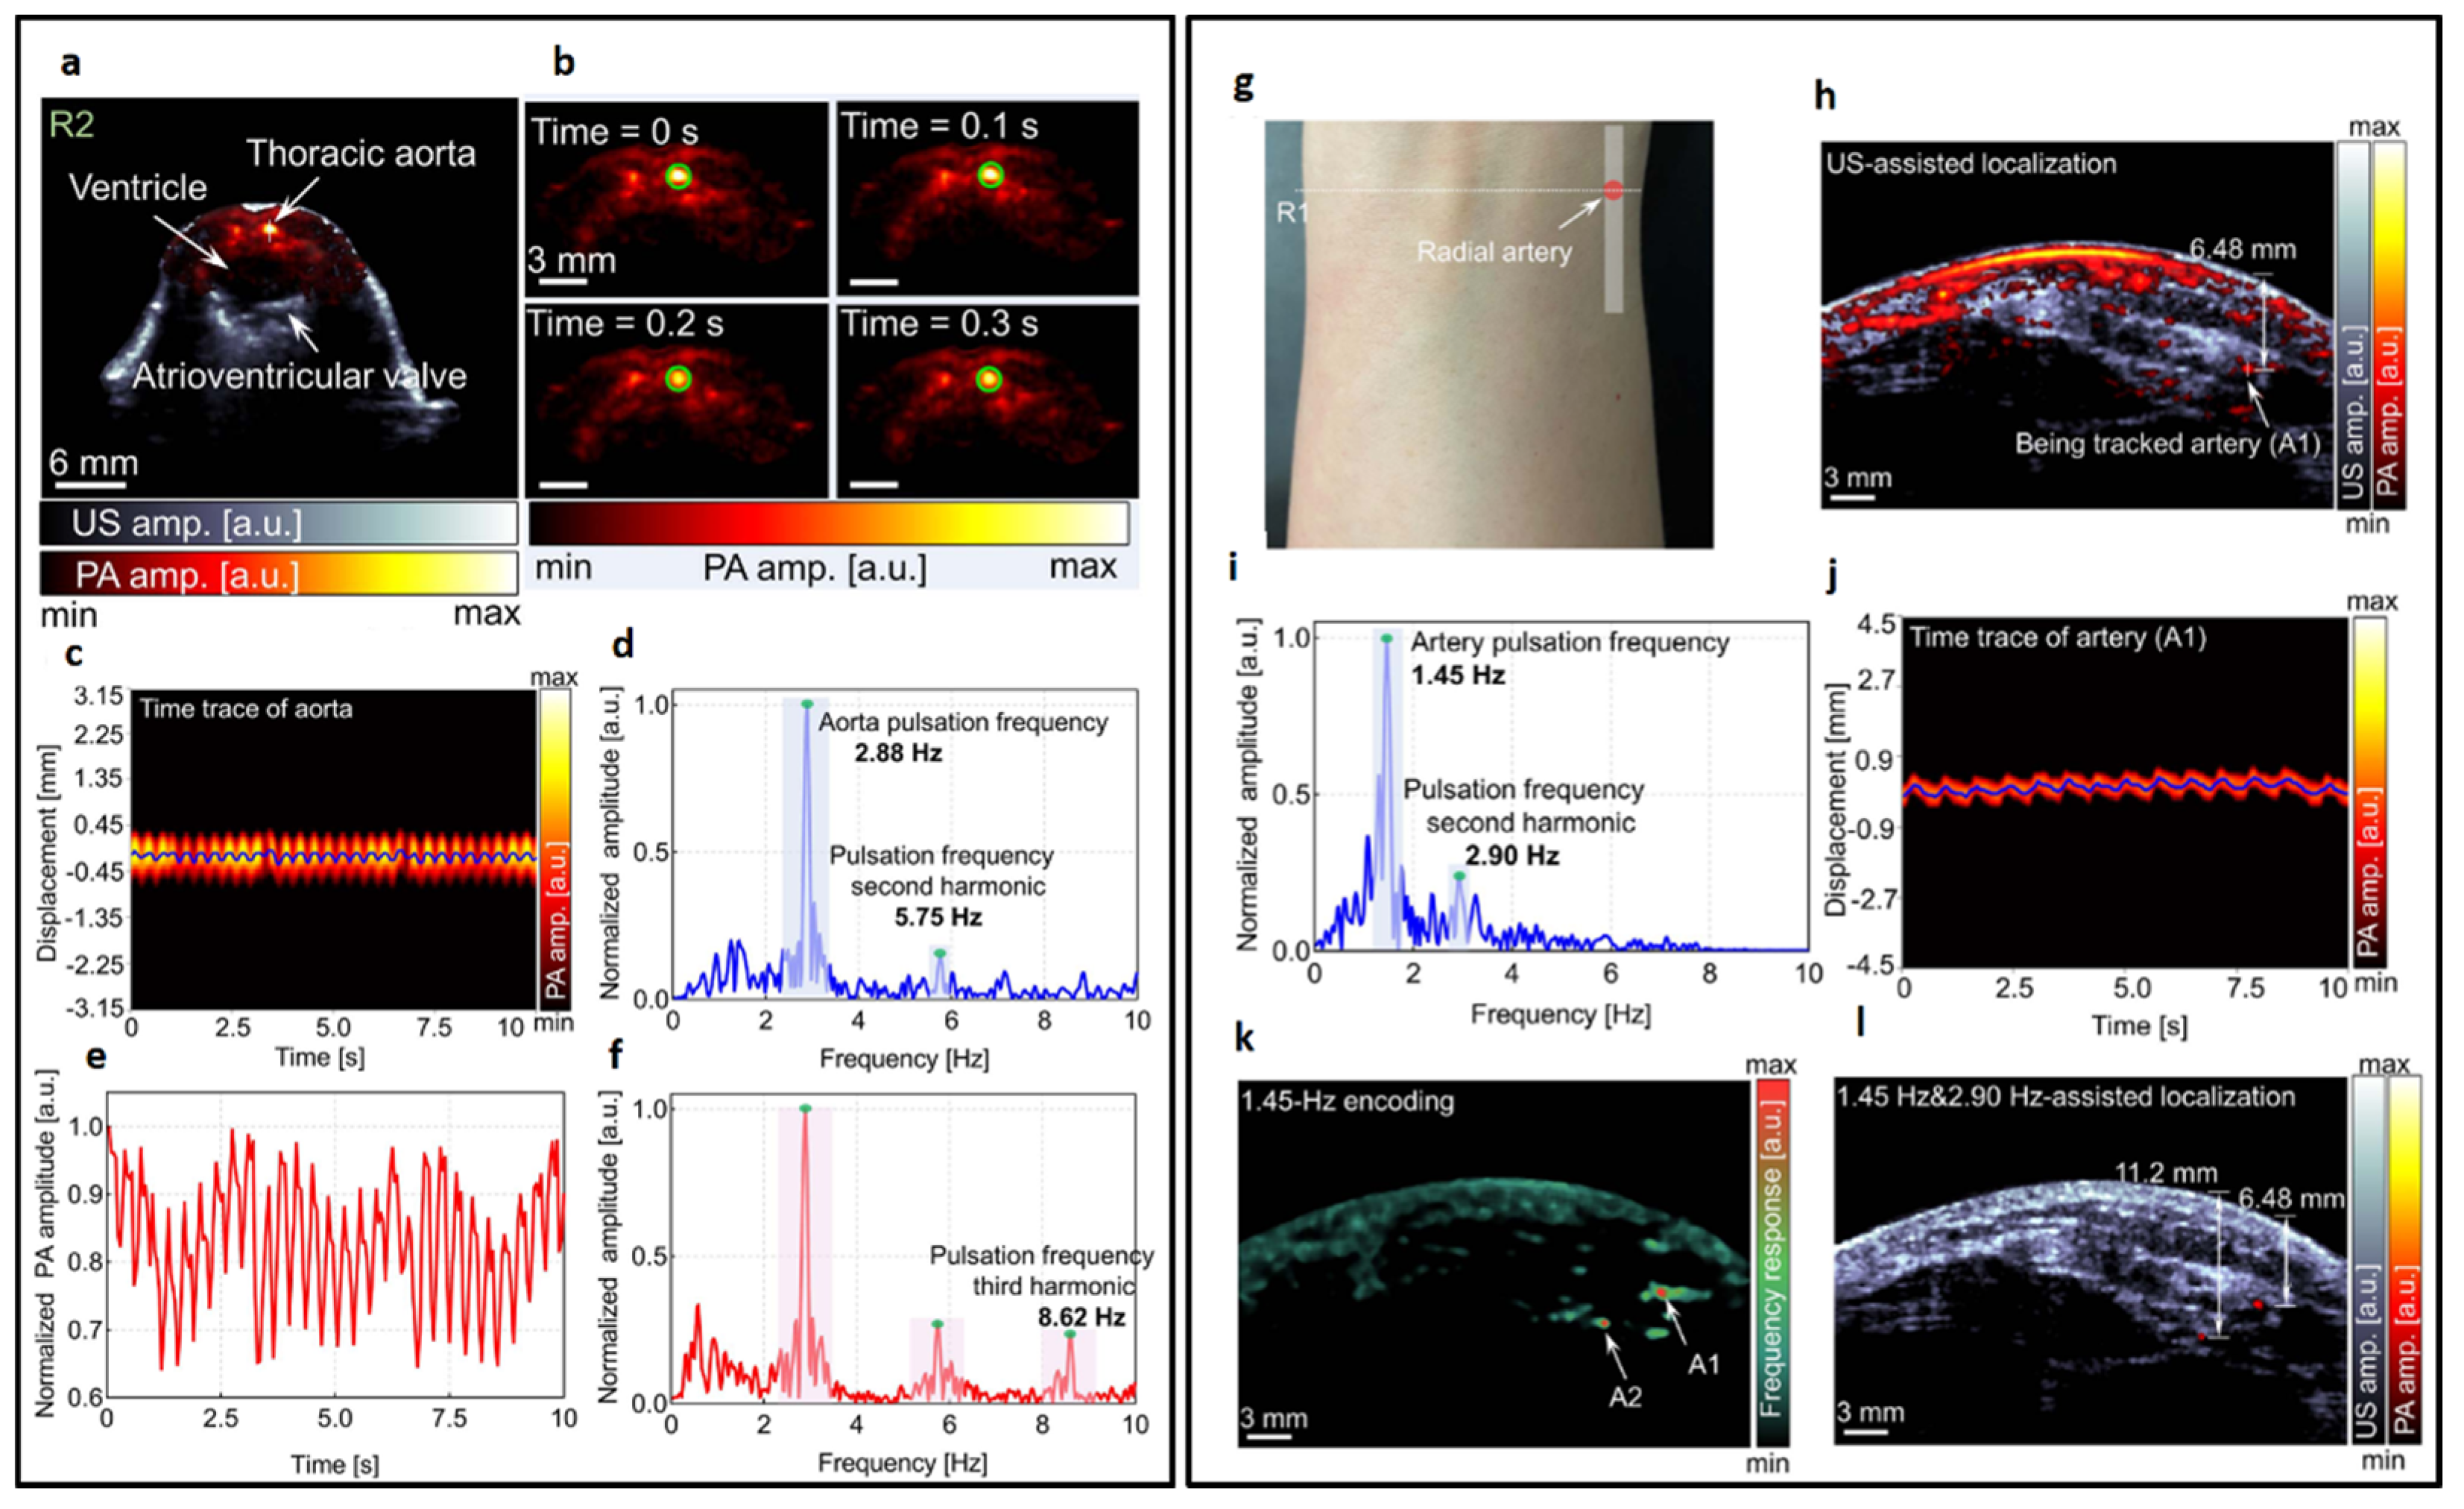
The authors initially validated the system by imaging mice. In Figure 8a, co-registered US and PA images are presented for a cross-sectional slice near the heart. Representative PA images throughout one heartbeat cycle are illustrated in Figure 8b. The variations in signal position, as captured in Figure 8c, are represented by the solid line in Figure 8a, accompanied by a Fourier analysis illustrated in Figure 8d. Furthermore, the author identified a distinct, rhythmic pulsation in the amplitude of the aorta, as demonstrated in Figure 8e, with its corresponding Fourier analysis presented in Figure 8f. These variations are synchronized with the heartbeat and thus serve as indicators of cardiovascular dynamics. The frequency of both displacement and amplitude associated with the heartbeat was measured at 2.88 Hz, demonstrating consistent alignment between the two parameters. The system’s high sensitivity also allowed the detection of the second (5.75 Hz) and third harmonics (8.62 Hz) of the heartbeat. The result indicates that with high imaging speed, a precise pulsatile waveform can be captured, therefore revealing more hemodynamic features. Subsequently, the authors applied the same system to image the human forearm. A continuous monitoring of a cross-sectional forearm area is illustrated in Figure 8g. Using dual-modal imaging, the radial arteries were successfully located, as displayed in Figure 8h. The authors recorded changes in arterial position, represented by the white solid line in Figure 8i, and determined the fundamental and harmonic frequencies of the major radial artery through Fourier transformation. Furthermore, an analysis of the temporal frequency of each pixel in the PA images allowed for the encoding of blood vessels with pseudo-color, as demonstrated in Figure 8k. Two specific locations exhibiting strong pulsations were identified and marked in 8k and highlighted in the combined ultrasound (US) and PA image overlay, as shown in Figure 8l. The quantitative in-vivo results demonstrate significant potential for advancing cardiovascular-related applications. These findings suggest that the technology could enhance the diagnosis, monitoring, and treatment of cardiovascular conditions by providing more accurate and detailed insights into blood flow dynamics, and vascular health.
3. Discussion and Conclusion
This article provides an overview of photoacoustic techniques for in-vivo pulsatile detection, spanning microscopic to macroscopic scales. The detection of pulsatile signals plays a critical role in both clinical and non-clinical applications, particularly for monitoring physiological parameters like heart rate and blood oxygen saturation. This review highlights key advancements in the field, comparing traditional techniques such as PPG and ultrasound with more recent approaches like PA imaging. The findings point to the promise of PA imaging in overcoming limitations inherent to optical and ultrasound methods by offering deeper tissue penetration, higher spatial resolution, and more accurate hemodynamic data acquisition. While PPG is widely used in clinical and wellness applications, it suffers from limited spatial resolution, which restricts its ability to capture deeper pulsatile signals beyond superficial tissues. The method’s reliance on optical absorption differences makes it ideal for monitoring blood volume changes, but its detectable depth is limited to approximately 2mm within human tissue. This restricts its use in applications requiring detailed insights into deeper blood vessels or hemodynamics. On the other hand, ultrasound-based techniques provide deeper detection capabilities but face challenges in contrast resolution. Ultrasound’s limited ability to directly detect red blood cells means that pulsatile signals are often inferred indirectly from surrounding tissue movements rather than from blood flow itself. This indirect detection limits the accuracy of ultrasound-based pulsatile monitoring, reducing its efficacy in applications like real-time cardiovascular assessments. Moreover, the lack of optical sensitivity in the scanning region makes it impossible to use ultrasound technology to measure local hemoglobin concentration.
In contrast, PA imaging, which combines optical and ultrasonic techniques, presents a promising solution. By using a laser to induce photoacoustic signals that are captured ultrasonically, PA imaging can detect pulsatile signals from deep tissue, providing both high spatial and temporal resolution. Recent studies demonstrate its capacity to capture precise signals from deep vasculature while also measuring sO2 more accurately than PPG [29]. PA imaging’s ability to simultaneously measure oxygenation and hemodynamic parameters in real-time holds great potential for applications in cardiovascular research, as well as clinical monitoring of conditions like atherosclerosis and vascular stenosis. Recent advancements in PA imaging systems have also enabled the characterization of various tissue compositions based on their optical absorption properties [30,31]. This capability facilitates the functional assessment of vessels like the carotid artery, providing detailed clinical information on condition and health [32,33,34,35]. Instrumental developments—including fast-tuning lasers, parallel detection, advanced image reconstruction and data-processing algorithms—have been key to this transformation, significantly expanding PA imaging’s potential for real-time monitoring of functional cardiovascular activity [34,35]. Demonstrating this enhanced capability, experimental studies showcase PA imaging’s effectiveness in capturing key dynamic vascular parameters such as heart rate, blood flow velocity, PWV, and oxygen saturation beyond surface regions. Both PAM and PACT are proving particularly valuable, capturing detailed images and functional data from peripheral and deep vasculature to offer comprehensive structural and functional insights.
In conclusion, while traditional optical and ultrasonic methods have been valuable in monitoring pulsatile signals, they fall short in terms of spatial resolution, tissue depth penetration, and real-time functional imaging. PA imaging emerges as a powerful tool to overcome these limitations, offering higher spatial resolution, deeper tissue penetration, and more accurate hemodynamic measurements. PA imaging holds great promise for cardiovascular applications, where precise monitoring of blood flow, oxygen saturation, and vessel dynamics is crucial for diagnosing and treating conditions. Future research should focus on optimizing the integration of PA imaging with other modalities, such as PPG and ultrasound, to further enhance its diagnostic capabilities and broaden its clinical applications.
Author Contributions
W.Z. and J.X. organized the structure of the manuscript. W.Z. and C.H., wrote the whole manuscript. J.X. revised the manuscript. All authors collaboratively wrote the manuscript. All authors have read and agreed to the published version of the manuscript.
Funding
This work was supported in part by National Institutes of Health (R01EB028978, R01EB029596).
Institutional Review Board Statement
Not applicable.
Informed Consent Statement
Not applicable.
Data Availability Statement
Not applicable.
Conflicts of Interest
Dr. Jun Xia is the founder of Sonioptix, LLC, which, however, did not support this work. All other authors declare no conflicts of interest.
References
- Allen, J. , Photoplethysmography and its application in clinical physiological measurement. Physiological measurement, 2007. 28(3): p. R1. [CrossRef]
- Moraes, J.L. , et al., Advances in Photopletysmography Signal Analysis for Biomedical Applications. Sensors (Basel), 2018. 18(6). [CrossRef]
- Zaunseder, S. , et al., Cardiovascular assessment by imaging photoplethysmography–a review. Biomedical Engineering/Biomedizinische Technik, 2018. 63(5): p. 617-634. [CrossRef]
- Kim, C.S. , et al., Ballistocardiogram: Mechanism and Potential for Unobtrusive Cardiovascular Health Monitoring. Sci Rep, 2016. 6: p. 31297. [CrossRef]
- Blazek, V., T. Wu, and D. Hoelscher. Near-infrared CCD imaging: Possibilities for noninvasive and contactless 2D mapping of dermal venous hemodynamics. in Optical Diagnostics of Biological Fluids V. 2000. SPIE.
- Abay, T.Y. and P.A. Kyriacou, Reflectance Photoplethysmography as Noninvasive Monitoring of Tissue Blood Perfusion. IEEE Trans Biomed Eng, 2015. 62(9): p. 2187-95. [CrossRef]
- Amelard, R. , et al., Non-contact hemodynamic imaging reveals the jugular venous pulse waveform. Scientific reports, 2017. 7: p. 40150. [CrossRef]
- Madhav, K.V. , et al., Robust extraction of respiratory activity from PPG signals using modified MSPCA. IEEE Transactions on Instrumentation and Measurement, 2013. 62(5): p. 1094-1106. [CrossRef]
- Kao, Y.-H. P.C.-P. Chao, and C.-L. Wey, Design and validation of a new PPG module to acquire high-quality physiological signals for high-accuracy biomedical sensing. IEEE Journal of Selected Topics in Quantum Electronics, 2018. 25(1): p. 1-10. [CrossRef]
- Lai, M. , et al., Imaging PPG for in vivo human tissue perfusion assessment during surgery. Journal of Imaging, 2022. 8(4): p. 94. [CrossRef]
- Jimenez, R. , et al., Resonance sonomanometry for noninvasive, continuous monitoring of blood pressure. PNAS nexus, 2024. 3(7). [CrossRef]
- Wang, C. , et al., Monitoring of the central blood pressure waveform via a conformal ultrasonic device. Nature biomedical engineering, 2018. 2(9): p. 687-695.
- Li, L. and L.V. Wang, Recent Advances in Photoacoustic Tomography. BME Frontiers, 2021. 2021. [CrossRef]
- Xia, J. Yao, and L.V. Wang, Photoacoustic tomography: principles and advances. Electromagn Waves (Camb), 2014. 147: p. 1-22. [CrossRef]
- Wang, L.V. and J. Yao, A practical guide to photoacoustic tomography in the life sciences. Nat Methods, 2016. 13(8): p. 627-38. [CrossRef]
- Wang, L.V. and L. Gao, Photoacoustic microscopy and computed tomography: from bench to bedside. Annu Rev Biomed Eng, 2014. 16: p. 155-85. [CrossRef]
- Jeon, S. , et al., Review on practical photoacoustic microscopy. Photoacoustics, 2019. 15: p. 100141. [CrossRef]
- Yao, J. and L.V. Wang, Photoacoustic tomography: fundamentals, advances and prospects. Contrast Media Mol Imaging, 2011. 6(5): p. 332-45. [CrossRef]
- Yao, J. and L.V. Wang, Perspective on fast-evolving photoacoustic tomography. Journal of Biomedical Optics, 2021. 26(6): p. 060602-060602. [CrossRef]
- Ahn, J. , et al., High-resolution functional photoacoustic monitoring of vascular dynamics in human fingers. Photoacoustics, 2021. 23: p. 100282. [CrossRef]
- Song, L. , et al., Ultrasound-array-based real-time photoacoustic microscopy of human pulsatile dynamics in vivo. Journal of Biomedical Optics, 2010. 15(2): p. 021303-021303-4. [CrossRef]
- Ahn, J. , et al., Fully integrated photoacoustic microscopy and photoplethysmography of human in vivo. Photoacoustics, 2022. 27: p. 100374. [CrossRef]
- Li, Q., et al. Measuring blood oxygenation of pulsatile arteries using photoacoustic microscopy. in Optics in Health Care and Biomedical Optics VII. 2016. SPIE.
- Hu, S.K. Maslov, and L.V. Wang, Second-generation optical-resolution photoacoustic microscopy with improved sensitivity and speed. Optics letters, 2011. 36(7): p. 1134-1136. [CrossRef]
- Yeh, C. , et al., Photoacoustic microscopy of blood pulse wave. Journal of biomedical optics, 2012. 17(7): p. 070504-070504. [CrossRef]
- Lin, H.A. , et al., Ultrafast Volumetric Optoacoustic Imaging of Whole Isolated Beating Mouse Heart. Sci Rep, 2018. 8(1): p. 14132. [CrossRef]
- Lin, L. , et al., Single-breath-hold photoacoustic computed tomography of the breast. Nat Commun, 2018. 9(1): p. 2352. [CrossRef]
- Zhang, Y. , et al., Video-rate dual-modal wide-beam harmonic ultrasound and photoacoustic computed tomography. IEEE Transactions on Medical Imaging, 2021. 41(3): p. 727-736. [CrossRef]
- Wu, C. , et al., Blood Oxygenation Quantification in Multispectral Photoacoustic Tomography Using A Convex Cone Approach. IEEE Trans Med Imaging, 2025. Pp. [CrossRef]
- Mitra, M. , et al., Multiwavelength laser diode based portable photoacoustic and ultrasound imaging system for point of care applications. J Biophotonics, 2024. 17(7): p. e202400058. [CrossRef]
- Yu, Y. , et al., Simultaneous photoacoustic and ultrasound imaging: A review. Ultrasonics, 2024. 139: p. 107277. [CrossRef]
- Karlas, A. , et al., Cardiovascular optoacoustics: From mice to men–A review. Photoacoustics, 2019. 14: p. 19-30. [CrossRef]
- Karlas, A. , et al., Flow-mediated dilatation test using optoacoustic imaging: a proof-of-concept. Biomedical Optics Express, 2017. 8(7): p. 3395-3403. [CrossRef]
- Lin, L. , et al., Non-invasive photoacoustic computed tomography of rat heart anatomy and function. Light Sci Appl, 2023. 12(1): p. 12. [CrossRef]
- Paltauf, G. , Photoacoustic tomography reveals structural and functional cardiac images of animal models. Light Sci Appl, 2023. 12(1): p. 42. [CrossRef]
Figure 1.
PAM-based monitoring of arterial pulsation and oxygen saturation in a human finger (re-produced with permission from [20]). Cross-sectional PA image of finger at two status, systole (A) and diastole (B). Axial displacement of the finger vessel (C) and its corresponding frequency spectrum (D).
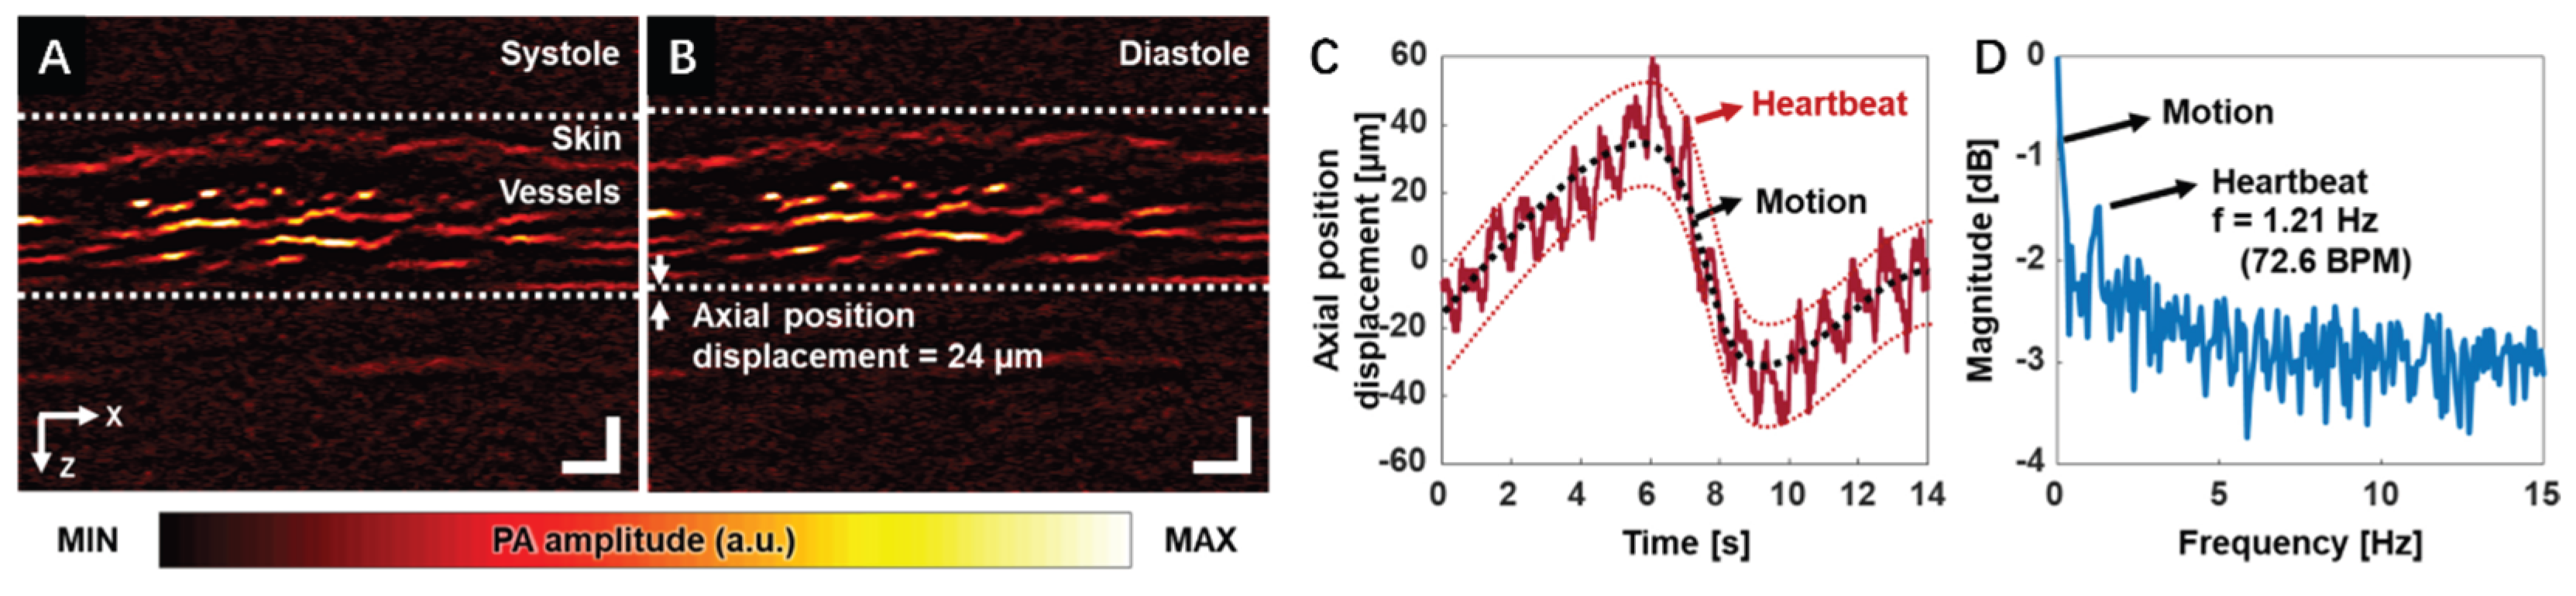
Figure 2.
Acquisition of Pulsatile Signals from PAM B-mode Imaging and PPG (re-produced with permission from [22]). (a) Cross-sectional PA B-mode image of a human finger, highlighting five blood vessels (yellow arrows) tracked for averaged movement quantification. (b) Time-dependent vascular displacement (PAM) and PPG signal variations. (c, d) Frequency spectra of (b), showing a dominant peak at 1.35 Hz. (e) Heart rate comparison between vascular movement (PAM) and blood volume changes (PPG) across three healthy volunteers (three trials each). (f, g) Vascular dynamics (PAM) and PPG signals under normal and brachial cuff-induced conditions. (h, i) Corresponding frequency responses of (f) and (g).
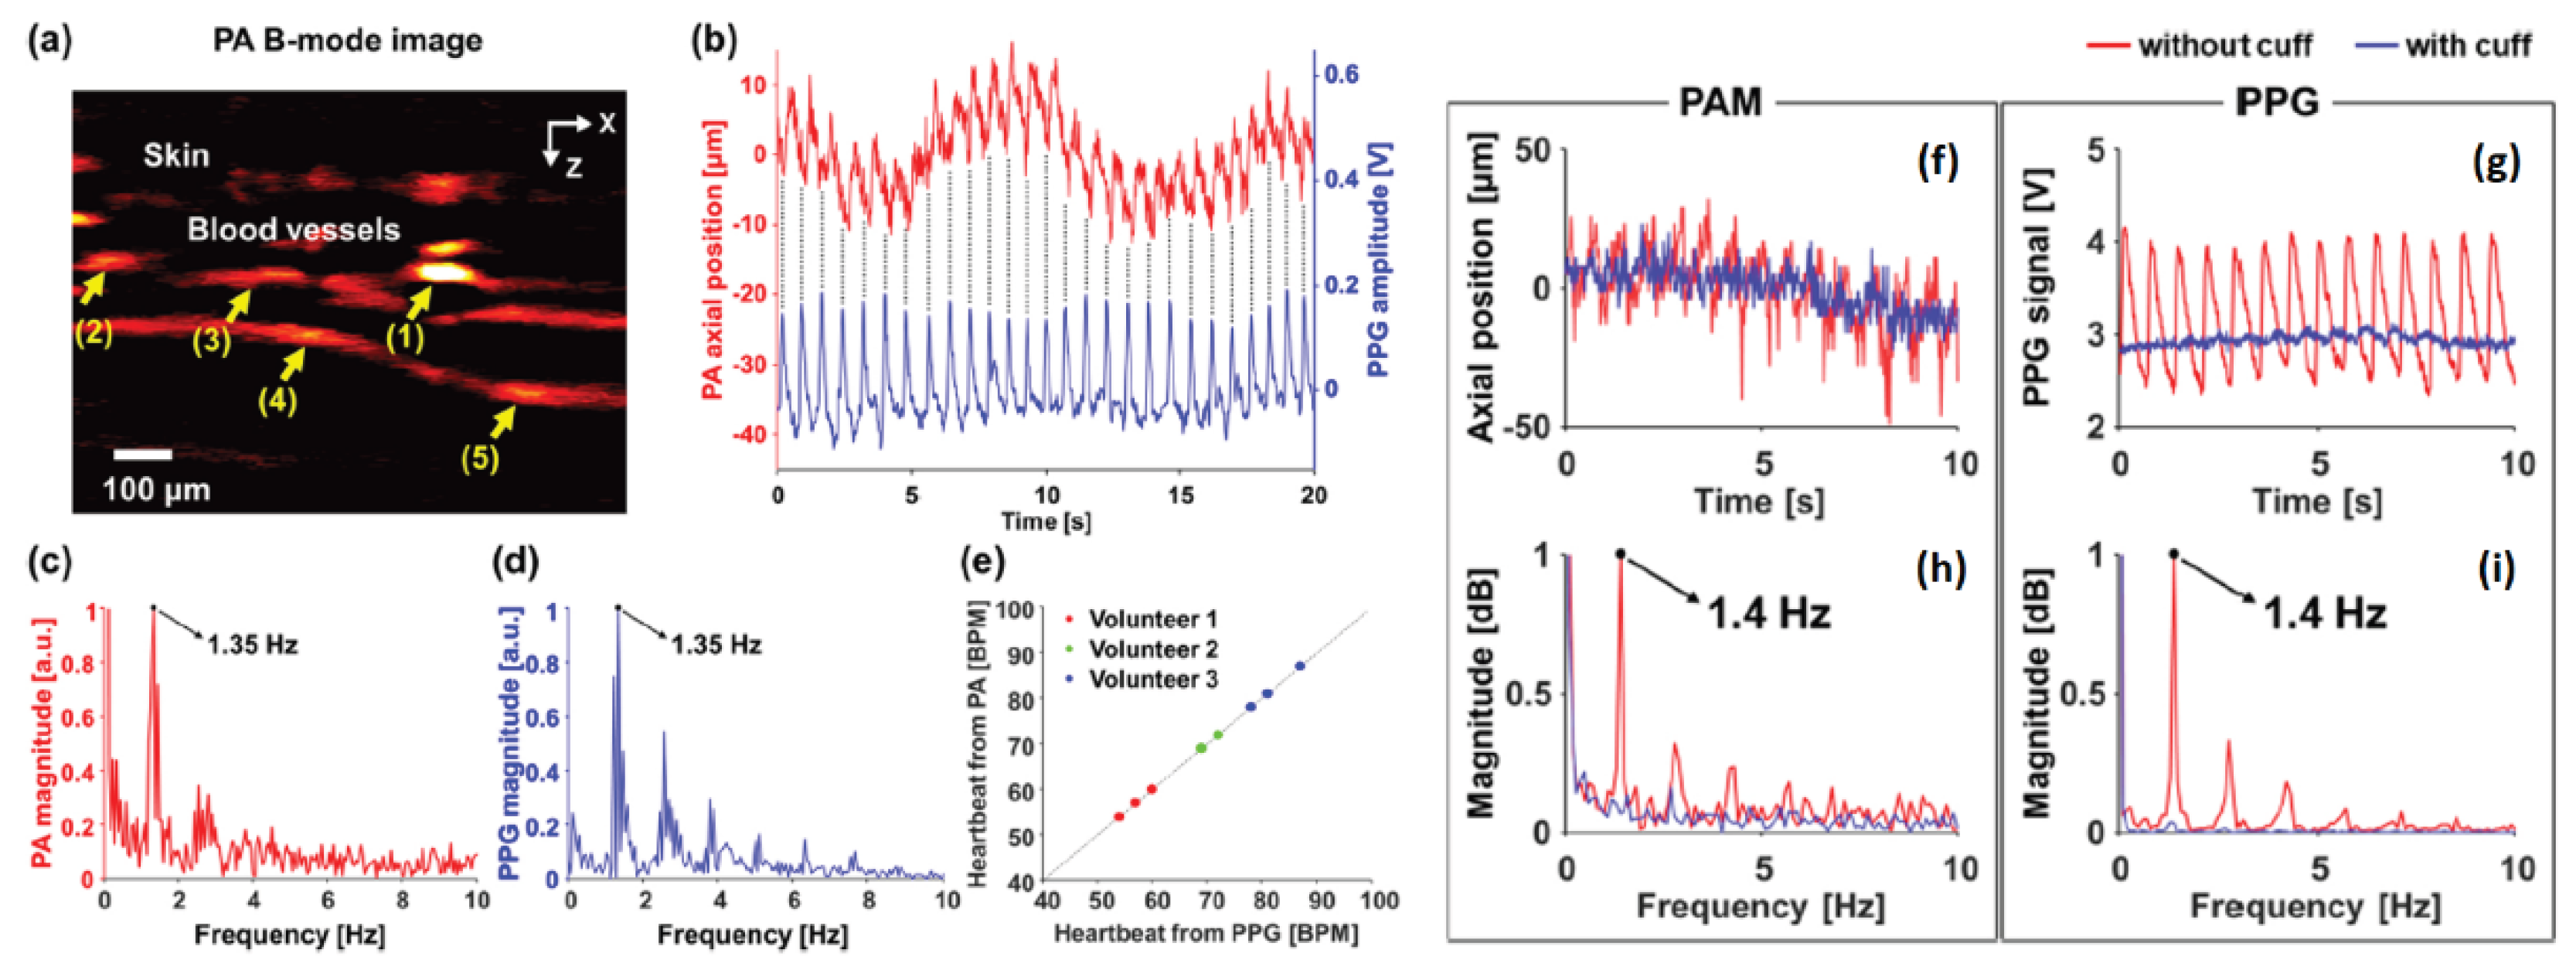
Figure 3.
Dynamic PAM amplitude and sO2 variations in a selected artery of the cortical vasculature in a cat (re-produced with permission from [23]).(A) PA signal amplitude of the artery at 570 nm and 578 nm acquired over 10 seconds duration. (B) Averaged PA amplitude at 570 nm and 578 nm, with signal alignment performed at amplitude valleys. (C) Pulsatile sO2 measurements across successive cardiac cycles.
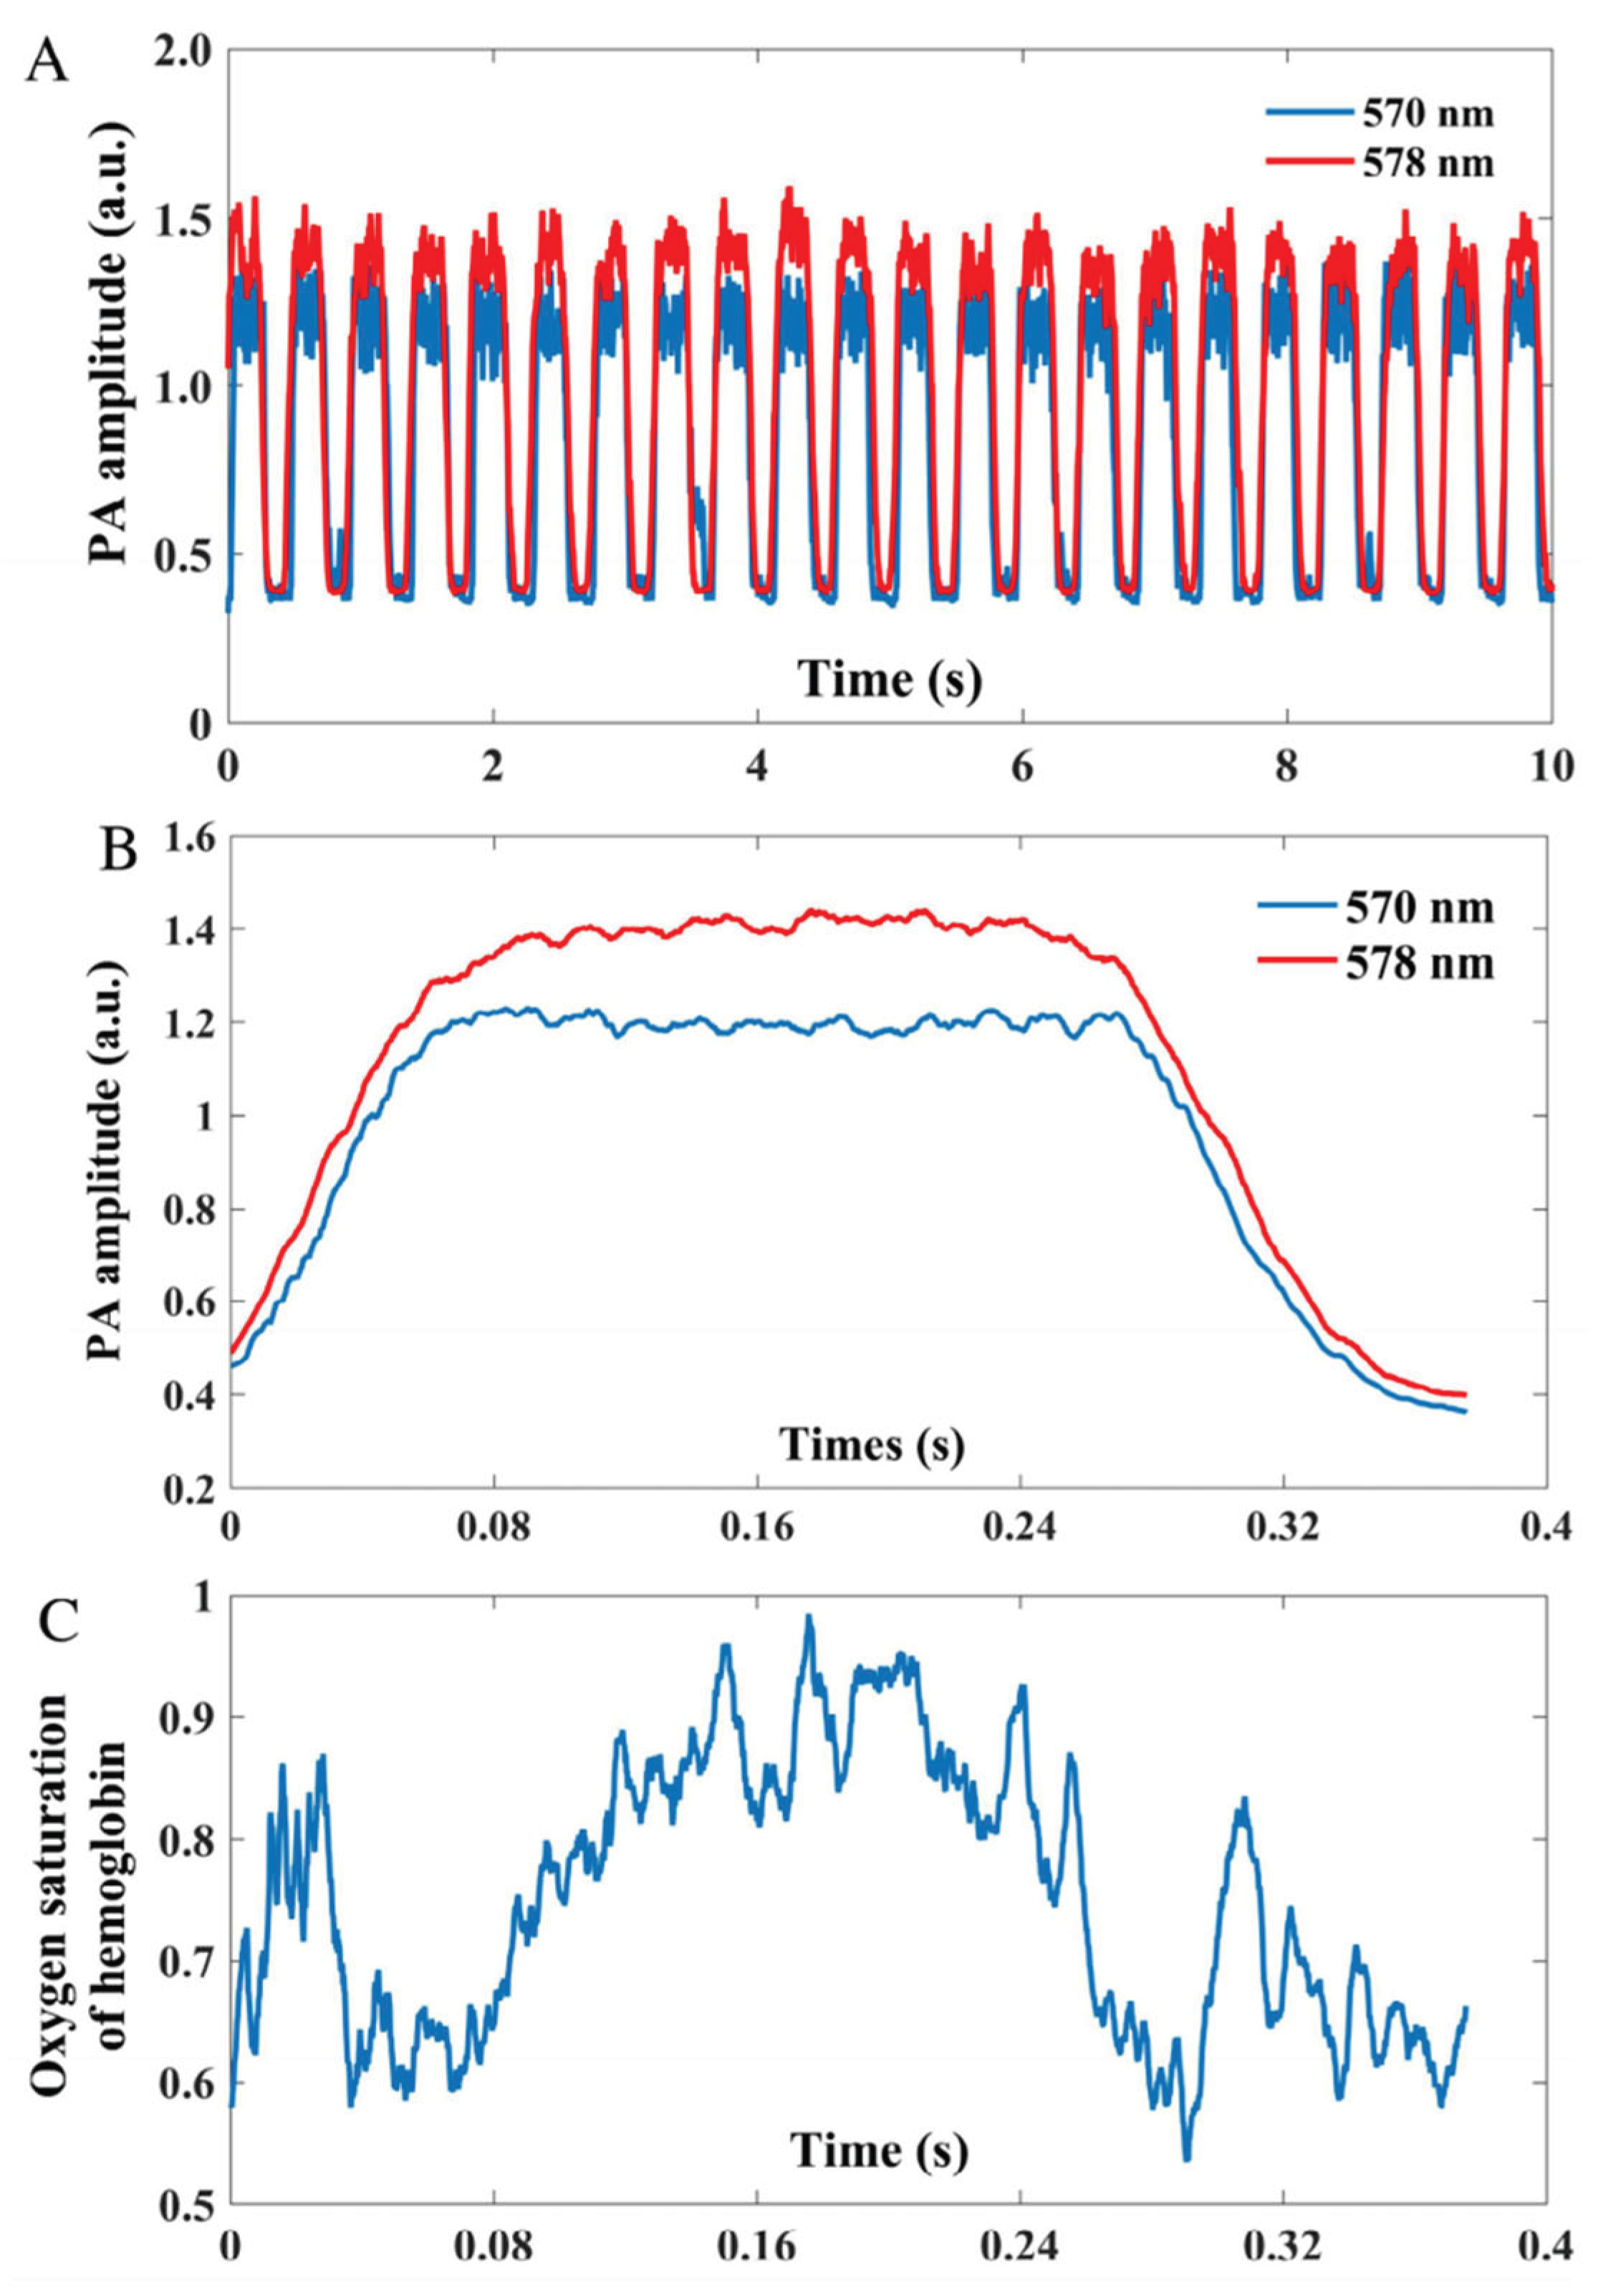
Figure 4.
PAM-based quantification of hemodynamic responses in arteries and veins in response to cardiac pulsation (re-produced with permission from [25]). (a) Arterial flow velocity (top) and synchronized ECG (bottom). (b) Venous flow velocity (top) and synchronized ECG (bottom). (c) Normalized power spectra of arterial flow (top) and ECG (bottom) from (a). (d) Normalized power spectra of venous flow (top) and ECG (bottom) from (b). (e) Pulse wave velocity (PWV) as a function of vessel diameter across ten vascular segments.
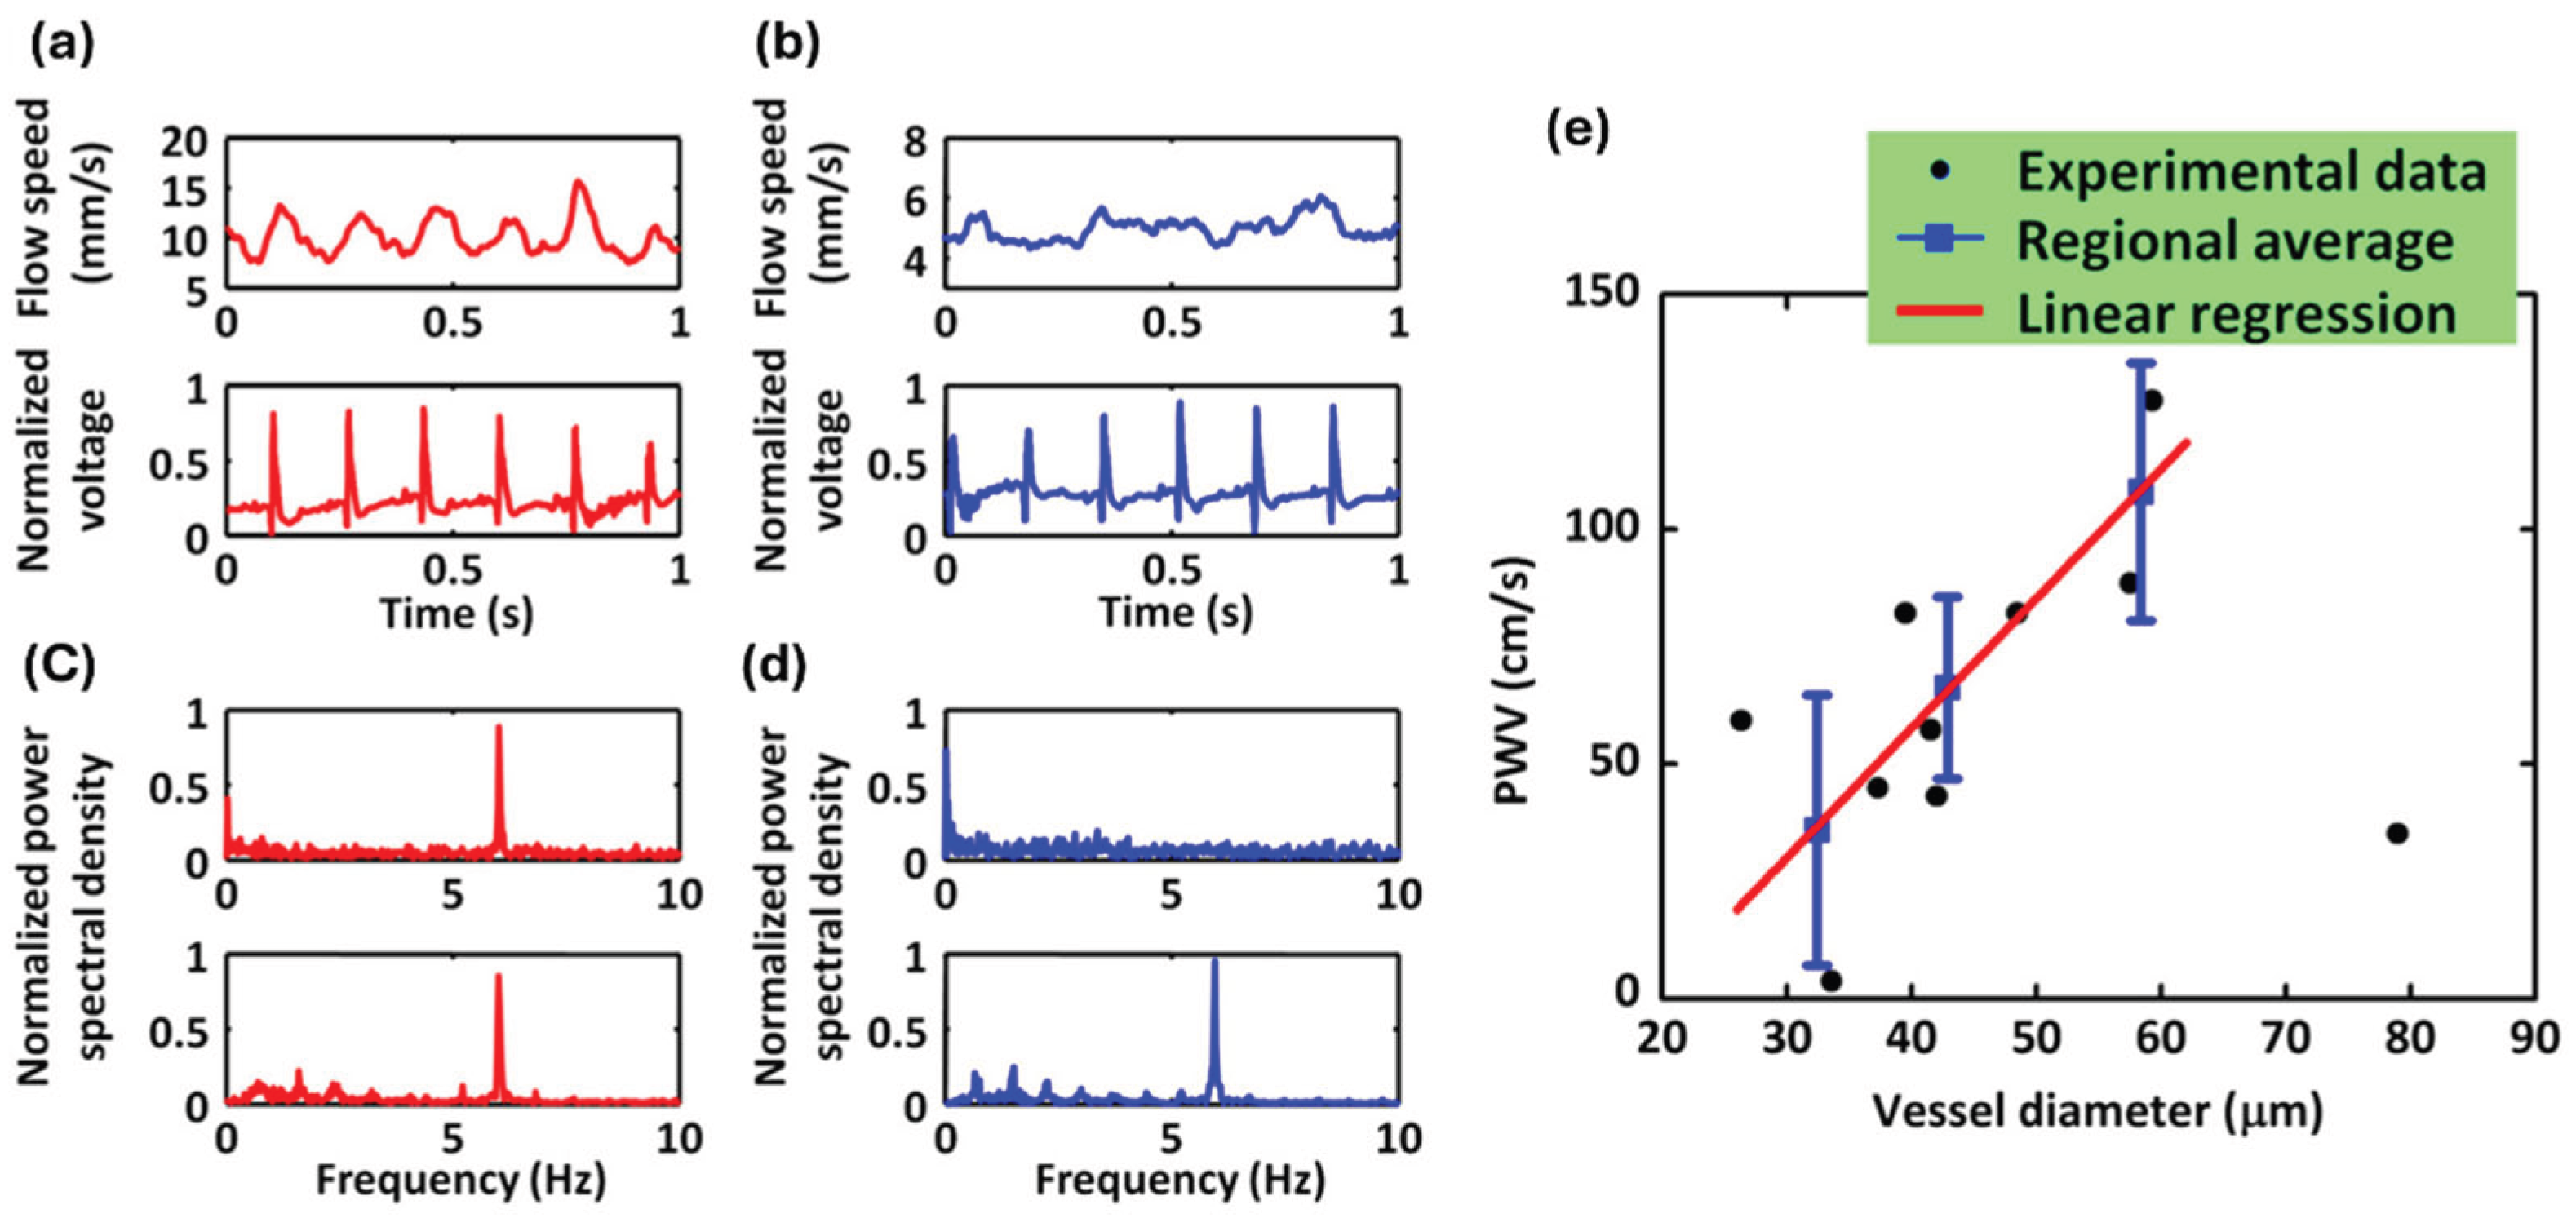
Figure 5.
Time-resolved signal profiles from a selected voxel in the PACT image (re-produced with permission from [26]).
Figure 5.
Time-resolved signal profiles from a selected voxel in the PACT image (re-produced with permission from [26]).
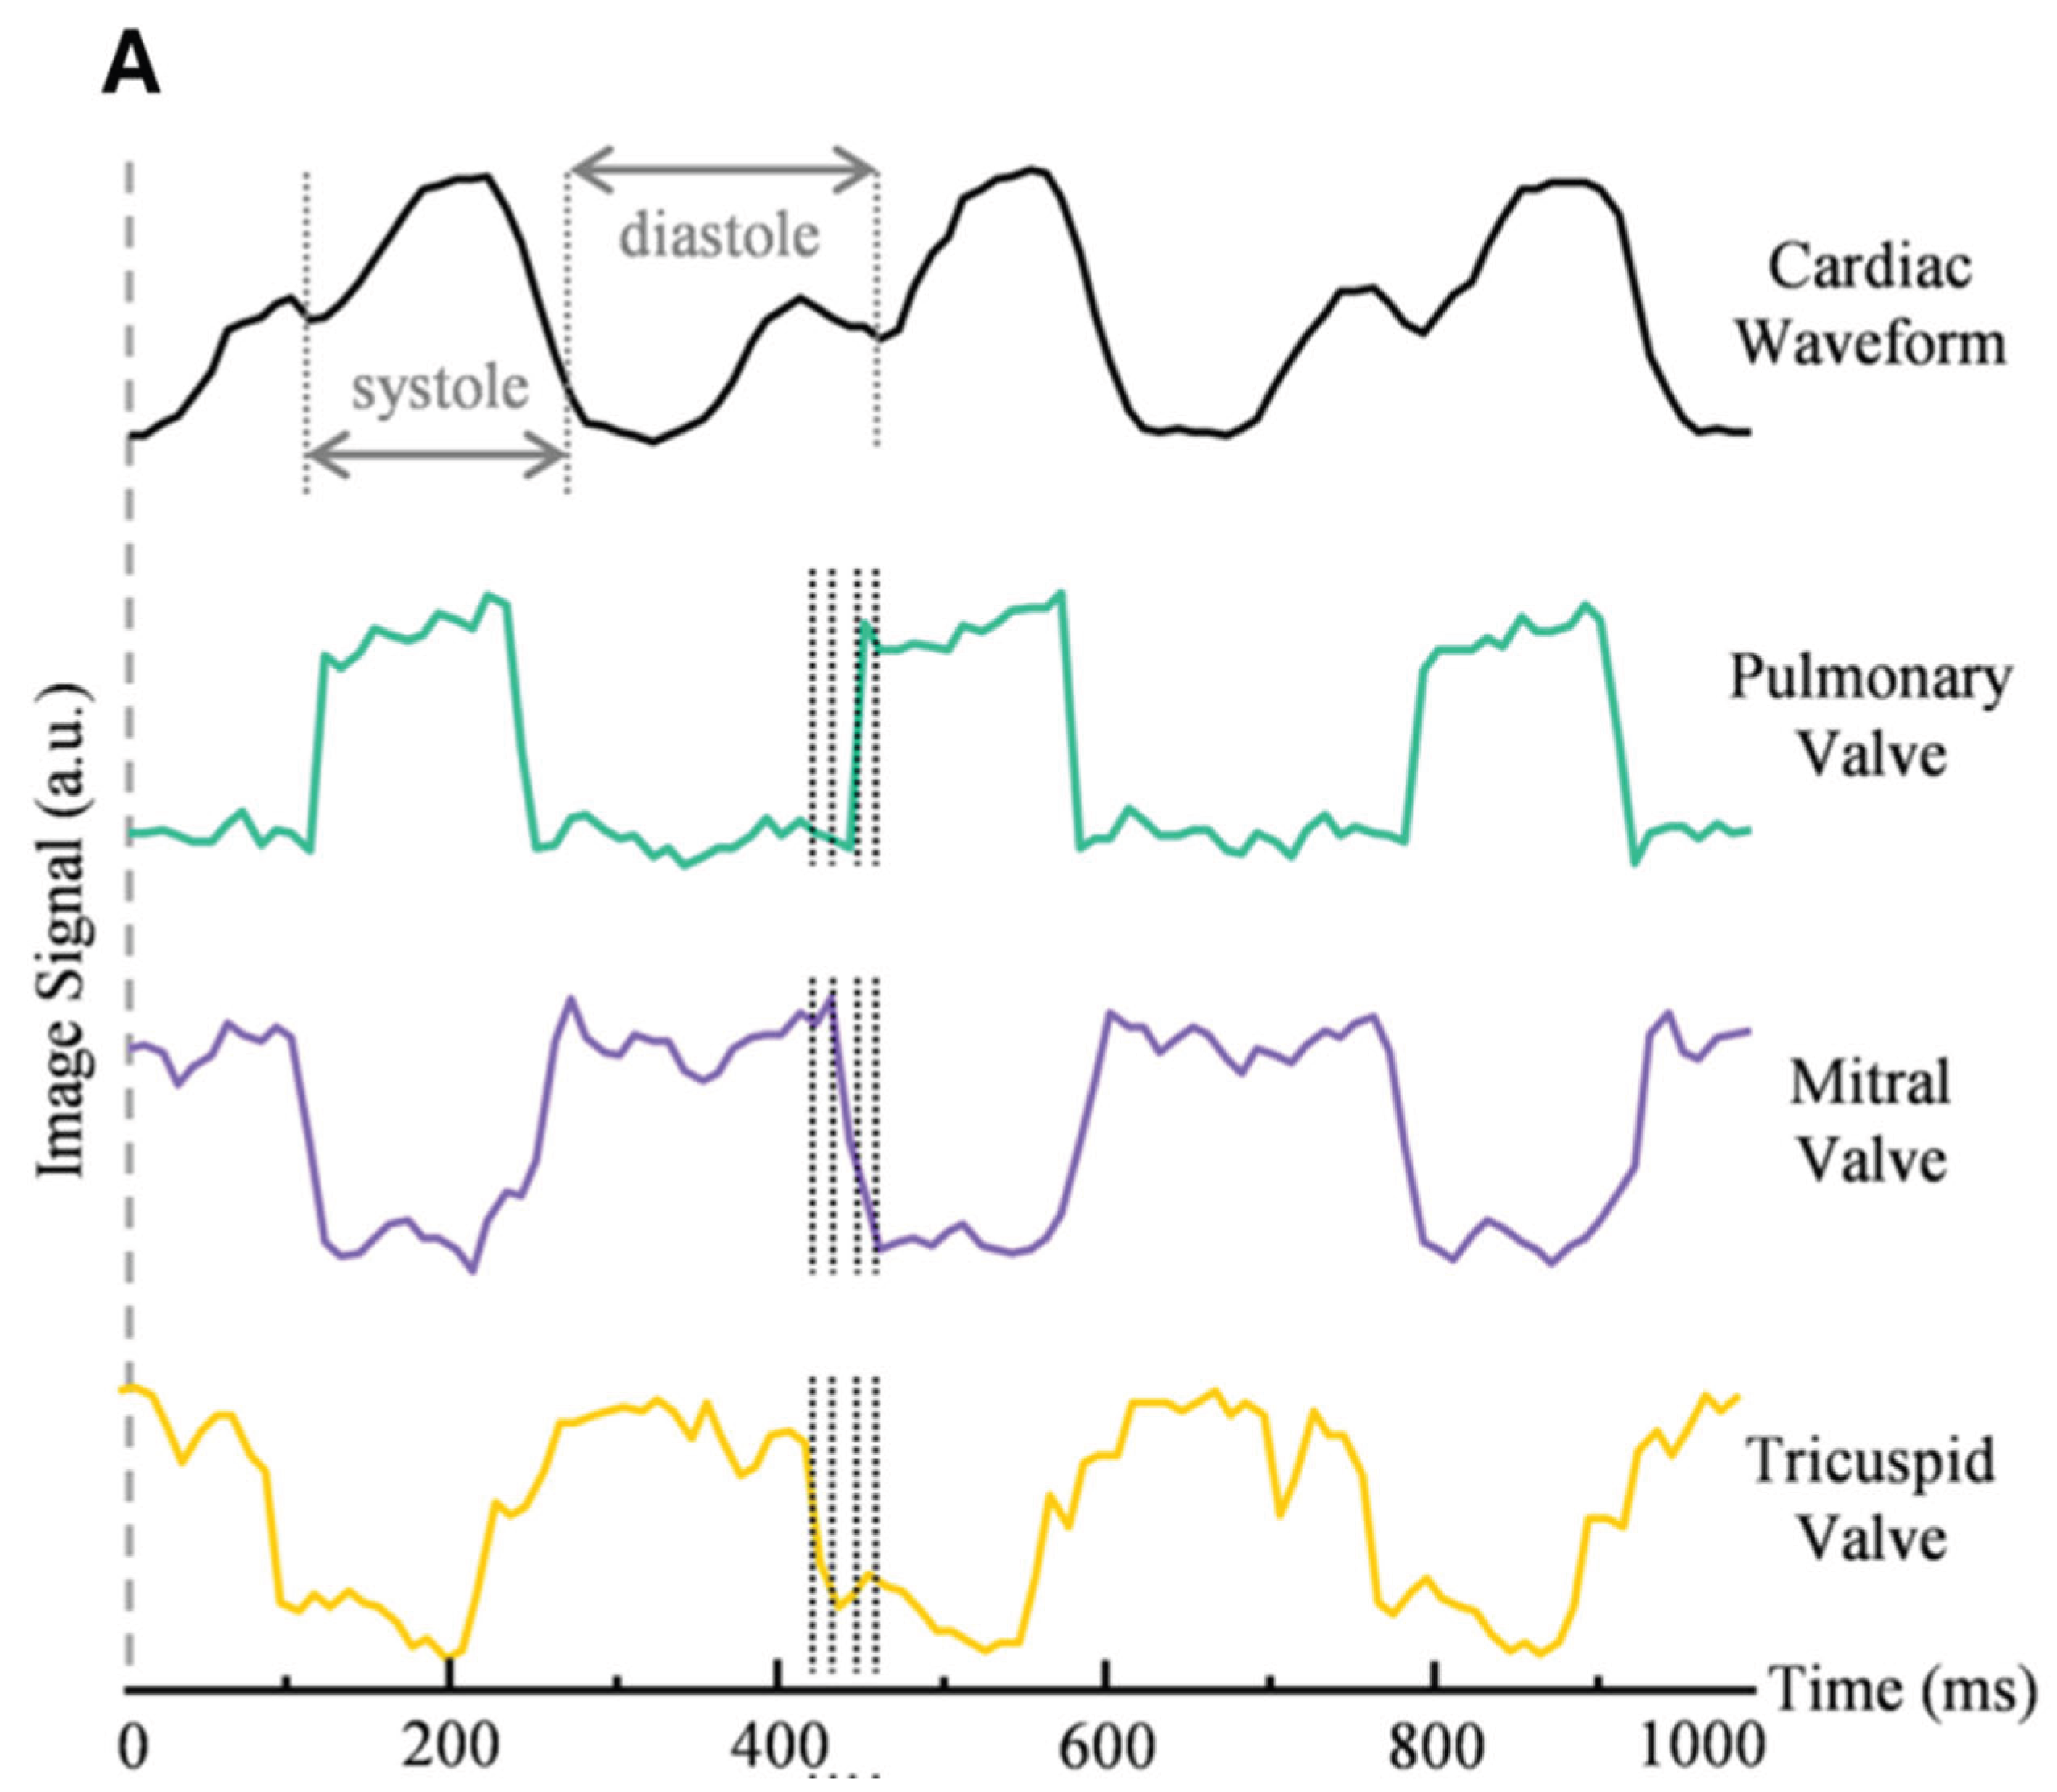
Figure 6.
Dynamic in vivo photoacoustic and ultrasound imaging using a PACT system (re-produced with permission from [21]). (A) Volumetric photoacoustic image of a human hand, with dashed line indicating the cross-section for real-time B-scan imaging. (B) B-scan image corresponding to the horizontal dashed line in (A), showing skin surface (SK). (C) M-mode image along vertical line a in (B), demonstrating time-resolved arterial pulsation. (D) M-mode image along vertical line b in (B), showing venous dynamics. (E) Corresponding ultrasound images of arterial pulsation.
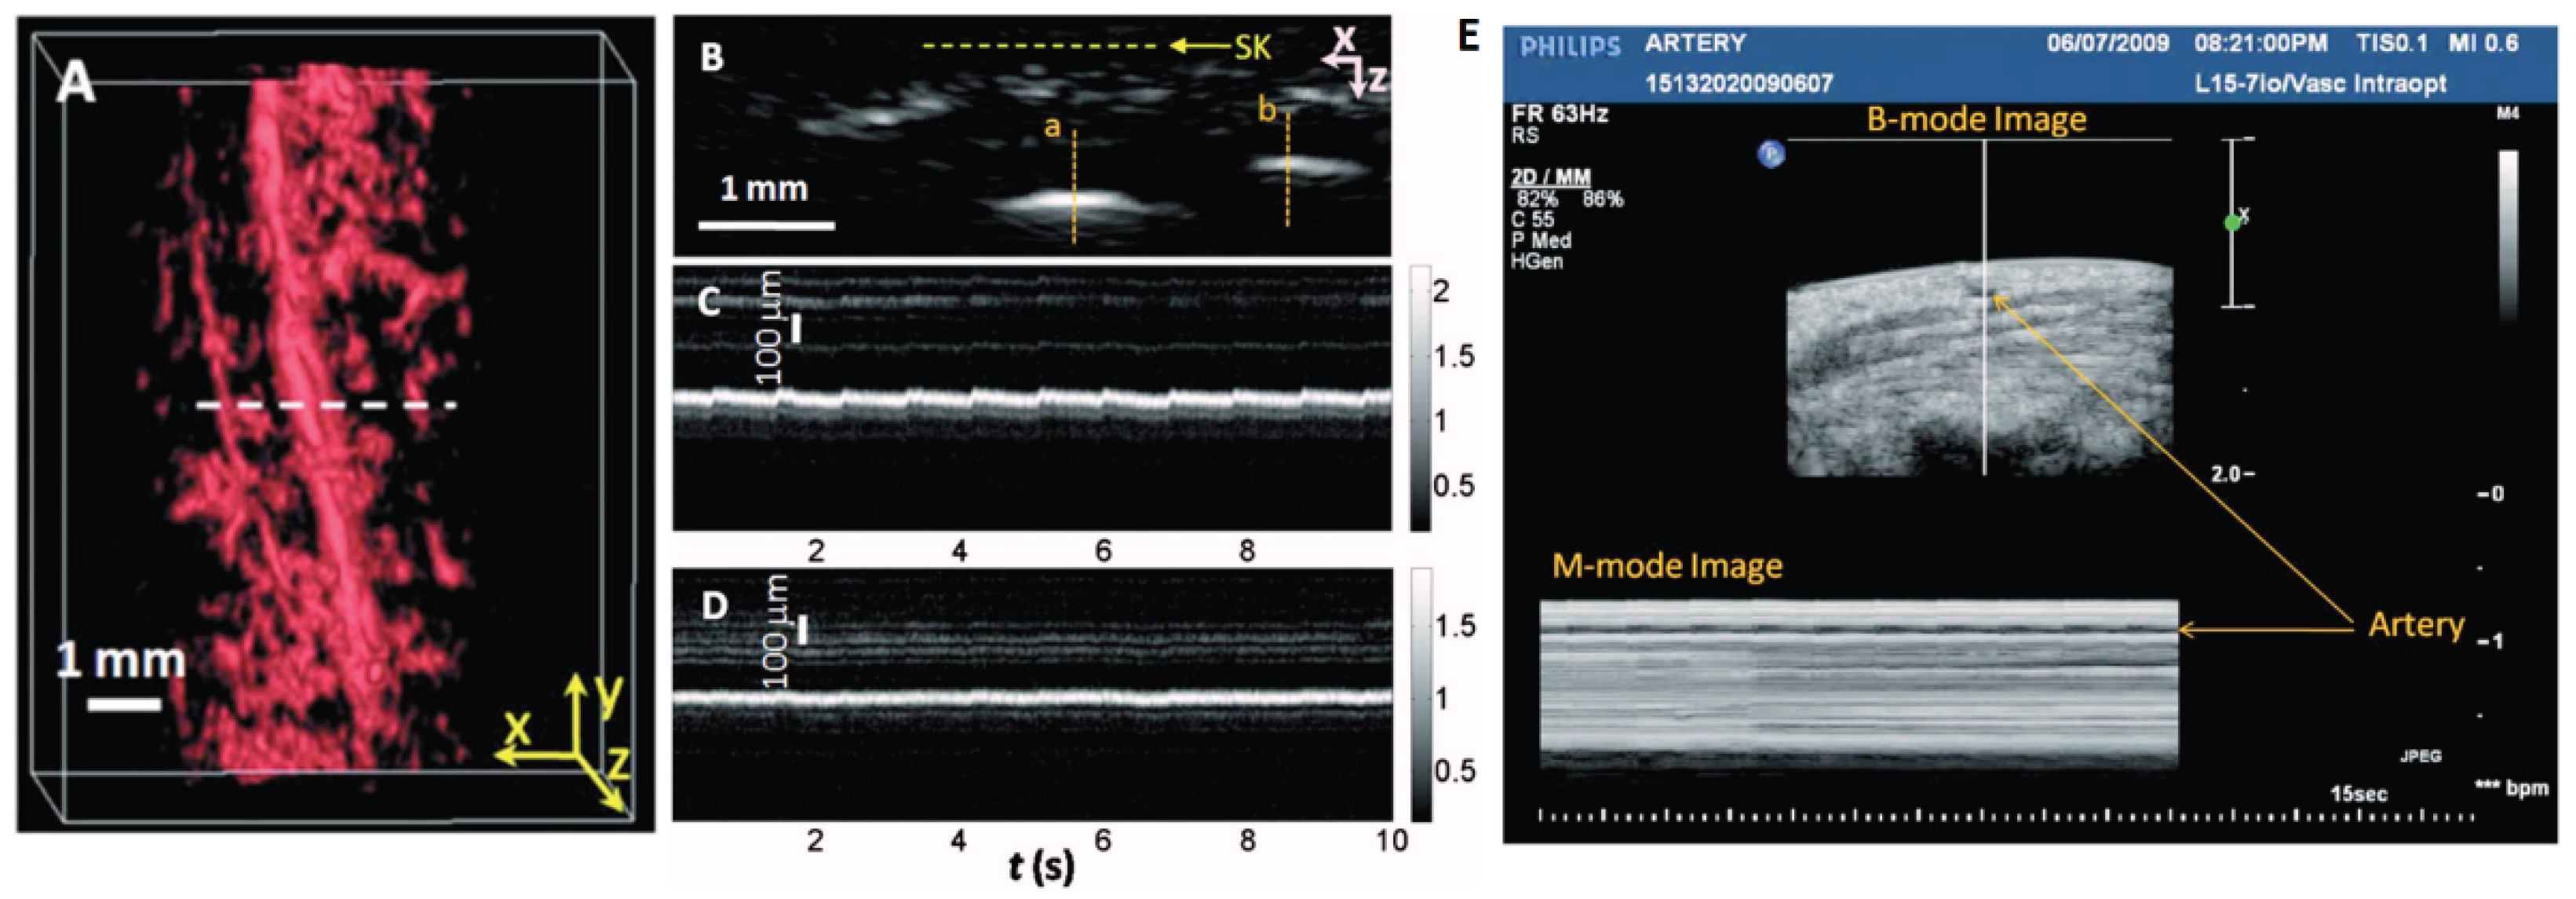
Figure 7.
Pulsatile mapping in a PACT-based breast imaging system (re-produced with permission from [27]). (a) Heartbeat-encoded vascular mapping of a breast cross-section (arteries: red; veins: blue). (b) Time-domain amplitude variations at two selected pixels (yellow and green markers in panel a). (c) Frequency spectrum of pixel-value fluctuations from (b), showing arterial pulsation at ~1.2 Hz (heart rate).
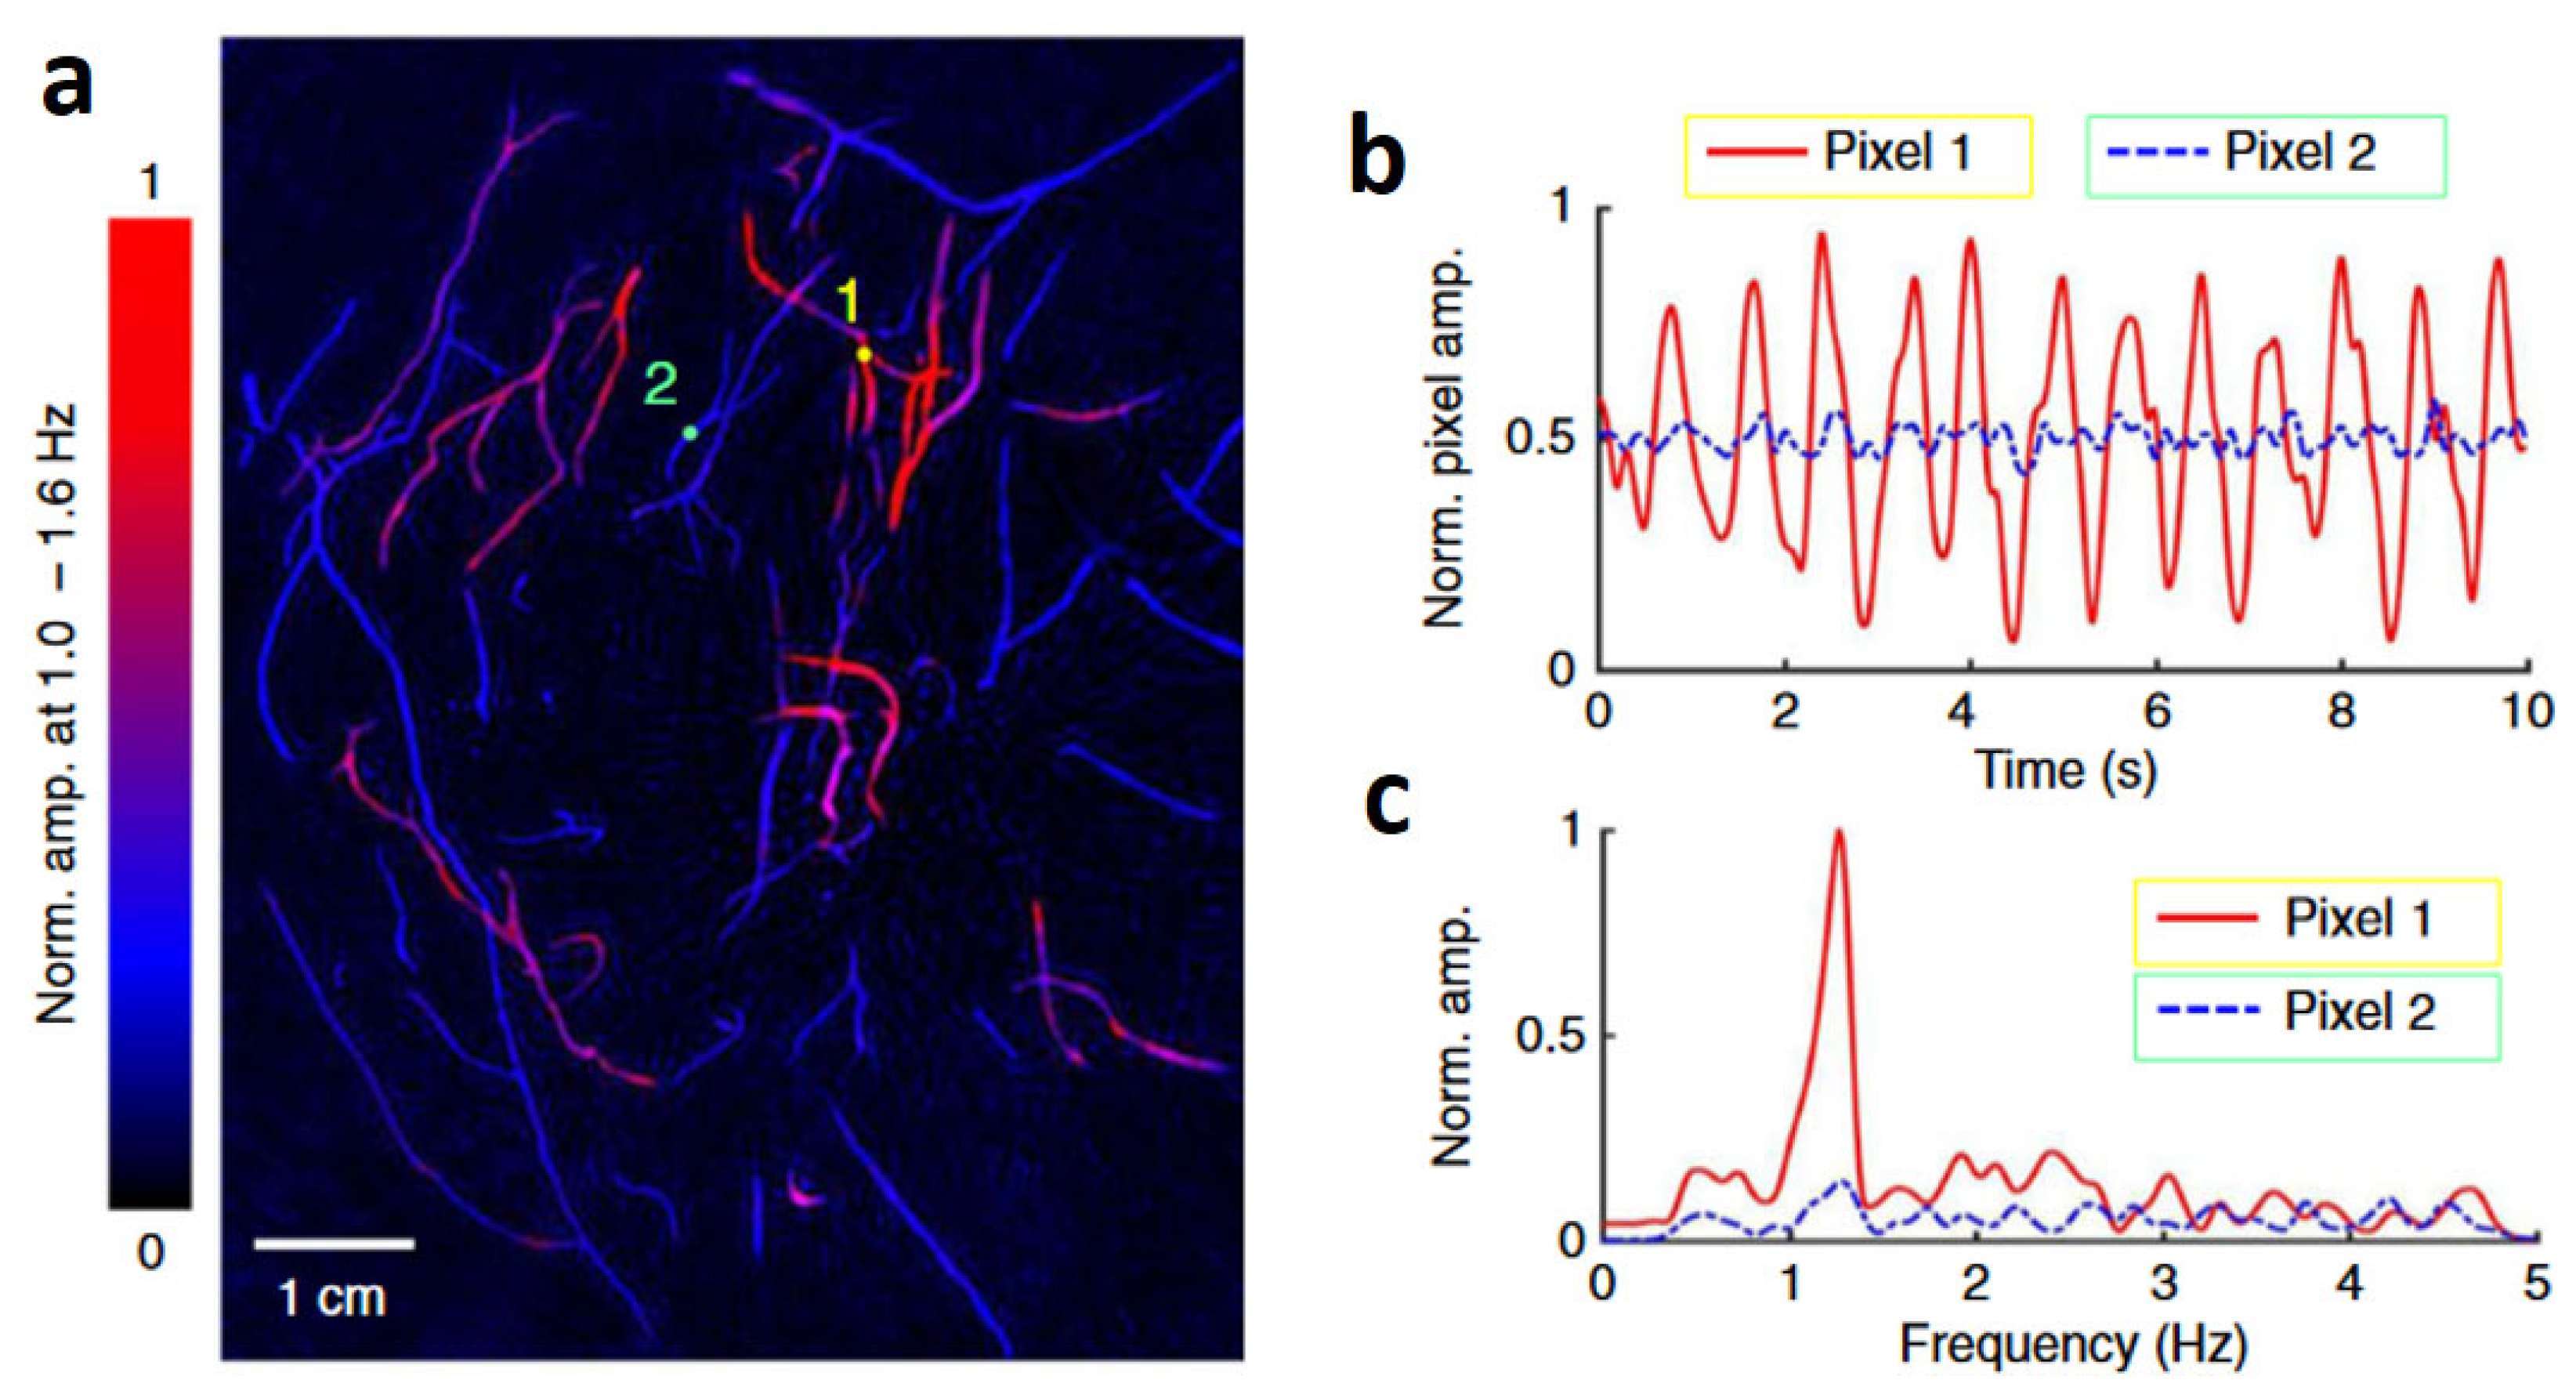
Figure 8.
Dual-modal harmonic US and PACT imaging of mouse and human vasculature (re-produced with permission from [28]). (a) Co-registered harmonic US/PA cross-sectional image of liver. (b) Time-series PA images of thoracic aorta through one cardiac cycle. (c) Aortic displacement along vertical line in (a) with peak amplitudes (blue line). (d) Frequency spectrum of (c) showing fundamental and second-harmonic components. (e) PA amplitude dynamics of tracked aorta in (b). (f) Frequency spectrum of (e) revealing fundamental to third-harmonic frequencies. (g) Photograph of measurement site. (h) Co-registered US/PA image identifying a 6.48-mm deep artery. (i) Frequency spectrum of arterial signal showing cardiac harmonics. (j) Temporal displacement profile (blue line) along marked vessel in (h). (k) Heartbeat-encoded (1.45 Hz) pseudo-color PA map. (l) Composite US with segmented PA arterial image.
Disclaimer/Publisher’s Note: The statements, opinions and data contained in all publications are solely those of the individual author(s) and contributor(s) and not of MDPI and/or the editor(s). MDPI and/or the editor(s) disclaim responsibility for any injury to people or property resulting from any ideas, methods, instructions or products referred to in the content. |
© 2025 by the authors. Licensee MDPI, Basel, Switzerland. This article is an open access article distributed under the terms and conditions of the Creative Commons Attribution (CC BY) license (http://creativecommons.org/licenses/by/4.0/).
Copyright: This open access article is published under a Creative Commons CC BY 4.0 license, which permit the free download, distribution, and reuse, provided that the author and preprint are cited in any reuse.


