
Submitted:
18 July 2025
Posted:
21 July 2025
You are already at the latest version
Abstract
Background/Objectives: The advent of kinase inhibitors (TKI), therapeutic antibodies and inducers of apoptosis has revolutionized cancer treatment, yet their application in pediatric tumors, particularly medulloblastoma, remains understudied. Understanding the expression of these targets in specific genetic subgroups could unveil potential repositioning opportunities for already approved drugs. Methods: We analyzed RNA-sequencing data from the R2 Genomics Analysis and Visualization Platform (N = 763 patients, multiple cohorts) and the TCGA database (six individual cohorts 828 patients) to assess the expression of 73 potential targets of TKIs and antibodies targeting immune checkpoint inhibitors (ICI) or membrane receptors and inducers of apoptosis. These treatments, FDA-approved or in phase II clinical trials for solid or hematologic cancers, and their targets were evaluated in both non-metastatic and metastatic patients when data was available. Additionally, we examined treatments tailored to mutated targets crucial for tumorigenesis or resistance to conventional therapies. Results: Overexpression of certain targets beyond predefined cutoff values in Kaplan-Meier analyses correlated with either prolonged or shortened overall survival. Targets associated with shorter survival suggested potentially relevant treatments, thereby highlighting the importance of defining specific treatments for distinct genetic subgroups. Notably, certain immune checkpoint inhibitors showed relevance for specific subgroups but detriment for others. As a positive control, our analysis confirmed the use of axitinib, an anti-angiogenic treatment, as demonstrated by our recent publication. Surprisingly, a treatment developed for hematological tumors, venetoclax, demonstrated potential efficacy in medulloblastoma. Conclusions: Medulloblastoma displays subtype-specific expressions of FDA-approved TKI, ICI and pro-apoptotic drug targets, impacting overall survival. Clinical trials investigating these approved treatments in medulloblastoma are therefore warranted.
Keywords:
Medulloblastoma
; kinase inhibitors
; immune check point inhibitors
; mutations
; non-metastatic/metastatic tumors
; BCL2
; Venetoclax
1. Introduction
Medulloblastoma patients undergo highly intensive treatments involving surgery, radiotherapy (for patients above 3 years old), and intensive multimodal chemotherapies. However, such aggressive treatments pose significant risks for young patients during critical growth periods. Consequently, there is a pressing need to explore strategies for de-escalating treatment intensities without compromising efficacy or exacerbating side effects. Targeted, less toxic therapies are imperative to enhance cure rates, manage relapses, and mitigate the adverse effects associated with current intensive regimens.
Over the past 15 years, considerable advancements have been made in cancer treatments across various types. Yet, the challenge persists in developing innovative therapies, often constrained by logistical hurdles and financial constraints. Herein lies an opportunity to reposition existing treatments through a molecular pathology approach, leveraging the analysis of specific mutation expressions in newly diagnosed patients or those experiencing relapses. By harnessing available data from public databases, we can tailor treatments to specific genetic subgroups of medulloblastoma, thus creating a customized treatment landscape.
This inclusive genetic approach allows us to construct a comprehensive performance profile for existing treatments. Surprisingly, treatments approved for hematological cancers show promise in medulloblastoma, suggesting potential avenues for repurposing therapies. By adopting this streamlined methodology, we uncover compelling opportunities for treatments to undergo evaluation in early-phase clinical trials, paving the way for meaningful advancements in medulloblastoma management.
Medulloblastoma ranks as the second most prevalent solid pediatric tumor. Pediatric medulloblastoma is composed of several molecular subgroups: Wingless (WNT), Sonic Hedgehog (SHH), Group 3 and Group 4. Groups WNT and SHH are characterized by abnormal activation of the corresponding signal transduction. Group 3 and Group 4 show overexpression of N- and c-Myc, inactivation of p53 and deleterious chromosomal abnormalities [1]. Patients undergo rigorous treatments comprising surgery, radiotherapy (administered to patients above 3 years old), and chemotherapy regimens incorporating agents like etoposide, carboplatin, and vincristine. While these intensive interventions yield a 70% long-term remission rate, most patients suffer from the severe side effects of these treatments [2,3] and approximately 30% of cases experience relapse, with fatal outcomes being commonplace. Therefore, physicians face two paramount challenges in managing medulloblastoma: 1) Reducing Treatment Intensity: The primary objective is to mitigate the high detrimental side effects associated with intensive therapies, which can encompass mobility issues, cognitive impairments, language deficits, and motor function limitations. This reduction must be achieved without compromising treatment efficacy; 2) Identifying Relevant Therapies for Relapse: Another critical goal is to propose effective treatments in instances of relapse, with the aim of extending survival and potentially achieving a second long-term remission. Addressing these challenges demands a delicate balance between treatment effectiveness and the minimization of adverse effects, underscoring the importance of tailored therapeutic strategies in the management of medulloblastoma.
Despite advancements in treatment strategies, the development of new therapies for pediatric cancers remains challenging, largely due to historical underinvestment by the pharmaceutical industry. Treatment repositioning represents a promising alternative, leveraging the efficacy of several targeted therapies that have been successfully utilized for decades in adult cancers sharing similar mechanisms of tumor aggressiveness with medulloblastomas. For instance, reverse genetic analysis conducted by Coy et al. [4] demonstrated the potential application of antibody-drug conjugates for pediatric brain tumors.
Given the hyper vascularized nature of medulloblastomas and considering that increased angiogenesis is associated with the most aggressive medulloblastomas [5]. We, along with German collaborators, have highlighted the utility of Axitinib, a tyrosine kinase inhibitor initially approved for metastatic kidney cancer [6] or combined with immune checkpoint inhibitors. Axitinib has shown promise both as a monotherapy and in combination with immune checkpoint inhibitors for kidney cancers [7] but also for treating medulloblastomas [8,9]. This approach has led to the initiation of the clinical trial Mependax (NCT06485908), which is currently enrolling patients with relapsed medulloblastoma and ependymoma, building upon encouraging findings in six children treated with Axitinib and metronomic etoposide [10].
To identify additional therapeutic candidates, we implemented a systematic approach. First, we cataloged available targeted therapies, including older and next-generation agents, alongside their molecular targets. Utilizing publicly accessible datasets via the R2 platform https://hgserver1.amc.nl/cgi-bin/r2/main.cgi?open_page=login and the TCGA database through cBioportal https://www.cbioportal.org/, we analyzed the expression of target genes and their correlation with survival outcomes. Specific activating mutations in target genes were also evaluated, given that many therapies are indicated only for tumors harboring such mutations.
This strategy identified several unexpected candidates for repositioning in medulloblastoma, including therapies traditionally used for hematological malignancies. The validity of our approach was supported by the identification of Axitinib [8] and HER2 inhibitors [4,11], as relevant treatment options. Furthermore, we demonstrated the potential of Venetoclax, typically used in hematological tumors, as a promising therapeutic candidate for medulloblastoma.
2. Materials and Methods
2.1. Expression and Mutation Profiling
Gene expression levels and survival correlations using the Kaplan Meier method were analyzed using the R2 Genomics Analysis and Visualization Platform (https://hgserver1.amc.nl/cgi-bin/r2/main.cgi?open_page=login) and the cBioportal platform (https://www.cbioportal.org). For the R2 platform, medulloblastoma datasets included the following:
GSE85217 (Cavalli, [12])
GSE67851 (Hsieh, TH [13])
GSE37418 (Gilbertson, RJ [14])
GSE74195 (den Boer, M [15])
GSE10327 (Kool, M [16])
GSE49243 (Pfister 2, [17])
GSE12992 (Delattre, [18])
GSE3526 (Roth, [19])
Cohort Pfister 1 [20]
For the cBioportal platform, the following data set were analyzed:
Medulloblastoma (PCGP, Nature 2012, [14])
Medulloblastoma (Broad, Nature 2012, [21])
Medulloblastoma (DKFZ, Nature 2017, [20])
Medulloblastoma (ICGC, Nature 2012, [22])
Medulloblastoma (Sickkids, Nature 2016, [23])
These datasets provided robust platforms for exploring gene expression profiles and their association with clinical outcomes.
2.2. Establishment of the List of Targeted Therapies
The compilation of targeted therapies, including kinase inhibitors, immune system modulators, and specific monoclonal antibodies, was carried out using the resources provided by the National College of Medical Pharmacology (https://pharmacomedicale.org) (Table 1). This approach ensured a comprehensive and up-to-date selection of therapeutic agents relevant to the study’s focus.
2.3. Cell Lines
The human medulloblastoma cell lines (ONS76, DAOY, HD-MB03) and the normal microglial cells (HMC3) were purchased from American Type Culture Collection (ATCC). DAOY, ONS76 and HMC3 cells were maintained in MEM alpha (Gibco, Life Technologies Corporation, Loughborough, UK) supplemented with 10% fetal bovine serum (FBS, SIGMA, Burlington, MA, USA). HD-MB03 cells were maintained with RPMI 10% fetal bovine serum (FBS, SIGMA, Burlington, MA, USA). Cells were monitored routinely, and the absence of mycoplasma was verified monthly using the PlasmoTest kit (Invivogen, San Diego, CA, USA).
2.4. Cell Death Assay
Cell viability was assessed using the propidium iodide (PI) exclusion assay. Following treatment, cells were harvested and incubated with PI (10 μg/ml) for 5 minutes. The percentage of PI-positive cells was subsequently analyzed by flow cytometry using a MACSQuant Analyzer (Miltenyi Biotec, catalog number 130-092).
2.5. Immunoblot
Cells were lysed with Laemmli buffer and protein amounts were determined by the Pierce TM BCA Protein Assay Kit (Thermo Fisher). Then, 20 μg of protein were resolved by SDS-PAGE. The proteins were transferred onto PVDF membranes in Tris–glycine buffer. Membranes were blocked with 5% milk at room temperature and then immunoblotted overnight in 3% milk with the anti-BCL2 antibody (Cell signaling Technology #2872). Membranes were washed with PBS–Tween 0.1% and incubated with HRP-conjugated secondary antibodies at room temperature for 1 h. The Advansta Western Bright Quantum HRP substrate was used as a detection reagent.
3. Results
3.1. Identifying Medulloblastoma Patients Eligible for Targeted Therapies
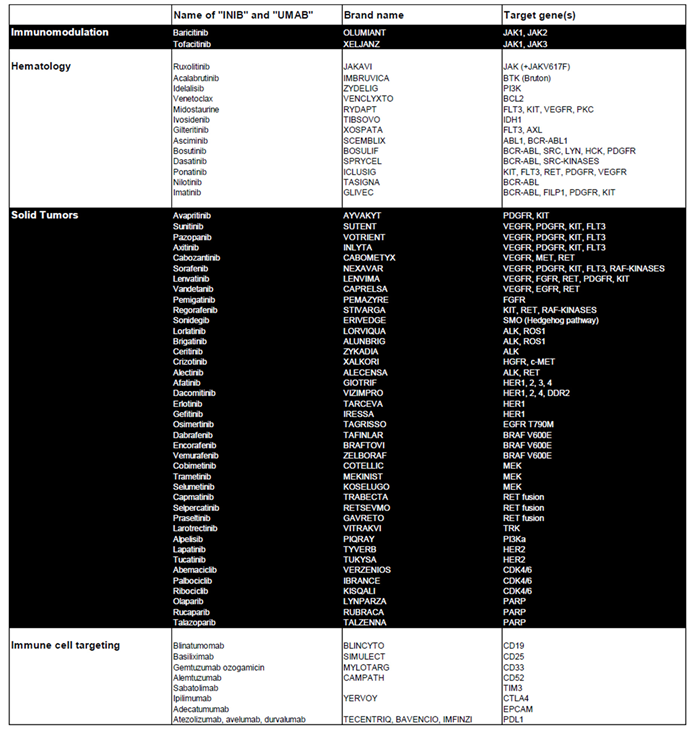
Table 1 highlights kinase and apoptosis inhibitors that target specific genes in tumor cells and are used in the treatment of both hematological and solid tumors. It also includes immunological modulators that act on specific targets expressed by transformed immune cells or on pathways involved in immune tolerance. Our aim was to explore the potential of repositioning these clinically validated therapies for the treatment of pediatric medulloblastoma.
To validate their relevance, we analyzed the relationship between these genes and overall patient survival (OS) using the Cavalli et al. cohort, the only publicly available dataset with survival data [12]. For each gene associated with a targeted therapy, Kaplan-Meier survival curves were generated via the R2 platform, employing the optimal cutoff values. Initially, Kaplan-Meier survival curves were generated for each gene, accompanied by their respective raw P-values and Bonferroni-corrected P-values. Approximately 300 curves were produced, which are presented in Supplementary Figure S1. Based on this analysis, Table 2 summarizes the raw and Bonferroni-corrected P-values for each gene across the molecular subgroups of medulloblastoma (WNT, SHH, Group 3, and Group 4).
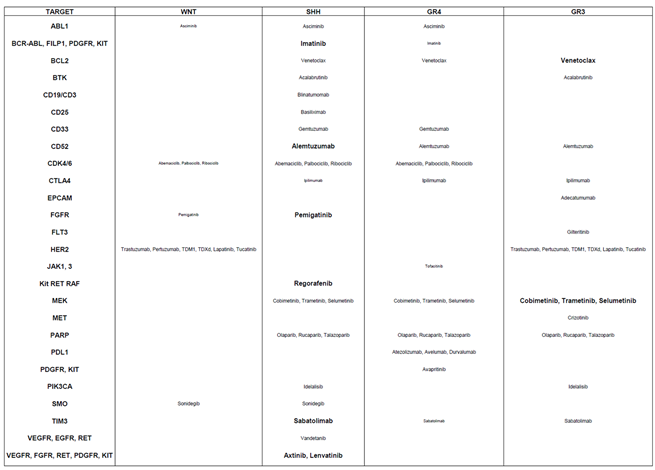
From Table 2, several genes were identified as relevant therapeutic targets due to their overexpression being associated with shorter OS. The corresponding treatments are outlined in Table 3. Genes with statistically significant associations (raw and Bonferroni-corrected P-values < 0.05) were prioritized for potential efficacy of targeted therapy within specific genetic subgroups:
SHH subgroup: Relevant targets included BCR-ABL, FILP1, PDGFR, Kit, CD52, FGFR, RET, RAF, TIM3, and VEGFR, with corresponding treatments Imatinib, Alemtuzumab, Pemigatinib, Regorafenib, Sabatolimab, Axitinib and Lenvatinib.
Group 3 tumors: Key genes identified were BCL2 and MEK2, with potential treatments Venetoclax and MEK inhibitors such as Cobimetinib, Trametinib, or Selumetinib.
WNT subgroup: Targetable genes included ABL1, CDK4/6, FGFR, HER2, and SMO, with suggested therapies such as Asciminib, Abemaciclib, Palbociclib, Ribociclib, Pemigatinib, Trastuzumab, Pertuzumab, T-DM1, T-DXd, Lapatinib, Tucatinib, and Sonidegib.

Table 1.
Overview of Approved Targeted Therapies for Solid and Hematologic Tumors. This table provides a detailed summary of targeted therapies currently approved for the treatment of solid and hematologic tumors. It includes the associated pathologies, the generic names of the treatments, their corresponding brand names, and the specific genes they target.
 |
Group 4 tumors: Although no targets were highly statistically significant, several potential candidates were identified, including ABL1 (Asciminib), BCR-ABL, FILP1, PDGFR, Kit (Imatinib), BCL2 (Venetoclax), CD33 (Gemtuzumab), CD52 (Alemtuzumab), CDK4/6 (Abemaciclib, Palbociclib, Ribociclib), CTLA4 (Ipilimumab), JAK1/3 (Tofacitinib), MEK (Cobimetinib, Trametinib, Selumetinib), PARP (Olaparib, Rucaparib, Talazoparib), PDL1 (Atezolizumab, Avelumab, Durvalumab), PDGFR/KIT (Avapritinib), and TIM3 (Sabatolimab).
This classification provides a framework for repositioning specific drugs to treat pediatric medulloblastoma, offering novel therapeutic opportunities tailored to the genetic profiles of the tumor subgroups.
Table 2.
Association Between Targeted Genes and Patient Survival Across Medulloblastoma Subgroups. This table illustrates the relationship between genes targeted by the therapies listed in Table 1 and overall survival (OS) across various genetic subgroups of medulloblastoma. The analyzed genes or gene families are displayed alongside their respective P-values, calculated using the R2 platform with the optimal cutoff method. Two P-values are provided for each gene: the first represents the raw significance, while the second reflects the Bonferroni-corrected significance. Genes are visually categorized based on their prognostic association using background colors: White background: Genes linked to shorter OS; Black background: Genes linked to longer OS; Dark grey background with enlarged text: Genes associated with a poor prognosis, indicated by both raw and Bonferroni-corrected P-values < 0.05; Light grey background: Non-significant (NS) genes with no clear survival impact. This classification provides an intuitive visual summary of the survival impact of specific genes across medulloblastoma subgroups, facilitating a better understanding of their prognostic relevance.
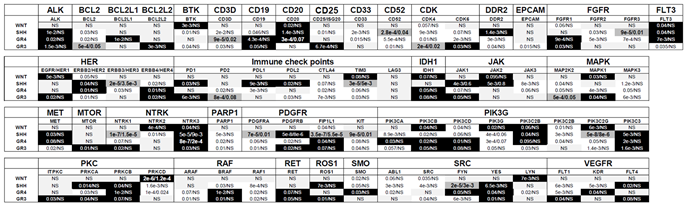 |
Table 3.
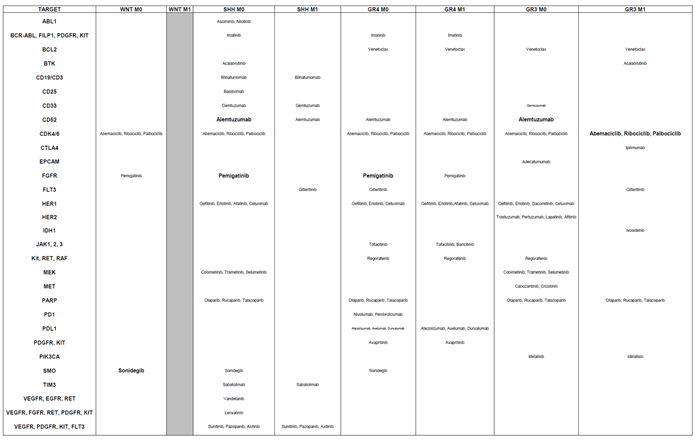
Alignment of Targeted Therapies with Gene-Survival Associations Across Medulloblastoma Subgroups. This table outlines the positioning of targeted therapies based on the survival impact of their corresponding genes across medulloblastoma subgroups. It highlights the most suitable treatments for each subgroup, determined by the lowest P-value: Small characters: Indicate a trend toward significance. Medium characters: Denote a statistically significant raw P-value. Large characters: Represent both raw and Bonferroni-corrected P-values as statistically significant. This table aids in identifying the most effective targeted therapies for each medulloblastoma subgroup, guided by gene-survival correlations.
Table 3.
Alignment of Targeted Therapies with Gene-Survival Associations Across Medulloblastoma Subgroups. This table outlines the positioning of targeted therapies based on the survival impact of their corresponding genes across medulloblastoma subgroups. It highlights the most suitable treatments for each subgroup, determined by the lowest P-value: Small characters: Indicate a trend toward significance. Medium characters: Denote a statistically significant raw P-value. Large characters: Represent both raw and Bonferroni-corrected P-values as statistically significant. This table aids in identifying the most effective targeted therapies for each medulloblastoma subgroup, guided by gene-survival correlations.
 |
3.2. Stratification of Patients by Metastatic Status
Our previous research on gene expressions associated with kidney cancer and medulloblastoma aggressiveness revealed a potential reversal in the impact on OS depending on metastatic status (non-metastatic, M0, versus metastatic, M1). Notably, the prognostic significance of Vascular Endothelial Growth Factor C (VEGFC), a key gene in lymphatic vessel development, displayed opposing trends in M0 and M1 contexts [24,25]. Therefore, we reiterate our analysis considering this important parameter. Approximately 700 curves were produced, which are presented in Supplementary Figure S2. Based on this analysis, Table 4 summarizes the raw and Bonferroni-corrected P-values for each gene across the molecular subgroups of medulloblastoma and the metastatic status, M0/M1 (WNT, SHH, Group 3, and Group 4).
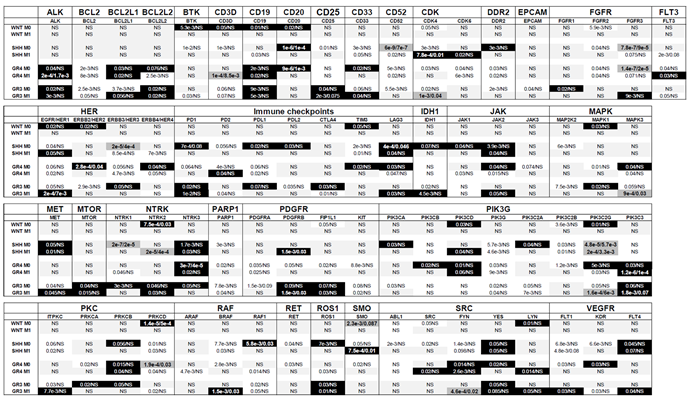
Table 4.
Association Between Targeted Genes and Patient Survival Across Medulloblastoma Subgroups Considering Metastatic Status (M0, M1). This table explores the association of genes targeted by the therapies listed in Table 1 with overall survival (OS) in medulloblastoma patients, stratified by metastatic status (M0: non-metastatic, M1: metastatic). The analyzed genes or gene families are presented alongside their respective P-values, calculated using the R2 platform based on the optimal cutoff approach. Two P-values are reported for each gene: the raw significance value and the Bonferroni-corrected significance value. Genes are visually categorized using background colors to reflect their prognostic impact: White background: Genes associated with shorter OS; Black background: Genes associated with longer OS; Dark grey background with enlarged text: Genes associated with a poor prognosis, indicated by both raw and Bonferroni-corrected P-values < 0.05; Light grey background: Non-significant (NS) genes with no discernible impact on OS. This visual classification highlights the survival implications of specific genes across medulloblastoma subgroups while considering the patients’ metastatic status, providing valuable insights into prognostic and therapeutic considerations.
 |
From Table 4, several genes emerged as relevant therapeutic targets, but their prognostic significance for OS varied depending on metastatic status. For example, BCL2L1 was associated with poor prognosis in non-metastatic (M0) Group 3 patients but exhibited a favorable prognosis in metastatic (M1) Group 3 patients. Similarly, genes such as CDK4, HER1, and SMO showed differing prognostic roles between M0 and M1 patients in the SHH subgroup, while HER1, MET, and ITPKC displayed similar contrasting behavior in Group 3 patients. Additionally, FLT3 and PD2 were poor prognostic markers for Group 4 M0 patients but indicated good prognosis in Group 4 M1 patients.
Conversely, certain genes exhibited reversed prognostic associations between M0 and M1 stages. For example, BCL2L2, HER4, LAG3, JAK2, and MAPK3 were linked to favorable prognosis in M0 Group 4 patients but poor prognosis in M1 Group 4 patients. Similarly, CTLA4 was a favorable prognostic marker in M0 Group 3 patients but indicated poor prognosis in M1 Group 3 patients.
These results highlight that the prognostic behavior of certain genes depends significantly on tumor stage, reinforcing the importance of metastatic status in defining their clinical relevance. However, most genes demonstrate consistent prognostic behavior across both stages.
Genes associated with good prognosis were identified as being more significant in different patient groups based on metastatic status. In M0 patients, the genes BTK, CD3D, CD19, CD20, CD33, DDR2, FGFR1, HER1, HER2, HER3, HER4, PD1, PDL1, PDL2, TIM3, LAG3, IDH1, JAK1, JAK2, MAPK1, NTRK1, NTRK3, PIK3CA, PIK3CD, PIK3C2A, PIK3C2G, PRKCB, PRKCD, RAF1, ROS1, LYN, KDR, and FLT4 demonstrated greater significance. Meanwhile, in M1 patients, genes such as CD19, CD25, CDK6, FGFR3, PD1, MET, MTOR, NTRK2, PDGFRB, FIP1L1, PIK3C3, BRAF, ROS1, FYN, LYN, and FLT4 were identified as more significant.
Conversely, genes associated with poor prognosis also showed variation in significance based on metastatic status. In M0 patients, the genes BCL2, BTK, CD3D, CD25, CD33, CD52, CDK4, DDR2, EPCAM, FGFR2, FGFR3, HER3, PD1, PD2, PDL2, TIM3, JAK3, MAP2K2, MAPK1, NTRK1, PARP1, PDGFRA, PDGFRB, FIP1L1, KIT, PIK3G, PIK3C2B, PRKCA, PRKCD, BRAF, RAF1, RET, SMO, ABL1, SRC, FYN, and KDR were more significant. In contrast, in M1 patients, the genes BTK, CD3D, CD19, CDK4, CDK6, DDR2, FLT3, HER1, HER4, PD2, PDL1, JAK1, MAPK3, NTRK1, NTRK2, PDGFRA, KIT, PIK3G, PIK3C2A, PIK3C2B, PIK3C2G, ITPKC, PRKCD, ARAF, RAF1, ROS1, FYN, FLT1, and KDR showed higher significance.
These findings underscore the critical role of metastatic status in determining the prognostic significance and therapeutic prioritization of target genes. This distinction is vital for guiding gene-specific treatment strategies and optimizing therapeutic outcomes in medulloblastoma.
Through the deconvolution of genes associated with aggressiveness, we identified targeted therapies tailored to each genetic subgroup and their corresponding metastatic status (Table 5).
This updated table incorporates considerations for both genetic subgroups and tumor stages, in contrast to the previous table, which focused solely on genetic subgroups without accounting for tumor metastatic status. For the WNT subgroup, several therapies showed promise for M0 patients, who represented most of the cohort. These included Abemaciclib, Ribociclib, and Palbociclib (CDK inhibitors), Pemigaptinib (FGFR inhibitor), and, unexpectedly, Sonidegib (SMO inhibitor), which was originally designed for SHH patients. However, targeting HER2 was not beneficial for M0 patients in this subgroup.
In the SHH subgroup, Venetoclax (BCL2 inhibitor), Ipilimumab (CTLA4 checkpoint inhibitor), and Alpelisib (PIK3CA inhibitor) were found to be irrelevant for both M0 and M1 patients. Conversely, therapies such as Gilteritinib (FLT3 inhibitor), Sunitinib, Pazopanib, and Axitinib (targeting VEGFR, PDGFR, KIT, and FLT3) demonstrated potential greater effectiveness.
For Group 4, therapies such as Asciminib (ABL1 inhibitor), Gemtuzumab (CD33-directed agent), Ipilimumab (CTLA4 inhibitor), and Cobimetinib, Trametinib, and Selumetinib (MAP2K2 inhibitors), and Sabatolimab (TIM3), were no longer relevant for either M0 or M1 patients. However, potential treatments included Gilteritinib (FLT3 inhibitor), Gefitinib, Erlotinib, Afatinib, and Cetuximab (EGFR-targeting agents), as well as Regorafenib (targeting KIT, RET, and RAF), Nivolumab and Pembrolizumab (PD1 inhibitors), and Idelalisib (PIK3CA inhibitor).
For Group 3, Sabatolimab (TIM3) was suspected to have no effect for both M0 and M1 patients. In contrast, promising drugs included Abemaciclib, Ribociclib, and Palbociclib (CDK inhibitors), Gefitinib, Erlotinib, Dacomitinib, and Cetuximab (EGFR-targeting), along with Ivosidenib (IDH1 inhibitor), Regorafenib (targeting KIT, RET, and RAF), and Cabozantinib (targeting VEGFR, MET, and RET).These findings underscore the importance of considering differences in tumor stages—localized (M0) versus metastatic (M1)—when repositioning treatments. The choice of therapy should be informed by these distinctions, particularly at diagnosis, relapse, or based on whether the tumor is localized or has spread.
Table 5.
Alignment of Targeted Therapies with Gene-Survival Associations Across Medulloblastoma Subgroups Considering M0 and M1 Status. This table aligns targeted therapies with the survival impact of their corresponding genes across medulloblastoma subgroups, considering the metastatic status (M0: non-metastatic; M1: metastatic). The therapies are categorized based on the statistical significance of the association between the targeted gene and overall survival (OS), as determined by the lowest P-value. The significance levels are represented using text size: Small characters: Indicate a trend toward significance (suggestive but not statistically confirmed); Medium characters: Denote a statistically significant association based on raw P-values; Large characters: Represent statistically significant associations confirmed by both raw and Bonferroni-corrected P-values. This framework identifies the most promising therapies for each subgroup, offering a nuanced understanding of therapeutic relevance in the context of metastatic status and gene-survival dynamics.
 |
3.3. Analysis of Targetable Mutations in Medulloblastoma Cohorts
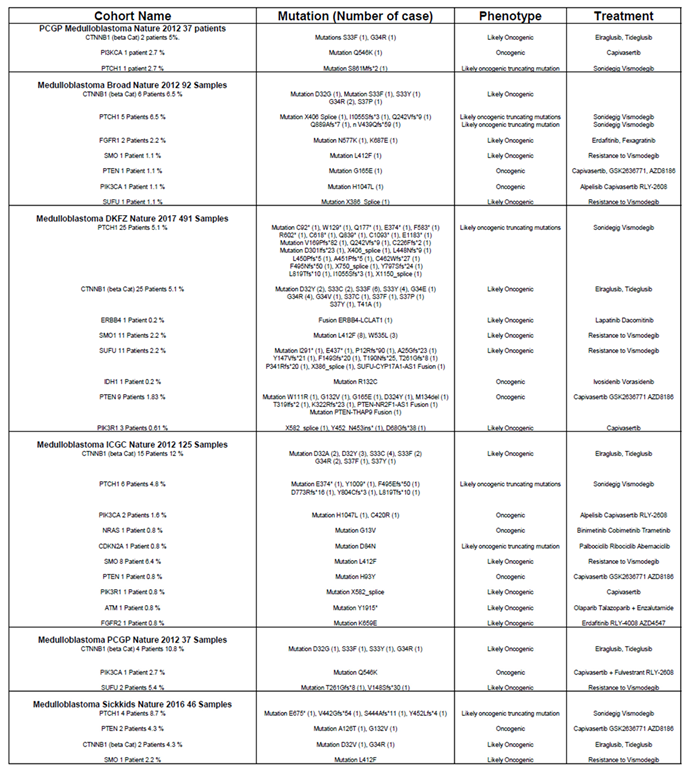
Table 1 highlights treatments applicable when specific mutations are present, such as BRAFV600E. To explore actionable targets, we analyzed medulloblastoma cohorts from the TCGA database, focusing on mutations in targetable genes. Across six available cohorts comprising 828 patients, we identified specific mutation frequencies as follows: 54 patients (6.5%) carried mutations in CTNNB1, 42 patients (5.1%) in PTCH1, 21 patients (2.5%) in SMO, 14 patients (1.7%) in SUFU, 13 patients (1.6%) in PTEN, 5 patients (0.6%) in PI3KCA, 3 patients (0.36%) in PIK3R1, and 2 patients (0.24%) in FGFR1. Additionally, mutations were identified in each single patient (0.12%) for ATM, CDKN2A, ERBB4, FGFR2, IDH1, and NRAS.
Given these mutation profiles, conventional treatments listed in Table 1 may not be effective. The specific mutations identified in these cohorts and their clinical implications are detailed in Table 6.
To address this, we propose alternative therapies tailored to mutation-specific cases. For mutations in the CTNNB1 pathway, inhibitors of GSK3 such as Elraglusib and Tideglusib [26,27] which target CTNNB1 activation, may be effective. In the PI3K/AKT pathway, several inhibitors could be utilized, including Capivasertib, used for metastatic breast cancer with at least one alteration on PIK3CA/AKT1/PTEN [28], and RLY-2608, a PIK3CA inhibitor [29]. Additionally, PI3Kβ inhibitors such as GSK2636771 and AZD8186 are potential options [30,31]. For mutations in the FGFR pathway, inhibitors like Erdafitinib and Fexagratinib may offer therapeutic [32,33]. In cases with EGFR mutations that heterodimerize with ERBB4, the inhibitor Dacomitinib could be considered [34]. Mutations associated with resistance to SHH pathway inhibitors (e.g., Sonidegib and Vismodegib) were also identified, underscoring their role as predictive markers of treatment inefficacy.
Table 6.
Alignment of Targeted Therapies with Specific Gene Mutations This table presents the alignment of targeted therapies with specific mutations that are not addressable by conventional therapies. It includes the names of patient cohorts from the TCGA, the specific genes and mutations identified, their associated expected phenotypes, and the names of treatments tailored to these mutations.
 |
This analysis provides valuable insights into potential repurposing of drugs approved for other tumors to address specific subsets of medulloblastoma, enhancing treatment precision.
3.4. Experimental Validation of In Silico-Identified Therapies in Medulloblastoma Cell Lines
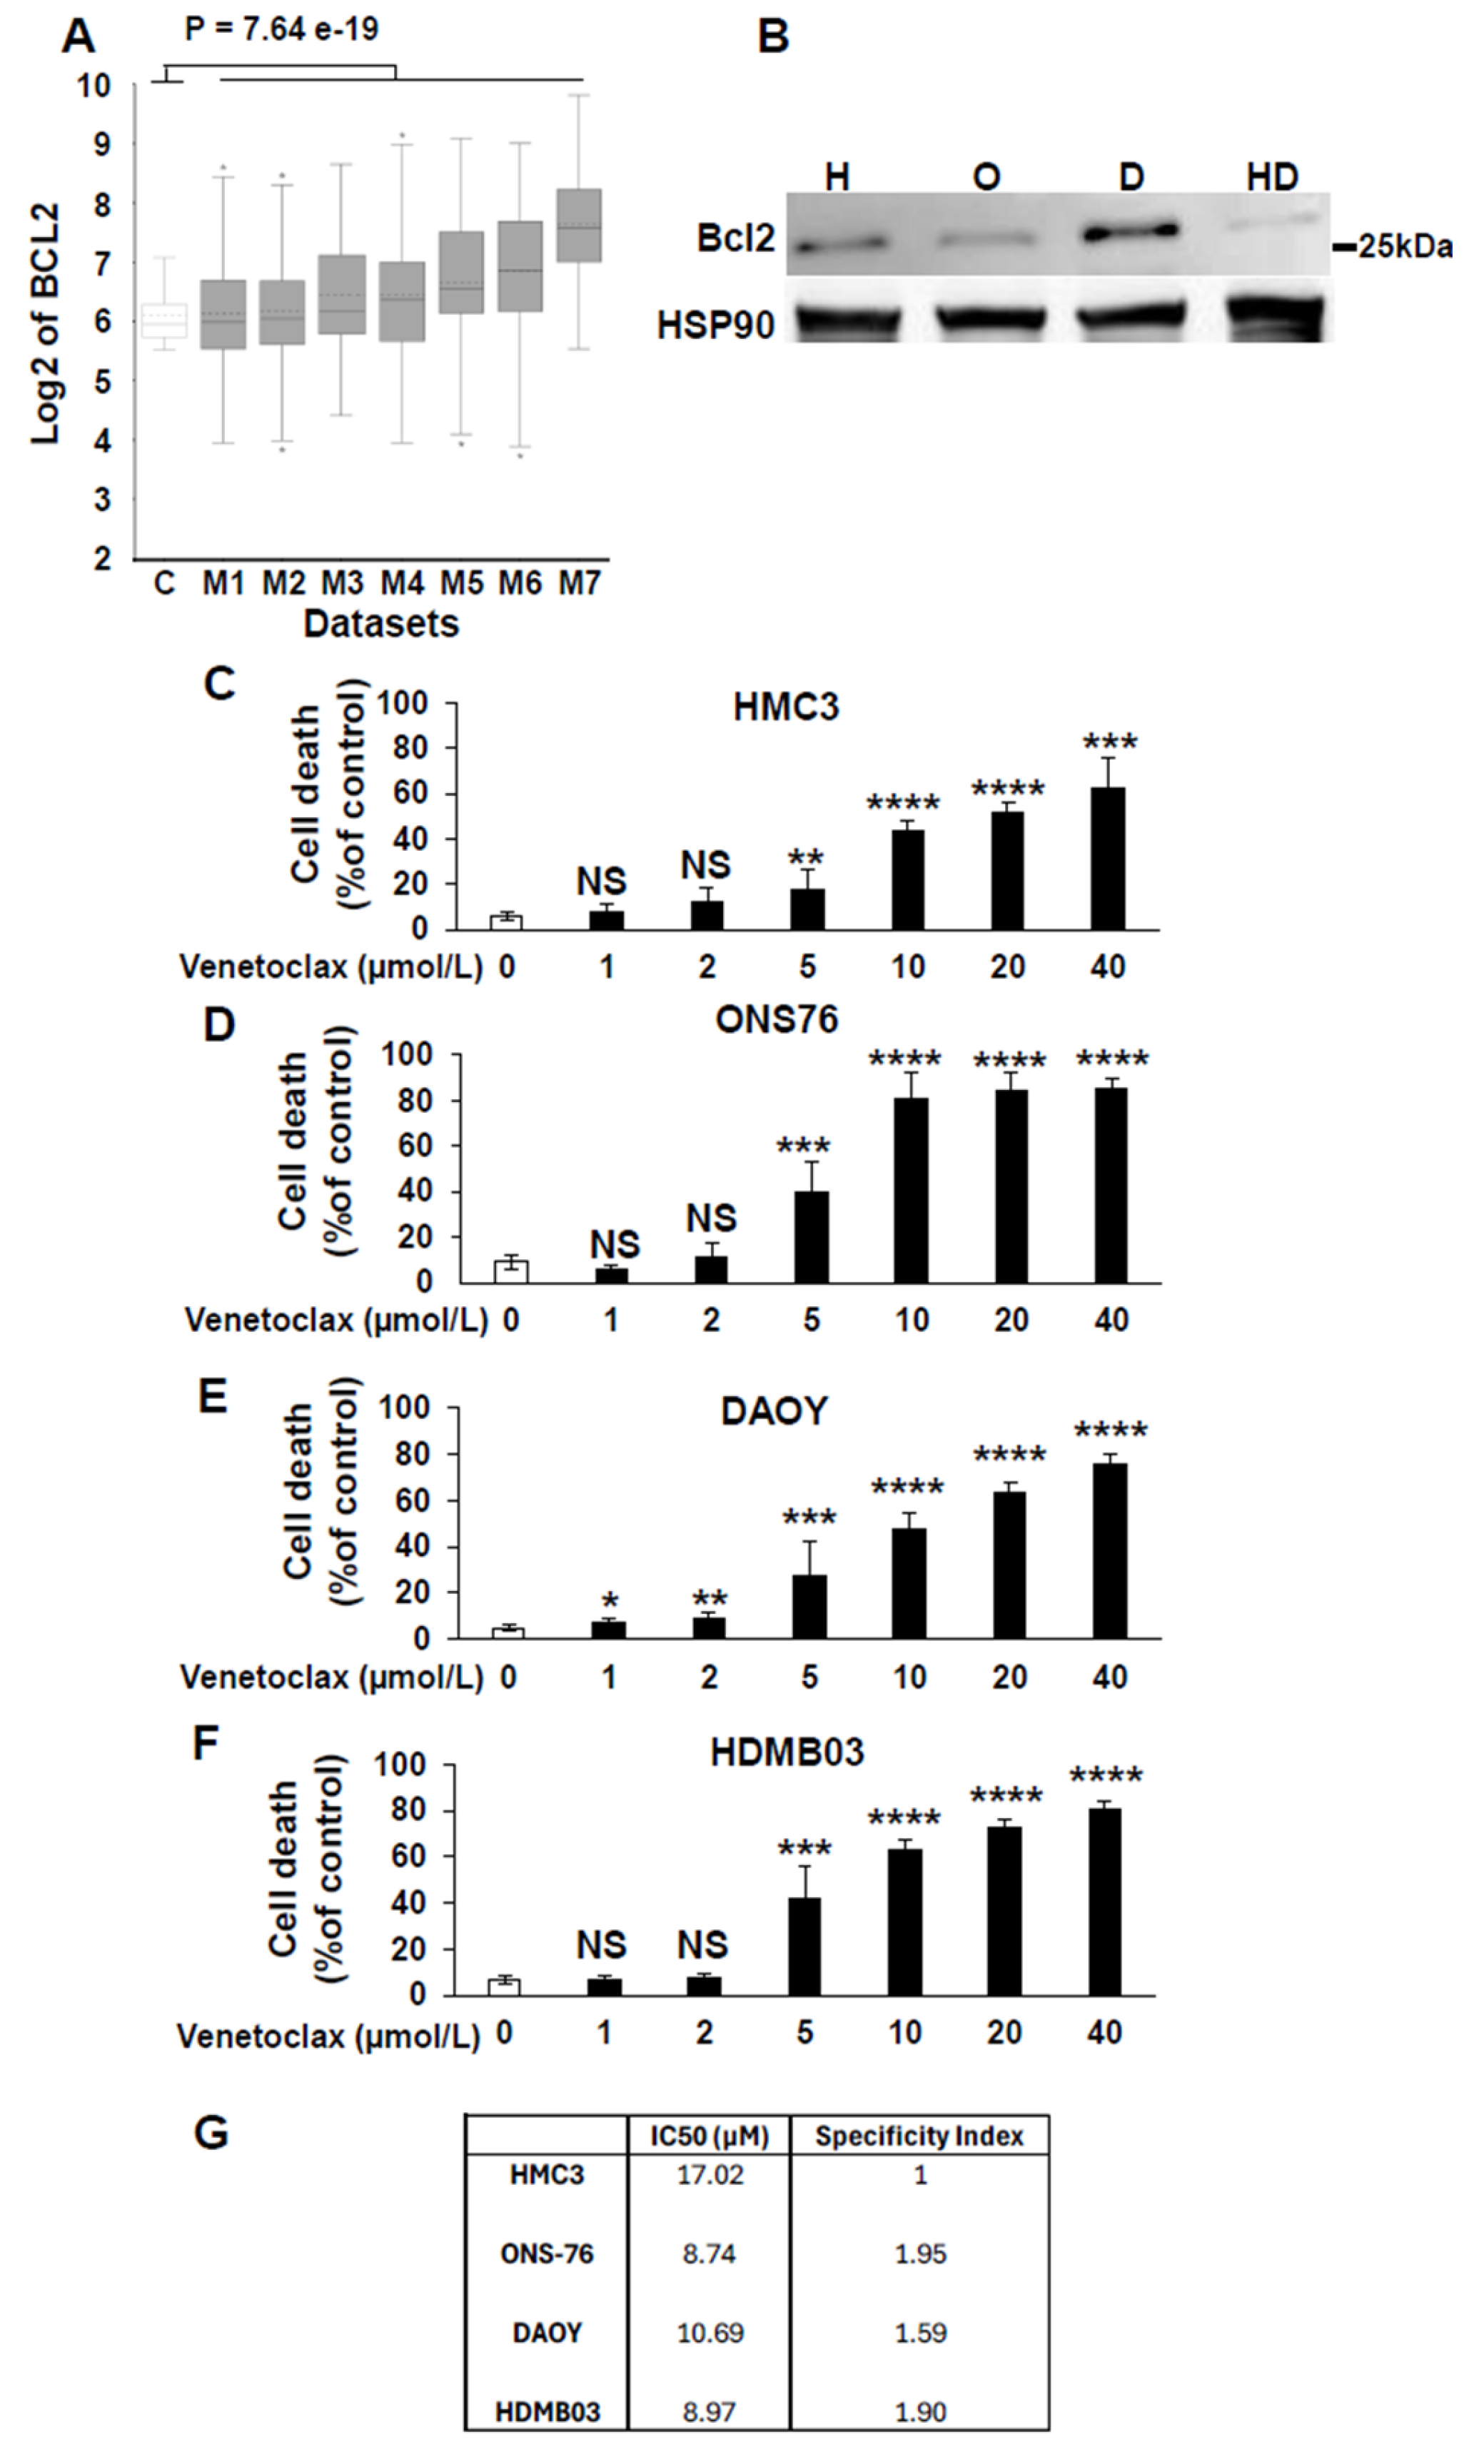
Based on Table 5, several unexpected treatments emerged as potentially relevant for medulloblastoma, including Venetoclax, a BCL2-targeted therapy traditionally used for hematological malignancies and seldom applied to solid tumors. [35]. Our analysis indicated that this therapy showed the greatest efficacy in Group 3 and Group 4 tumors, with a lesser effect on SHH tumors. To validate this, we compared BCL2 expression in normal cerebellum and different datasets of medulloblastoma in the R2 database. This analysis reveals a global upregulation of BCL2 across several datasets of medulloblastoma compared to healthy cerebellum (Figure 1A). Then, we assessed BCL2 protein levels in normal microglial cells (HMC3) and in the medulloblastoma cell lines ONS76 (SHH), DAOY (SHH with a P53 mutation mimicking Group 3 tumor outcomes), and HDMB03 (Group 3 tumor). BCL2 expression, as assessed by immunoblot analysis, was highest in DAOY cells, intermediate in ONS76 and HMC3 cells, and low in HDMB03 cells (Figure 1B). Then, we compared the effect of Venetoclax in normal cells based on their neural origin and tumor cells. The IC50 of Venetoclax was determined on these normal cells and medulloblastoma cell lines (Figure 1 C-F). Except in normal cells, dose-response experiments demonstrated a direct correlation between BCL2 expression levels and Venetoclax efficacy (Figure 1C-G). subsequently calculated the specificity index for venetoclax (Figure 1G) [36]. The specificity index was defined as the ratio of the IC50 in HMC3 (normal) cells and the IC50 in medulloblastoma cell lines, with values greater than 1 indicating preferential activity in tumor cells. Although a specificity index above 5 is generally considered indicative of therapeutic relevance with low toxicity [36], Venetoclax has already demonstrated both efficacy and manageable toxicity in a pediatric cohort of patients with newly diagnosed acute myeloid leukemia [37]. These clinical findings support Venetoclax as a viable treatment option in children. Taken together with our data, these results suggest that Venetoclax warrants further preclinical evaluation as a potential therapy for medulloblastoma.
4. Discussion
The treatment of medulloblastoma remains a significant challenge, whether in the first line setting— aiming to limit the side effects of intensive therapies—or following relapse, which often represents a therapeutic dead end. The development of new drugs is particularly complex and time-intensive, often taking years to reach clinical application. In this context, drug repositioning offers a promising alternative, bypassing extensive preclinical toxicology studies in animals, though still requiring clinical trials to assess toxic effects in children, who are no longer viewed as “small adults.”
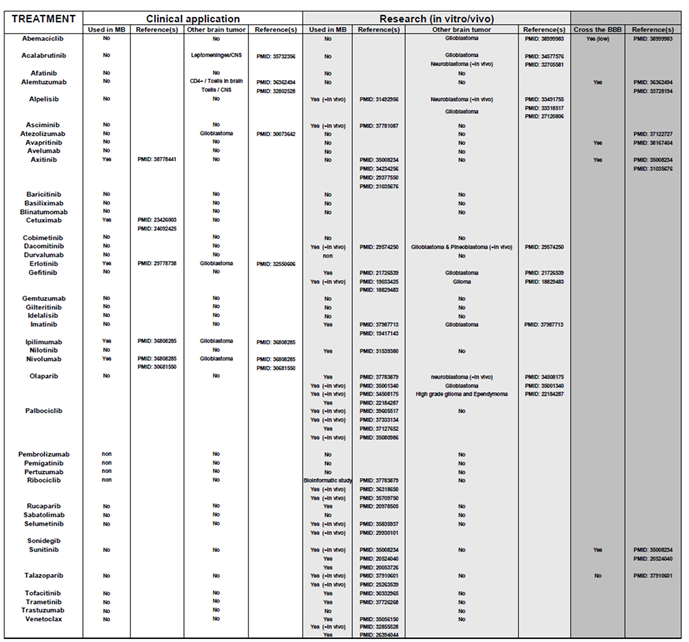
Through comprehensive analysis of available patient cohorts, we identified potential opportunities for therapy repositioning using drugs with established safety profiles in adults. Table 7 highlights several targeted therapies previously tested in early-phase clinical trials for pediatric brain tumors. Some demonstrated promising effects, though confirmation in phase III trials is still required. Notably, therapies relevant to specific genetic subgroups of patients in our analysis were often found ineffective when metastatic status was considered, underscoring a potential source of failure in some clinical trials. Additionally, the presence of mutations in specific genes may act as confounding factors in therapeutic outcomes.
Among the repositioned therapies, treatments for hematological cancers such as Imatinib and Venetoclax emerged as particularly intriguing. Venetoclax showed significant specificity in medulloblastoma model cell lines, further supporting its potential relevance considering that BCL2 expression correlated to the most aggressive form of medulloblastoma [38]. Moreover, using a completely different approach, Garancher, A. et al. demonstrated the efficacy of the pan-inhibitor of BCL family members, TW37 [39]. However, based on our study, the use of a pan-BCL family inhibitor is not recommended, as the overexpression of certain BCL family members appears to have a beneficial effect for reasons that remain unclear. Instead, Venetoclax is strongly recommended due to its selective targeting and its ability to penetrate the blood-brain barrier [40].
Table 7.
Overview of treatments that have been approved for clinical use or previously described in the literature. Potentially repositionable treatments were extensively reviewed to evaluate their relevance for medulloblastoma or other brain tumors. The table also indicates whether each treatment can cross the blood-brain barrier (BBB) and provides the corresponding PubMed ID (PMID) for reference.
 |
5. Conclusions
Although our findings represent an initial step in treatment repositioning for pediatric brain tumors, they provide a foundation for exploring therapies previously overlooked for medulloblastoma, with the goal of improving outcomes in this challenging context.
Supplementary Materials
The following supporting information can be downloaded at the website of this paper posted on Preprints.org, Figure S1: Kaplan-Meier analysis of the relationship between targetable genes and survival in different medulloblastoma subgroups; Figure S2: Kaplan-Meier analysis of the relationship between targetable genes and survival in different medulloblastoma subgroups considering the non-metastatic (M0) and metastatic (M1) patients.
Author Contributions
Conceptualization, G.P. methodology, G.P.; formal analysis, G.P.; investigation, G.P. and A.K.; resources, G.P.; data curation, G.P. and A.K.; writing—original draft preparation, G.P.; writing—review and editing, G.P. and A.K.; supervision, G.P.; project administration, G.P.; funding acquisition, G.P. All authors have read and agreed to the published version of the manuscript.
Funding
This research was funded by W the Conseil Général 06, the FEDER, the EUR HEALTHY from the University Cote d’Azur, the Région Provence-Alpes-Côte d’Azur, and INSERM. This work received financial support from CNRS, Université Côte d’Azur, the Canceropôle PACA Research Fund, ANR, INCA, La Ligue Nationale Contre le Cancer (Equipe Labellisée 2019), Fondation ARC pour la Recherche sur le Cancer (Programme Labellisé 2022), and the ARCAGEING2023020006332 program.
Informed Consent Statement
Since the information we used for our manuscript came from publicly available databases, informed consent was obtained from all subjects involved in the study.
Data Availability Statement
The data were from publicly available databases including the R2 Genomics Analysis and Visualization Platform https://hgserver1.amc.nl/cgi-bin/r2/main.cgi?open_page=login and the TCGA databases from the cbioportal visualization platform https://www.cbioportal.org/.
Acknowledgments
We thank the Fondation Flavien for its continuous support to our program https://www.fondationflavien.com/.
Conflicts of Interest
The authors declare no conflicts of interest.
Abbreviations
The following abbreviations are used in this manuscript:
| ABL | Abelson Tyrosine-Protein Kinase 1 |
| ALK | Anaplastic Lymphoma Kinase |
| AXL | Tyrosine-protein kinase receptor UFO |
| BCL2 | B Cell Lymphoma 2 |
| BCR | Breakpoint Cluster Region protein |
| BRAF | B-Raf protein, serine/threonine kinase |
| BTK | Bruton Kinase |
| CDK | Cyclin Dependent Kinase |
| CTLA4 | Cytotoxic T-Lymphocyte Associated Protein 4 |
| DDR2 | Discoidin Domain Receptor Tyrosine Kinase 2 |
| DFS | Disease Free Survival |
| EGFR/HER1 | Epithelial Growth Factor Receptor |
| EPCAM | Epithelial Cell Adhesion Molecule |
| FDA | Food and Drug Administration |
| FGF | Fibroblast growth factors |
| FILP1 | Filamin A Interacting Protein 1 |
| FLT3 | Fms Related Receptor Tyrosine Kinase 3 |
| HGFR/MET | Hepatocyte Growth Factor Receptor |
| HRP | Horse Radish Peroxidase |
| KIT | KIT proto-oncogene, receptor tyrosine kinase |
| IDH1 | Isocitrate dehydrogenase |
| JAK | Janus Kinase |
| LAG 3 | Lymphocyte Activating 3 |
| LYN | Protein tyrosine kinase Src family |
| MAPK | Mitogen-activated protein kinase |
| MEK | Mitogen Activated Protein Kinase Kinase |
| mTOR | Mammalian target of rapamycin |
| OS | Overall Survival |
| PARP | Poly ADP Ribose Polymerase |
| PD1/PDL1 | Programmed Cell Death Protein 1/PD1 Ligand |
| PDGFR | Platelet Derived Growth Factor Receptor |
| PFS | Progression Free Survival |
| PKC | Protein Kinase C |
| PI | Propidium Iodide |
| PI3K | Phosphoinositide 3-kinase |
| PVDF | Polyvinylidene Fluoride |
| RAF | Rapidly Accelerated Fibrosarcoma |
| RET | Rearranged during transfection tyrosine kinase receptor |
| ROS | ROS Proto-Oncogene 1, Receptor Tyrosine Kinase |
| SMO | Smoothened protein |
| TIM3 | T-cell immunoglobulin and mucin-domain containing-3 |
| TRK | Tropomyosin Receptor Kinase |
| VEGFR | Vascular Endothelial Growth Factor Receptor |
References
- Gajjar, A.; Bowers, D.C.; Karajannis, M.A.; Leary, S.; Witt, H.; Gottardo, N.G. Pediatric Brain Tumors: Innovative Genomic Information Is Transforming the Diagnostic and Clinical Landscape. J Clin Oncol 2015, 33, 2986–2998. [Google Scholar] [CrossRef] [PubMed]
- Gajjar, A.; Chintagumpala, M.; Ashley, D.; Kellie, S.; Kun, L.E.; Merchant, T.E.; Woo, S.; Wheeler, G.; Ahern, V.; Krasin, M.J.; et al. Risk-adapted craniospinal radiotherapy followed by high-dose chemotherapy and stem-cell rescue in children with newly diagnosed medulloblastoma (St Jude Medulloblastoma-96): Long-term results from a prospective, multicentre trial. Lancet Oncol 2006, 7, 813–820. [Google Scholar] [CrossRef] [PubMed]
- Packer, R.J.; Gajjar, A.; Vezina, G.; Rorke-Adams, L.; Burger, P.C.; Robertson, P.L.; Bayer, L.; LaFond, D.; Donahue, B.R.; Marymont, M.H.; et al. Phase III study of craniospinal radiation therapy followed by adjuvant chemotherapy for newly diagnosed average-risk medulloblastoma. J Clin Oncol 2006, 24, 4202–4208. [Google Scholar] [CrossRef] [PubMed]
- Coy, S.; Lee, J.S.; Chan, S.J.; Woo, T.; Jones, J.; Alexandrescu, S.; Wen, P.Y.; Sorger, P.K.; Ligon, K.L.; Santagata, S. Systematic characterization of antibody-drug conjugate targets in central nervous system tumors. Neuro Oncol 2024, 26, 458–472. [Google Scholar] [CrossRef] [PubMed]
- Thompson, E.M.; Keir, S.T.; Venkatraman, T.; Lascola, C.; Yeom, K.W.; Nixon, A.B.; Liu, Y.; Picard, D.; Remke, M.; Bigner, D.D.; et al. The role of angiogenesis in Group 3 medulloblastoma pathogenesis and survival. Neuro Oncol 2017, 19, 1217–1227. [Google Scholar] [CrossRef] [PubMed]
- Rini, B.I.; Escudier, B.; Tomczak, P.; Kaprin, A.; Szczylik, C.; Hutson, T.E.; Michaelson, M.D.; Gorbunova, V.A.; Gore, M.E.; Rusakov, I.G.; et al. Comparative effectiveness of axitinib versus sorafenib in advanced renal cell carcinoma (AXIS): A randomised phase 3 trial. Lancet 2011, 378, 1931–1939. [Google Scholar] [CrossRef] [PubMed]
- Rini, B.I.; Plimack, E.R.; Stus, V.; Gafanov, R.; Hawkins, R.; Nosov, D.; Pouliot, F.; Alekseev, B.; Soulieres, D.; Melichar, B.; et al. Pembrolizumab plus Axitinib versus Sunitinib for Advanced Renal-Cell Carcinoma. N Engl J Med 2019, 380, 1116–1127. [Google Scholar] [CrossRef] [PubMed]
- Pagnuzzi-Boncompagni, M.; Picco, V.; Vial, V.; Planas-Bielsa, V.; Vandenberghe, A.; Daubon, T.; Derieppe, M.A.; Montemagno, C.; Durivault, J.; Grepin, R.; et al. Antiangiogenic Compound Axitinib Demonstrates Low Toxicity and Antitumoral Effects against Medulloblastoma. Cancers (Basel) 2021, 14. [Google Scholar] [CrossRef] [PubMed]
- Schwinn, S.; Mokhtari, Z.; Thusek, S.; Schneider, T.; Siren, A.L.; Tiemeyer, N.; Caruana, I.; Miele, E.; Schlegel, P.G.; Beilhack, A.; et al. Cytotoxic effects and tolerability of gemcitabine and axitinib in a xenograft model for c-myc amplified medulloblastoma. Sci Rep 2021, 11, 14062. [Google Scholar] [CrossRef] [PubMed]
- Donze, C.; Revon-Riviere, G.; Pondrom, M.; Verschuur, A.; Leblond, P.; Andre, N. Retrospective experience of children with relapsed brain tumors treated with oral combination of axitinib and metronomic etoposide. Pediatr Blood Cancer 2024, 71, e31076. [Google Scholar] [CrossRef] [PubMed]
- Ahmed, N.; Ratnayake, M.; Savoldo, B.; Perlaky, L.; Dotti, G.; Wels, W.S.; Bhattacharjee, M.B.; Gilbertson, R.J.; Shine, H.D.; Weiss, H.L.; et al. Regression of experimental medulloblastoma following transfer of HER2-specific T cells. Cancer Res 2007, 67, 5957–5964. [Google Scholar] [CrossRef] [PubMed]
- Cavalli, F.M.G.; Remke, M.; Rampasek, L.; Peacock, J.; Shih, D.J.H.; Luu, B.; Garzia, L.; Torchia, J.; Nor, C.; Morrissy, A.S.; et al. Intertumoral Heterogeneity within Medulloblastoma Subgroups. Cancer Cell 2017, 31, 737–754. [Google Scholar] [CrossRef] [PubMed]
- Ho, D.M.; Shih, C.C.; Liang, M.L.; Tsai, C.Y.; Hsieh, T.H.; Tsai, C.H.; Lin, S.C.; Chang, T.Y.; Chao, M.E.; Wang, H.W.; et al. Integrated genomics has identified a new AT/RT-like yet INI1-positive brain tumor subtype among primary pediatric embryonal tumors. BMC Med Genomics 2015, 8, 32. [Google Scholar] [CrossRef] [PubMed]
- Robinson, G.; Parker, M.; Kranenburg, T.A.; Lu, C.; Chen, X.; Ding, L.; Phoenix, T.N.; Hedlund, E.; Wei, L.; Zhu, X.; et al. Novel mutations target distinct subgroups of medulloblastoma. Nature 2012, 488, 43–48. [Google Scholar] [CrossRef] [PubMed]
- de Bont, J.M.; Kros, J.M.; Passier, M.M.; Reddingius, R.E.; Sillevis Smitt, P.A.; Luider, T.M.; den Boer, M.L.; Pieters, R. Differential expression and prognostic significance of SOX genes in pediatric medulloblastoma and ependymoma identified by microarray analysis. Neuro Oncol 2008, 10, 648–660. [Google Scholar] [CrossRef] [PubMed]
- Kool, M.; Koster, J.; Bunt, J.; Hasselt, N.E.; Lakeman, A.; van Sluis, P.; Troost, D.; Meeteren, N.S.; Caron, H.N.; Cloos, J.; et al. Integrated genomics identifies five medulloblastoma subtypes with distinct genetic profiles, pathway signatures and clinicopathological features. PLoS ONE 2008, 3, e3088. [Google Scholar] [CrossRef] [PubMed]
- Kool, M.; Jones, D.T.; Jager, N.; Northcott, P.A.; Pugh, T.J.; Hovestadt, V.; Piro, R.M.; Esparza, L.A.; Markant, S.L.; Remke, M.; et al. Genome sequencing of SHH medulloblastoma predicts genotype-related response to smoothened inhibition. Cancer Cell 2014, 25, 393–405. [Google Scholar] [CrossRef] [PubMed]
- Fattet, S.; Haberler, C.; Legoix, P.; Varlet, P.; Lellouch-Tubiana, A.; Lair, S.; Manie, E.; Raquin, M.A.; Bours, D.; Carpentier, S.; et al. Beta-catenin status in paediatric medulloblastomas: Correlation of immunohistochemical expression with mutational status, genetic profiles, and clinical characteristics. J Pathol 2009, 218, 86–94. [Google Scholar] [CrossRef] [PubMed]
- Roth, R.B.; Hevezi, P.; Lee, J.; Willhite, D.; Lechner, S.M.; Foster, A.C.; Zlotnik, A. Gene expression analyses reveal molecular relationships among 20 regions of the human CNS. Neurogenetics 2006, 7, 67–80. [Google Scholar] [CrossRef] [PubMed]
- Northcott, P.A.; Buchhalter, I.; Morrissy, A.S.; Hovestadt, V.; Weischenfeldt, J.; Ehrenberger, T.; Grobner, S.; Segura-Wang, M.; Zichner, T.; Rudneva, V.A.; et al. The whole-genome landscape of medulloblastoma subtypes. Nature 2017, 547, 311–317. [Google Scholar] [CrossRef] [PubMed]
- Pugh, T.J.; Weeraratne, S.D.; Archer, T.C.; Pomeranz Krummel, D.A.; Auclair, D.; Bochicchio, J.; Carneiro, M.O.; Carter, S.L.; Cibulskis, K.; Erlich, R.L.; et al. Medulloblastoma exome sequencing uncovers subtype-specific somatic mutations. Nature 2012, 488, 106–110. [Google Scholar] [CrossRef] [PubMed]
- Jones, D.T.; Jager, N.; Kool, M.; Zichner, T.; Hutter, B.; Sultan, M.; Cho, Y.J.; Pugh, T.J.; Hovestadt, V.; Stutz, A.M.; et al. Dissecting the genomic complexity underlying medulloblastoma. Nature 2012, 488, 100–105. [Google Scholar] [CrossRef] [PubMed]
- Morrissy, A.S.; Garzia, L.; Shih, D.J.; Zuyderduyn, S.; Huang, X.; Skowron, P.; Remke, M.; Cavalli, F.M.; Ramaswamy, V.; Lindsay, P.E.; et al. Divergent clonal selection dominates medulloblastoma at recurrence. Nature 2016, 529, 351–357. [Google Scholar] [CrossRef] [PubMed]
- Penco-Campillo, M.; Comoglio, Y.; Feliz Morel, A.J.; Hanna, R.; Durivault, J.; Leloire, M.; Mejias, B.; Pagnuzzi, M.; Morot, A.; Burel-Vandenbos, F.; et al. VEGFC negatively regulates the growth and aggressiveness of medulloblastoma cells. Commun Biol 2020, 3, 579. [Google Scholar] [CrossRef] [PubMed]
- Ndiaye, P.D.; Dufies, M.; Giuliano, S.; Douguet, L.; Grepin, R.; Durivault, J.; Lenormand, P.; Glisse, N.; Mintcheva, J.; Vouret-Craviari, V.; et al. VEGFC acts as a double-edged sword in renal cell carcinoma aggressiveness. Theranostics 2019, 9, 661–675. [Google Scholar] [CrossRef] [PubMed]
- Carneiro, B.A.; Cavalcante, L.; Mahalingam, D.; Saeed, A.; Safran, H.; Ma, W.W.; Coveler, A.L.; Powell, S.; Bastos, B.; Davis, E.; et al. Phase I Study of Elraglusib (9-ING-41), a Glycogen Synthase Kinase-3beta Inhibitor, as Monotherapy or Combined with Chemotherapy in Patients with Advanced Malignancies. Clin Cancer Res 2024, 30, 522–531. [Google Scholar] [CrossRef] [PubMed]
- Bou-Gharios, J.; Assi, S.; Bahmad, H.F.; Kharroubi, H.; Araji, T.; Chalhoub, R.M.; Ballout, F.; Harati, H.; Fares, Y.; Abou-Kheir, W. The potential use of tideglusib as an adjuvant radio-therapeutic treatment for glioblastoma multiforme cancer stem-like cells. Pharmacol Rep 2021, 73, 227–239. [Google Scholar] [CrossRef] [PubMed]
- K, D.S. Capivasertib: First Approved AKT inhibitor for the Treatment of Patients with Breast Cancer. Anticancer Agents Med Chem 2024. [Google Scholar] [CrossRef]
- Varkaris, A.; Pazolli, E.; Gunaydin, H.; Wang, Q.; Pierce, L.; Boezio, A.A.; Bulku, A.; DiPietro, L.; Fridrich, C.; Frost, A.; et al. Discovery and Clinical Proof-of-Concept of RLY-2608, a First-in-Class Mutant-Selective Allosteric PI3Kalpha Inhibitor That Decouples Antitumor Activity from Hyperinsulinemia. Cancer Discov 2024, 14, 240–257. [Google Scholar] [CrossRef] [PubMed]
- Sarker, D.; Dawson, N.A.; Aparicio, A.M.; Dorff, T.B.; Pantuck, A.J.; Vaishampayan, U.N.; Henson, L.; Vasist, L.; Roy-Ghanta, S.; Gorczyca, M.; et al. A Phase I, Open-Label, Dose-Finding Study of GSK2636771, a PI3Kbeta Inhibitor, Administered with Enzalutamide in Patients with Metastatic Castration-Resistant Prostate Cancer. Clin Cancer Res 2021, 27, 5248–5257. [Google Scholar] [CrossRef] [PubMed]
- Suh, K.J.; Ryu, M.H.; Zang, D.Y.; Bae, W.K.; Lee, H.S.; Oh, H.J.; Kang, M.; Kim, J.W.; Kim, B.J.; Mortimer, P.G.S.; et al. AZD8186 in Combination With Paclitaxel in Patients With Advanced Gastric Cancer: Results From a Phase Ib/II Study (KCSG ST18-20). Oncologist 2023, 28, e823–e834. [Google Scholar] [CrossRef] [PubMed]
- Matsubara, N.; Miura, Y.; Nishiyama, H.; Taoka, R.; Kojima, T.; Shimizu, N.; Hwang, J.; Ote, T.; Oyama, R.; Toyoizumi, K.; et al. Phase 3 THOR Japanese subgroup analysis: Erdafitinib in advanced or metastatic urothelial cancer and fibroblast growth factor receptor alterations. Int J Clin Oncol 2024, 29, 1516–1527. [Google Scholar] [CrossRef] [PubMed]
- Picca, A.; Di Stefano, A.L.; Savatovsky, J.; Ducray, F.; Chinot, O.; Moyal, E.C.; Augereau, P.; Le Rhun, E.; Schmitt, Y.; Rousseaux, N.; et al. TARGET: A phase I/II open-label multicenter study to assess safety and efficacy of fexagratinib in patients with relapsed/refractory FGFR fusion-positive glioma. Neurooncol Adv 2024, 6, vdae068. [Google Scholar] [CrossRef] [PubMed]
- Jung, H.A.; Park, S.; Lee, S.H.; Ahn, J.S.; Ahn, M.J.; Sun, J.M. Dacomitinib in EGFR-mutant non-small-cell lung cancer with brain metastasis: A single-arm, phase II study. ESMO Open 2023, 8, 102068. [Google Scholar] [CrossRef] [PubMed]
- Ploumaki, I.; Triantafyllou, E.; Koumprentziotis, I.A.; Karampinos, K.; Drougkas, K.; Karavolias, I.; Trontzas, I.; Kotteas, E.A. Bcl-2 pathway inhibition in solid tumors: A review of clinical trials. Clin Transl Oncol 2023, 25, 1554–1578. [Google Scholar] [CrossRef] [PubMed]
- Badisa, R.B.; Darling-Reed, S.F.; Joseph, P.; Cooperwood, J.S.; Latinwo, L.M.; Goodman, C.B. Selective cytotoxic activities of two novel synthetic drugs on human breast carcinoma MCF-7 cells. Anticancer Res 2009, 29, 2993–2996. [Google Scholar] [PubMed]
- Wen, X.; Lu, Y.; Li, Y.; Qi, P.; Wu, Y.; Yu, J.; Zhang, R.; Huang, Q.; Huang, P.; Hou, B.; et al. Remission rate, toxicity and pharmacokinetics of venetoclax-based induction regimens in untreated pediatric acute myeloid leukemia. NPJ Precis Oncol 2024, 8, 248. [Google Scholar] [CrossRef] [PubMed]
- Schuller, U.; Schober, F.; Kretzschmar, H.A.; Herms, J. Bcl-2 expression inversely correlates with tumour cell differentiation in medulloblastoma. Neuropathol Appl Neurobiol 2004, 30, 513–521. [Google Scholar] [CrossRef] [PubMed]
- Garancher, A.; Lin, C.Y.; Morabito, M.; Richer, W.; Rocques, N.; Larcher, M.; Bihannic, L.; Smith, K.; Miquel, C.; Leboucher, S.; et al. NRL and CRX Define Photoreceptor Identity and Reveal Subgroup-Specific Dependencies in Medulloblastoma. Cancer Cell 2018, 33, 435–449. [Google Scholar] [CrossRef] [PubMed]
- Badawi, M.; Menon, R.; Place, A.E.; Palenski, T.; Sunkersett, G.; Arrendale, R.; Deng, R.; Federico, S.M.; Cooper, T.M.; Salem, A.H. Venetoclax Penetrates the Blood Brain Barrier: A Pharmacokinetic Analysis in Pediatric Leukemia Patients. J Cancer 2023, 14, 1151–1156. [Google Scholar] [CrossRef] [PubMed]
Figure 1.
Relevance of targeting BCL2 for the treatment of medulloblastoma. A) Box-dot plot showing mRNA expression level of BCL2 (R2: Genomics Analysis and Visualization Platform (http://r2.amc.nl) in normal cerebellum (C) (n = 9 retrieved from Roth database), and medulloblastoma patients (M1–M7); M1: (n = 76) from Gilbertson database, M2: (n = 57) from Delattre database, M3: (n = 62) from Kool database, M4: (n = 223) from Pfister1 database, M5: (n = 51) from den Boer database, M6: (n = 31) from Hsieh database and M7: (n = 73) from Pfister2 database. Statistical analysis (One-way analysis of variance (ANOVA)) is shown, P = 7.64 e-19. B) Immunoblot analysis of BCL2 expression in HMC3 (H) ONS76 cells (O), DAOY cells (D) and HDMB03 cells (HD). GAPDH is shown as loading control. C-F) Dose dependent inhibition of viability of the four cells lines by increasing concentrations of venetoclax. *: P < 0.05; **: P < 0.01; ***: p < 0.001: **** P < 0.0001. G) IC50 and specificity index of venetoclax for the different cell lines.
Disclaimer/Publisher’s Note: The statements, opinions and data contained in all publications are solely those of the individual author(s) and contributor(s) and not of MDPI and/or the editor(s). MDPI and/or the editor(s) disclaim responsibility for any injury to people or property resulting from any ideas, methods, instructions or products referred to in the content. |
© 2025 by the authors. Licensee MDPI, Basel, Switzerland. This article is an open access article distributed under the terms and conditions of the Creative Commons Attribution (CC BY) license (https://creativecommons.org/licenses/by/4.0/).
Copyright: This open access article is published under a Creative Commons CC BY 4.0 license, which permit the free download, distribution, and reuse, provided that the author and preprint are cited in any reuse.


