
Submitted:
17 July 2025
Posted:
19 July 2025
You are already at the latest version
Abstract
Efficient water use in sanitary systems is essential for sustainability and design competitiveness. This study validates the hydraulic performance of a 4.8L low-consumption toilet using computational fluid dynamics (CFD) with OpenFOAM and ANSYS Fluent. The simulation focused on key hydraulic phenomena, including siphon action and water distribution over the bowl, following the INEN 3082 standard. The toilet geometry was developed using CAD and meshed with high refinement to ensure simulation accuracy. Two-phase Volume of Fluid (VOF) models captured the transient behavior of the flushing process, enabling analysis of siphon development and surface cleaning efficiency. Results demonstrated consistency between both software, with acceptable error margins in pressure and velocity fields, and confirmed the development of the siphon effect within five seconds, aligning with empirical expectations. The cost analysis revealed that OpenFOAM offers a highly cost-effective validation method from the first simulation, while ANSYS becomes economically viable with multiple simulations. This approach provides a sustainable alternative to experimental testing in toilet prototyping, reducing water and material waste while accelerating product development in the sanitary industry.
Keywords:
CFD
; hydraulic simulation
; low-consumption toilet
; siphon action
; OpenFOAM
; ANSYS Fluent
; water efficiency
1. Introduction
Water conservation in sanitary systems has become increasingly critical in addressing global environmental challenges. The design and implementation of high-efficiency toilets (HET), capable of performing effective flushing with reduced water consumption, are central to this objective. Traditional toilets typically consumed 6 liters per flush, but new designs have successfully reduced this to 4.8 liters without compromising functionality or user comfort [3,8]. However, validating the hydraulic performance of these systems requires rigorous testing procedures to ensure compliance with quality and operational standards [9,10].
Conventionally, the validation of new toilet models involves extensive physical testing, which can be resource-intensive and environmentally taxing due to water use and the need for multiple prototypes. This has driven interest in using computational fluid dynamics (CFD) to simulate the hydraulic behavior of toilets, providing a cost-effective and sustainable alternative for performance validation during the prototyping phase [2,11]. CFD tools can replicate complex phenomena such as siphon formation and water distribution during flushing, providing insights into system performance while minimizing material and water waste during development [12].
Recent studies have demonstrated the applicability of CFD in modeling two-phase flow in toilet systems, effectively capturing the dynamic interactions between water and air during flushing [6]. Simulations using advanced multiphase models such as the Volume of Fluid (VOF) method have been shown to accurately predict siphon initiation and the subsequent fluid behavior within the system, offering valuable data for design optimization [14]. The integration of CFD into sanitary system design thus enables the development of high-efficiency toilets that meet operational standards while reducing development time and costs [13].
Furthermore, CFD tools allow for testing under various operational conditions without the logistical constraints of experimental setups. For instance, using CFD, it is possible to assess the impact of different flush valve designs, bowl geometries, and water volumes on flushing efficiency, enabling manufacturers to refine designs before physical prototyping [7]. This not only facilitates the development of water-efficient products but also supports environmental sustainability by reducing water and material use throughout the product lifecycle.
The potential for CFD to replace or complement traditional testing is particularly significant in contexts where access to extensive laboratory testing facilities is limited. Through simulation, engineers and researchers can perform iterative analyses, refining designs based on performance data to achieve compliance with local and international standards while adhering to sustainability principles [2,6]. By adopting these advanced simulation methodologies, the sanitary industry can accelerate innovation while aligning with global water conservation goals.
This study aims to validate the hydraulic performance of a 4.8L low-consumption toilet using CFD simulations with OpenFOAM and ANSYS Fluent. By focusing on critical hydraulic phenomena such as siphon action and water distribution within the toilet bowl, the research seeks to demonstrate the feasibility of using CFD as a reliable and sustainable alternative to experimental testing in the design and validation of high-efficiency toilets.
2. Materials and Methods
2.1. Geometry Development
The hydraulic validation of a 4.8L low-consumption toilet was conducted using computational fluid dynamics (CFD) simulations with OpenFOAM (open-source) and ANSYS Fluent (commercial software). The geometry of the toilet, including the bowl, siphon, and tank, was developed using CAD software based on dimensions compliant with the INEN 3082 standard for sanitary systems in Ecuador.
A high-refinement mesh was generated using GMSH and further processed in OpenFOAM using snappyHexMesh, achieving an optimized mesh for accurate simulation of two-phase air-water flow within the system (Figure 1). The mesh consisted primarily of hexahedral elements to ensure numerical stability and efficient computation Figure 1.
2.2. Simulation Setup
Simulations were performed using the Volume of Fluid (VOF) multiphase model to capture the interface dynamics between water and air during flushing, focusing on key phenomena such as siphon formation and water coverage on the bowl surface. Boundary conditions included atmospheric pressure outlets and symmetry planes to reduce computational costs while maintaining physical accuracy (Figure 2). Both OpenFOAM and ANSYS Fluent simulations utilized transient analysis over a 10-second flush cycle to observe siphon development and flushing efficiency.
The results, including pressure and velocity distributions within the siphon and bowl, were analyzed and compared across both software platforms to assess consistency and accuracy (Figure 3). Additionally, a cost analysis was performed to evaluate the feasibility of simulation-based validation as an alternative to experimental prototyping in the sanitary industry.
The toilet model includes four key boundary conditions to accurately simulate the flow behavior. A pressure outlet configured as Open Channel allows the free surface behavior of the water to be captured at one of the discharge points, essential for realistic drainage modeling. Another pressure outlet, also configured as Open Channel, is included to manage a secondary discharge location, maintaining realistic hydraulic conditions within the system. A symmetry boundary condition is applied to the geometry, reducing computational cost while preserving the accuracy of the flow pattern based on the toilet’s structure. Finally, an outlet for the mixture volume discharge is included, handling the outflow of the water-air mixture and ensuring correct mass balance while enabling the analysis of flushing efficiency within the toilet system (Figure 3).
2.3. Governing Equations
The Volume of Fluid (VOF) method was used to solve the transient, two-phase (air-water) flow using the Navier-Stokes equations for incompressible, isothermal, immiscible fluids, including surface tension effects.
The continuity equation:
where is the velocity vector.
The momentum equation:
where is the density, p is the pressure, is the dynamic viscosity, is gravitational acceleration, and is the surface tension force.
The VOF method tracks the volume fraction of water using:
where is the relative velocity used for interface compression.
The mixture density and viscosity are calculated as:
where are the density and viscosity of water, and are the density and viscosity of air.
Surface tension force using the continuum surface force (CSF) model:
where is the surface tension coefficient, and is the interface curvature:
These equations were solved using second-order temporal and spatial discretization schemes under transient conditions to capture the flushing process accurately.
3. Results
3.1. Water Distribution During Flushing
The water distribution over the bowl surface was effectively captured in both OpenFOAM and ANSYS Fluent simulations, demonstrating complete surface coverage within the first seconds of the flush cycle (see Figure 4). This indicates that the toilet geometry and flow conditions allow for efficient bowl cleaning during operation, meeting the functional requirements of high-efficiency toilets.
3.2. Siphon Formation and Pressure Analysis
The simulations revealed the development of the siphon effect at approximately 5 seconds into the flushing process, consistent with empirical observations for new toilets under functional testing conditions. OpenFOAM recorded a peak negative pressure of -3680 Pa in the siphon, while ANSYS Fluent recorded -5283 Pa, reflecting the transient nature of siphon formation during flushing (see Figure 5).
A comparative error analysis (Table 1) indicated an average difference of 31.15% in pressure measurements between OpenFOAM and ANSYS Fluent, with the highest discrepancies occurring during the peak siphon development phase. Despite these variations, the overall pressure trends and timing of siphon formation were consistent across both platforms, validating the reliability of CFD methods for hydraulic analysis in toilet prototyping.
3.3. Velocity Distribution in the Siphon Region
Velocity data obtained in the siphon region showed maximum velocities of 2.98 m/s for OpenFOAM and 4.76 m/s for ANSYS Fluent around 5 seconds into the flush cycle (Figure 7). The average error in velocity measurements was 21.99% between the two software platforms (Table 1). Both simulations reflected consistent transient velocity profiles within the siphon region, supporting the effective evacuation of water and waste during flushing and confirming the system’s functionality.
3.4. Comparative Analysis
Despite software-specific variations in pressure and velocity magnitudes, the timing and pattern of hydraulic phenomena such as siphon formation, surface water coverage, and flushing cycles remained consistent across platforms (Figure 6 and Figure 7). These results support the viability of CFD-based validation for sanitary products, offering accurate performance evaluations while reducing reliance on repeated physical prototyping.
Figure 6.
Pressure distribution within the siphon during the flush cycle.
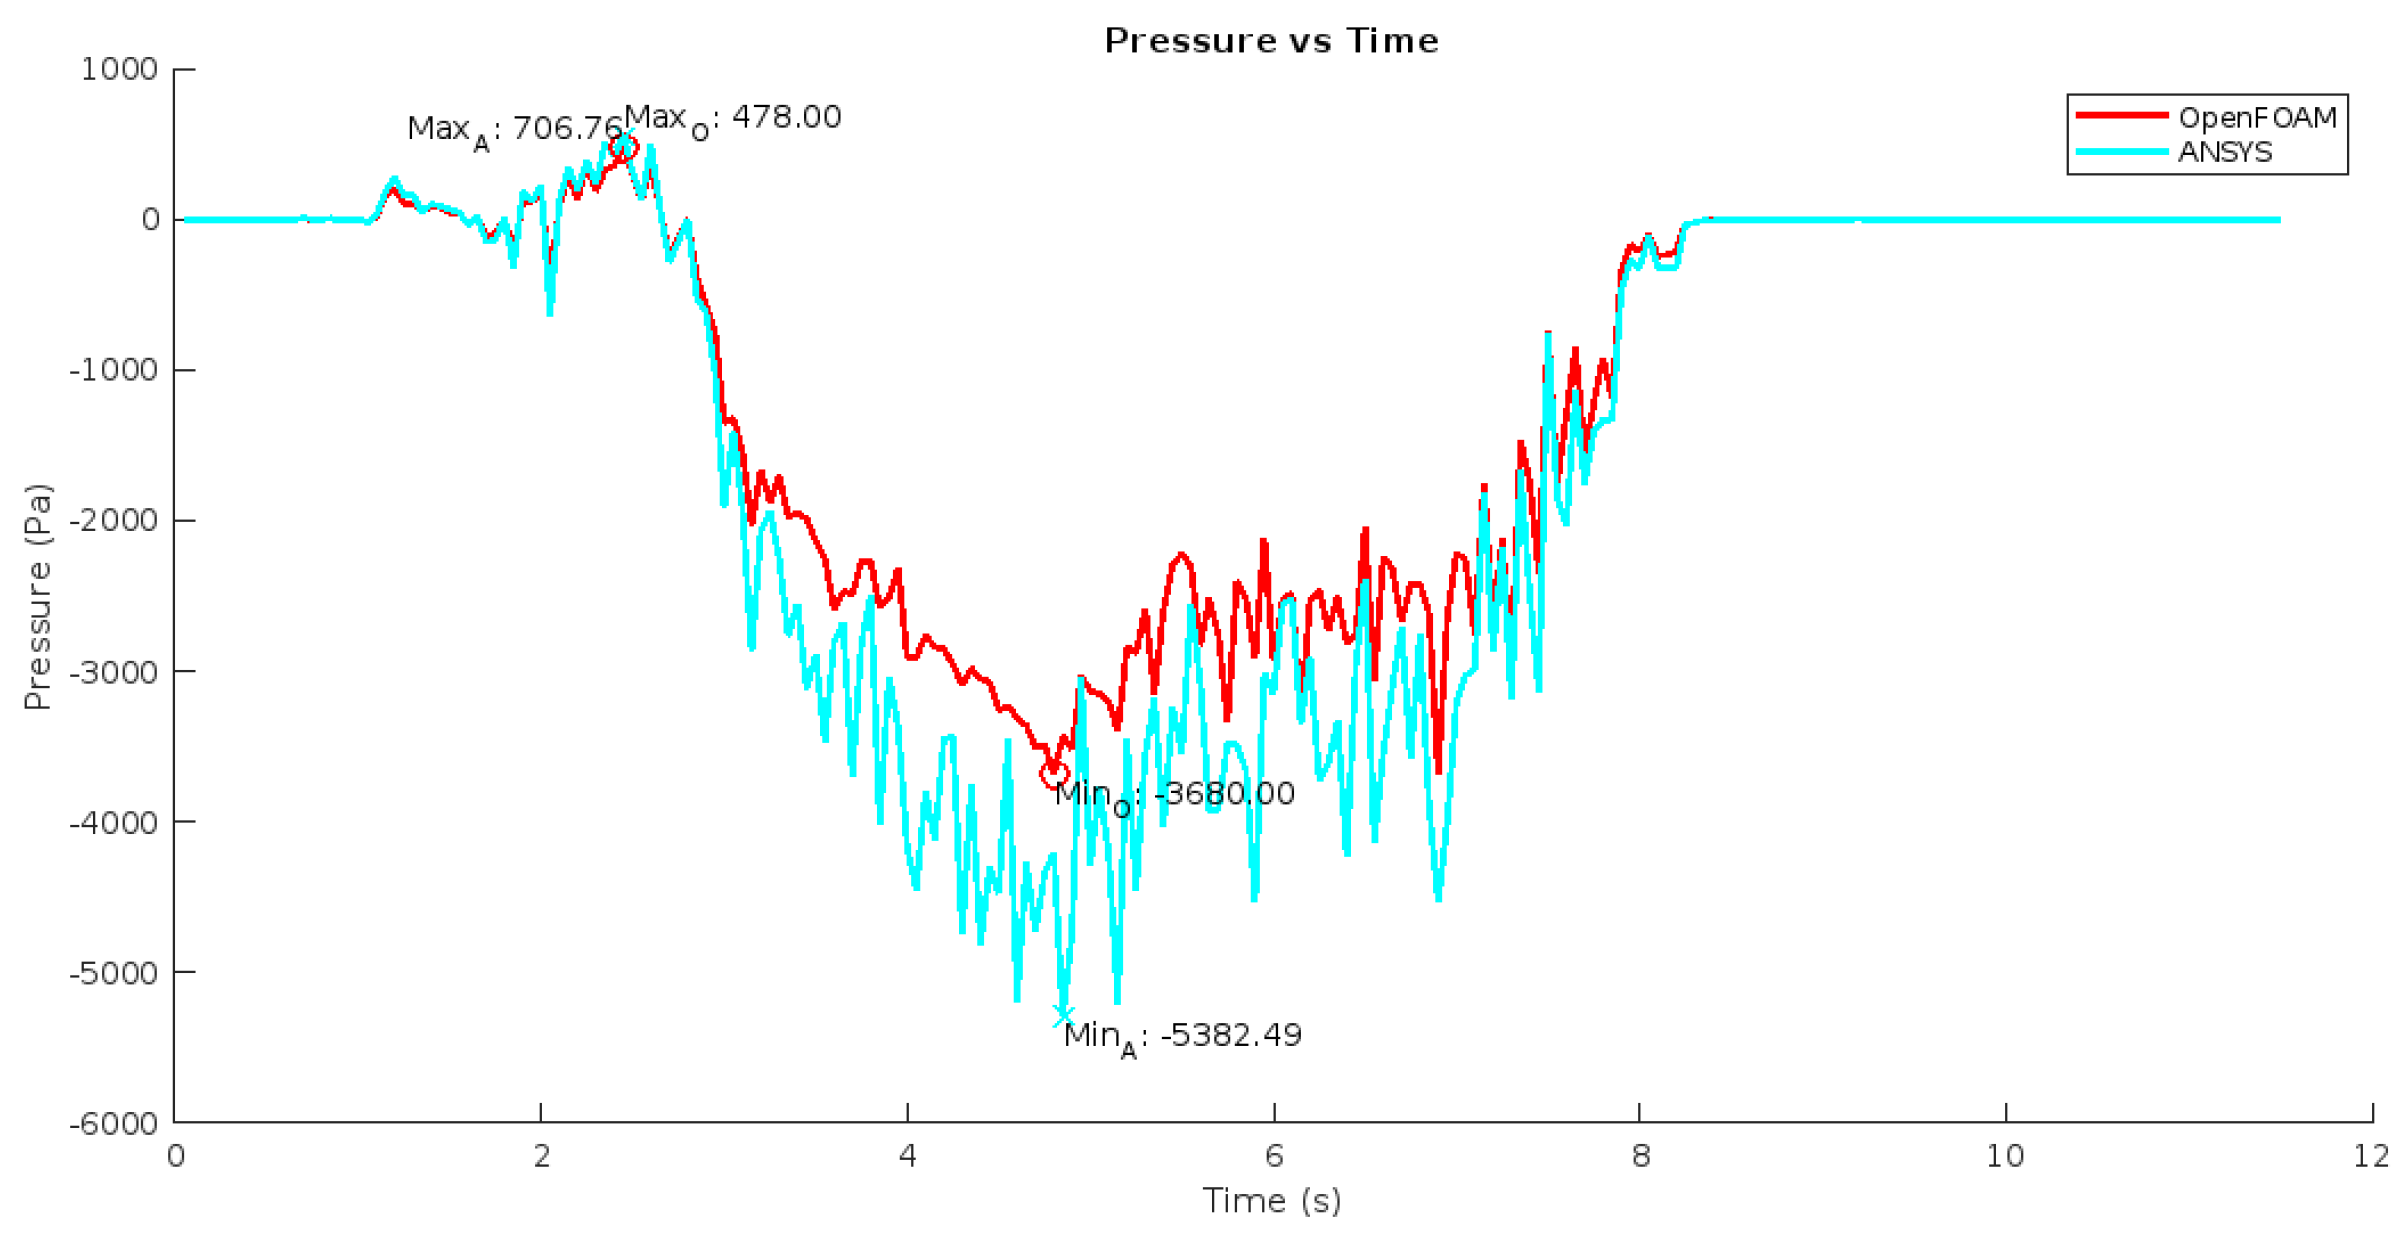
Figure 7.
Velocity profiles in the siphon region during flushing.
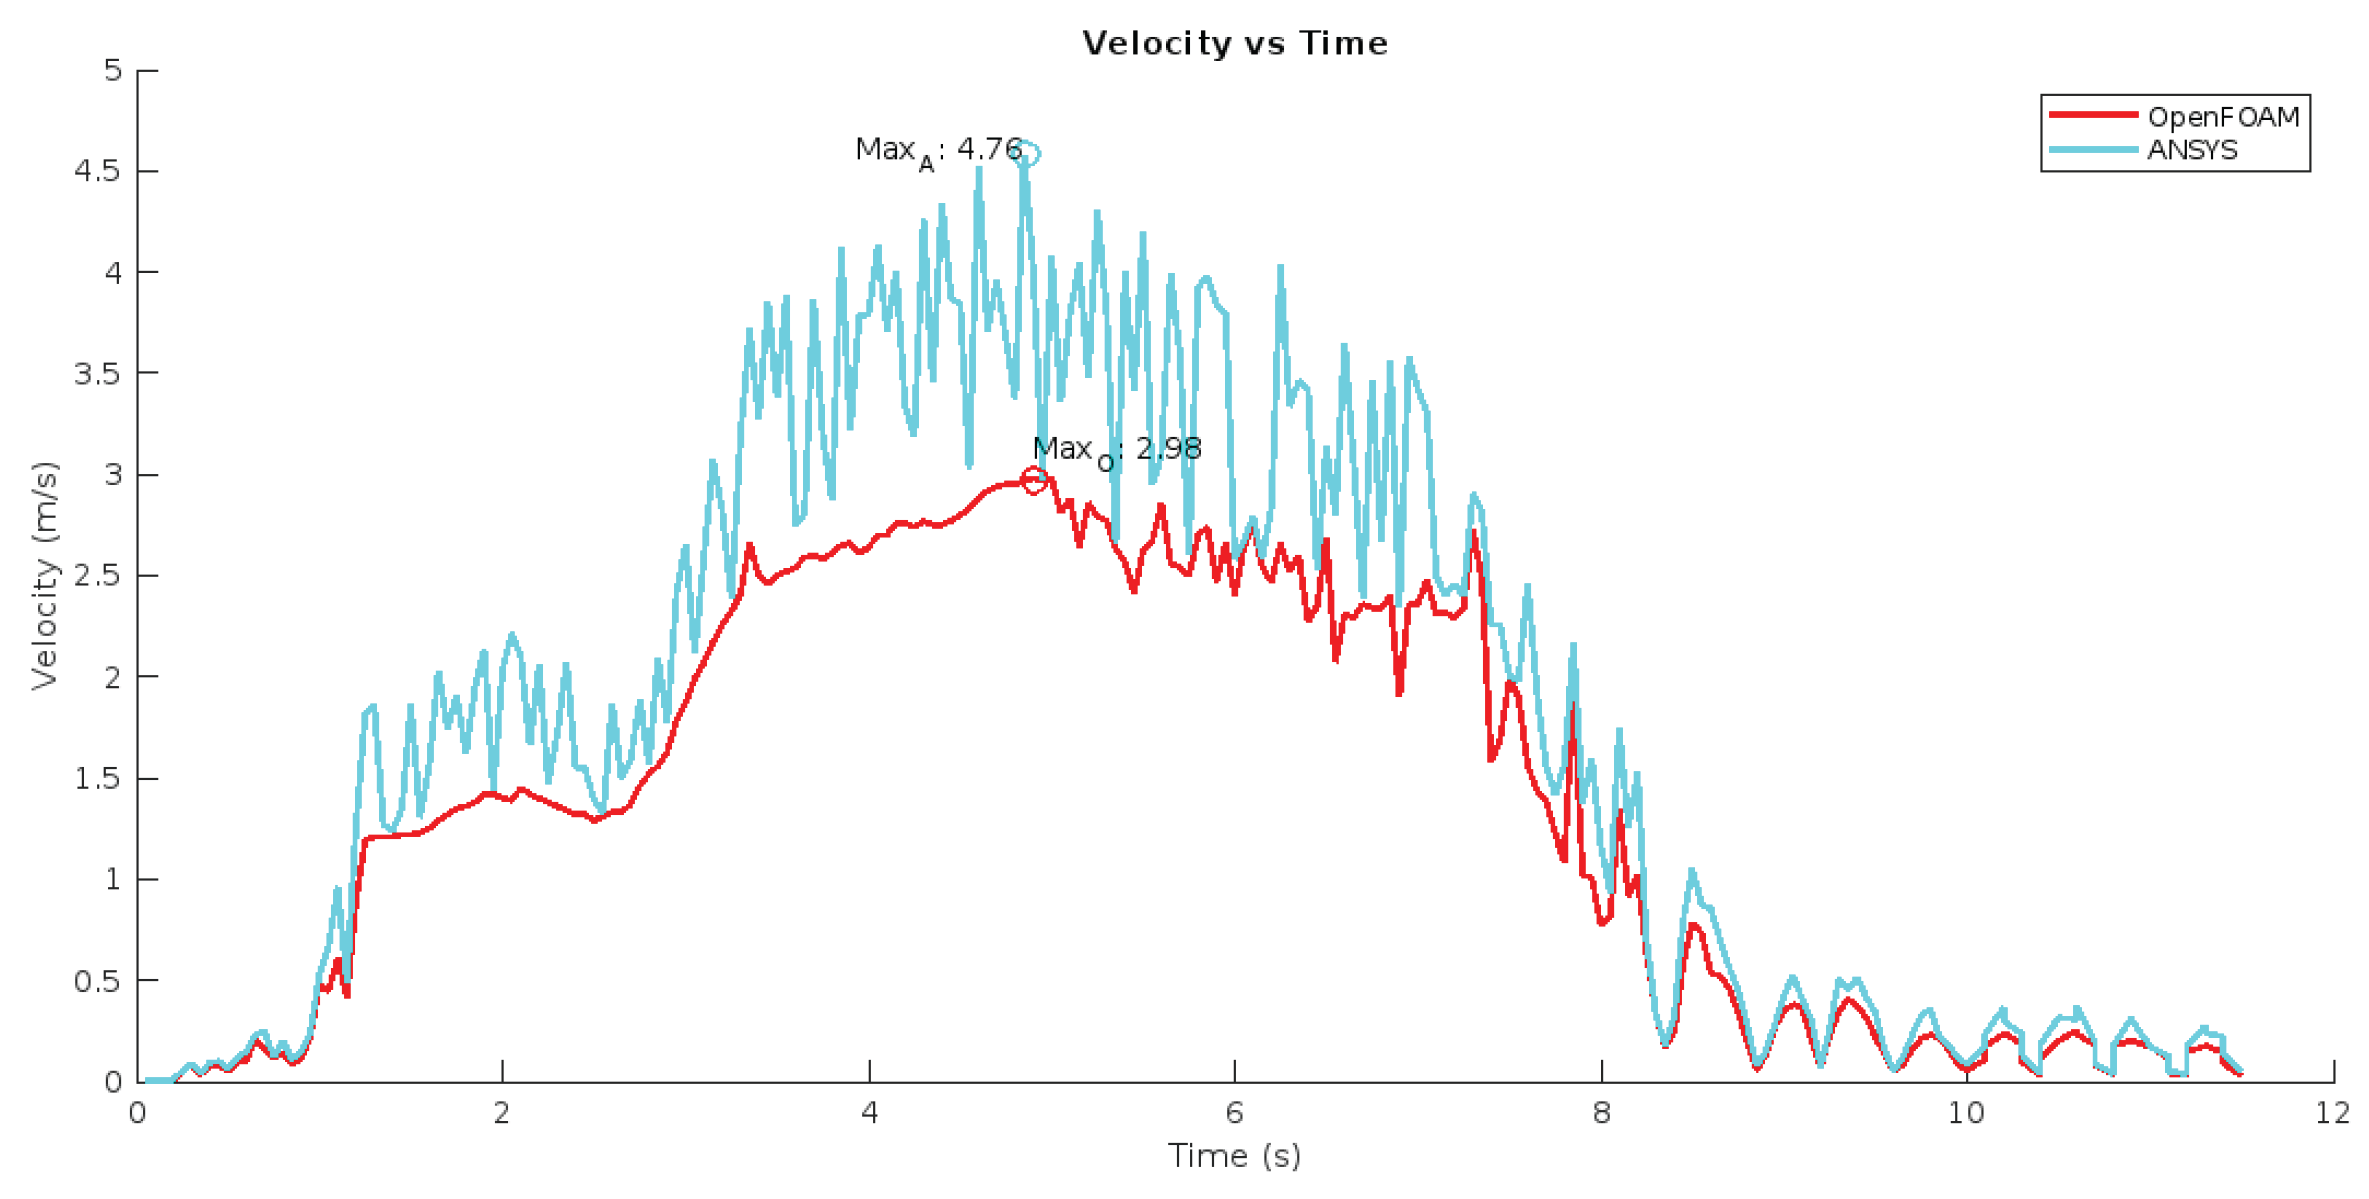
Table 2 summarizes the maximum pressures and velocities obtained during the 4.8L flush cycle using OpenFOAM and ANSYS Fluent. The results confirm the development of the siphon effect and effective water evacuation during flushing, with consistent timing across both platforms despite differences in recorded magnitudes. These data validate the hydraulic performance of the system under real operating conditions.
4. Conclusions
This study successfully validated the hydraulic performance of a 4.8L low-consumption toilet using CFD simulations in OpenFOAM and ANSYS Fluent, demonstrating their capability to capture key hydraulic phenomena such as two-phase water-air dynamics, siphon formation, and effective bowl surface coverage during flushing.
The flush cycle simulations captured the complete development of the siphon effect at approximately 5 seconds, consistent with empirical observations in functional testing of new toilets. In the siphon region, OpenFOAM recorded a peak negative pressure of approximately -3680 Pa, while ANSYS Fluent registered -5283 Pa, illustrating effective siphon action in both platforms. Maximum velocities recorded during the flush were 2.98 m/s (OpenFOAM) and 4.76 m/s (ANSYS Fluent), confirming effective water evacuation and waste removal during operation.
The mesh quality was robust, with 61.75% non-orthogonality and an average of 4.45, maintaining the stability and reliability of numerical calculations. Skewness remained within acceptable limits at 2.29, and the aspect ratio reached a maximum of 19.88, confirming the quality of the computational domain for transient hydraulic simulation.
Error analysis between the two platforms indicated an average discrepancy of 31.15% for pressure and 21.99% for velocity measurements (see Table 1), primarily during peak siphon development phases. Despite these differences in magnitude, the consistent trends and timing across platforms confirm the reliability of CFD as a validation tool for hydraulic performance in sanitary product prototyping.
Overall, this study confirms that CFD-based validation is a viable, sustainable alternative to extensive physical testing, reducing water and material waste while ensuring performance validation aligned with INEN 3082 standards. The findings support the adoption of CFD within the sanitary industry to accelerate the design and development of high-efficiency toilets while contributing to global water conservation efforts.
Author Contributions
E.S. executed the conceptualization, investigation, data analysis, and manuscript preparation and wrote the original draft; V.H.C-M. supervised, reviewed, and edited the manuscript. E.S. and V.H.C.-M have read and agreed to the published version of the manuscript.
Data Availability Statement
All data generated or analyzed during this study are included in this published article or available from the corresponding author upon reasonable request.
Conflicts of Interest
The authors declare no conflict of interest.
Abbreviations
The following abbreviations are used in this manuscript:
| CFD | Computational Fluid Dynamics |
| VOF | Volume of Fluid |
| HET | High Efficiency Toilet |
| CAD | Computer-Aided Design |
| CSF | Continuum Surface Force |
References
- INEN, “ECUATORIANA NTE INEN 3082: Aparatos Sanitarios, Requisitos y Métodos de Ensayo,” 2018, Quito.
- S. Manav, H. S. Manav, H. İ. Kemaneci, and B. Şimşir, “Comparison of Two Toilet Bowls with the use of CFD,” Journal of Fluid Flow, Heat and Mass Transfer, vol. 2023; 10. [Google Scholar] [CrossRef]
- S. Cheng et al., “Toilet revolution in China,” Journal of Environmental Management, vol. 216, pp. 347–356, Jun. 2018. [CrossRef]
- R. A. Zaied, “Development of water saving toilet-flushing mechanisms,” Applied Water Science, vol. 8, no. 20 May; 2. [CrossRef]
- I. Y. An, Y. L. I. Y. An, Y. L. Lee, E. D. Jung, and W. S. Cho, “A study on performance optimization of a toilet by measuring accumulated flow rate of a trapway,” Journal of Mechanical Science and Technology, vol. 28, no. 4, pp. 1319–1326, Apr. 2014. [Google Scholar] [CrossRef]
- J. G. Hu, Y. S. J. G. Hu, Y. S. Sun, and Z. R. Zhang, “Numerical simulation and experimental validation of three-dimensional unsteady multi-phase flow in flushing process of toilets,” Applied Mechanics and Materials, vol. 444–445, pp. 2014. [Google Scholar] [CrossRef]
- A. G. Lopes and V. Costa, “Using CFD in the design process of a toilet bowl,” Journal of Fluid Flow, Heat and Mass Transfer, vol. 0, p. 2018. [CrossRef]
- Y. Song, L. Y. Song, L. Wang, J. Wang, and H. Li, “CFD simulation and experimental study of water-saving toilet flushing performance,” Water, vol. 12, no. 5, p. 20 May 1325. [Google Scholar] [CrossRef]
- S. Zhou, X. S. Zhou, X. Zhang, Z. Zhang, and H. Huang, “Numerical simulation of transient water-air two-phase flow in the flushing process of water-saving toilets,” Journal of Hydrodynamics, vol. 29, no. 6, pp. 998–1005, Dec. 2017. [Google Scholar] [CrossRef]
- H. Jeong, J. H. Jeong, J. Lee, and J. Kim, “Numerical Analysis of Water Flow Characteristics in a Toilet Using CFD,” International Journal of Environmental Research and Public Health, vol. 16, no. 14, p. 2535, Jul. 2019. [Google Scholar] [CrossRef]
- T. Yamamoto, S. T. Yamamoto, S. Takahashi, and M. Murakami, “Water-saving effect of a newly developed siphon jet toilet system analyzed by numerical simulation,” Journal of Water and Environment Technology, vol. 19, no. 5, pp. 357–367, Oct. 2021. [Google Scholar] [CrossRef]
- H. Kim, D. H. H. Kim, D. H. Lee, and S. H. Lee, “Optimization of flushing performance and water consumption of toilets using numerical simulation and experimental validation,” Journal of Building Engineering, vol. 46, p. 103745, Feb. 2022. [Google Scholar] [CrossRef]
- S. Hong, K. S. Hong, K. Park, and H. Lee, “CFD Analysis of Two-Phase Flow Characteristics in Toilet Flushing Systems for Water Conservation,” Sustainability, vol. 12, no. 12, p. 4869, Jun. 2020. [Google Scholar] [CrossRef]
- Y. Lei, C. Y. Lei, C. Wang, and Y. Ji, “Simulation study of two-phase flow in the siphon pipeline,” in Advanced Mechanical Science and Technology for the Industrial Revolution 4.0, pp. 2018. [Google Scholar] [CrossRef]
Figure 1.
CAD geometry and high-refinement mesh of the 4.8L low-consumption toilet generated for CFD simulation.
Figure 1.
CAD geometry and high-refinement mesh of the 4.8L low-consumption toilet generated for CFD simulation.
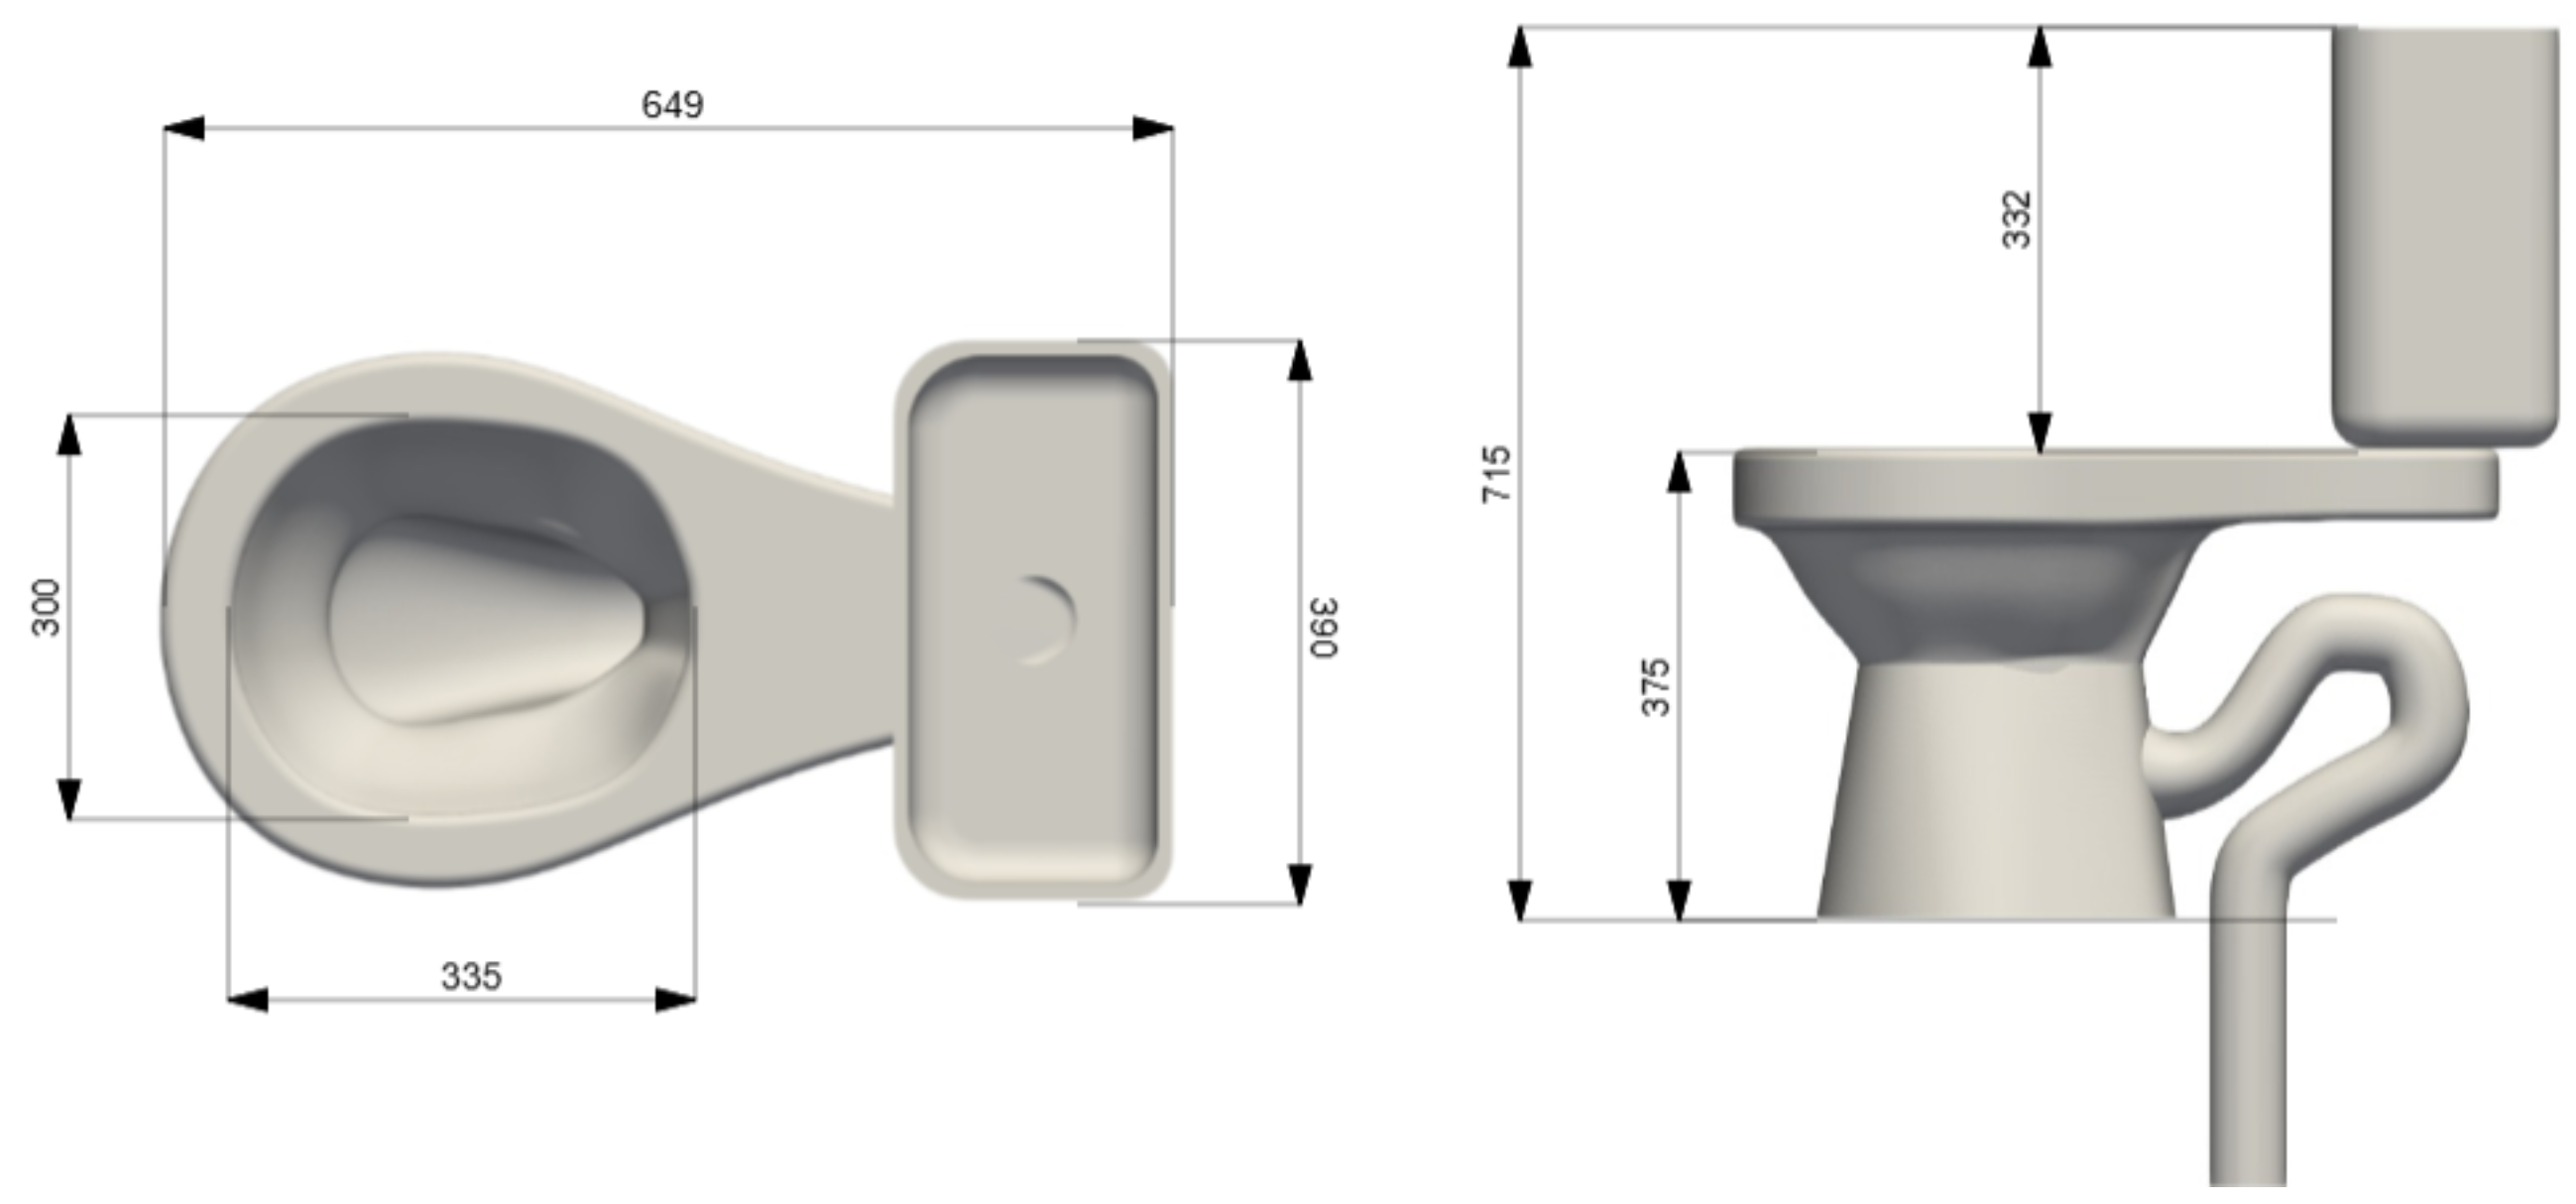
Figure 2.
Simulation setup illustrating boundary conditions and volume of control for the flushing process.
Figure 2.
Simulation setup illustrating boundary conditions and volume of control for the flushing process.
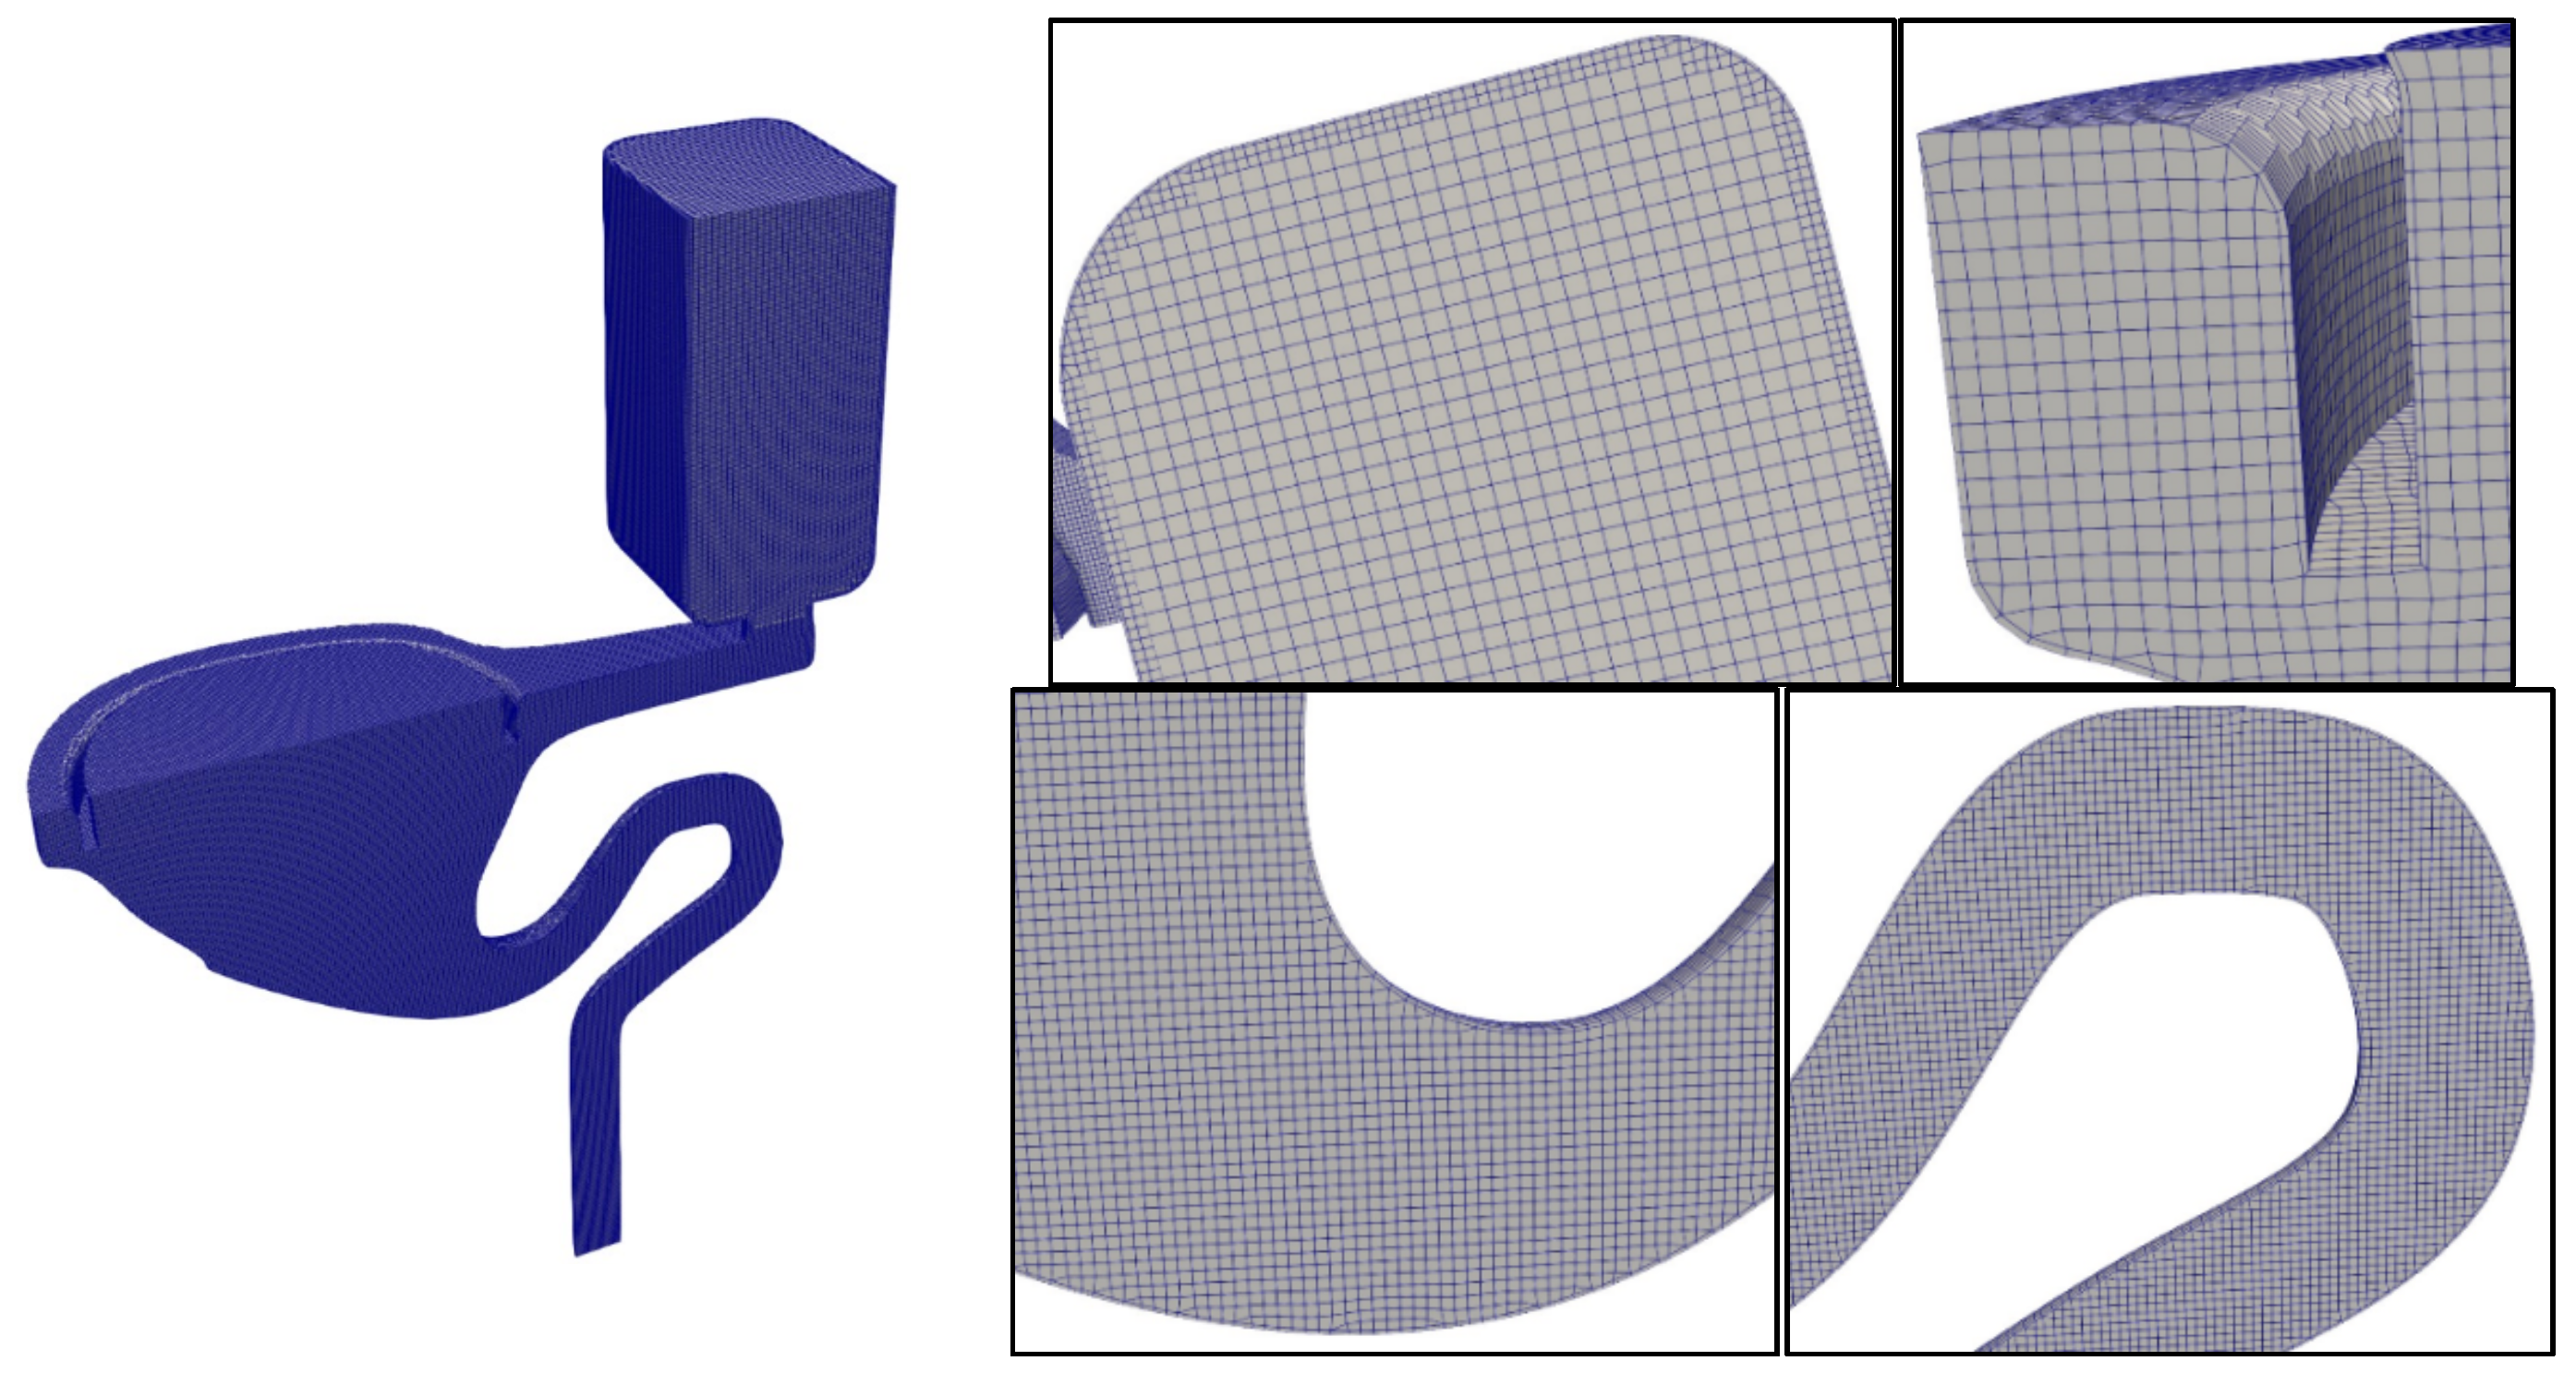
Figure 3.
Snapshots of the simulation results showing water distribution and pressure fields within the toilet bowl and siphon during flushing. (1) A pressure inlet as Open Channel, (2) Pressure outlet, (3) A symmetry boundary condition, (4) Outlet for the mixture volume discharge.
Figure 3.
Snapshots of the simulation results showing water distribution and pressure fields within the toilet bowl and siphon during flushing. (1) A pressure inlet as Open Channel, (2) Pressure outlet, (3) A symmetry boundary condition, (4) Outlet for the mixture volume discharge.
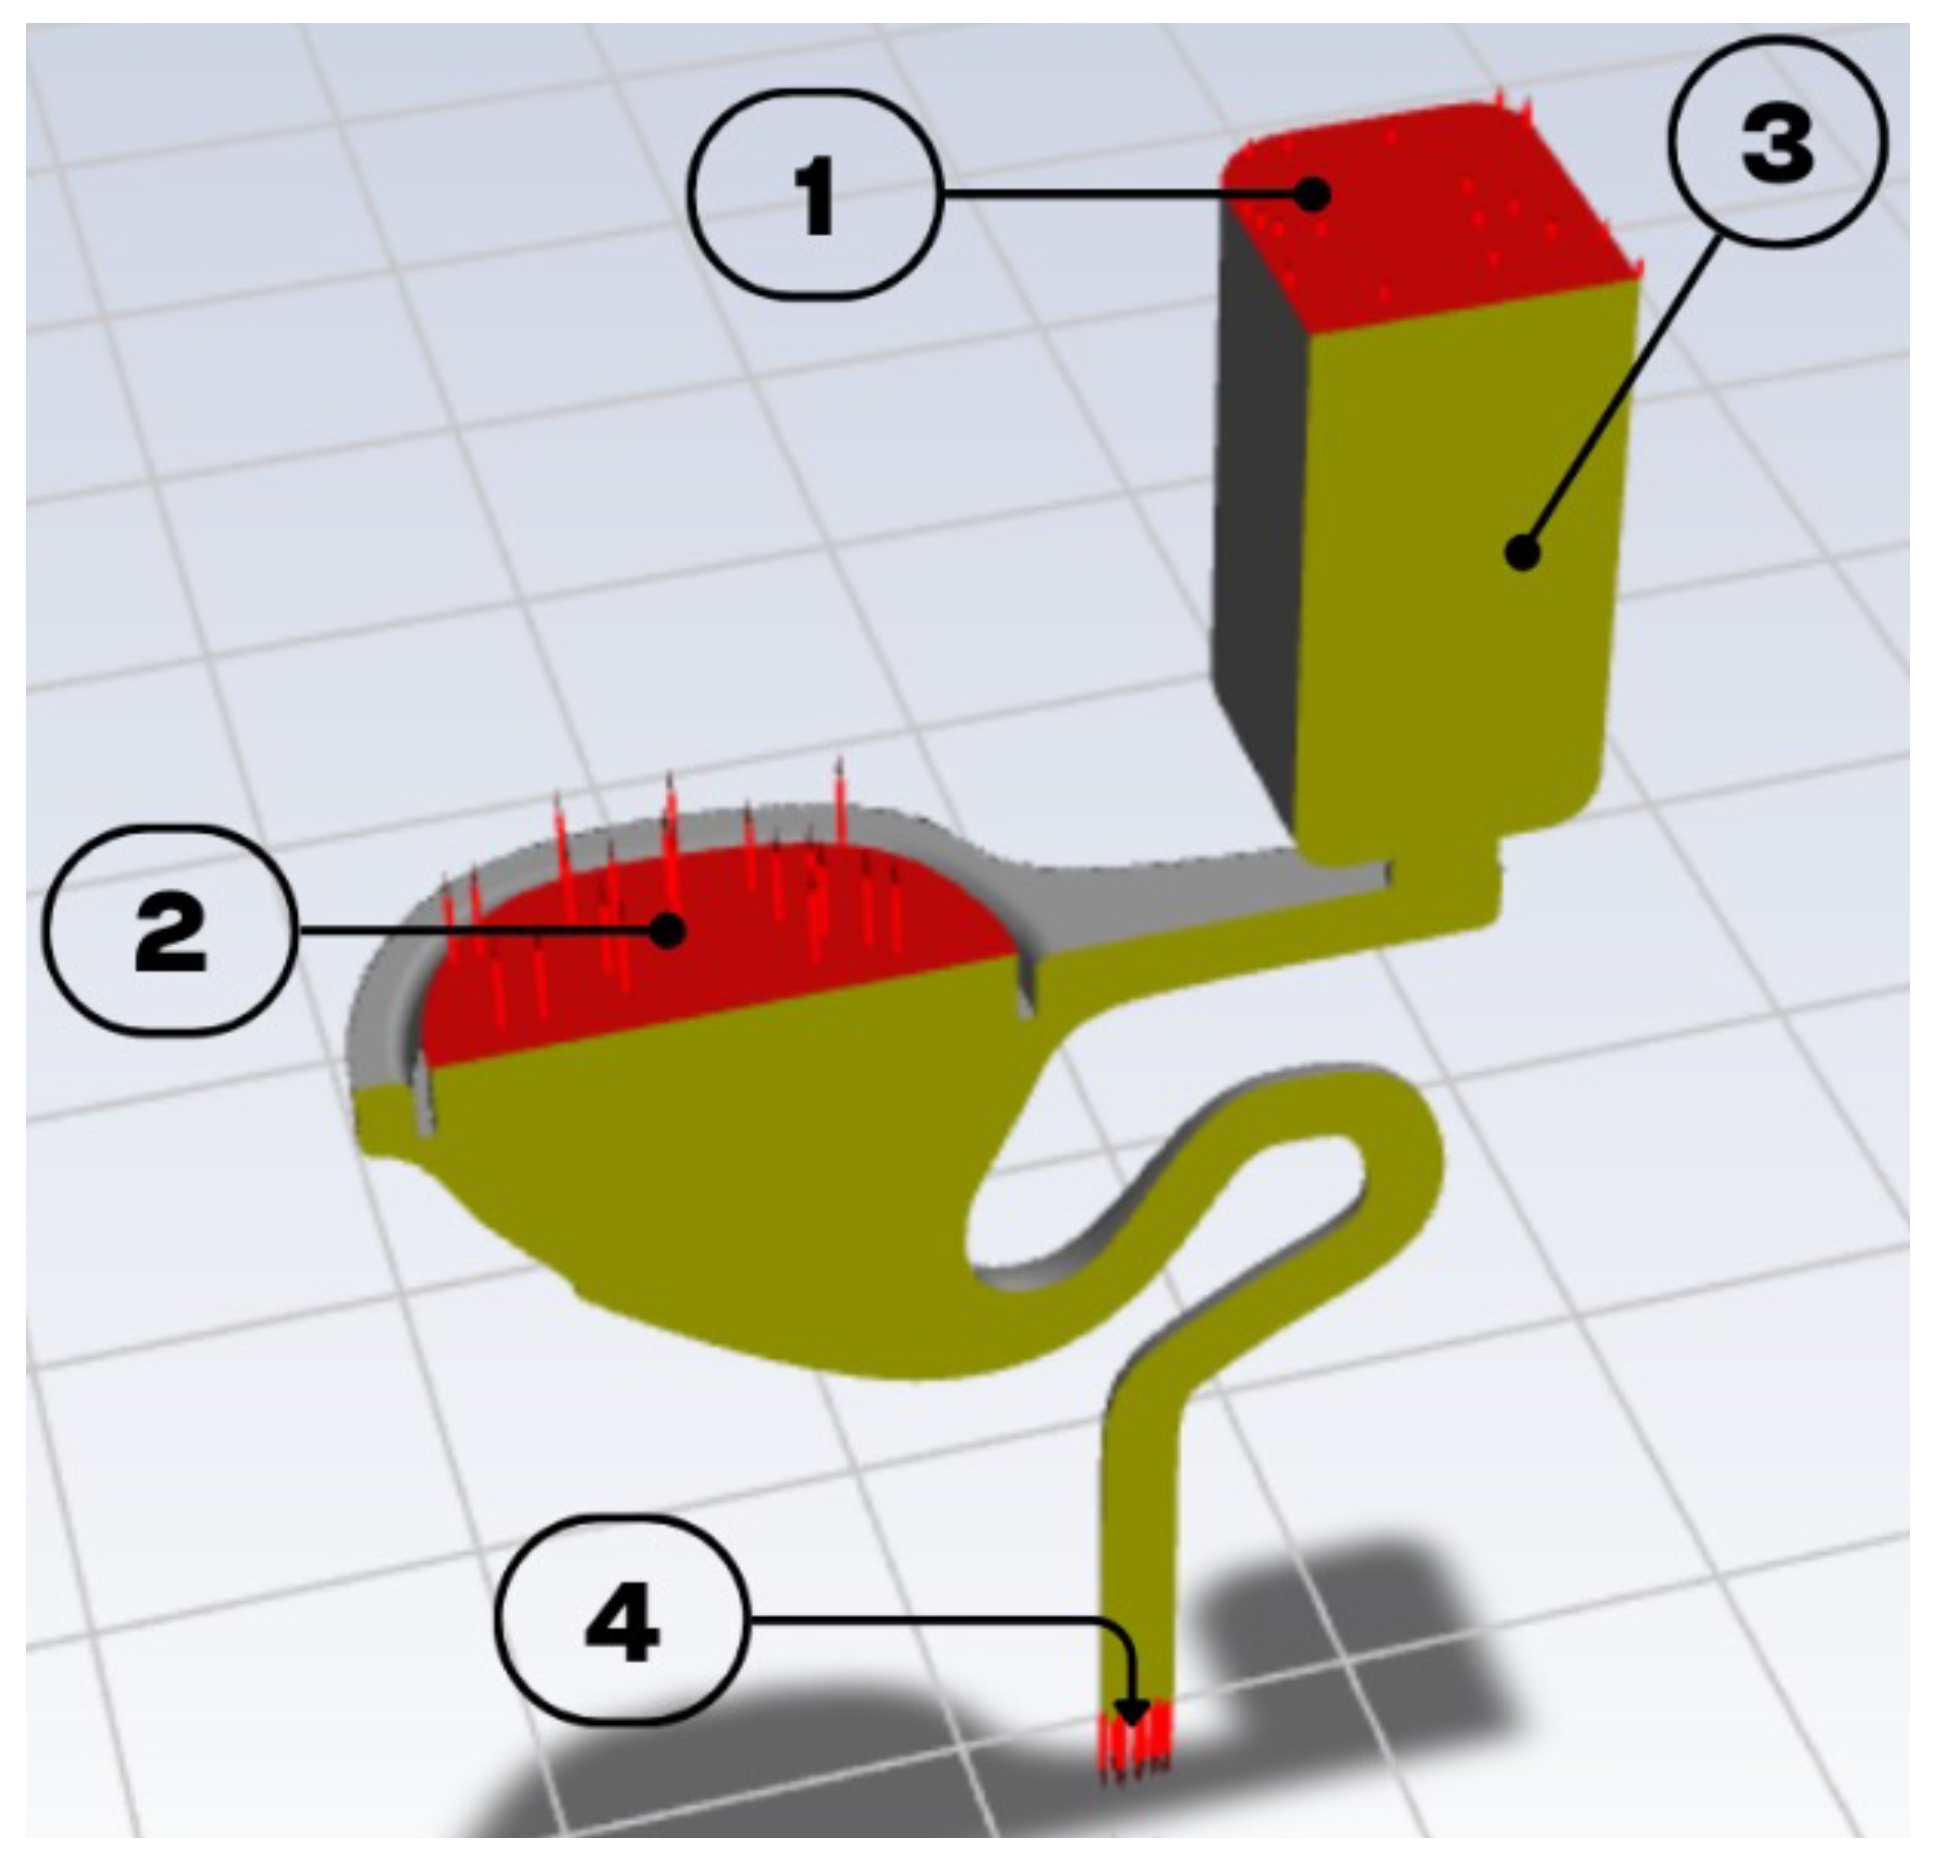
Figure 4.
Volume fraction distribution showing water coverage during flushing.
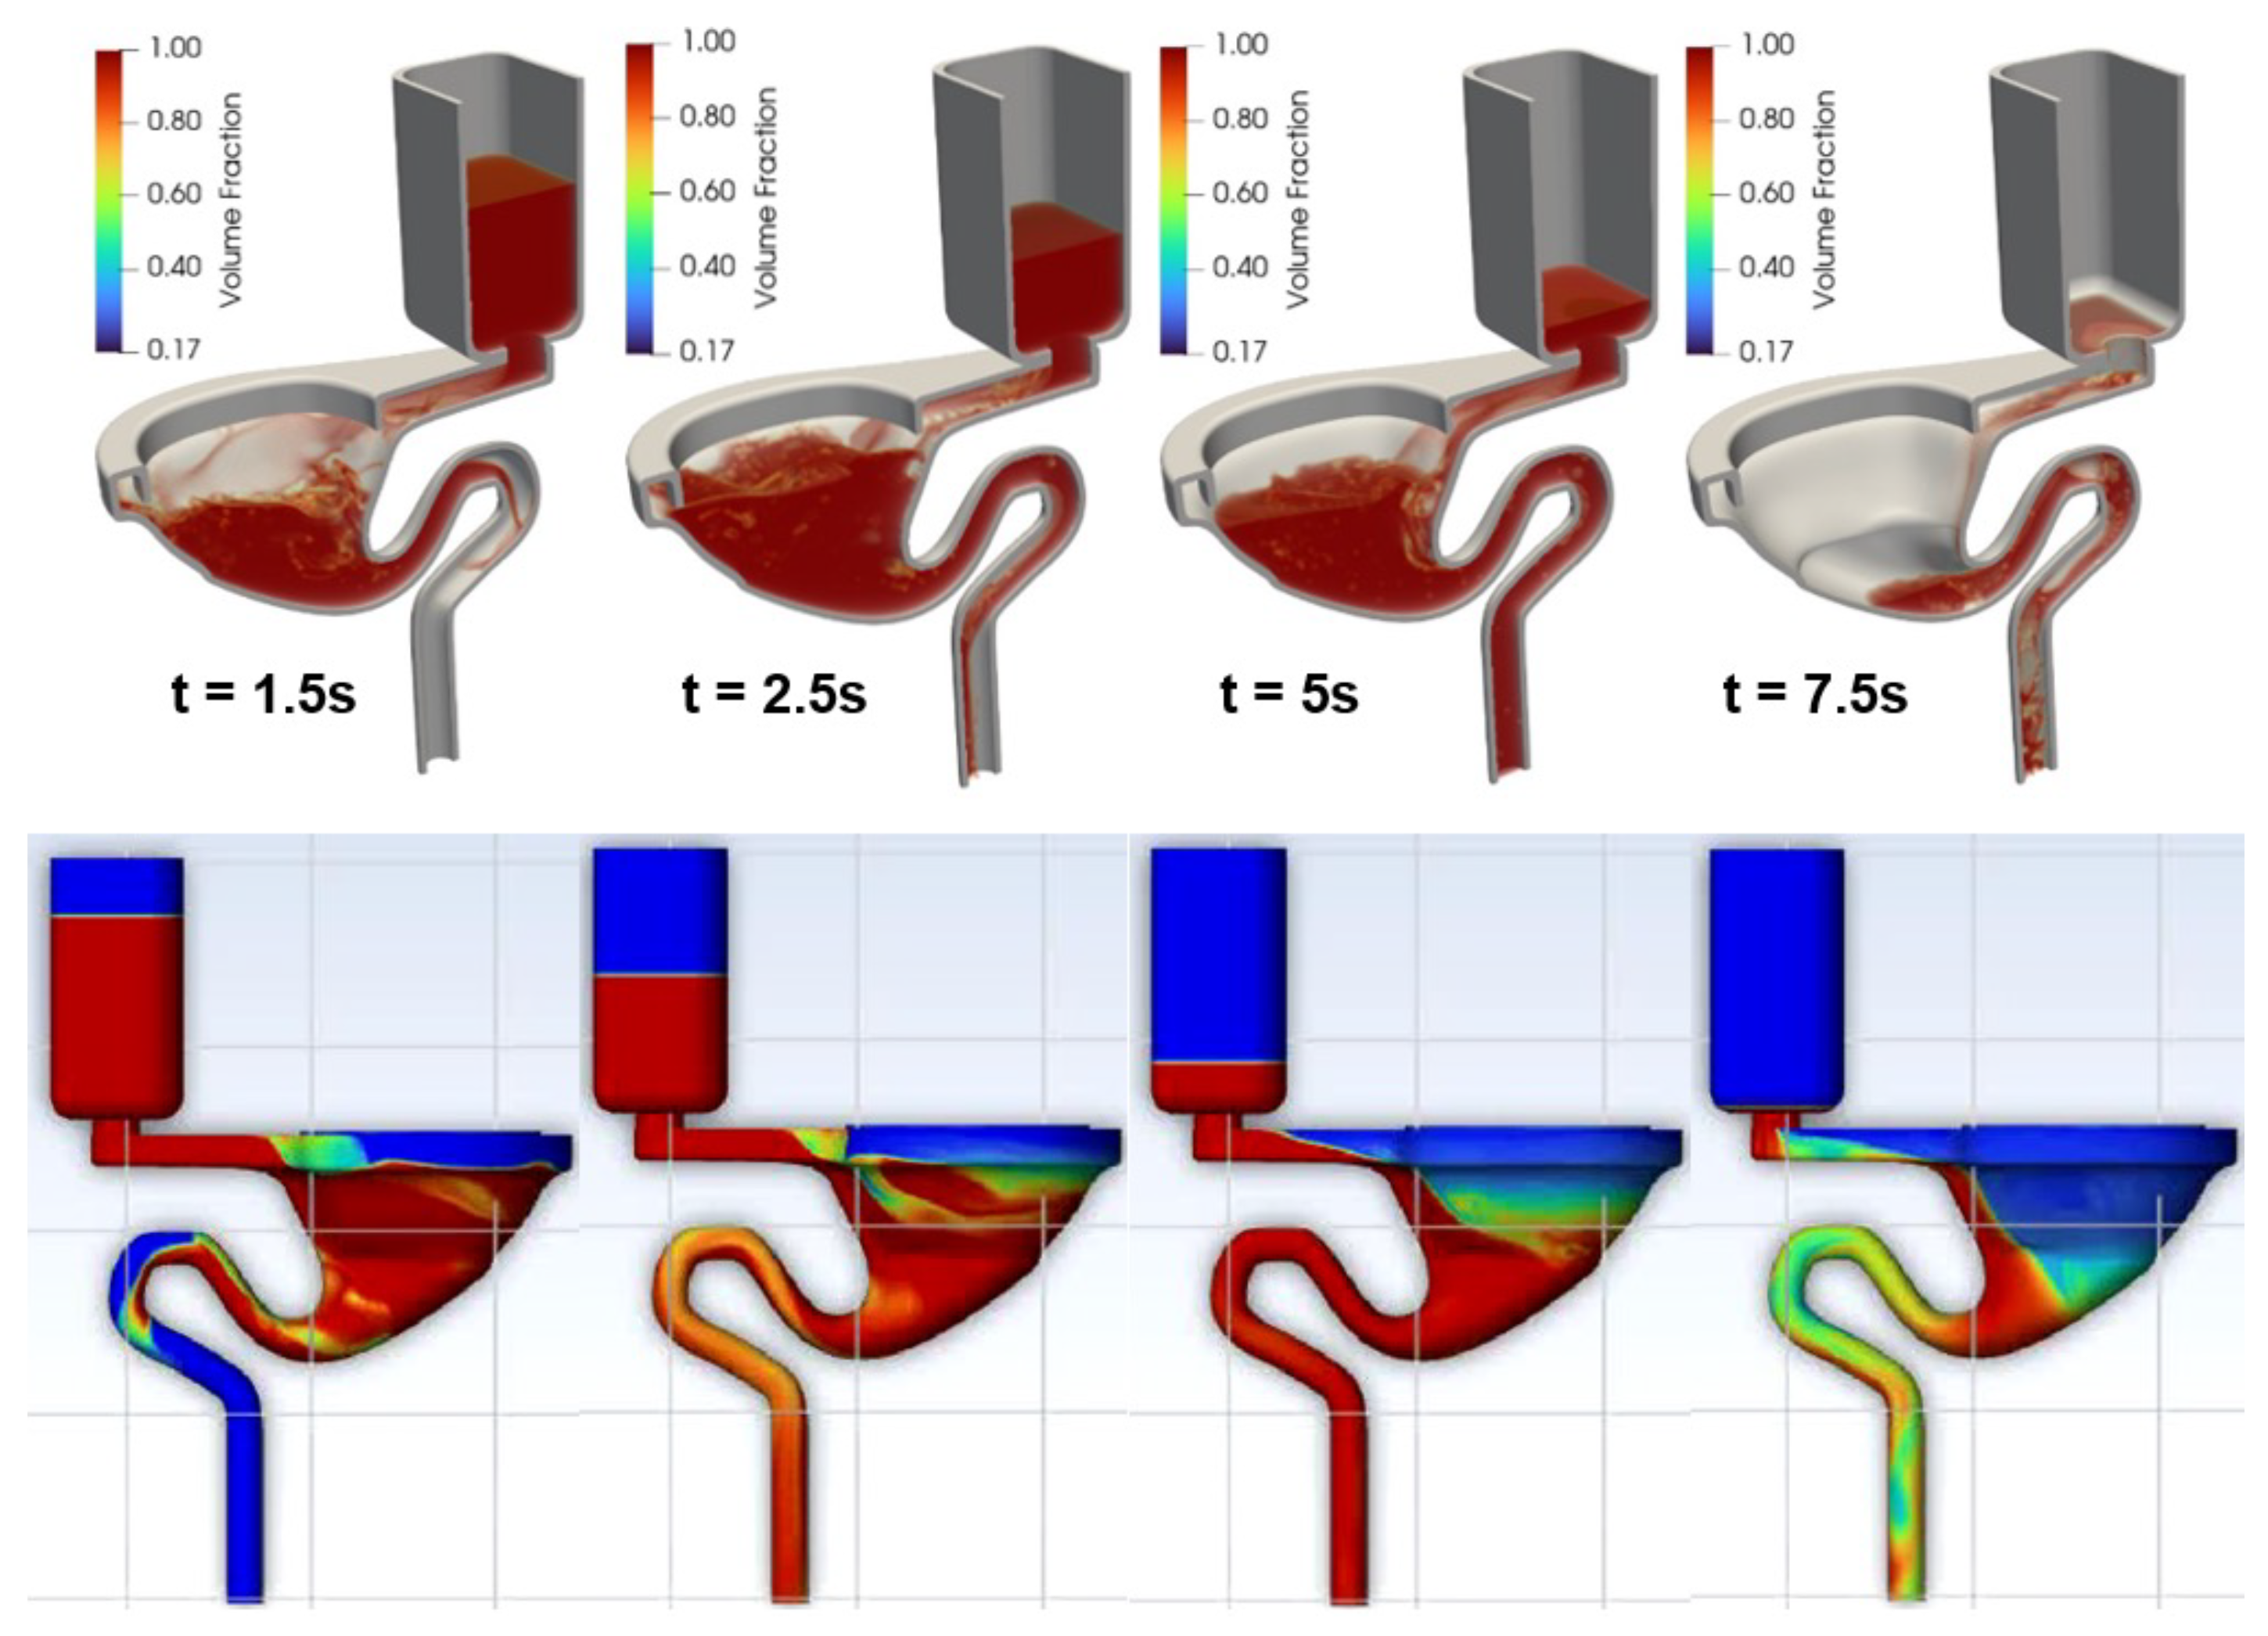
Figure 5.
Pressure distribution within the siphon during the flush cycle.
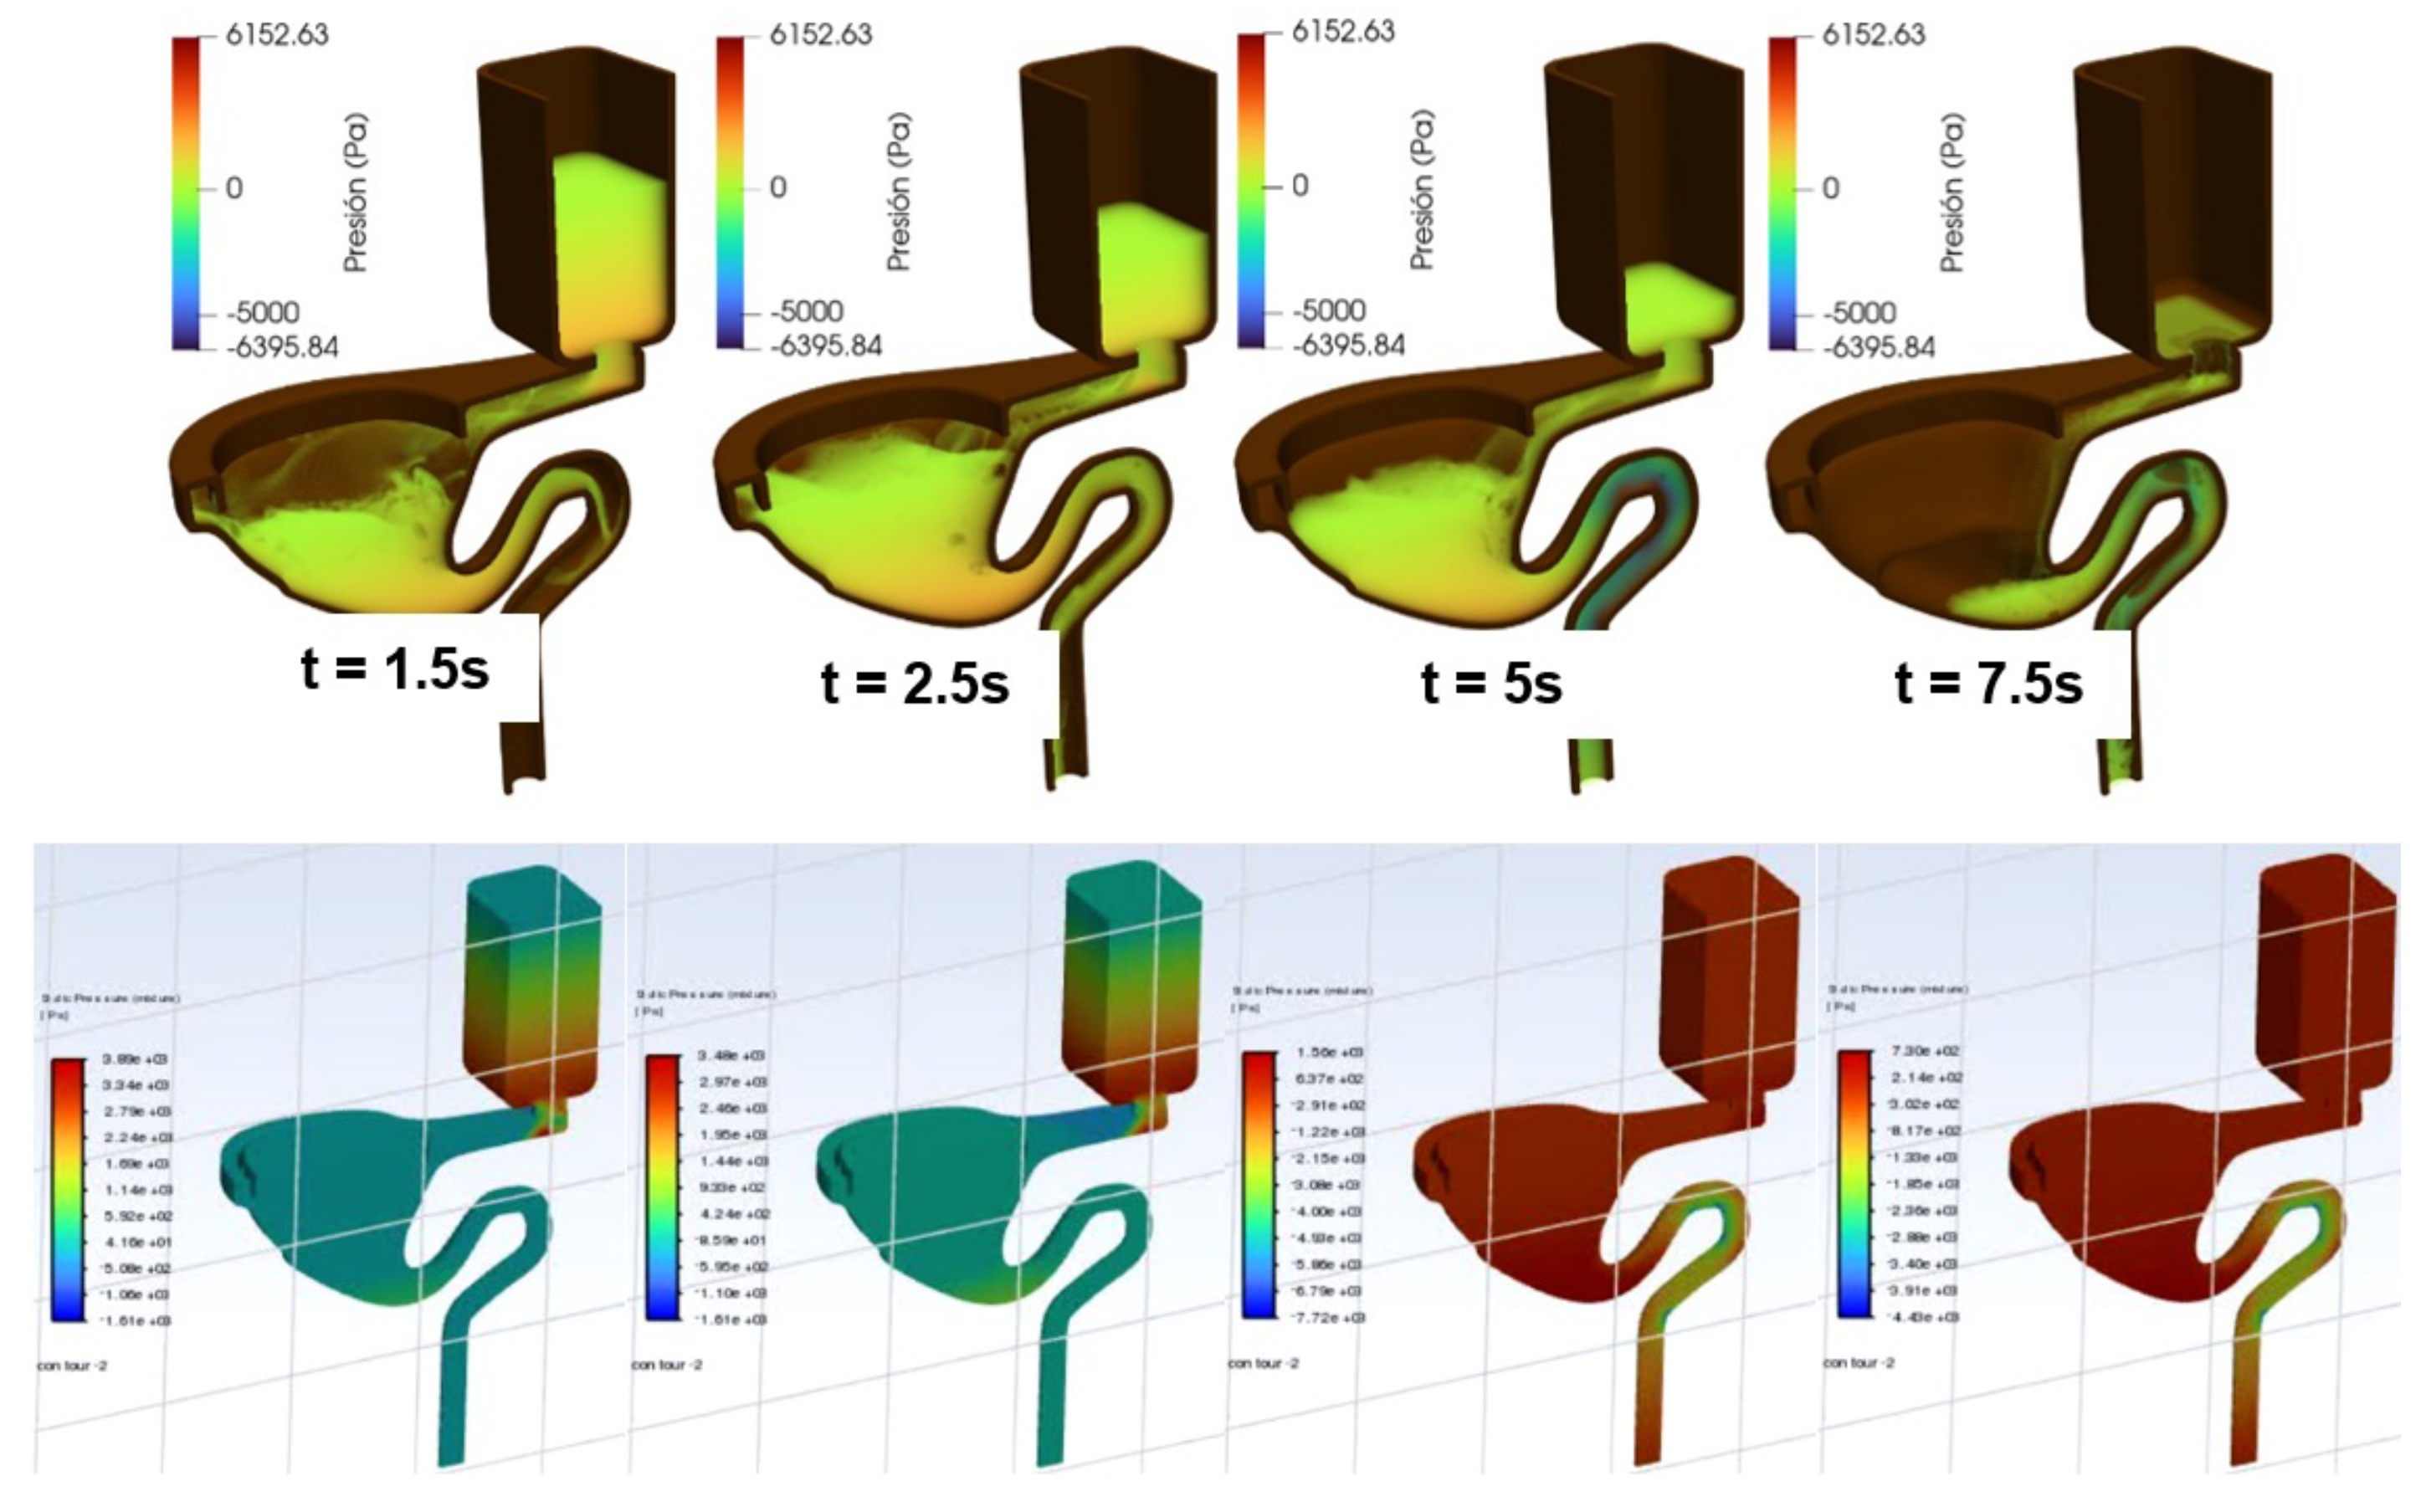

Table 1.
Errores entre ANSYS y OpenFOAM en magnitudes de velocidad y presión durante la simulación.
| Magnitud | Error Máximo | Tiempo | Error Mínimo | Tiempo | Error Promedio |
|---|---|---|---|---|---|
| Velocidad | 37.39 % | 8.40 s | 0.09 % | 11.30 s | 21.99 % |
| Presión | 59.47 % | 7.85 s | 0.26 % | 11.50 s | 31.15 % |
Table 2.
Summary of maximum pressures and velocities obtained during the 4.8L flush cycle in OpenFOAM and ANSYS Fluent.
Table 2.
Summary of maximum pressures and velocities obtained during the 4.8L flush cycle in OpenFOAM and ANSYS Fluent.
| Measurement | OpenFOAM | ANSYS Fluent |
|---|---|---|
| Maximum Pressure (Pa) | -3680 | -5283 |
| Time of Maximum Pressure (s) | 5.0 | 5.0 |
| Maximum Velocity (m/s) | 2.98 | 4.76 |
| Time of Maximum Velocity (s) | 5.0 | 5.0 |
Disclaimer/Publisher’s Note: The statements, opinions and data contained in all publications are solely those of the individual author(s) and contributor(s) and not of MDPI and/or the editor(s). MDPI and/or the editor(s) disclaim responsibility for any injury to people or property resulting from any ideas, methods, instructions or products referred to in the content. |
© 2025 by the authors. Licensee MDPI, Basel, Switzerland. This article is an open access article distributed under the terms and conditions of the Creative Commons Attribution (CC BY) license (http://creativecommons.org/licenses/by/4.0/).
Copyright: This open access article is published under a Creative Commons CC BY 4.0 license, which permit the free download, distribution, and reuse, provided that the author and preprint are cited in any reuse.


