

Submitted:
24 July 2025
Posted:
24 July 2025
You are already at the latest version
Abstract
The behavioral theory of the firm offers a robust framework for explaining how firms react to performance feedback. However, less is known about how firms integrate backward-looking performance feedback with forward-looking assessments of market opportunity when making market retrenchment decisions. To address this gap, this study investigates how the interaction between market share performance and market attractiveness shapes retrenchment decisions, using prefecture-level data from Japanese life insurance companies (2006–2019). The findings reveal that market attractiveness substantially moderates a firm's response to gaining or losing market share. In attractive markets, share gains and losses alike are associated with reduced retrenchment, as firms are motivated to invest in addressing challenges or capitalizing on success. Conversely, in unattractive markets, either outcome is linked to greater retrenchment, indicating a strategy of withdrawal. The paper contributes to the behavioral theory of the firm by demonstrating that market attractiveness acts as a cognitive filter. This filter shapes the interpretation of performance feedback, ultimately determining whether a firm responds to performance changes by increasing or decreasing its market withdrawal. The results also suggest a structured way for managers to approach retrenchment, prompting critical questions about resource allocation that help distinguish rational analysis from common behavioral biases.
Keywords:
bounded rationality
; cognitive filter
; resource allocation
; attention-based view
; performance feedback
; regional market
; Japanese life insurance companies
1. Introduction
Managers frequently make strategic resource
allocation decisions by choosing from multiple options under conditions of
uncertainty. The behavioral theory of the firm offers valuable insights into
these processes (Cyert & March, 1963). Some research within this framework
conceptualizes market share as an indicator of overall firm performance,
demonstrating that deviations from aspiration levels influence subsequent
corporate actions such as inter-firm network formation (Baum et al., 2005),
firm growth (Greve, 2008), and new product introduction (Joseph & Gaba,
2015). Separately, Greve (1998) treated regional market share as a reflection
of market position, showing that changes in this position relative to
aspiration levels drive subsequent organizational change. Such responses occur
because boundedly rational managers often simplify their assessment of market
performance, frequently converting it into measures of market share gains or
losses (Cyert & March, 1963). Consequently, firms tend to be more motivated
to initiate organizational change when their market share falls below their
aspiration levels. Conversely, exceeding these aspirations can lead to
satisficing with the current situation and reduced extent of change (Jordan
& Audia, 2012). In parallel, research has indicated that shifts in regional
market attractiveness can stimulate subsequent market expansion efforts by
firms (Barreto, 2012).
While grounded in the behavioral theory of the
firm, prior research has primarily focused on how backward-looking performance
feedback, such as a change in market share, triggers problem-driven search and
organizational change. A complementary perspective suggests that firms are also
guided by opportunity-driven search, where forward-looking assessments of a
market's potential shape strategic choices. Although Barreto (2012)
demonstrated that market attractiveness stimulates expansion, this perspective
has not been applied to retrenchment decisions, and the interaction at the
market level between attractiveness and performance feedback remains
underexplored.
This separation in the literature creates a
theoretical tension and a practical dilemma. Managers rarely evaluate
performance feedback in isolation. Instead, they must reconcile conflicting
signals: does a loss in market share signal a need to maintain its commitment
in a promising market, or does it confirm the wisdom of market retrenchment
from an unpromising one? Similarly, does a gain in market share signal an
opportunity to capitalize on success, or does it present a strategic window to
harvest profits before exiting the market? The behavioral theory of the firm
currently offers insufficient guidance on how managers resolve this ambiguity.
This study addresses this gap by developing and
testing a model that examines how the interplay between these two signals
influences a firm's market retrenchment decisions. Research grounded in the
behavioral theory of the firm has largely focused on proactive behaviors such
as risk-taking, innovation, mergers and acquisitions, and strategic change
(Shinkle, 2011). However, the dynamics of market retrenchment remain less
understood, with a few notable exceptions. For instance, Shimizu (2007)
analyzed the divestment of previously acquired units, and Vidal and Mitchell
(2015) examined how performance feedback influences divestitures. This
theoretical lens has recently been applied to other forms of strategic
withdrawal, such as the reshoring of manufacturing activities, demonstrating
that non-financial metrics like environmental performance can also trigger
these decisions (Zhang et al., 2023). Although allocating excessive resources
to a market can lead to inefficiencies (Arrfelt et al., 2013), managers may
hesitate to withdraw because such actions compel them to acknowledge prior
human or financial losses (Staw, 1976). This managerial tension highlights the
need for a clearer theoretical framework. Accordingly, this study investigates
which market signals managers focus on, how they interpret these signals, and
how the interaction between these interpretations shapes market retrenchment
decisions.
The analysis reveals that the influence of changes
in market share on market retrenchment is not uniform but contingent on the
level of market attractiveness. This interplay leads to distinct market retrenchment
under varying market appeal and performance conditions. For example, in markets
of average attractiveness, neither a market share gain nor loss had a clear
effect on retrenchment decisions. Large losses and gains in market share are
associated with less retrenchment in highly attractive markets. Conversely, in
markets with low attractiveness, substantial losses and gains are associated
with more retrenchment. These findings underscore that life insurance
companies, when evaluating regional market retrenchment, consider not only
changes in their market share but also the attractiveness of the specific
region, leading to complex decision-making patterns.
2. Theory and Hypotheses
2.1. The Behavioral Theory of the Firm
The behavioral theory of the firm provides a
foundational framework for understanding how organizations make strategic
decisions under conditions of uncertainty. At its core, the theory posits that
managers operate with bounded rationality, simplifying complex problems and
often converting performance assessments into straightforward metrics like
market share gains or losses to guide their actions. Central to the behavioral
theory of the firm is the concept of "performance feedback," where
firms evaluate their actual performance against aspiration levels—defined as
"the smallest outcome that would be deemed satisfactory by the decision
maker" (Schneider, 1992, p. 1053). These aspirations can be historical
(based on the firm's own past performance) or social (based on the performance
of competitors). Deviations from these aspiration levels are primary drivers of
organizational change and resource allocation strategies.
When performance falls below the aspiration level,
it triggers a "problemistic search" for solutions. This
dissatisfaction motivates firms to undertake change and corrective actions to
improve performance. Recent research has further disentangled this search
process, distinguishing between "problem-defining" search, aimed at
diagnosing the cause of a shortfall, and "solution-generating"
search, focused on finding remedies (van der Voet, 2023). Conversely, when
performance exceeds the aspiration level, it can lead to
"satisficing," where managers are content with the current situation,
reducing the impetus for significant change. Exceeding targets can also generate
organizational slack, which may enable "slack-driven
search"—experimentation and the pursuit of novel opportunities.
This framework applies to both broad, overall firm
goals, such as return on assets (ROA) and firm size, and more specific action
goals (Kim et al., 2015), such as performance in a particular business unit or
regional market. According to the attention-based view, an extension of the
behavioral theory of the firm, organizations simplify decision-making by
selectively focusing managerial attention on salient issues, such as
performance shortfalls or significant market opportunities. While much research
has used the behavioral theory of the firm to explain proactive behaviors like
innovation and strategic change, its application to retrenchment and strategic
reduction is a growing area of inquiry. For example, recent studies have
applied the theory to explain firms' decisions regarding the reshoring of
manufacturing activities based on environmental performance feedback (Zhang et
al., 2023) and the reduction of environmental, social, and governance (ESG)
disclosures in response to negative financial performance (Seow, 2025). This
study applies these core principles to understand the decision-making processes
behind market retrenchment.
2.2. Market Attractiveness as a Cognitive Heuristic: An Attention-Based View
To understand how market
attractiveness influences market retrenchment, this study draws on the
attention-based view of the firm, which posits that managerial attention is a
scarce resource and that organizational actions are a function of where
decision-makers focus their attention. In a multi-market environment,
managers cannot attend to all stimuli equally; they rely on simplifying
cognitive heuristics to determine which issues are most salient. Following Barreto (2012),
this study posits that market attractiveness serves as such a heuristic. High
attractiveness makes a regional market highly salient and frames it as a
valuable, goal-congruent opportunity worthy of attention and resources. Low
attractiveness, in contrast, frames a market as a less promising opportunity,
prompting consideration for resource reallocation.
More critically, the study extends this logic by
proposing that market attractiveness functions as a cognitive filter that
contextualizes the interpretation of performance feedback. It alters the
meaning of market share gains and losses. A performance shortfall in a market
perceived as highly attractive and aligned with firm objectives is likely to
trigger a problem-solving response aimed at recovery. The same shortfall in a
market deemed unattractive and less aligned with strategic goals is more likely
to be interpreted as a confirmatory signal to withdraw. Thus, attractiveness
does not merely moderate the relationship between performance and retrenchment;
it shapes the fundamental cognitive process by which managers evaluate and act
upon performance signals, as developed in the subsequent hypotheses.
In summary, the theoretical framework of this study
posits that market retrenchment decisions result from managers interpreting
backward-looking performance signals through the lens of forward-looking market
attractiveness. The following hypotheses test this overarching argument by
examining the direct effects of these factors and, more critically, their
interactive effects in markets of varying attractiveness.
2.3. Research Context: The Japanese Life Insurance Industry
The Japanese life insurance industry offers an
instructive context for examining market retrenchment decisions. Historically,
life insurance distribution in Japan has centered on face-to-face interactions.
During the country’s period of high economic growth, major insurance companies substantially
expanded their physical presence by establishing extensive nationwide networks
of sales offices.
However, the economic landscape changed
significantly following the collapse of Japan’s asset bubble in the early
1990s. This economic shift, coupled with long-term demographic trends,
accelerated depopulation in rural regions. The nation’s working-age population
peaked in 1995 and has since declined due to an aging society and a low
birthrate. This demographic trend has been more pronounced in rural areas than
in urban centers. Life insurance products primarily provide financial
protection for bereaved families. Therefore, a shrinking customer base,
particularly the decline in households with children—a core market
segment—diminishes the attractiveness of a regional market.
Consequently, life insurance companies that had
previously invested heavily in extensive national networks began to
strategically consolidate or close sales offices in these less profitable
regional markets to improve operational efficiency. This strategic
consolidation, a key form of market retrenchment, presents a compelling
empirical setting for analyzing how declining regional market attractiveness
and firm performance influence retrenchment strategies.
2.4. Market Attractiveness and Market Retrenchment
Building on the principles of the behavioral theory
of the firm, particularly the role of managerial attention, market
attractiveness is a crucial factor in strategic decisions. Barreto (2012)
integrated insights from the behavioral theory of the firm and the
attention-based view to emphasize the importance of market attractiveness in
organizational decisions regarding market expansion. In this context, market
expansion refers to the scope and selection of multiple market opportunities
that competing firms pursue. Barreto’s empirical findings demonstrate that
market attractiveness, defined by regional demographic characteristics and the
market presence of competitors, significantly drives a bank’s decisions to open
new branches. Critically, this relationship exists independently of
market-level performance considerations, underscoring that organizational
search and selection behaviors are also stimulated by exogenous environmental
factors.
Applying this logic to retrenchment decisions,
organizations simplify complex decision-making processes by selectively
focusing managerial attention on salient environmental cues that align with
their core objectives (Cyert & March, 1963; Ocasio, 1997). Barreto (2012),
building upon this foundation, emphasized that market attractiveness plays a
crucial role in guiding organizational attention and strategic decisions.
Specifically, firms are likely to allocate greater attention and resources to
markets perceived as highly attractive because these markets align closely with
a firm’s primary objective of profit maximization (Greve, 2008; Joseph &
Gaba, 2015). Conversely, when market attractiveness diminishes, managerial
attention is often drawn to the challenges posed by these less attractive
markets (Ocasio, 1997), leading to strategic retrenchment and resource
reallocation (Kuusela et al., 2017; Vidal & Mitchell, 2015). Therefore, a
high level of market attractiveness acts as a strong incentive to maintain or
enhance market presence, whereas a low level of market attractiveness prompts
market retrenchment. Accordingly, the following hypothesis is proposed:
Hypothesis 1.
The higher the market attractiveness, the lower a firm’s market retrenchment.
2.5. Market Share Changes in Markets with Average Attractiveness
Some studies in the behavioral theory have used
market share as a measure of overall firm performance (Baum et al., 2005;
Joseph & Gaba, 2015). For instance, Baum et al. (2005) explored syndicate
underwriting by investment banks. They found that organizations engage in
problem-driven search when their market share falls below their aspiration
level. Under these conditions, firms recognize that current approaches are
insufficient to achieve their market share goals, prompting them to undertake
riskier and more novel actions. Consequently, they tend to establish syndicate
relationships with nonlocal banks in their social networks.
Baum et al. (2005) also demonstrated that
surpassing market share aspiration levels leads organizations to engage in
slack-driven search. Exceeding performance targets generates additional
resources or organizational slack, allowing firms to tolerate higher risks and
experiment with new approaches rather than strictly adhering to existing
practices. This slack facilitates the formation of syndicate relationships with
nonlocal banks, reflecting willingness to pursue novel opportunities and
innovative behaviors.
Particularly relevant to the present study’s focus
on firms operating in multiple local markets, Greve (1998) reported that radio
stations were less likely to change their formats when their market share
exceeded their aspiration level. When market share exceeds the aspiration
level, radio stations tend to be satisfied with their performance. This
satisfaction, in turn, increases participants’ incentive to maintain the status
quo, diminishing their perceived need and motivation to undertake risky format
changes. Conversely, when market share falls below the aspiration level,
dissatisfaction with the current situation typically intensifies, thereby
strengthening firms’ motivation to make changes to improve performance.
Building on these insights, this study investigates
how year-over-year changes in market share—specifically, market share losses
and gains—influence a firm’s retrenchment decisions in markets with average
attractiveness. One perspective, drawing from the behavioral theory of the firm
and research on organizational problem-solving (Cyert & March, 1963; Greve,
1998), suggests that a market share loss is likely to be perceived by managers
as a significant performance shortfall—a deviation from aspirations that
demands corrective action. According to Greve (1998), managers often interpret
such losses as problems localized to a specific market, prompting them to
intensify efforts to regain their footing. This can manifest as increased
investment, renewed marketing initiatives, or other forms of market expansion
activities aimed at recovering the lost share. From this viewpoint, a market
share loss would motivate actions contrary to retrenchment, thereby leading to
a decrease in market retrenchment or even a renewed commitment to expansion.
This response might be particularly salient if managers are influenced by loss
aversion, becoming more risk-seeking in their attempts to recover previous
losses (Kahneman & Tversky, 1979).
Conversely, an alternative perspective posits that
a loss in market share can serve as a stark indicator to managers that the firm
is facing a competitive disadvantage relative to its rivals in that particular
market (Porter, 1980). This loss may be interpreted as evidence that the firm’s
offerings are less appealing, its cost structure is uncompetitive, or its
strategic positioning has weakened. In such a scenario, particularly in a
market that offers only average attractiveness—meaning it lacks strong growth
prospects or high profit potential to justify a difficult turnaround
battle—managers might conclude that further investment would be uneconomical
(Harrigan, 1980). Prudent resource allocation would then dictate a strategy for
conserving resources by scaling back operations in underperforming markets.
These resources could then be redeployed to more attractive or promising
markets where the firm has a stronger competitive standing or perceives better
opportunities (Bettis & Mahajan, 1985). Consequently, this interpretation
would lead to an increase in market retrenchment as the firm seeks to cut
losses and optimize its overall portfolio.
Considering the interplay between the
forward-looking assessment of market opportunity (i.e., attractiveness) and the
backward-looking feedback on performance (i.e., share change), markets of
average attractiveness present a unique decision-making context. In these
markets, the forward-looking signal from market attractiveness is neither
strong enough to compel major new investment, nor is it weak enough to demand
immediate exit. Without this strong contextual guidance, the interpretation of
a performance signal like a market share loss becomes unclear.
As the behavioral theory of the firm suggests, a
performance shortfall typically triggers problemistic search. However, the
urgency and direction of that search are often shaped by the perceived
importance of the context. In a market of only average attractiveness, managers
lack a strong strategic imperative. Some may interpret a share loss as a
localized problem to be fixed, prompting actions to reduce retrenchment, while
others may view the same signal as evidence of competitive disadvantage in a
market not worth fighting for, thus increasing retrenchment. With no clear
guidance from the market’s strategic value, these competing managerial
interpretations are likely to be inconsistent across firms and time. On
average, these opposing responses may counteract each other, leading to no
systematic, predictable change in retrenchment. Therefore, the following
hypothesis is proposed:
Hypothesis 2.
When market attractiveness is at an average level, a loss in market share relative to the previous year leads to no change in market retrenchment.
Continuing this line of inquiry, the focus now turns
to the implications of a firm experiencing a gain in market share relative to
the previous year, specifically within markets of average attractiveness. While
market share losses in such contexts may elicit divergent managerial
interpretations and thus ambiguous effects on retrenchment, it is proposed that
a market share gain generates more consistent motivations that collectively
argue against market retrenchment. This proposition is supported by two primary
theoretical perspectives.
First, drawing upon the behavioral theory of the
firm (Cyert & March, 1963) and the work of Greve (1998), a market share
gain is likely to engender managerial satisfaction. In his study of radio
stations, Greve (1998) found that organizations with market share above their
aspiration levels were less likely to change their formats. This reluctance to
change when performing well, a core tenet of aspiration-level adaptation,
indicates that satisfaction with the current state and strategy is often
fostered by exceeding performance targets. Managers content with their firm’s
performance in a specific market would perceive less need for substantial
strategic retrenchment. They are likely inclined to maintain the status quo to
preserve the favorable performance trajectory. In a market with average
attractiveness, incentives for aggressive expansion or immediate retrenchment
are typically not overwhelming. In such settings, this satisfaction with a
positive trend becomes particularly influential, reinforcing the decision to
continue current operations rather than pursue the disruptive and
resource-diverting act of market retrenchment.
Second, managers can interpret a gain in market
share as a clear signal of a firm’s competitive advantage in that particular
market (Porter, 1980). This improved standing relative to competitors might
stem from more effective sales proposals, higher personnel efficiency in sales
activities, stronger brand recognition in the region, and more effective
strategic positioning. Even in a market that only has average attractiveness
and lacks exceptional growth prospects or high profit potential, a demonstrated
and growing competitive advantage is a valuable capability. Managers would
likely view this as an opportunity to consolidate their position and further
leverage their strengths. The positive performance signified by the market
share gain may also generate organizational slack in the focal market (Cyert
& March, 1963). In the context of a recognized competitive advantage, this
slack is more likely to be reinvested to fortify the current market position
rather than to fund retrenchment or geographic diversification away from a
proven area of success, thereby enhancing profitability or stability. From this
perspective, a reasonable response would be to reinforce success through
continued commitment or even cautious expansion, rather than initiating market
retrenchment and ceding hard-won ground.
Unlike the conflicting pressures potentially arising
from market share loss, these two managerial responses to a market share
gain—satisfaction derived from surpassing aspirations (Greve, 1998) and the
recognition of a competitive advantage (Porter, 1980)—are not contradictory.
The desire to maintain satisfactory performance, which is rooted in the
behavioral theory of the firm, and the strategic imperative to capitalize on an
evident competitive strength converge. This convergence provides robust
motivation for managers to resist market retrenchment. In markets of average
attractiveness, where the strategic path is not always clear, a positive
performance signal, such as a market share gain, provides a compelling
rationale to stay the course or even deepen commitment, thereby reducing the extent
of retrenchment. Therefore, the following hypothesis is advanced:
Hypothesis 3.
When market attractiveness is at an average level, a gain in market share relative to the previous year decreases market retrenchment.
2.6. Market Share Changes in Markets with High and Low Attractiveness
This subsection focuses on markets at the high or
low ends of attractiveness, because extremes materially alter how share changes
are interpreted for retrenchment decisions. Attractiveness is conceptualized as
a heuristic that functions as a cognitive filter translating raw performance
signals into strategic meanings.
First, consider a firm that has experienced a loss
in market share in a highly attractive market. As discussed in relation to
Hypothesis 1, high market attractiveness provides a strong incentive for firms
to maintain or strengthen their market presence, driven by factors such as
favorable growth prospects and high profit potential. Building on the
attention-based view (Ocasio, 1997, 2011), Barreto (2012) emphasized that attractive
market opportunities can prompt forward-looking organizational actions
independent of traditional performance feedback. The identification and
assessment of such opportunities are central to strategic decision-making (Christensen
& Bower, 1996; Shane & Venkataraman, 2000). When an insurance company
loses market share in such an environment, the strong forward-looking signal of
opportunity provided by the market's high attractiveness is likely to outweigh
the backward-looking signal of a performance shortfall. Consequently, managers
are unlikely to interpret the loss as a signal to withdraw, but rather as a
localized problem that must be solved to protect a valuable market position. As
a result, a loss in market share is expected to decrease market retrenchment in
such valuable and opportunity-rich markets.
In contrast, consider a firm that loses market
share in a market with low attractiveness. As suggested by the logic underlying
Hypothesis 1, low market attractiveness naturally orients firms toward market
retrenchment. These markets often provide limited growth potential, low profit
margins, or declining strategic value, making continued investments less
appealing (Porter, 1980). The loss in market share in such contexts reinforces
the rationale for withdrawal. It serves as further evidence of a competitive
disadvantage or an eroding position in a market that already lacks strategic
value (Harrigan, 1980).
Moreover, managers may pay less attention to such
markets because of their low attractiveness (Ocasio, 1997; Barreto, 2012),
making withdrawal an even more likely outcome. Allocating resources to defend
or regain market share in these contexts is likely to be seen as inefficient,
particularly when more promising alternatives are available (Bettis &
Mahajan, 1985). As such, resource reallocation favors market retrenchment to
optimize the overall portfolio. Thus, loss in market share is expected to
increase market retrenchment in low-attractiveness markets.
These contrasting responses indicate that the
effect of market share loss on market retrenchment is systematically shaped by
the market context. In highly attractive markets, strategic importance and
potential returns motivate firms to persist. In contrast, in less attractive
markets, particularly when performance declines, market retrenchment becomes a
more reasonable and urgent course of action. Therefore, the following
hypothesis is put forward:
Hypothesis 4.
When market attractiveness is at a high (low) level, a loss in market share relative to the previous year decreases (increases) market retrenchment.
Building on the logic that market attractiveness
moderates a firm’s response to market share changes, this study examines how a
gain in market share affects market retrenchment under conditions of high or
low market attractiveness.
First, when a firm gains market share in a highly
attractive market, the rationale for decreasing market retrenchment is
strengthened. High market attractiveness already provides a strong incentive
for continued—or even increased—commitment (Porter, 1980; Barreto, 2012). A
gain in market share further reinforces managerial perceptions of success and
competitive advantage (Greve, 1998). This convergence of positive signals—an
attractive market and improved firm performance—likely strengthens managerial
confidence and increases their willingness to invest further to solidify or
expand their position. Managers would have little reason to scale back
operations and may instead pursue aggressive growth. Therefore, in highly attractive
markets, a gain in market share is expected to significantly decrease market
retrenchment, potentially more so than in markets with average attractiveness.
The situation differs significantly when a firm
gains market share in a market with low attractiveness. While such a gain is a
positive performance signal, its implications for retrenchment are more complex
and may follow two distinct, though not mutually exclusive, managerial logics.
One possibility is that managers interpret the gain through a harvest strategy
lens (Harrigan, 1980). Acknowledging the market’s limited long-term prospects
(Porter, 1980), firms may view the improved position as an opportunity to
maximize short-term cash flows with minimal additional investment or to exit
the market in a more controlled and profitable manner (Bettis & Mahajan,
1985). In this view, the gain does not signal a renewed commitment but rather
facilitates a strategic withdrawal.
Alternatively, managers—constrained by bounded
rationality and limited organizational resources (Cyert & March, 1963)—may
reach a similar retrenchment decisions through different rationales. They
conclude that the fundamental market outlook remains poor despite recent gains
(Harrigan, 1980). If maintaining or building on this gain requires
disproportionate effort or investment, the gain may highlight the opportunity
cost of remaining in the market when more promising alternatives exist (Bettis
& Mahajan, 1985). Rather than encouraging further investment, the gain
could trigger increased market retrenchment to redirect resources to more
attractive markets and avoid deeper involvement in a low-potential environment.
Therefore, the following hypothesis is proposed:
Hypothesis 5.
When market attractiveness is at a high (low) level, a gain in market share relative to the previous year decreases (increases) market retrenchment.
Table 1
summarizes the hypotheses regarding the effects of market share changes and
market attractiveness on market retrenchment. "Increases" and "Decreases"
respectively indicate a hypothesized increase and decrease in market
retrenchment. "No changes" indicates the hypothesis 2 that market
retrenchment will not change under specific conditions.
3. Methods
3.1. Data and Sample
Data on sales activities in the 47 prefectures and
firm-level data were obtained from the annual editions of the Statistics of
Life Insurance Business, published by Hoken Kenkyujo Ltd. Because this
publication is sold only in print, the author manually digitized the data. In
addition, demographic data for each prefecture were obtained from a database
provided by the Ministry of Internal Affairs and Communications.
The initial dataset was acquired from 2006 to 2019.
Data from boundary years 2006 and 2019 were used exclusively to calculate
independent and dependent variables derived from year-over-year differences.
This study investigates the extent to which life insurance companies, already
established in a regional market, reduced their number of sales offices. To
operationalize this focus on adjustments by incumbent firms with ongoing
operations, Firm-prefecture-year observations were excluded if a company had no
sales offices in a given prefecture in year t or no sales offices in that same
prefecture in year t+1. The latter condition includes instances of complete
withdrawal from the prefecture. Given these criteria, the final analytical
sample comprises firms that maintained at least one sales office in a specific
prefecture in both year t and the subsequent year t+1. This sample consists of
4,223 firm-prefecture-year observations, representing 16 life insurance
companies across Japan’s 47 prefectures, covering the period from 2007 to 2018.
3.2. Variables
The dependent variable in this study is market
retrenchment, measured as the decrease in the number of sales offices (a
positive integer) operated by the focal life insurance company within each
focal prefecture from year t to year t+1.
The independent variables are market
attractiveness, share gain, and loss. Following Barreto (2012), market
attractiveness is calculated based on the ratio of demand to supply in each
prefecture. For the demand side, the number of households (in thousands) was
used. The number of households is a more appropriate measure than population
when assessing the demand for life insurance across prefectures. Life insurance
policies are typically purchased at the household level, primarily by
breadwinners who seek to provide financial protection for their dependents.
Furthermore, households better represent the decision-making unit for financial
products such as life insurance. In contrast to population figures, which
include children and other individuals who generally do not make purchasing
decisions, household counts more accurately reflect the number and
characteristics of potential life insurance customers. For the supply side, the
number of sales offices operated by all competing life insurance companies
(i.e., all life insurance companies excluding the focal firm) was used. This
market attractiveness variable was then standardized to facilitate the
interpretation of the analysis results.
To construct the two independent variables related
to market share, the market share (%) of the focal life insurance company in
each prefecture was first calculated. This was done by dividing the number of
insurance contracts by the total number of insurance contracts held by all life
insurance companies in that prefecture and then multiplying the result by 100. Market
share gain and loss are derived from a spline function of the change
in market share from year t-1 to year t. These can be represented by the
following equations (Marsh & Cormier, 2001):
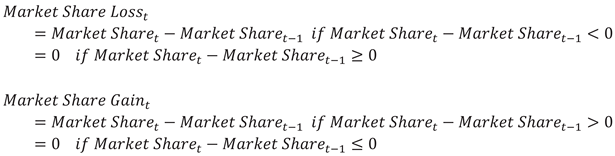
This spline function approach allows for separate
examination of the effects of positive changes (gains) and negative changes
(losses) in market share. Using the previous year's performance as a reference
point is consistent with the operationalization of the historical aspiration
level within the behavioral theory of the firm. While many studies in this area
adopt an exponentially weighted moving average of past performance, some
research uses the previous year’s performance as a simpler variable for the
historical aspiration level (e.g., Audia & Brion, 2007; Iyer & Miller,
2008). For reasons of parsimony and in line with this latter approach, this
study adopts the previous year’s market share as the reference point to explore
how boundedly rational managers perceive gains and losses in market share.
The behavioral theory of the firm also identifies
another key benchmark: the social aspiration level, which is typically the
average performance of competing firms. A robustness check was conducted using
the deviation from the average market share of competitors as an alternative
reference point; however, the results were not significant. This finding
suggests that when making market retrenchment decisions, managers in the
context of this study focus more on their own firm’s performance than on their
relative standing against competitors.
Several control variables at the firm-prefecture
level are included to control for the competitive environment of the local
market. Market households represent the number of households (in
thousands) in the focal prefecture. Market competition density is the
number of sales offices maintained by competing life insurance companies in a
prefecture. Own local density is the number of focal life insurance company
sales offices in the focal prefecture. Prefecture size is measured as
the land area of the prefecture (in square kilometers) divided by 100,000.
To control for individual firm characteristics,
several firm-level variables are also incorporated. ROA is calculated as
the current year’s surplus divided by total assets. Firm slack is
measured as the average of three standardized slack variables: absorbed
slack, unabsorbed slack, and potential slack (Greve, 2003). Absorbed
slack is the ratio of operating expenses to premium income. Unabsorbed
slack is the ratio of cash, deposits, and call loans to total liabilities. Potential
slack is the ratio of debt to equity. Firm size is the natural
logarithm of total premium income, which is an appropriate measure of firm size
for insurance companies (Greve, 2008). Geographic diversification is
measured as one minus the Herfindahl-Hirschman Index (HHI). The HHI is a common
measure of market concentration calculated by squaring the market share of each
firm operating in a market and then summing the resulting numbers. A higher HHI
indicates greater market concentration; consequently, a lower value for the
geographic diversification measure indicates less diversification.
The initial strategy for managing time-specific effects
was to incorporate a full set of year dummy variables. However, this approach
resulted in Stata not reporting the Wald chi-squared statistic for overall
model significance. This is a common issue when the estimated parameters are
numerous relative to the data clusters and is a documented concern with
clustered standard errors (Cameron & Miller, 2015). In this study,
employing numerous year dummies with the chosen panel data model and 16 firm
clusters substantially increased the parameter count. This compromised the
asymptotic Wald test’s reliability, a known issue for statistical methods that
account for within-cluster data correlation (Liang & Zeger, 1986; Hardin &
Hilbe, 2002).
This high parameter count, which led to the
unreported Wald chi-squared statistic, prompted a more parsimonious approach to
modeling temporal trends. Consequently, the individual year dummies are
replaced with a continuous industry clock variable (a linear time trend
variable) constructed by subtracting the base year 2007 from the year variable.
This reduces the model parameters while controlling for secular time trends.
Dowell and Killaly (2009), who analyze similar firm-market-year observations,
also use an industry clock.
Similarly, including firm-specific dummies to
control for unobserved time-invariant firm heterogeneity also led to the
non-reporting of the Wald chi-squared statistic, likely because these
additional dummies substantially increased the number of parameters relative to
clusters. Consequently, firm-specific dummies were excluded from the final
model. The model uses standard errors clustered by firm to address potential
within-firm error correlation and heteroskedasticity (Liang and Zeger, 1986).
However, excluding firm-specific dummies means that estimated coefficients may
suffer omitted variable bias if unobserved time-invariant firm characteristics
correlate with the included explanatory variables (Wooldridge, 2010). This
limitation warrants consideration when interpreting the results.
3.3. Model
To address potential multicollinearity within the
dataset, the variance inflation factors (VIFs) were calculated using ordinary
least squares (OLS) models, consistent with Barreto (2012). The analysis
identified one pair of control variables for which the VIFs (36.93 and 29.85,
respectively) significantly surpassed the commonly accepted benchmark of 10
(Kennedy, 2008). Therefore, an orthogonalization technique was applied to this
pair. This set of variables exhibited strong intercorrelation, which introduced
multicollinearity issues. Specifically, a modified Gram-Schmidt procedure was
employed using the orthog command in Stata. After this procedure, the dataset
was reevaluated for multicollinearity. Subsequent VIF calculations confirmed
that all variable VIFs in the model were then reduced to acceptable levels,
with the maximum VIF being 5.14.
The dependent variable in this study is a count
variable. While the Poisson distribution is a common starting point for
modeling count data, it assumes that the mean and variance of the distribution
are equal (equidispersion) (Cameron & Trivedi, 2013). However, count data
in practice often exhibit overdispersion (variance greater than the mean) or
underdispersion (variance less than the mean). In the analysis, the Stata
output for the Generalized Estimating Equations (GEEs) model indicated that the
dispersion parameter, estimated at 0.915, was less than unity, suggesting that
the equidispersion assumption of the Poisson model was not met. This finding
indicates a potential underdispersion of the data. The negative binomial
distribution provides a more flexible alternative as it can account for such
departures from equidispersion by including an additional parameter to model
the dispersion (Hilbe, 2011). Following Barreto (2012), to appropriately model
the count nature of the dependent variable and address the observed dispersion,
a negative binomial distribution was employed for the analysis.
This research uses panel data on insurance company
market retrenchment across multiple prefectures and employs negative binomial
regressions with GEEs (Hubbard et al. 2010). While various control variables
are incorporated, it is crucial to address potential remaining within-firm
correlations across prefectures. GEEs are well-suited for this because they
allow for an estimated, rather than assumed, error-term correlation matrix,
unlike models that assume an identity matrix typical of independent
observations (Liang & Zeger, 1986); this approach also helps in considering
spatial dependence. Following previous studies (Barreto, 2012; Rhee &
Haunschild, 2006), negative binomial regressions with GEEs were conducted, specifying
an exchangeable correlation matrix (Ballinger, 2004). This approach manages any
remaining nonindependence of errors across markets for the same insurance
company, reflecting the potential correlation of observations for the same
insurance company within a given year. Furthermore, the Huber-White robust
variance estimator ensures valid standard errors even if the specified
correlation structure does not perfectly capture actual within-group
correlations (Huber, 1967; White, 1980).
In the analysis of panel data using GEE via Stata's
xtgee command with the options family(nbinomial), link(log), and i(firm), an
exchangeable working correlation structure specified by corr(exchangeable) was
initially considered. This choice is based on the theoretical expectation that
observations within the same firm over time are likely to exhibit some degree
of consistent, nonzero correlation. However, the model that employed the
corr(exchangeable) structure failed to converge. To address this issue, a
simplified working correlation structure specified as corr(independent) was adopted, assuming no correlation
between observations within the same firm after accounting for covariates. This
specification allowed the model to converge.
The vce(robust) option was employed to obtain the
robust standard errors based on the Huber-White sandwich estimator (Huber,
1967; White, 1980). The use of robust standard errors in the GEE provides valid
inferences for the estimated coefficients and their standard errors even if the
chosen working correlation structure is misspecified, provided that the mean
model itself is correctly specified. Therefore, although the corr(independent)
structure assumes no within-firm correlation, the inferences are robust to
potential deviations from this assumption. Although the vce(robust) option
ensures the consistency of the parameter estimates and the validity of the
standard errors, the choice of a working correlation structure can affect the
estimation efficiency. If the true underlying correlation structure is indeed
closer to corr(exchangeable), using corr(independent) might result in less
efficient estimates (that is, larger standard errors) compared to what could
have been achieved with a correctly specified and converged corr(exchangeable)
model. Nevertheless, achieving model convergence is a prerequisite for
obtaining interpretable results, and the corr(independent) structure, in
conjunction with robust standard errors, provides a valid and practical
approach in this instance.
4. Results
Table 2
presents the descriptive statistics and Pearson’s correlations for all
variables (N = 4223). The average market retrenchment was 0.763 (standard
deviation SD = 2.065), indicating varied retrenchment activity. Market
retrenchment shows significant correlations (p < 0.05, |r| >
0.029). It is positively correlated with market households (r = 0.412), own
local density (r = 0.617), and market attractiveness (r = 0.083).
Conversely, it is negatively correlated with market share loss (r =
−0.073), market competition density (r = −0.219), and industry clock
(r = −0.109). The correlation with market share gain (r = −0.028) is not
statistically significant.
Table 3
presents the results of the negative binomial regression models with GEEs used
to predict market retrenchment. Model 1 only included control variables
(Wald chi-squared = 3337.23). Model 2 introduces only market attractiveness
as an independent variable, showing a statistically significant improvement in
model fit (Wald chi-squared = 3687.22; the change in Wald chi-squared, ΔWald
chi-squared = 350.00, for Δdf = 1, is significant, p < 0.01) compared
to Model 1. Model 3 adds only the two independent variables from the spline
function related to market share change (market share loss and gain)
to Model 1, also demonstrating a statistically significant improvement in fit
(Wald chi-squared = 5318.94; ΔWald chi-squared = 1981.72, for Δdf = 2, is
significant, p < 0.01). Model 4 includes market attractiveness and
share change variables. This model shows a statistically significant
improvement in fit over Model 2 (to which market share change variables
were added: ΔWald chi-squared = 2300.67, for Δdf = 2, is significant, p
< 0.01) and over Model 3 (to which market attractiveness was added:
ΔWald chi-squared = 668.95, for Δdf = 1, is significant, p < 0.01),
with a Wald chi-squared of 5987.89. Finally, Model 5, the full model, includes
the interaction terms between market share change and market
attractiveness. The addition of these interaction terms resulted in a
statistically significant improvement in model fit compared to Model 4 (Wald
chi-squared = 92977.05; a joint Wald chi-squared test of the interaction terms,
Wald chi-squared(2) = 19.41, p < 0.01, confirms this improvement).
The Wald chi-squared statistics were significant for all models (p <
0.01), indicating good overall model fit and progressive improvement as key
variables and interactions are added (Jaccard & Turrisi, 2003).
Hypothesis 1 predicts that higher market
attractiveness is associated with lower market retrenchment. This
hypothesis was tested using Models 2 and 4. In Model 2, the coefficient for market
attractiveness is positive and statistically significant (β = 0.124, p
< 0.05). Similarly, in Model 4, the coefficient for market attractiveness
remained positive and statistically significant (β = 0.123, p <
0.05). This positive main effect suggests a counterintuitive relationship where
higher attractiveness is associated with greater retrenchment. However, this
finding must be interpreted with caution, as subsequent analysis reveals that
this effect is highly dependent on performance feedback. The interaction with
market share changes, detailed in the tests of Hypotheses 4 and 5,
fundamentally alters this relationship. Therefore, Hypothesis 1 is not
supported.
Hypothesis 2 proposes that when market
attractiveness is at an average level, a previous-year loss in market share
leads to no change in market retrenchment. This hypothesis concerns the
effect of market share loss when market attractiveness is at its
mean. In Model 4, the coefficient for market share loss is 0.059 and is
not statistically significant (p > 0.10). For confirmation, Model 3,
which does not include market attractiveness, also shows a
nonsignificant coefficient for market share loss (β = 0.064, p
> 0.10). In Model 5, which includes the interaction term, the main effect of
market share loss (−0.038, p > 0.10) specifically represents
this effect at average market attractiveness (where the standardized market
attractiveness variable is 0). Although a nonsignificant result does not
formally prove the null hypothesis, it accords with the prediction of no
change. Accordingly, the result is consistent with Hypothesis 2 within the
scope of this sample.
Hypothesis 3 posits that when market
attractiveness is at an average level, a previous-year gain in market share
decreases market retrenchment. This hypothesis concerns the effect of market
share gain when market attractiveness is at its mean. Model 4, which
includes market attractiveness as a control, shows that the coefficient
for market share gain is −0.202 and statistically significant (p
< 0.01). Model 3, which does not include market attractiveness, also
shows a significant negative coefficient for market share gain (β =
−0.204, p < 0.01). However, in Model 5, which includes the
interaction term, the main effect of market share gain (−0.073, p
> 0.10) represents this effect at average market attractiveness
(where the standardized market attractiveness variable is 0), and this
specific coefficient is not significant. Although Models 3 and 4 (which do not
account for interaction effects) suggested a significant negative relationship,
the findings from Model 5, which is more comprehensive as it accounts for
interaction effects, do not provide clear support for a direct negative effect
of market share gain on average market attractiveness. Therefore,
it is concluded that Hypothesis 3 is not supported.
Hypothesis 4 concerns the moderating effect of market
attractiveness on the relationship between market share loss and market
retrenchment. It was predicted that when market attractiveness is
high, a loss in market share decreases market retrenchment, and when it
is low, a loss in market share increases market retrenchment. This
hypothesis was tested using Model 5. The interaction term market share loss
× market attractiveness in Model 5 is positive and significant (β =
0.135, p < 0.01). To interpret this interaction, for high market
attractiveness (e.g., +1 SD), the effect of a one-unit loss in market share
(represented by a value of −1 for the market share loss variable) on market
retrenchment is calculated as (−0.038 * −1) + (0.135 * −1 * 1) = 0.038 + (−0.135) = −0.097. This negative
effect indicates that in highly attractive markets, loss of market share
decreases market retrenchment, supporting the first part of Hypothesis
4. Conversely, for low market attractiveness (e.g., −1 SD), the effect
of a one-unit loss in market share on market retrenchment is (−0.038 *
−1) + (0.135 * −1 * −1) = 0.038 + 0.135 = 0.173. This positive effect indicates
that in markets with low market attractiveness, loss of market share
leads to an increase in market retrenchment, supporting the second part
of Hypothesis 4. Collectively, these findings support Hypothesis 4. The
collective significance of these interaction terms, confirmed by the joint Wald
test noted earlier when discussing Model 5, lends overall support to the
hypothesized moderating role of market attractiveness.
Hypothesis 5 addresses the moderating effect of market attractiveness on the relationship between market share gain and market retrenchment. It was predicted that when market attractiveness is high, a gain in market share decreases market retrenchment, and when it is low, a gain in market share increases market retrenchment. This hypothesis was tested using Model 5. The interaction term market share gain × market attractiveness in Model 5 is negative and significant (β = −0.115, p < 0.01). To interpret this interaction, for high market attractiveness (e.g., +1 SD), the effect of a one-unit gain in market share (represented by a value of +1 for the market share gain variable) on market retrenchment is (−0.073 * 1) + (−0.115 * 1 * 1) = −0.073 − 0.115 = −0.188. This negative effect indicates that in highly attractive markets, a market share gain decreases market retrenchment, supporting the first part of Hypothesis 5. Conversely, for low market attractiveness (e.g., −1 SD), the effect of a one-unit gain in market share on market retrenchment is (−0.073 * 1) + (−0.115 * 1 * −1) = −0.073 + 0.115 = 0.042. This positive effect indicates that in markets with low market attractiveness, a market share gain leads to an increase in market retrenchment, supporting the second part of Hypothesis 5. Thus, Hypothesis 5 is supported. As mentioned under Hypothesis 4, the joint Wald chi-square test of the interaction terms further supports the overall significance of these moderating effects.
Figure 1 visually represents the interactive effects of market share change and attractiveness on market retrenchment, as detailed in the results for Hypotheses 4 and 5. The three-dimensional plot illustrates how the predicted values of market retrenchment (vertical axis) are shaped by the interplay of two horizontal axes: market share change and market attractiveness. The "market share change" axis (one horizontal dimension) distinguishes between market share losses (negative values) and gains (positive values). This axis covers a range of approximately ±2 SD of market share change, where a value of 0 indicates no change in market share from the previous year. For example, a value of −1 signifies a 1% decrease in market share from the previous year. The "market attractiveness" axis (the other horizontal dimension) indicates the SD from the mean. A value of 0 represents average market attractiveness, whereas values such as +2 or −2 indicate market attractiveness with two SD above or below the average, respectively. In the context of this study, higher attractiveness thus signifies a market with a more favorable ratio of potential customers (households) to competing sales offices.
Specifically, the plot’s surface demonstrates that when market attractiveness is high (e.g., at +2 SD), loss and gain in market share (e.g., moving toward −2 SD or +2 SD on the market share change axis) are associated with a decrease in predicted market retrenchment. This trend is shown by the downward slope of the surface as changes in market share move away from zero at high levels of market attractiveness. Therefore, in highly attractive markets, a larger magnitude of market share change (either loss or gain) corresponds to less market retrenchment. Conversely, when market attractiveness is low (e.g., at −2 SD), both loss and gain in market share are associated with an increase in predicted market retrenchment. This trend is depicted by the upward slope of the surface as changes in market share move away from zero at low attractiveness levels. Consequently, in markets with low attractiveness, a larger magnitude of market share change (either loss or gain) leads to more market retrenchment.
At average levels of market attractiveness (i.e., 0 SD from the mean), the relationship between market share change and market retrenchment appears nearly flat. This observation aligns with the statistical analysis, which indicates that in markets with average attractiveness, neither market share losses nor gains significantly influence market retrenchment decisions.
Finally, when the change in market share is near zero, the plot surface reveals a subtle but important trend. As one moves along the axis of zero share change from low to high market attractiveness, the surface tilts slightly upward, indicating a marginal increase in market retrenchment. This upward tilt visually represents the positive main effect of market attractiveness that led to the rejection of Hypothesis 1, showing that the direct influence of attractiveness is most apparent when the moderating effect of performance feedback is minimal. This corresponds to the conditional main-effect coefficient for market attractiveness at a near-zero share change in the interaction model (β = 0.216, p < 0.01). As the magnitude of market share change increases, this direct positive effect is negated and even reversed by the interaction.
Overall, Figure 1 encapsulates the core finding that the predicted level of an insurance company’s market retrenchment is contingent upon the combined influence of market share changes and the attractiveness of the market in question.
5. Discussion
5.1. Theoretical Contributions and Implications
This study contributes to the behavioral theory of the firm by conceptualizing market retrenchment as a decision process in which managers integrate two distinct informational cues: backward-looking feedback on past performance and forward-looking assessments of future opportunities. While the behavioral theory of the firm has traditionally emphasized problem-driven search triggered by historical performance shortfalls, the study incorporates a complementary, opportunity-driven perspective wherein cognitive representations of future potential guide strategic action. Whereas Barreto (2012) applied this forward-looking perspective to explain market expansion, this study extends the same logic to the context of market retrenchment. The findings empirically demonstrate that retrenchment decisions are not driven by performance or attractiveness independently, but by their interplay, providing a more comprehensive understanding of strategic decision-making in declining industries.
Second, the study advances the behavioral theory of the firm by theorizing and demonstrating the role of market attractiveness as a key cognitive filter. This study moves beyond viewing attractiveness as a simple moderator and instead frames it as a heuristic that shapes managerial attention and, more critically, contextualizes the meaning of performance feedback. A performance loss is interpreted differently—as a problem to be solved in an attractive market versus a confirmatory signal to exit in an unattractive one. This filtering mechanism explains not only how performance feedback is interpreted but also resolves the apparent puzzle of the main effect of market attractiveness. The counterintuitive positive association between attractiveness and retrenchment, which runs contrary to baseline assumptions, is shown to be an incomplete picture. The interaction analysis demonstrates that this main effect is largely an artifact of situations with minimal performance change and is either reversed or rendered irrelevant by significant gains or losses in market share. This filtering effect also clarifies the finding, where the seemingly direct effect of a market share gain on reducing market retrenchment becomes non-significant once the interaction with attractiveness is accounted for. It demonstrates that the performance signal alone carries an ambiguous meaning until it is interpreted through the lens of the market's potential. This cognitive reframing directly explains the study's key empirical results for the interactive hypotheses: in highly attractive markets, a substantial loss triggers intensive problemistic search aimed at recovery, while a gain reinforces the market’s perceived value, both of which discourage retrenchment decisions. Conversely, in markets with low attractiveness, a significant loss accelerates withdrawal, while even a gain may be treated as an opportunity to "harvest and exit," both of which encourage retrenchment.
Finally, by focusing on a specific action goal—performance within a regional market—the paper offers a more granular application of the principles of the behavioral theory of the firm. In doing so, it complements recent work that has expanded the theory's application to non-financial metrics, such as environmental performance driving reshoring decisions (Zhang et al., 2023), and to other forms of strategic reduction, like scaling back ESG disclosures (Seow, 2025). Much of the prior literature has tested the behavioral theory of the firm using broad, firm-level goals. This study, however, demonstrates that the core mechanisms of performance feedback operate at a more operational, market-specific level. This helps explain the seemingly contradictory behavior of a single firm simultaneously pursuing different strategies in different markets, highlighting that organizational action is a localized response to specific performance-context combinations rather than a monolithic reaction to overall corporate performance.
5.2. Practical Implications
The findings of this study suggest a more structured and analytical approach to decision-making, particularly regarding resource allocation across multiple regions. This framework allows managers to use the interplay of market attractiveness and performance as a diagnostic tool. This enables them to move beyond intuitive responses and ask more disciplined, strategic questions. Specifically, the approach involves plotting each regional market based on its attractiveness and performance to formulate critical questions that guide a systematic assessment of the firm's portfolio.
For example, in a highly attractive market where market share has been lost, a common bias is to escalate commitment to avoid acknowledging a potential failure. A more systematic approach would be to ask: Have we thoroughly analyzed the root causes of this share loss? Is it a correctable operational issue (e.g., sales coverage, local marketing), or a more fundamental misalignment between our offerings and market needs? This line of questioning shifts the focus from defending past decisions to a forward-looking analysis of recovery potential.
Conversely, in a low-attractiveness market where market share has been gained, the intuitive response might be a reflexive "harvest and exit" strategy. A more strategic question would be: Have we analyzed why we are gaining share while others may be struggling? Does this signal an opportunity to serve a profitable niche at a low cost as competitors withdraw? Answering these questions requires a data-driven assessment of the emerging competitive landscape.
This analytical discipline applies to all scenarios. In a highly attractive market with a market share gain, a key risk is complacency or "satisficing." The strategic question becomes: Beyond celebrating success, have we analyzed the source of our advantage and considered how to best leverage this success? Options include reinvesting to solidify our lead, attempting to replicate the advantage in other markets, or reallocating the generated resources to another strategic priority. For a low-attractiveness market with a market share loss, the bias might be a hasty exit. A more disciplined process would ask a series of questions: First, could the withdrawal of competitors transform this into an attractive market with potential for survivor gains? Second, if an exit is still the best course of action, have we developed an orderly withdrawal plan that is explicitly linked to the reallocation of freed-up resources to a specific, higher-value opportunity elsewhere? By systematically asking these action-oriented questions, managers can better navigate behavioral traps and optimize resource allocation for the entire firm.
5.3. Limitations and Future Research
The findings of this study are subject to certain limitations, which in turn suggest avenues for future research. First, the analysis relies on data from a single industry in a single country: Japanese life insurance companies. Although this context provides a clear empirical setting for observing market retrenchment driven by historical and demographic shifts, it limits the generalizability of the findings. The institutional, regulatory, and cultural factors specific to Japan likely influence how firms interpret market signals and formulate strategic responses. For instance, strong norms promoting employment stability and a long-term orientation, which are characteristic of Japanese corporate governance, may encourage firms to persist in attractive markets even when facing performance losses.
Although the specific parameters and thresholds for such decisions are likely context-dependent, the underlying theoretical mechanism proposed in this study appears to be more universal. The core finding—that managers use forward-looking assessments of market attractiveness as a cognitive filter to interpret backward-looking performance feedback—represents a fundamental process. This process aligns with the propositions of the behavioral theory of the firm, specifically regarding bounded rationality and managerial attention. This theory posits that managers in any context rely on such heuristics to simplify complex decisions; however, the specific cues they prioritize and the weight they assign to them may differ across contexts.
Therefore, an important avenue for future research is to test the robustness of the proposed model across different contexts. Replicating this study in different industries (e.g., retail banking, manufacturing) or in other national contexts with different corporate governance logics (e.g., shareholder-centric economies in North America or Europe) would offer valuable insights. Such comparative research could disentangle the universal behavioral mechanisms of retrenchment decisions from their context-specific manifestations, thereby enhancing the broader generalizability of the proposed framework.
Second, the analytical model in this study does not include firm fixed effects due to statistical estimation challenges. Consequently, the possibility that the results are biased by unobserved, time-invariant firm heterogeneity cannot be fully ruled out, as acknowledged in the methods section. This represents an important limitation of the study. Future research should seek to overcome this by employing alternative estimation methods that can robustly account for such firm-specific effects.
Third, a limitation stems from the counterintuitive main effect observed for market attractiveness. Although the interaction analysis clarifies that this direct positive effect on market retrenchment is conditional and largely superseded by performance feedback, the underlying reason for this main effect remains a puzzle. The finding that, in the absence of significant performance change, firms may engage in slightly more retrenchment in more attractive markets contradicts established logic. The scope of the data used in this study does not permit a definitive explanation for why this underlying direct effect is positive, suggesting its influence is more complex than theorized. Therefore, this unresolved issue represents a critical avenue for future research. Future inquiry is needed to verify whether this finding holds in other contexts—such as different industries or countries—and to re-evaluate the relationship with different measures of market attractiveness.
6. Conclusions
By integrating backward-looking performance feedback with forward-looking assessments of opportunity, this study extends the behavioral theory of the firm to explain the complex dynamics of market retrenchment. The analysis of Japanese life insurance companies demonstrates that market attractiveness is not merely a contextual factor but a crucial cognitive filter. It determines whether performance signals are interpreted as problems to be solved within a valuable market or as confirmations to exit a less promising one. These findings underscore that managers’ responses to performance feedback are not uniform; they are highly contingent on the perceived strategic value of the market, leading to complex and sometimes counterintuitive strategic choices. While the study provides valuable insights, future research should aim to validate these findings across different industries and national contexts, explore the underlying reasons for market share changes, and examine varied forms of market retrenchment. Practically, the interaction pattern distilled here provides a diagnostic lens for portfolio-level decisions. By considering how each market's situation impacts resource allocation, managers are better equipped to pose action-oriented questions, challenge behavioral traps, and select a strategic path with clearer justification.
Author Contributions
hidden due to double-blind peer-review.
Funding
This work was supported in part by JSPS KAKENHI Grant Number 21K13364 and the KAMPO Foundation.
Institutional Review Board Statement
Not applicable.
Informed Consent Statement
Not applicable.
Data Availability Statement
The data analyzed in this study were manually digitized from 14 volumes of Statistics of Life Insurance Business in Japan (インシュアランス生命保険統計号), covering fiscal years 2006–2019. While the publisher, Hoken Kenkyujo Ltd., has ceased operations, the original printed volumes remain accessible through selected public and university libraries in Japan. The digitized dataset supporting the findings of this study is available from the author upon reasonable request for the purpose of reproducing the analyses and verifying the results. Separately, the author welcomes inquiries regarding potential research collaborations.
Acknowledgments
The author also wishes to recognize the invaluable publishing contribution of Hoken Kenkyujo Ltd.—now, regrettably, no longer in operation—whose publication Statistics of Life Insurance Business served as a crucial data source for this study.
Conflicts of Interest
The author declares no conflict of interest.
Abbreviations
The following abbreviations are used in this manuscript:
| ESG | Environmental, Social, and Governance |
| GEE | Generalized Estimating Equations |
| HHI | Herfindahl-Hirschman Index |
| OLS | Ordinary Least Squares |
| ROA | Return on Assets |
| SD | Standard Deviation |
| VIF | Variance Inflation Factor |
References
- (Arrfelt et al., 2013) Arrfelt, M., Wiseman, R. M., & Hult, G. T. M. (2013). Looking Backward Instead of Forward: Aspiration-Driven Influences on the Efficiency of the Capital Allocation Process. Academy of Management Journal, 56(4), 1081-1103. [CrossRef]
- (Audia & Brion, 2007) Audia, P. G., & Brion, S. (2007). Reluctant to change: Self-enhancing responses to diverging performance measures. Organizational Behavior and Human Decision Processes, 102(2), 255-269. [CrossRef]
- (Ballinger, 2004) Ballinger, G. A. (2004). Using Generalized Estimating Equations for Longitudinal Data Analysis. Organizational Research Methods, 7(2), 127-150. [CrossRef]
- (Barreto, 2012) Barreto, I. (2012). A Behavioral Theory of Market Expansion Based on the Opportunity Prospects Rule. Organization Science, 23(4), 1008-1023. [CrossRef]
- (Baum et al., 2005) Baum, J. A. C., Rowley, T. J., Shipilov, A. V., & Chuang, Y.-T. (2005). Dancing with Strangers: Aspiration Performance and the Search for Underwriting Syndicate Partners. Administrative Science Quarterly, 50(4), 536-575. [CrossRef]
- (Bettis & Mahajan, 1985) Bettis, R. A., & Mahajan, V. (1985). Risk Return Performance of Diversified Firms. Management Science, 31(7), 785-799. [CrossRef]
- (Cameron & Miller, 2015) Cameron, A. C., & Miller, D. L. (2015). A practitioner’s guide to cluster-robust inference. Journal of human resources, 50(2), 317-372. [CrossRef]
- (Cameron & Trivedi, 2013) Cameron, A. C., & Trivedi, P. K. (2013). Regression analysis of count data. Cambridge university press.
- (Christensen & Bower, 1996) Christensen, C. M., & Bower, J. L. (1996). Customer power, strategic investment, and the failure of leading firms. Strategic Management Journal, 17(3), 197-218. [CrossRef]
- (Cyert & March, 1963) Cyert, R. M., & March, J. G. (1963). A behavioral theory of the firm. Englewood Cliffs, NJ: Prentice-Hall.
- (Dowell & Killaly, 2009) Dowell, G., & Killaly, B. (2009). Effect of Resource Variation and Firm Experience on Market Entry Decisions: Evidence from U.S. Telecommunication Firms' International Expansion Decisions. Organization Science, 20(1), 69-84. [CrossRef]
- (Greve, 1998) Greve, H. R. (1998). Performance, Aspirations, and Risky Organizational Change. Administrative Science Quarterly, 43(1), 58-86. [CrossRef]
- (Greve, 2003) Greve, H. R. (2003). A Behavioral Theory of R&D Expenditures and Innovations: Evidence from Shipbuilding. Academy of Management Journal, 46(6), 685-702. [CrossRef]
- (Greve, 2008) Greve, H. R. (2008). A Behavioral Theory of Firm Growth: Sequential Attention to Size and Performance Goals. Academy of Management Journal, 51(3), 476-494. [CrossRef]
- (Hardin & Hilbe, 2002) Hardin, J. W., & Hilbe, J. M. (2002). Generalized estimating equations. Chapman and Hall/CRC.
- (Harrigan, 1980) Harrigan, K. R. (1980). Strategy Formulation in Declining Industries. Academy of Management Review, 5(4), 599-604. [CrossRef]
- (Hilbe, 2011) Hilbe, J. M. (2011). Negative binomial regression. Cambridge University Press.
- (Hubbard et al., 2010) Hubbard, A. E., Ahern, J., Fleischer, N. L., Laan, M. V. d., Lippman, S. A., Jewell, N., Bruckner, T., & Satariano, W. A. (2010). To GEE or Not to GEE: Comparing Population Average and Mixed Models for Estimating the Associations Between Neighborhood Risk Factors and Health. Epidemiology, 21(4), 467-474. [CrossRef]
- (Huber, 1967) Huber, P. J. (1967). The behavior of maximum likelihood estimates under nonstandard conditions. Proceedings of the fifth Berkeley symposium on mathematical statistics and probability, volume 1: statistics.
- (Iyer & Miller, 2008) Iyer, D. N., & Miller, K. D. (2008). Performance Feedback, Slack, and the Timing of Acquisitions. Academy of Management Journal, 51(4), 808-822. [CrossRef]
- (Jaccard & Turrisi, 2003) Jaccard, J., & Turrisi, R. (2003). Interaction effects in multiple regression. sage.
- (Jordan & Audia, 2012) Jordan, A. H., & Audia, P. G. (2012). Self-Enhancement and Learning from Performance Feedback. Academy of Management Review, 37(2), 211-231. [CrossRef]
- (Joseph & Gaba, 2015) Joseph, J., & Gaba, V. (2015). The fog of feedback: Ambiguity and firm responses to multiple aspiration levels. Strategic Management Journal, 36(13), 1960-1978. [CrossRef]
- (Kahneman & Tversky, 1979) Kahneman, D., & Tversky, A. (1979). Prospect Theory: An Analysis of Decision under Risk. Econometrica, 47(2), 263. [CrossRef]
- (Kennedy, 2008) Kennedy, P. (2008). A guide to econometrics. John Wiley & Sons.
- (Kim et al., 2015) Kim, J.-Y., Finkelstein, S., & Haleblian, J. (2015). All Aspirations are not Created Equal: The Differential Effects of Historical and Social Aspirations on Acquisition Behavior. Academy of Management Journal, 58(5), 1361-1388. [CrossRef]
- (Kuusela et al., 2017) Kuusela, P., Keil, T., & Maula, M. (2017). Driven by aspirations, but in what direction? Performance shortfalls, slack resources, and resource-consuming vs. resource-freeing organizational change. Strategic Management Journal, 38(5), 1101-1120. [CrossRef]
- (Liang & Zeger, 1986) Liang, K. Y., & Zeger, S. L. (1986). Longitudinal Data-Analysis Using Generalized Linear-Models. Biometrika, 73(1), 13-22. [CrossRef]
- (Marsh & Cormier, 2001) Marsh, L. C., & Cormier, D. R. (2001). Spline regression models (Vol. 137). Sage.
- (Ocasio, 1997) Ocasio, W. (1997). Towards an Attention-Based View of the Firm. Strategic Management Journal, 18(S1), 187-206. [CrossRef]
- (Ocasio, 2011) Ocasio, W. (2011). Attention to Attention. Organization Science, 22(5), 1286-1296. [CrossRef]
- (Porter, 1980) Porter, M. E. (1980). Competitive strategy: Techniques for analyzing industries and competition. Free Press.
- (Rhee & Haunschild, 2006) Rhee, M., & Haunschild, P. R. (2006). The Liability of Good Reputation: A Study of Product Recalls in the U.S. Automobile Industry. Organization Science, 17(1), 101-117. [CrossRef]
- (Schneider, 1992) Schneider, S. L. (1992). Framing and conflict: aspiration level contingency, the status quo, and current theories of risky choice. Journal of Experimental Psychology: Learning, Memory, and Cognition, 18(5), 1040-1057. [CrossRef]
- (Seow, 2025) Seow, R. Y. C. (2025). The Dynamics of Performance Feedback and ESG Disclosure: A Behavioral Theory of the Firm Perspective. Corporate Social Responsibility and Environmental Management, 32(2), 2598-2615. [CrossRef]
- (Shane & Venkataraman, 2000) Shane, S., & Venkataraman, S. (2000). The promise of entrepreneurship as a field of research. Academy of Management Review, 25(1), 217-226. [CrossRef]
- (Shimizu, 2007) Shimizu, K. (2007). Prospect Theory, Behavioral Theory, and the Threat-Rigidity Thesis: Combinative Effects on Organizational Decisions to Divest Formerly Acquired Units. Academy of Management Journal, 50(6), 1495-1514. [CrossRef]
- (Shinkle, 2011) Shinkle, G. A. (2011). Organizational Aspirations, Reference Points, and Goals. Journal of Management, 38(1), 415-455. [CrossRef]
- (Staw, 1976) Staw, B. M. (1976). Knee-deep in the big muddy: A study of escalating commitment to a chosen course of action. Organizational behavior and human performance, 16(1), 27-44. [CrossRef]
- (Van der Voet, 2023) Van der Voet, J. (2023). Search in response to negative performance feedback: problem-definition and solution-generation. Journal of Public Administration Research and Theory, 33(1), 43-62. [CrossRef]
- (Vidal & Mitchell, 2015) Vidal, E., & Mitchell, W. (2015). Adding by Subtracting: The Relationship Between Performance Feedback and Resource Reconfiguration Through Divestitures. Organization Science, 26(4), 1101-1118. [CrossRef]
- (White, 1980) White, H. (1980). A heteroskedasticity-consistent covariance matrix estimator and a direct test for heteroskedasticity. Econometrica: journal of the Econometric Society, 817-838. [CrossRef]
- (Wooldridge, 2010) Wooldridge, J. M. (2010). Econometric Analysis of Cross Section and Panel Data. MIT press.
- (Zhang et al., 2023) Zhang, M., Shui, X., Smart, P., Wang, X., & Chen, J. (2023). Environmental performance feedback and timing of reshoring: perspectives from the behavioural theory of the firm. British Journal of Management, 34(3), 1238-1258. [CrossRef]
Figure 1.
Interactive effects of market share changes and attractiveness on market retrenchment.
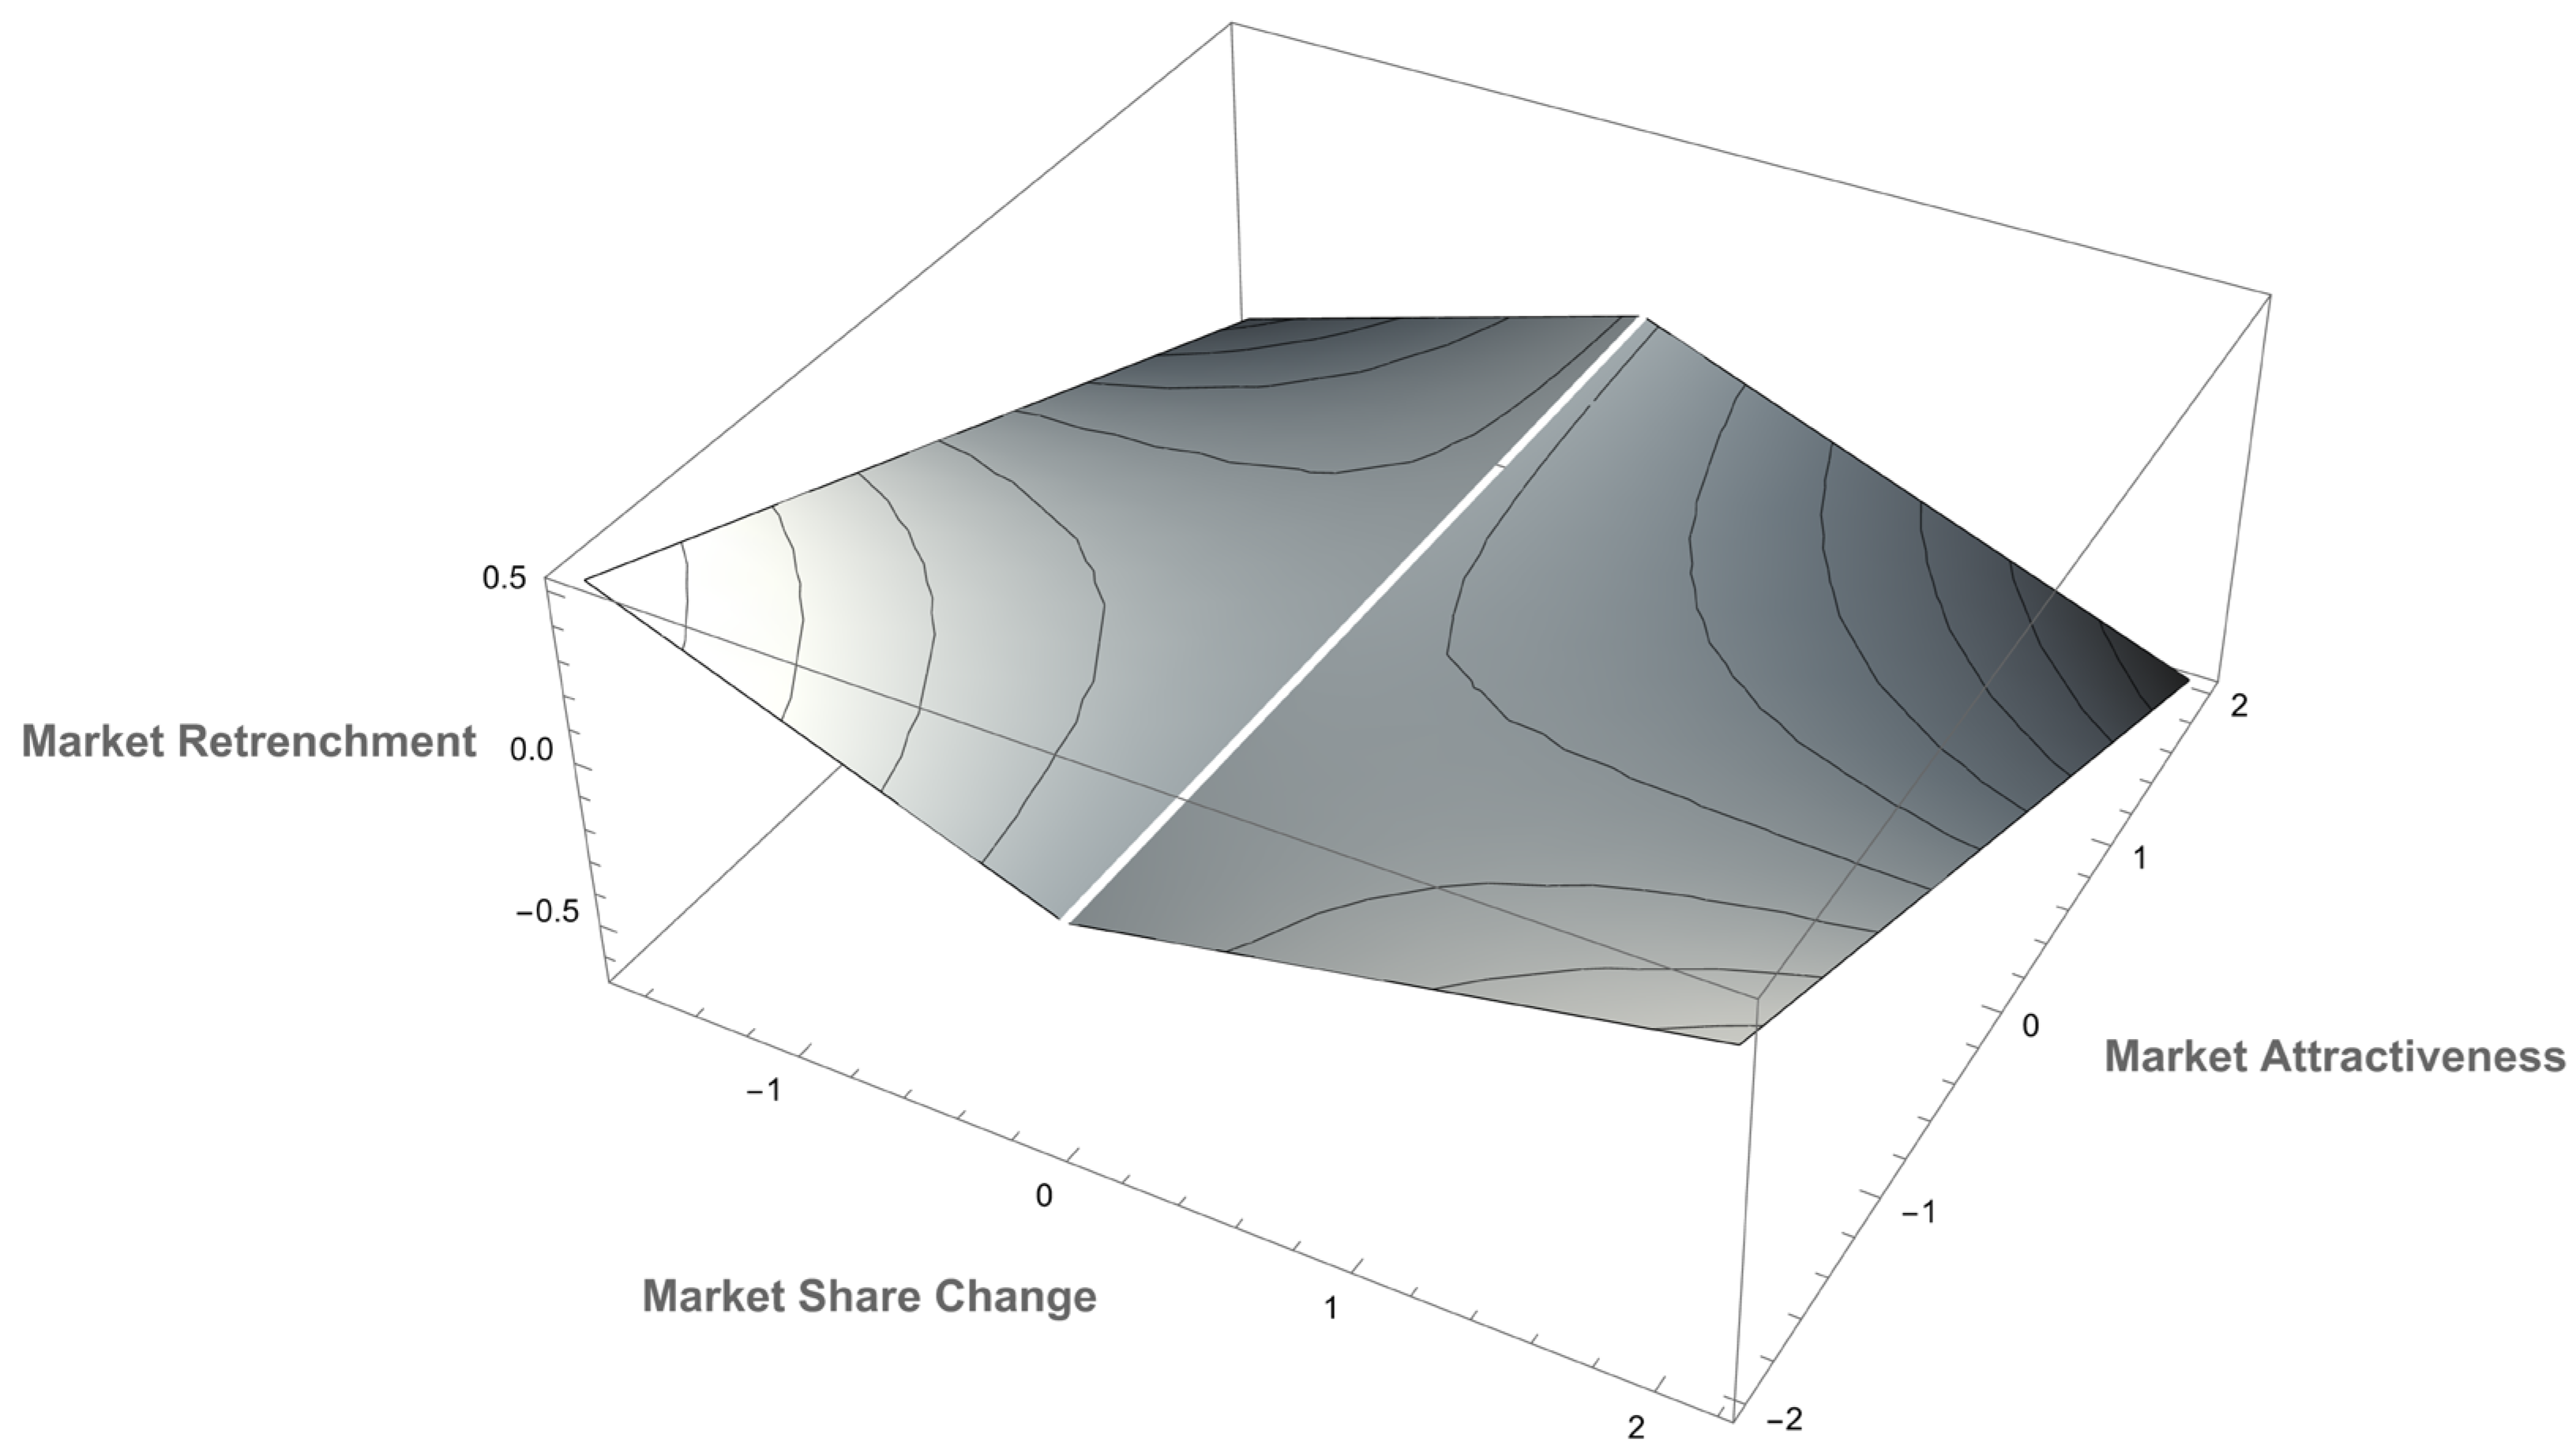

Table 1.
Effects of market attractiveness and market share changes on market retrenchment.
| Loss in Market Share | Gain in Market Share | |
|---|---|---|
| High Market Attractiveness | Decreases (H4) | Decreases (H5) |
| Average Market Attractiveness | No change (H2) | Decreases (H3) |
| Low Market Attractiveness | Increases (H4) | Increases (H5) |
Table 2.
Descriptive statistics and correlations.
| Variable | Mean | SD | 1 | 2 | 3 | 4 | 5 | 6 | 7 | 8 | 9 | 10 | 11 | 12 |
|---|---|---|---|---|---|---|---|---|---|---|---|---|---|---|
| 1. Market retrenchment | 0.763 | 2.065 | ||||||||||||
| 2. Market attractiveness | 5.242 | 1.227 | 0.083 | |||||||||||
| 3. Market share loss | −0.366 | 0.649 | -0.073 | 0.026 | ||||||||||
| 4. Market share gain | 0.253 | 0.958 | -0.028 | 0.083 | 0.149 | |||||||||
| 5. Market householdsa | 0.008 | 1.004 | 0.412 | 0.399 | 0.029 | 0.002 | ||||||||
| 6. Market competition densitya | −0.490 | 0.628 | -0.219 | -0.770 | -0.024 | -0.046 | -0.727 | |||||||
| 7. Own local density | 19.11 | 23.045 | 0.617 | 0.334 | -0.157 | 0.070 | 0.722 | -0.564 | ||||||
| 8. Prefecture size | 0.008 | 0.011 | 0.069 | -0.001 | 0.003 | -0.019 | 0.115 | -0.017 | 0.134 | |||||
| 9. Return on assets | 0.003 | 0.008 | 0.017 | 0.115 | 0.042 | 0.038 | 0.002 | -0.068 | 0.100 | 0.001 | ||||
| 10. Firm slack | −0.053 | 0.128 | 0.084 | 0.029 | -0.135 | 0.098 | 0.012 | -0.021 | 0.176 | 0.005 | -0.018 | |||
| 11. Firm sizeb | 14.02 | 0.979 | 0.153 | 0.261 | -0.280 | 0.189 | -0.006 | -0.148 | 0.412 | 0.001 | 0.228 | 0.464 | ||
| 12. Geographic diversification | 0.957 | 0.023 | 0.011 | 0.016 | -0.063 | -0.005 | -0.116 | 0.021 | 0.086 | 0.003 | 0.023 | -0.132 | 0.124 | |
| 13. Industry clock | 4.823 | 3.444 | -0.109 | 0.443 | 0.165 | 0.056 | -0.034 | -0.285 | -0.019 | -0.001 | 0.133 | -0.089 | 0.099 | -0.030 |
Number of observations = 4223. Coefficients with absolute values greater than 0.029 are significant at p < 0.05 level. a Orthogonalized variables; b Log-transformed variable.
Table 3.
Results of the negative binomial regression with GEEs for market retrenchment.
| Variable | Model 1 | Model 2 | Model 3 | Model 4 | Model 5 | |||||
|---|---|---|---|---|---|---|---|---|---|---|
| Market households | 0.074 (0.069) |
0.097 (0.060) |
0.071 (0.066) |
0.094 (0.058) |
0.090 (0.055) |
|||||
| Market competition density | −0.060 (0.065) |
0.087 (0.070) |
−0.054 (0.064) |
0.093 (0.074) |
0.120 (0.077) |
|||||
| Own local density | 0.026 (0.002) |
** | 0.026 (0.002) |
** | 0.027 (0.002) |
** | 0.027 (0.002) |
** | 0.027 (0.002) |
** |
| Prefecture size | 7.409 (1.950) |
** | 7.310 (1.945) |
** | 7.100 (1.962) |
** | 7.001 (1.955) |
** | 6.917 (1.952) |
** |
| Return on assets | −9.688 (5.829) |
† | −9.788 (5.862) |
† | −10.258 (5.708) |
† | −10.337 (5.742) |
† | −10.484 (5.769) |
† |
| Firm slack | −0.326 (0.950) |
−0.283 (0.940) |
−0.314 (0.973) |
−0.271 (0.929) |
−0.276 (0.932) |
|||||
| Firm size | 0.134 (0.157) |
0.116 (0.155) |
0.167 (0.155) |
0.148 (0.154) |
0.140 (0.152) |
|||||
| Geographic diversification | −3.235 (1.499) |
* | −3.122 (1.483) |
* | −3.376 (1.475) |
* | −3.264 (1.462) |
* | −3.360 (1.445) |
* |
| Industry clock | −0.073 (0.033) |
* | −0.078 (0.033) |
* | −0.071 (0.034) |
* | −0.075 (0.033) |
* | −0.076 (0.033) |
* |
| Market attractiveness | 0.124 (0.054) |
* | 0.123 (0.056) |
* | 0.216 (0.069) |
** | ||||
| Market share loss | 0.064 (0.045) |
0.059 (0.045) |
−0.038 (0.066) |
|||||||
| Market share gain | −0.204 (0.056) |
** | −0.202 (0.057) |
** | −0.073 (0.050) |
|||||
|
Market share loss× Market attractiveness |
0.135 (0.044) |
** | ||||||||
|
Market share gain× Market attractiveness |
−0.115 (0.029) |
** | ||||||||
| Wald chi-squared | 3337.23 | 3687.22 | 5318.94 | 5987.89 | 92977.05 | |||||
| df (for Wald chi-squared) | 9 | 10 | 11 | 12 | 14 | |||||
| p-value | p < 0.01 | p < 0.01 | p < 0.01 | p < 0.01 | p < 0.01 | |||||
| Number of observations | 4223 | 4223 | 4223 | 4223 | 4223 | |||||
| Number of groups | 16 | 16 | 16 | 16 | 16 | |||||
† p < 0.1, * p < 0.05, ** p < 0.01; standard errors are in parentheses.
Disclaimer/Publisher’s Note: The statements, opinions and data contained in all publications are solely those of the individual author(s) and contributor(s) and not of MDPI and/or the editor(s). MDPI and/or the editor(s) disclaim responsibility for any injury to people or property resulting from any ideas, methods, instructions or products referred to in the content. |
© 2025 by the authors. Licensee MDPI, Basel, Switzerland. This article is an open access article distributed under the terms and conditions of the Creative Commons Attribution (CC BY) license (http://creativecommons.org/licenses/by/4.0/).
Copyright: This open access article is published under a Creative Commons CC BY 4.0 license, which permit the free download, distribution, and reuse, provided that the author and preprint are cited in any reuse.


