Submitted:
16 July 2025
Posted:
17 July 2025
Read the latest preprint version here
Abstract
NELIPS acronym standing for Nano-Enhanced Laser Induced Plasmas Spectroscopy. Within this framework, the temporal variation of the enhanced emission averaged over different emission wavelengths was measured within delay time from 1 to 7 ms at fixed laser irradiance and gate time of 1ms. Different nanomaterials were employed including silver, zinc, titanium and iron. Both of bulk and pure-nanomaterial plasmas were ignited under similar conditions by Nd-YAG laser radiation at 1064 nm. However, the pure nano-based plasma emission spectral line intensities was reveal to decline at a slower pace with time. Meanwhile, the average enhanced emission was found to increase in an exponential manner with time too. This, and a model was suggested based on the first derivative of enhancement with time, which was found precisely predicts this exponential variation in enhanced emission with time.
Keywords:
Enhanced-Emission
; NELIPS
; Temporal variation
; Nanomaterials
; Boltzmann plot
1. Introduction
Highly focusing of laser radiation from pulsed laser sources leads to ignition of plasma at the surface of irradiated target material [1]. The thermodynamical state of the generated plasma can be fully specified by plasma parameters (electron number density and temperature) [2]. Therefore, their values are important enough to be experimentally measured with adequate accuracy [3]. The process of generating plasma at the surface of irradiated target by lasers identifies with laser induced plasma (LIP) (and/or breakdown -LIB) [1]. We believe that emitted radiation from plasma is strongly influenced by plasma electron density and temperature, hence optical emission spectroscopy OES-technique was employed. The whole the process is then known as laser induced plasma spectroscopy LIPS. Moreover, the acronym LIPS is much more concerned with the spectroscopic study of the plasma generated by lasers, which incorporates the state of thermodynamical equilibrium [2], the set of equilibrium distributions relations that can be applied to describe this state [2,3], dynamics of the plasma with space and time [4], spectral line shape analysis [5], spectral line shift [5,6] and/or line asymmetry [5,6], plasma opacity of plasma to emitted spectral lines via self-absorption [7,8] and/or self-reversal [7,8], inhomogeneity of plasma produced by focusing laser light on targets [1], mechanism of plasma ignition at target surface [9 and references there in] etc.
However, the interaction of lasers with pure nanomaterials was found to produce plasmas with much more luminescent than that induced from the pure bulk counterpart under similar experimental condition [9]. The physics aimed with the relative increase in luminosity was called enhanced emission and the whole the physical-approach was introduced as Nano-Enhanced laser induced plasma spectroscopy (NELIPS) [9].
The proceedings of NELIPS were broken down into a set of parametric experimental studies incorporates different nanomaterials, nano-sizes, laser fluences and different laser wavelengths. The experimental findings over the different studies are concisely reported together with successful semi-empirical theoretical modeling based on simple laws of thermodynamics were extensively reported in the review article [9].
Meanwhile, the previous measurements (adopting NELIPS and Nano-Enhanced laser induced breakdown spectroscopy NELIBS) were almost carried at only one arbitrary salient transition wavelength [9,10]. In turn, this would entail serious difficulty in reproducing results in the NELIBS albeit leading to some unfortunate theoretical predictions [9,10,11,12,13].
However, in most cases, there is obvious scattering of the measured data points around the straight Boltzmann plot which indicates distortions in line shape via self-absorption [1,2,3]. Fortunately, the effect of self-absorption can be removed using the benchmark Hα- spectral line at 656.27 nm [21] in a well-known procedure with details as given in ref. [8].
It is worth noting that reliable Boltzmann plot depends on accurate transition probabilities [1,2,3,18], Stark broadening while taking into consideration the spectral sensitivity of detection apparatus as well [3]. Moreover, it is very sensitive to any variation in plasma temperature and population density of atoms in the ground state (i.e., concentration) [1,2,3,14]. For that reason, it is a convenient tool to measure the average amount of enhanced emission in addition to precise measurement of the relative electron temperatures In this article, the temporal variation of the amount of enhanced emission adopting the NELIPS is presented in the range from 1 to 7 μs (at fixed gate time of 1 μs). Four different nanomaterials were used, silver, zinc, iron and titanium which are prepared in the bulk and nanomaterial form. The amount of enhanced emission is assessed via proper employment of several spectral lines in conjunction with Boltzmann plot method. A rigorous relation describing the observed temporal variation of amount enhanced emission in NELIPS approach with delay time was elaborated with detailed derivations presented in appendix A.
2. Experimental Setup and Methodology
2.1. General Preview
The experimental setup is shown in Figure 1 which comprises Nd: YAG laser working at wavelength of 1064 nm and adjusted to constant level of laser fluence 6.3±0.5 J/cm2 at the surface of target. The detection system comprises the SE200-Echelle type spectrograph of resolving power around 2000 equipped with time controlled ICCD-Camera (Andor-iStar-model DH734-18F). The gate time was fixed at 1 μs while the delay time was detuned in the range from 1 to 5 μs except for the titanium and iron targets which encourage us to extend the delay time up to 7 μs. The emitted light from both plasmas is then derived to the SE200- spectrograph via 25 μm optical fiber. Both detection and recording apparatus were absolutely calibrated prior to experiments [15].
Four different types of nanomaterials were employed together with their bulk counterparts. The nanomaterial targets were prepared and provided by the Center-of-Nanomaterial at the Military-Technical-College (MTC) “Egyptian-Army”. Transverse electron microscope TM and XRT displayed powders of spherical shaped nanoparticles with diameters about 25±5 nm (Fe3O4), 30±4 nm (ZnO) and 20±3 nm (TiO2).
These materials were chosen to offer the following two diverse emission properties. Well-isolated spectral lines pertinent to silver and zinc would allow carrying out reliable Boltzmann plots of self-absorption and relative sensitivity corrected spectral lines [1,2,3]. In contrast, dense plasma spectral line emission associated with iron and titanium precludes such plots to plausibly embrace averaging over a few available spectral lines instead. Meanwhile, each of the data points is the result of collection of light from plasma emission over 5-consecutive shots in different places while the ICCD-camera gain is set at a constant level of 200 throughout experimental measurements.
2.2. Data Processing
2.3. Preliminary
Figure 2a–d displays the recorded preliminary data of enhanced emission spectra under a variety of arbitrary chosen experimental conditions from the Ag I and Zn I-lines, both before and after corrections against effect of self- absorption [8]. It proves that, corrections against plasma opacity are vital in the determination of the real amount of enhanced emission as well as precise plasma electron temperatures. These procedures have been applied to the six emission spectral lines intrinsic to zinc and silver plasmas. The retrieved corrected spectral radiances are used to construct a perfect straight line Boltzmann plot as well as a reliable measurement of the average enhanced coefficientover the different emission wavelengths to promote NELIPS approach. A well-established increase in the calculated amount of enhancement after correction against self-absorption could therefore be invoked.
On the other hand, Figure 3a–d illustrates the global NELIPS enhanced emission from nano-based iron and titanium at arbitrary chosen wavelengths without correction against self-absorption. There appears a similar trend of uprising enhanced emission with delay time. In this context, we opted for the calculation of the average of emission over many spectral lines spanning band wavelengths from 300 to 560 nm.
In general, the absolute and/or relative plasmas electron densities are usually estimated utilizing the unique properties of the Hα-line [21] appeared in different spectra. Well-defined spectral line shapes of the recorded Hα lines are shown in Figure 4a–d associated with plasmas at arbitrary chosen different delay times and different materials including silver, zinc, iron and titanium.
3. Results and Discussion
3.1. Measurement of Plasma Parameters
The electron densities of plasmas created at the surface of the different types of materials (Nanomaterials or bulky ones) were measured using the benchmark Hα- spectral line at 656.27nm [21]. Obtained results of measurements are listed in Table 2, in different colors for the nanomaterials and bulky counterparts in a limited delay times from 1 to 5 μs. This would predominantly validate the assumption laid within the principles of NELIPS [9,15] about the ratio.
A reliable measurement of the electron temperature of plasmas was carried out via Boltzmann plot method [1,2,3,15] provided that certain tight criteria are being met. For plasma in local thermodynamical equilibrium (LTE), the well resolved spectral lines should be optically thin and originate from the same atomic species belonging to the same ionization stage with appropriately large upper excitation energy. Moreover, the selected spectral lines radiances (in the units of (au)) should be corrected by the relative spectral sensitivity of the used apparatus including camera-ICCD and spectrograph as well as other optical components e.g., optical fibers…etc.). Further, for spectral lines self–absorption suspected, traditionally adopted method [8]. It is based on the direct comparison of the measured electron density from suspected emission lines to that using Hα−spectral line, using the well-established relation of amount of self-absorption coefficient, [8]. Furthermore, the corrected peak spectral radiance of any of the distorted spectral line can be retrieved via application of the simple relation [8]. Here, is the experimentally measured electron density from the suspected line, and is the retrieved (corrected) spectral line intensity as if the line is optically thin [8]. This retrieved spectral line intensity should further be corrected by relative sensitivity of the used apparatus (absolute radiometric light source DE-2000-CAL) to different emission wavelengths using the factors (reproduced after absolute calibration).
Finally, the plot of the quantity versus excitation energy of the upper excited stateusing several spectral lines must yield a straight line of negative slope. The inverse of the slope of this line is the plasma electron temperature (eV).
Figure 5a,b demonstrates the application of Boltzmann plot method used to measure the electron temperatures and. Figure 5a neutral silver plasma emission at a delay time of 3 μs incorporates Ag I-spectral lines at 546.54, 520.90, 768.77, 827.35, 338.28 and 328.06 nm. Likewise, Figure 5b concerns with Zn I spectral lines at 481.08, 472.20, 468.01, 636.23, 334.55and 330.27 nm monitored at a delay time of 5 μs.
Similar Boltzmann plots have been constructed at different delay times for the bulk and nano-based Zn and Ag plasma emission to obtain the electron temperatures at each delay time with the results as listed in Table 2. On a par with plasma electron density, nearly equal bulk and nano-based at fixed delay time is confirmed. However, as the delay time increases, both of plasma parameters decrease in a monotonic manner.
3.2. Measurement of Average Enhancement Coefficients over Different Wavelengths
The average amount of silver and zinc enhanced plasma emission over different emission wavelengths have been determined via measurement of the factors as displayed in Figure 5a,b. A set of similar Boltzmann plots at different delay times (1-5 μs) have been constructed where the values of [9,15] were extracted, and recorded in Table 3.
Unfortunately, these regular procedures cannot be applied in case of iron and titanium spectral emissions for the previously mentioned reasons (absence of Stark broadening parameters from standard tables and very crowded emission spectra). Instead, we have considered the average enhancement over several concomitant spectral line emissions from 300 nm to 560 nm which has been elaborated at different delay times of 1, 3, 5 and 7 μs. This simple method may contain to extraneous emission lines which do not belong to iron and/or titanium. The maximum wavelength in the range at 560 nm was preset to avoid the spectral line emissions from the surrounding air (Oxygen, Nitrogen and the strong Hα). The existence of emission from the O II- ions at wavelength around 394, 396 nm cannot be avoided, which contains some errors (around 10-15 %). However, this elementary method to calculate was applied on iron and titanium emission spectra with the results shown in Table 3 (red colored).
For example, for silver, without correction to spectral lines at delay time of 1 and 5μs we getmarked in red, in Table 3, while after correction it amounts to, marked in blue. This ensures the importance of correcting spectral intensity of the spectral lines as carried and hence the alignment of the data points on the Boltzmann line straight line to secure valid values of and true electron temperatures.
Table 3 lists the overall results of the measurements of the average amount of enhanced emission over different emission wavelengthsfor silver, zinc (both before and after correction to spectral lines intensities) utilizing the Boltzmann plot method as well as from iron and titanium, but, without corrections against SA.
3.3. Modeling of the Temporal Variation of Average Amount of Enhancement
A close inspection of the numerical results presented in Table 3 with delay time elicits an exponential growth of the amountwith time. This suggests the following relation (detailed derivations of this expression is presented in appendix A) ,
whereis the amount of enhanced emission (averaged over different emitted wavelengths) at delay time (t), with the initial value (at t = 0). The numerical fitting constant reflects the relative radiative relaxation rates of nano to bulk-based plasma evolution.
Figure 6a–d displays the results of fitting of the experimental data (at Table 3) to the smooth expression (1), plotted on logarithmic scale for the zinc and silver spectral data and on a linear scale for iron and titanium. The values of best fitting parameters in expression (1) (are depicted on the subfigures and the overall numerical values are given in Table 4.
Mathematically, expression (1) indicates that the factorconstitutes the initial enhanced emission at the onset of the presumed state of equilibrium of plasma evolution. On the other hand, in accordance with theoretical elaboration of signal-to-noise ratio data the exponential factor (which should be a positive quantity), turns out to represent the difference between the rates of change of the spectral line intensity (slopes) from the nano and bulk-based plasmas (see appendix A).
The factors andare evaluated as the slopes of the temporal variation of the logarithm of the Signal-to-Noise ratio displayed in Figure A1 at appendix A. For instance, in case of silver plasma emission spectral lines, the estimated slope of were calculated and gives values of which numerically yields the value of the fitting parameter with the set of the calculated slopes are given in Table 5.
Meanwhile, it is worth noting that these slopes andfeature the rates of plasma radiative energy loss during plasma expansion process (see Figure A1, appendix A). This would inevitably imply that nanomaterial plasma cools at a relatively lower rate than its bulk counterpart. Moreover, these rates are found to be susceptible to spectral line shape distortions in the case of using the uncorrected spectral bands of iron and titanium. This can be clearly seen referring to numerical values of slopes and, as presented in Table 5, which contains summary of the numerical values of different rates and.
The calculated values of in Table 5 (marked with red color) virtually reproduce the experimentally evaluated fitting parameters of (presented in Table 4- marked with red also). This would indicate the validity of the derived expression (2) (see appendix A) describing the strength of the temporal evaluation of the average amount of enhanced emission over different wavelengths with delay time.
In this context, we recommend further research dealing with investigating these values of its dependency on the type of material on a more rigorous theoretical basis.
3. Conclusions
In the framework of NELIPS approach, the temporal variation of the average enhanced plasma emission over wide range of emission wavelengths was explored. The monitored emission enhancement reveals to increases in exponentially manner with time. This phenomenon can be attributed to the slower rate of radiative emission by plasma generated from the pure nanomaterials with respect to that plasma generated from bulky counterpart under similar conditions. This decrease of spectral line intensities with time was theoretically derived in the framework of NELIPS and found in excellent agreement with experimental findings which corroborate NELIPS approach. Finally, was have found that the nanomaterials and their bulk-counterparts plasmas from silver, zinc iron and titanium nearly shares similar plasma electron density and temperatures at fixed delay time, but decreases monotonically as the time pass. More theoretical work is needed to be carried to account for these findings.
Author Contributions
Conceptualization, A.E.S.; methodology, A.E.S.; software, A.E.S.; validation, A.E.S. and A.A.; formal analysis, A.E.S.; investigation, A.E.S.; data curation, A.E.S.; writing—original draft preparation, A.E.S.; writing—review and editing, A.E.S. and A.A.; visualization, A.E.S. and A.A.; supervision, A.A. All authors have read and agreed to the published version of this manuscript.
Funding
This research received no external funding.
Data Availability Statement
The data presented in this study concerning NELIPS are available upon a reasonable request from the corresponding author.
Acknowledgments
The authors would like to express their deepest gratitude to the wholeheartedness of Quantum Beam Sci.-MDPI-Publishing-House, for the kind peer review as well as the second time respected offer of the free of charge publishing our work.
Appendix A
“Mathematical derivations of the temporal variation of enhanced emission”
One can start from the basic definition of enhanced emission,
The rate of change of enhanced emission with time can be expressed as,
This can be simply expanded as,
On rearranging, we obtain,
After rearrangement we get,
This derivative can be rewritten as,
Implicitly, this implies that one should use the logarithm of the spectral line intensities.
Integrating both sides of (A6) yields the final solution as,
where,denotes the initial enhanced emission at t=0. The exponent factor is given by equation (A6),
where, are the slopes of the (logarithm of the measured spectral intensity) as shown in the set of subfigures in Figure A1,
The validity of expressions (A9, A10) was tested, adopting the following procedures;
- Calculate the slopes, from the logarithmic plots Figure (1A) ,
- Calculate the difference in slopes and call that as ,
- Record the results in Table 5 (red colored),
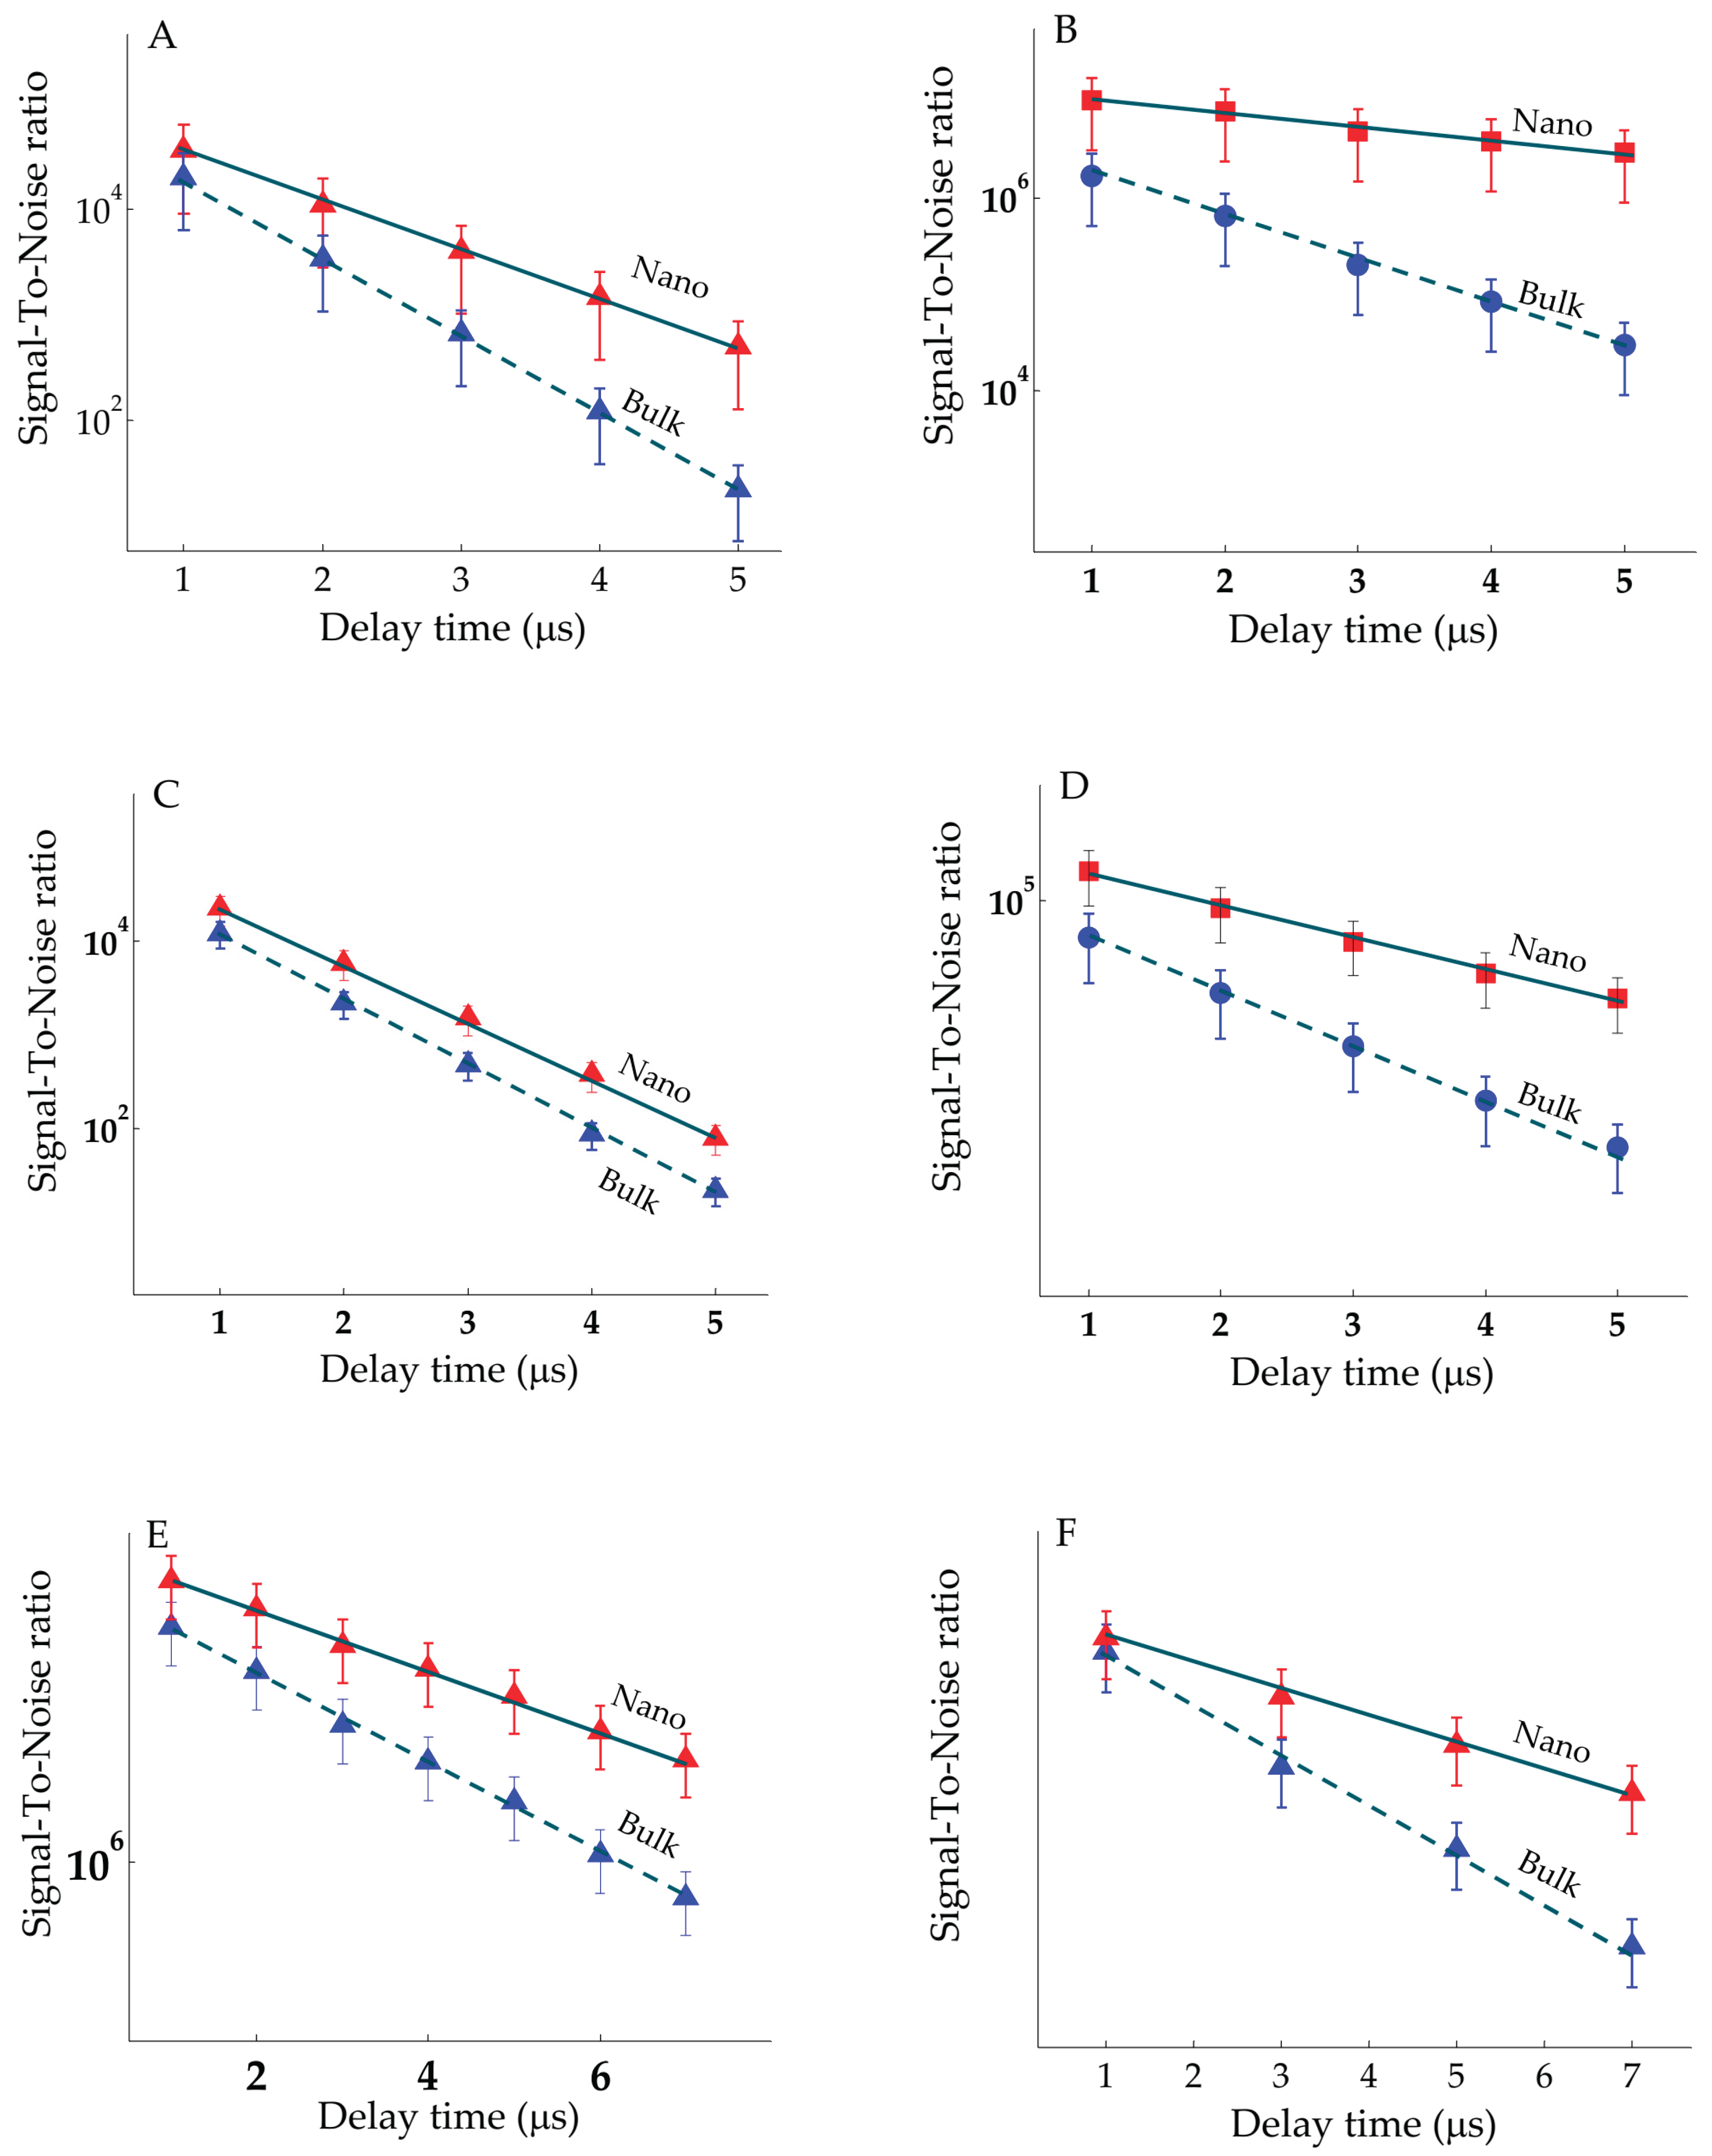
Thereupon Figures A1(A-D) display the variation of the signal-to-noise (S/N) ratio constructed using the silver and zinc spectral lines, respectively both before and after corrections against self-absorption as well as the uncorrected data from iron and titanium as presented at Figure A1(E, F). The -factor values derived from relation (A7) reproduce experimental fitting values listed in Table 4.
Figure A1.
Temporal variation of signal-to-noise for different elements, upper straight lines are originated from nanomaterial-based target (filled triangles are assigned to data points of uncorrected spectral lines against SA, and circles from bulk and filled squares for corrected spectral radiance against SA) (A) Silver, (B) Zinc, (C) Iron, (D) Titanium.
References
- Cremers, D.A.; Leon, J.R. Handbook of Laser-Induced Breakdown Spectroscopy, 1st ed.; Wiley: Hoboken, NJ, USA, 2013.
- Fujimoto, T. Plasma Spectroscopy. In Plasma Polarization Spectroscopy. In Plasma Polarization Spectroscopy; Fujimoto, T., Iwamae, A., Eds.; Springer: Berlin/Heidelberg, Germany, 2008; Volume 44, pp. 29–49. [Google Scholar]
- Kunze, H.-J. Introduction to Plasma Spectroscopy; Springer Series on Atomic, Optical, and Plasma Physics; Springer: Berlin/Heidelberg, Germany, 2009; Volume 56.
- Tsurutani, B.T.; Zank, G.P.; Sterken, V.J.; Shibata, K.; Nagai, T.; Mannucci, A.J.; Malaspina, D.M.; Lakhina, G.S.; Kanekal, S.G.; Hosokawa, K.; et al. Space Plasma Physics: A Review. IEEE Trans. Plasma Sci. 2023, 51, 1595–1655. [Google Scholar] [CrossRef]
- Gomez, T.A.; Nagayama, T.; Cho, P.B.; Kilcrease, D.P.; Fontes, C.J.; Zammit, M.C. Introduction to Spectral Line Shape Theory. J. Phys. B: At. Mol. Opt. Phys. 2022, 55, 034002. [Google Scholar] [CrossRef]
- Sorge, S.; Günter, S. Simulation of Shifted and Asymmetric Hydrogen Line Profiles. The European Physical Journal D 2000, 12, 369–375. [Google Scholar] [CrossRef]
- Quintana-Silva, G.; Sobral, H.; Rangel-Cárdenas, J. Characterization of CdTe Thin Films Using Orthogonal Double-Pulse Laser-Induced Breakdown Spectroscopy. Chemosensors 2022, 11, 4. [Google Scholar] [CrossRef]
- El Sherbini, A.M.; El Sherbini, Th.M.; Hegazy, H.; Cristoforetti, G.; Legnaioli, S.; Palleschi, V.; Pardini, L.; Salvetti, A.; Tognoni, E. Evaluation of Self-Absorption Coefficients of Aluminum Emission Lines in Laser-Induced Breakdown Spectroscopy Measurements. Spectrochimica Acta Part B: Atomic Spectroscopy 2005, 60, 1573–1579. [Google Scholar] [CrossRef]
- Sherbini, A.E.; Aboulfotouh, A.; Sherbini, T.E. On the Similarity and Differences Between Nano -Enhanced Laser-Induced Breakdown Spectroscopy and Nano-Enhanced Laser-Induced Plasma Spectroscopy in Laser-Induced Nanomaterials Plasma. QuBS 2024, 9, 1. [Google Scholar] [CrossRef]
- De Giacomo, A.; Alrifai, R.; Gardette, V.; Salajková, Z.; Dell’Aglio, M. Nanoparticle Enhanced Laser Ablation and Consequent Effects on Laser Induced Plasma Optical Emission. Spectrochim. Acta Part B At. Spectrosc. 2020, 166, 105794. [Google Scholar] [CrossRef]
- Jamil, S.; Liaqat, U.; Ahmed, N.; Ahmed, R.; Umar, Z.A.; Baig, M.A. The Role of Nanoparticles Concentration in the EmissionIntensity Enhancement of the Laser-Produced Aluminum Plasma. Phys. B Condens. Matter 2022, 627, 413620. [Google Scholar] [CrossRef]
- Khan, M.R.; Haq, S.U.; Abbas, Q.; Nadeem, A. Improvement in Signal Sensitivity and Repeatability Using Copper NanoparticleEnhanced Laser-Induced Breakdown Spectroscopy. Spectrochim. Acta Part B At. Spectrosc. 2022, 195, 106507. [Google Scholar] [CrossRef]
- Safi, A.; Landis, J.E.; Adler, H.G.; Khadem, H.; Eseller, K.E.; Markushin, Y.; Honarparvaran, S.; De Giacomo, A.; Melikechi, N. Enhancing Biomarker Detection Sensitivity through Tag-Laser Induced Breakdown Spectroscopy with NELIBS. Talanta 2024, 271, 125723. [Google Scholar] [CrossRef] [PubMed]
- Griem, H.R. Plasma Spectroscopy; McGrow-Hill, Inc.: New York, NY, USA, 1964. [Google Scholar]
- EL Sherbini, A.M.; Aboulfotouh, A.; Rashid, F.F.; Allam, S.H.; Dakrouri, A.E.; EL Sherbini, T.M. Observed Enhancement in LIBS Signals from Nano vs. Bulk ZnO Targets: Comparative Study of Plasma Parameters. World J. Nano Sci. Eng. 2012, 2, 181–188. [Google Scholar] [CrossRef]
- Kramida, A.; Ralchenko, Y. NIST Atomic Spectra Database, NIST Standard Reference Database 78 1999.
- Dimitrijević, M.S.; Sahal-Bréchot, S. Stark Broadening of AgI Spectral Lines. Atomic Data and Nuclear Data Tables 2003, 85, 269–290. [Google Scholar] [CrossRef]
- Alhijry, I.A.; El Sherbini, A.M.; El Sherbini, T.M. Measurement of Deviations of Transition Probability of the Neutral Silver Lines at 827.35 and 768.77 Nm Using OES-Technique. Journal of Quantitative Spectroscopy and Radiative Transfer 2020, 245, 106922. [Google Scholar] [CrossRef]
- Dimitrijevic, M.S.; Sahal−Bréchot, S. Stark Broadening Parameter Tables for Neutral Zinc Spectral Lines. Serb Astron J 1999, 21–33. [Google Scholar] [CrossRef]
- Djurović, S.; Blagojević, B.; Konjević, N. Experimental and Semiclassical Stark Widths and Shifts for Spectral Lines of Neutral and Ionized Atoms (A Critical Review of Experimental and Semiclassical Data for the Period 2008 Through 2020). Journal of Physical and Chemical Reference Data 2023, 52, 031503. [Google Scholar] [CrossRef]
- El Sherbini, A.M.; Hegazy, H.; El Sherbini, Th.M. Measurement of Electron Density Utilizing the Hα-Line from Laser Produced Plasma in Air. Spectrochimica Acta Part B: Atomic Spectroscopy 2006, 61, 532–539. [Google Scholar] [CrossRef]
Figure 1.
NELIPS Experimental setup.
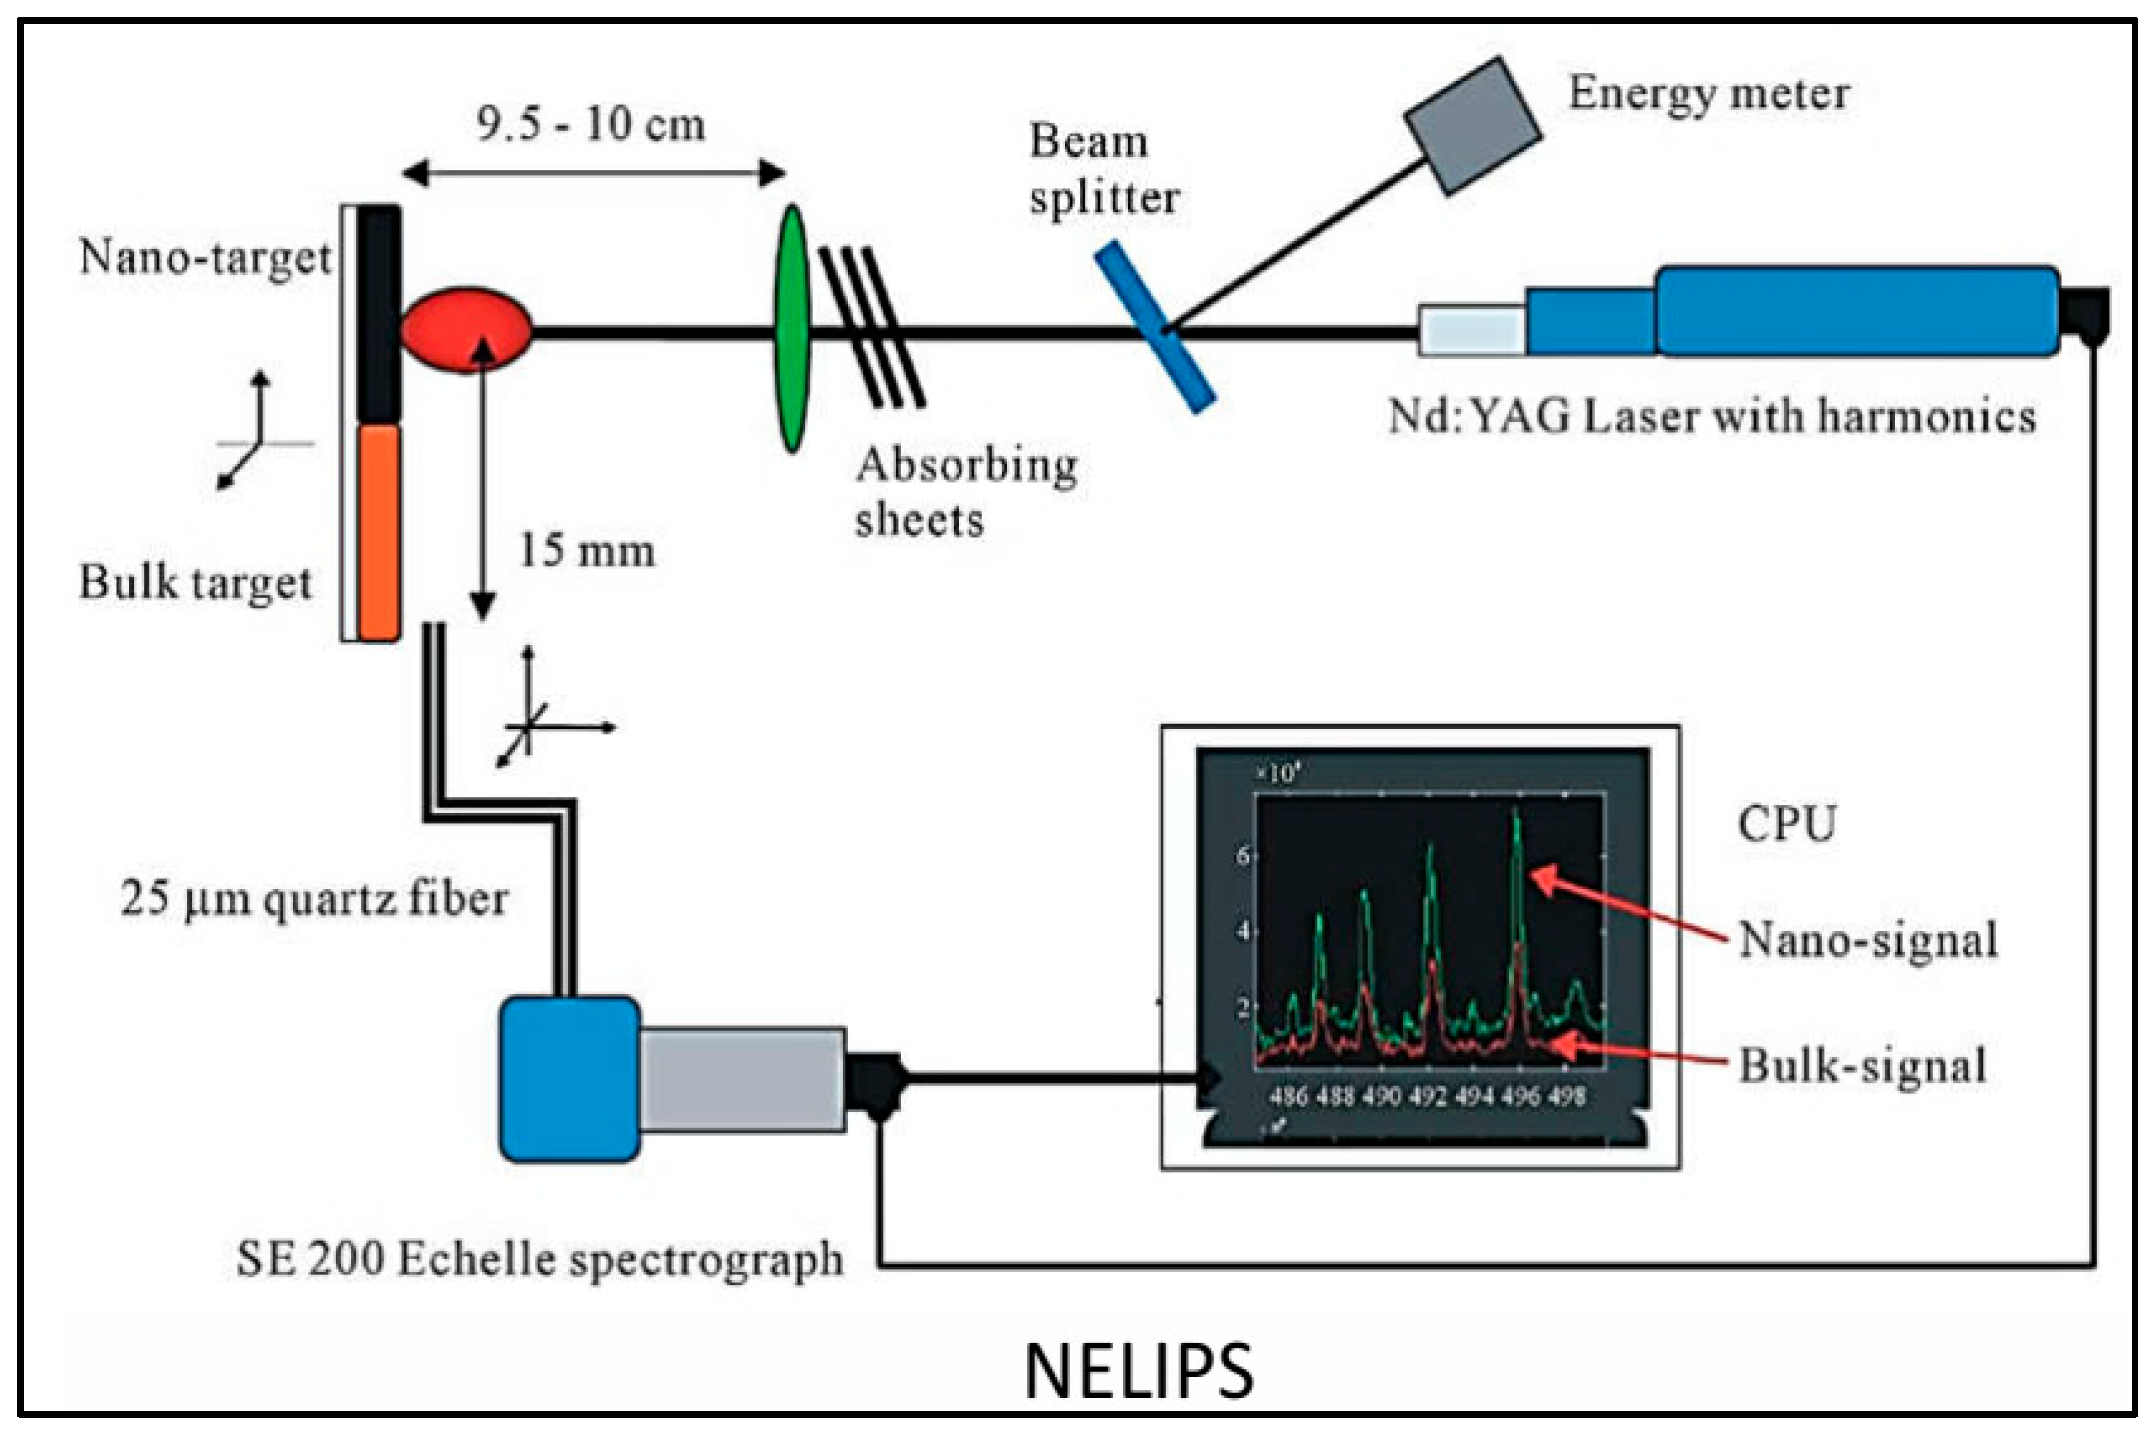
Figure 2.
NELIPS signals from Nano-based target (marked with red) in comparison to that from the bulk counterpart (marked with blue color), (a, b) for zinc, (c, d) for silver.
Figure 2.
NELIPS signals from Nano-based target (marked with red) in comparison to that from the bulk counterpart (marked with blue color), (a, b) for zinc, (c, d) for silver.
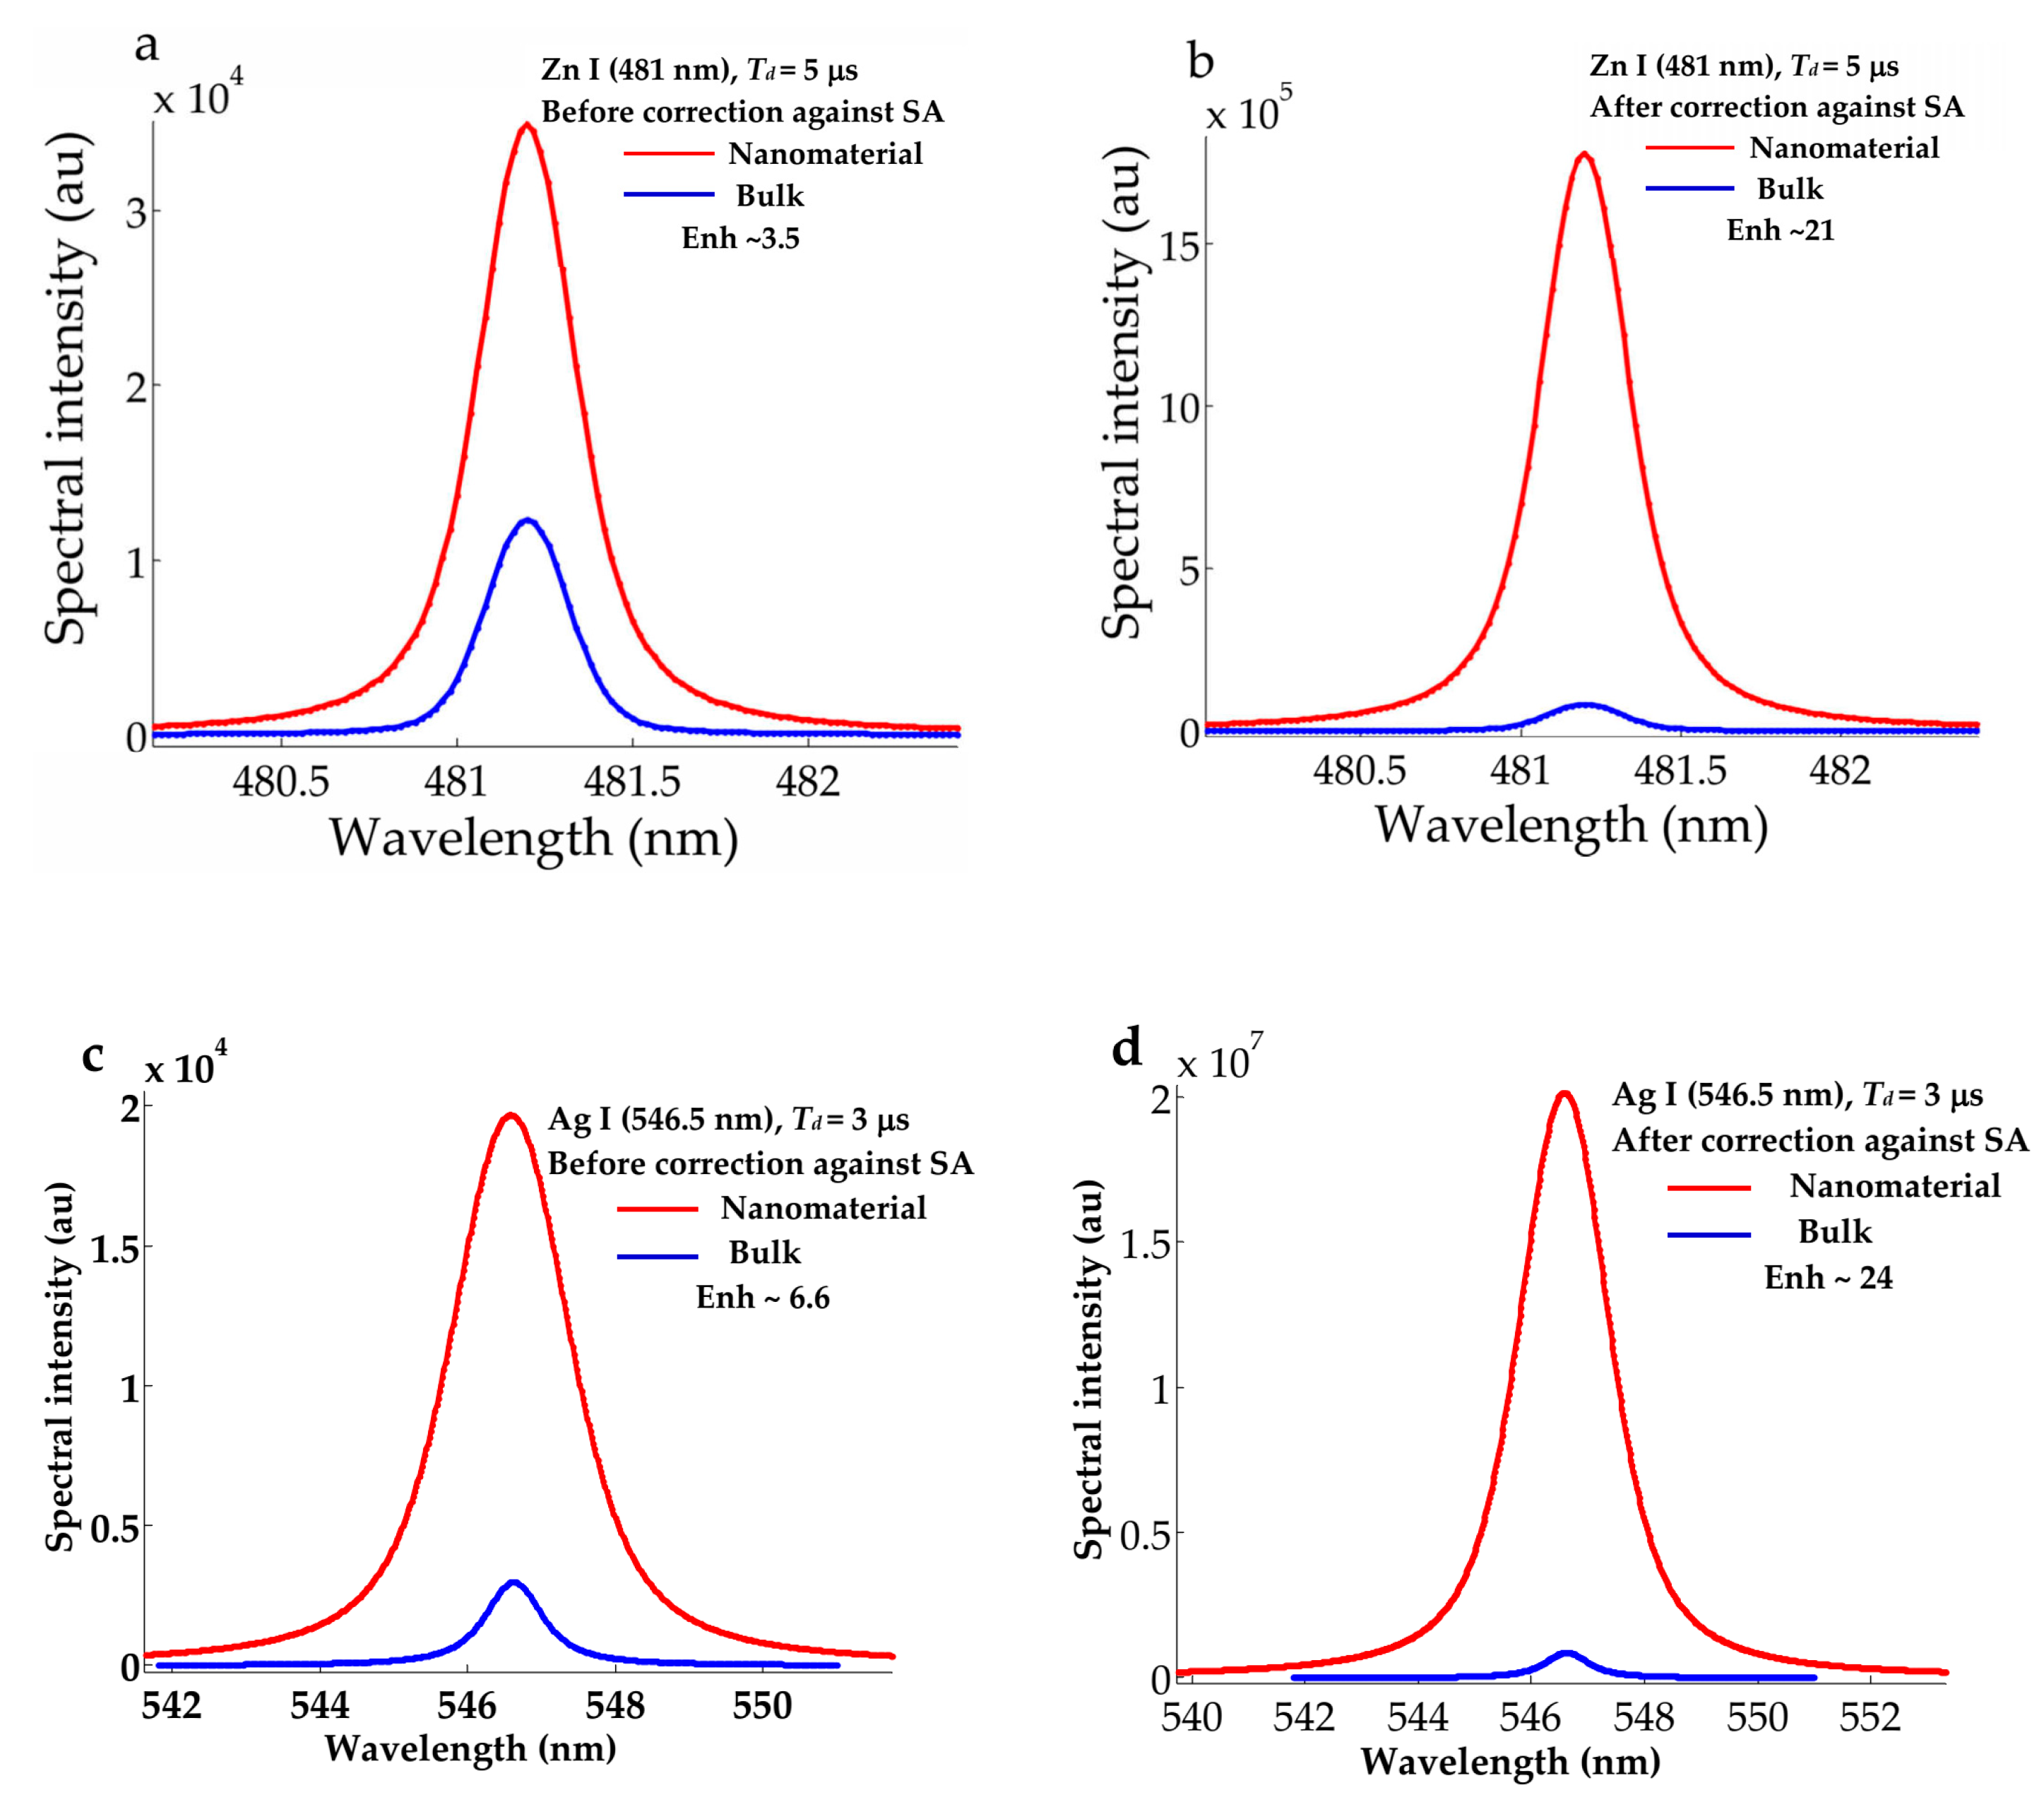
Figure 3.
Variation of amount of enhancement with delay time from nano-based samples (red colored) of titanium and iron together with experimental conditions as depicted in the subfigures.
Figure 3.
Variation of amount of enhancement with delay time from nano-based samples (red colored) of titanium and iron together with experimental conditions as depicted in the subfigures.
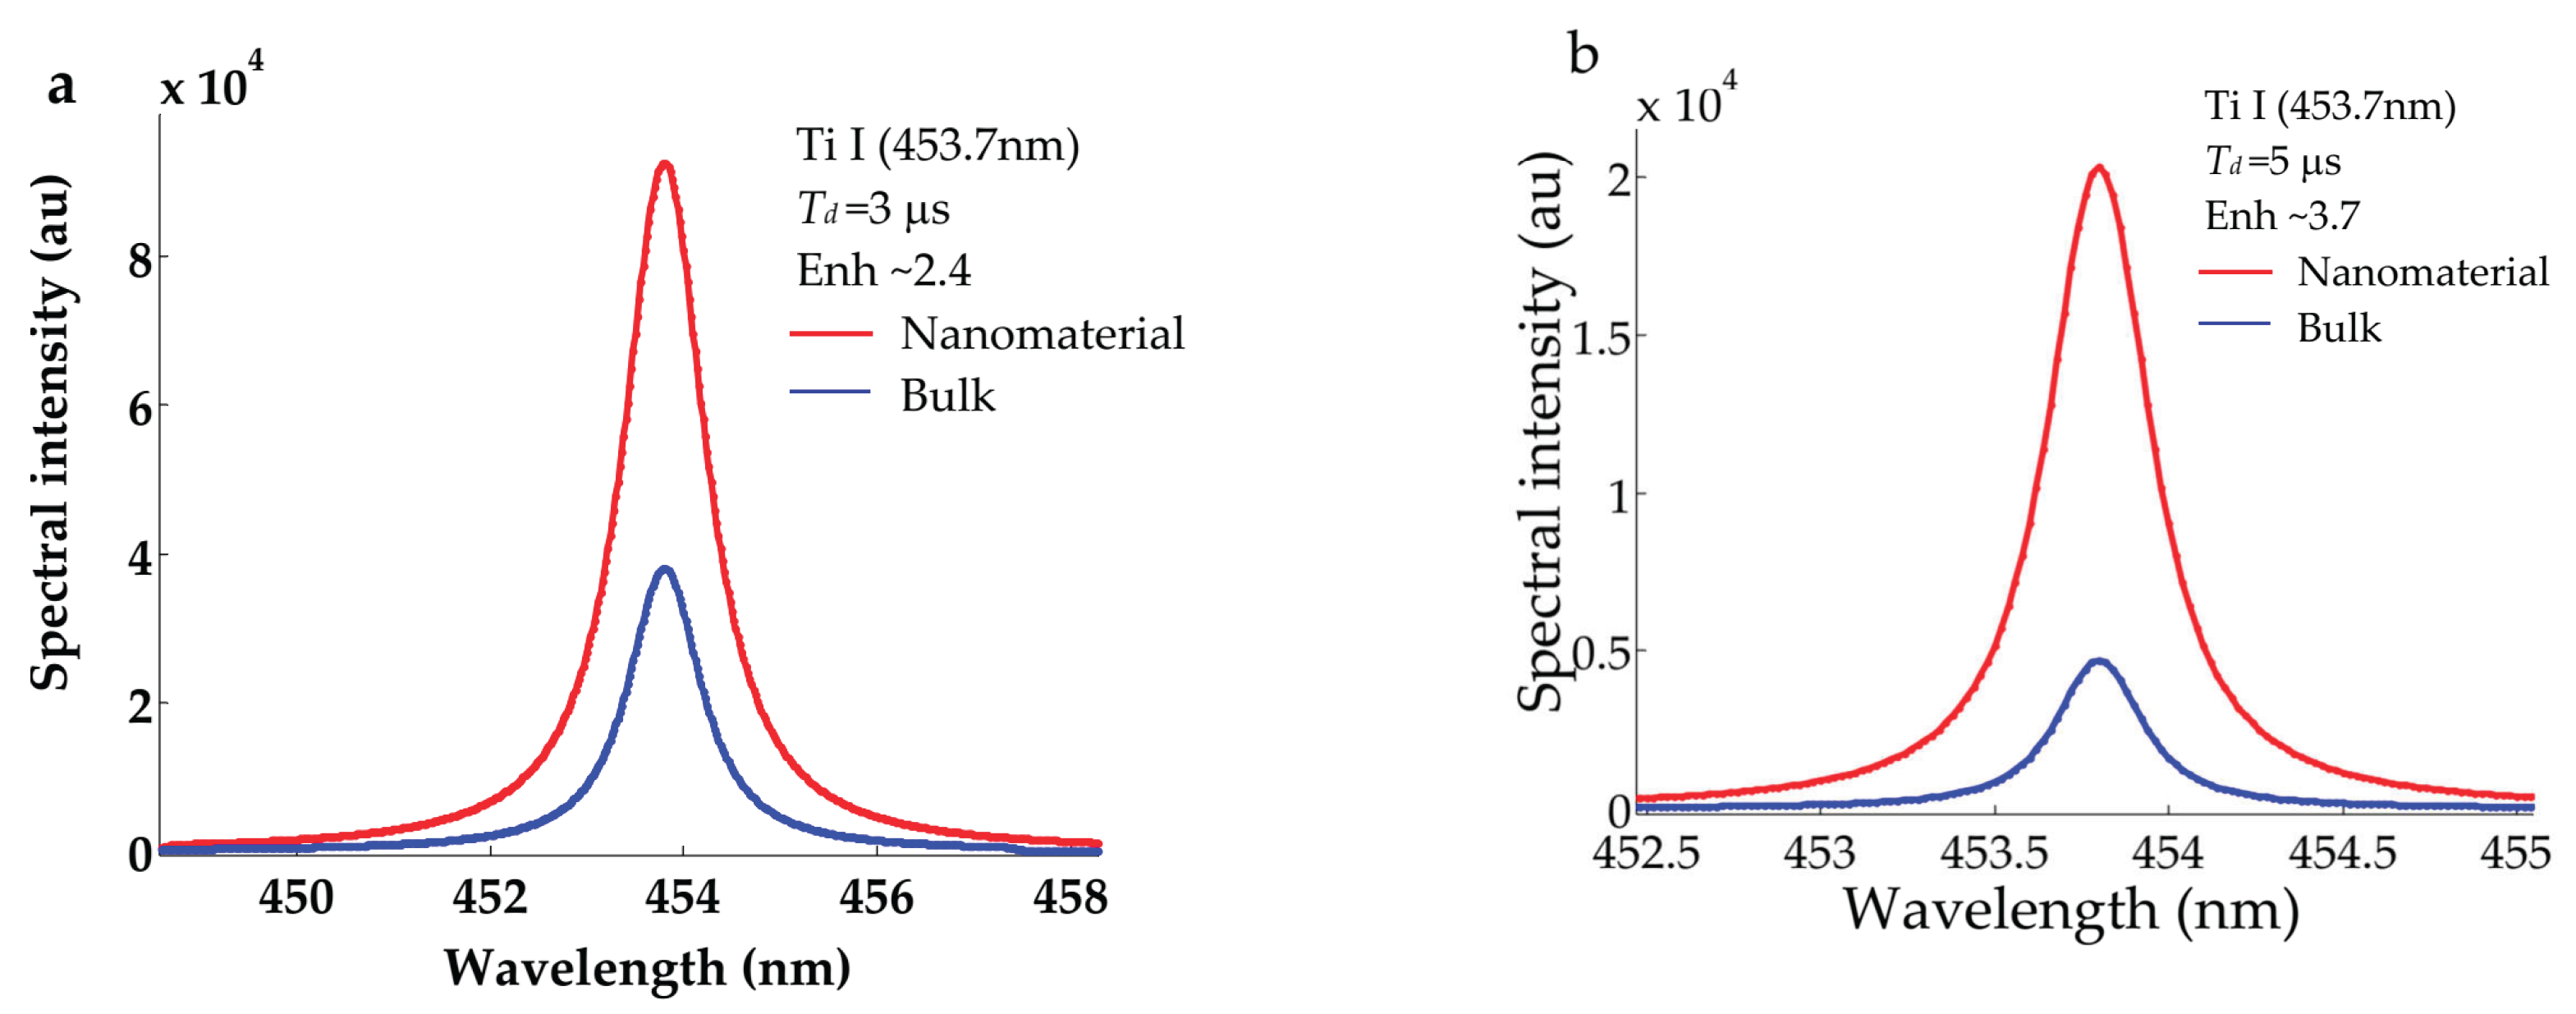
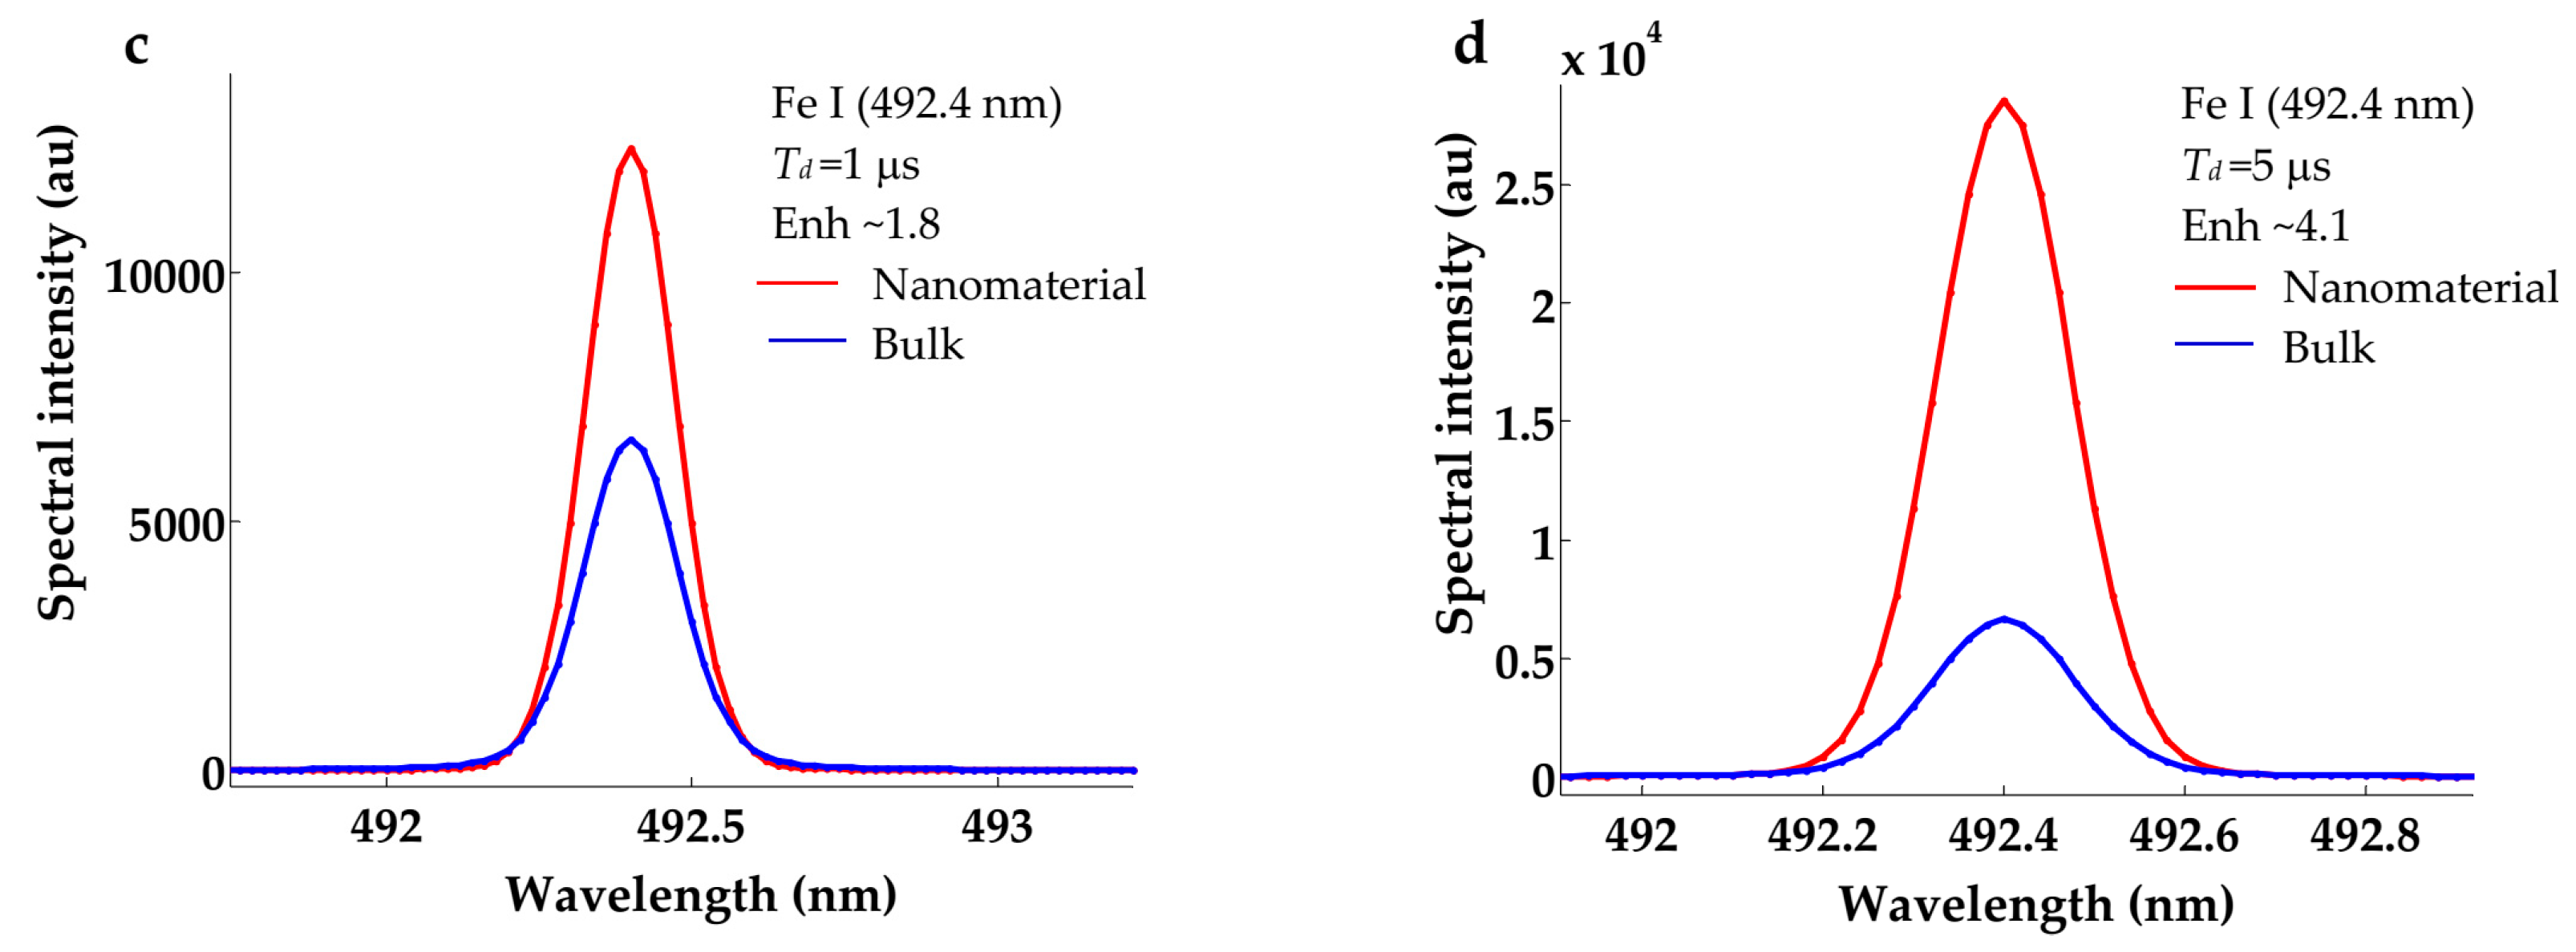
Figure 4.
Spectral lines shape of the Hα-line emerged from bulk-silver-based plasma (plotted in thick red color) and from Nano-based plasmas (plotted in thick black color). Both spectra recorded at fixed laser wavelength of 1064 nm and fluence 6.3±0.5 J/cm2. (a) Silver (b) Zinc (c) Iron, (d) Titanium.
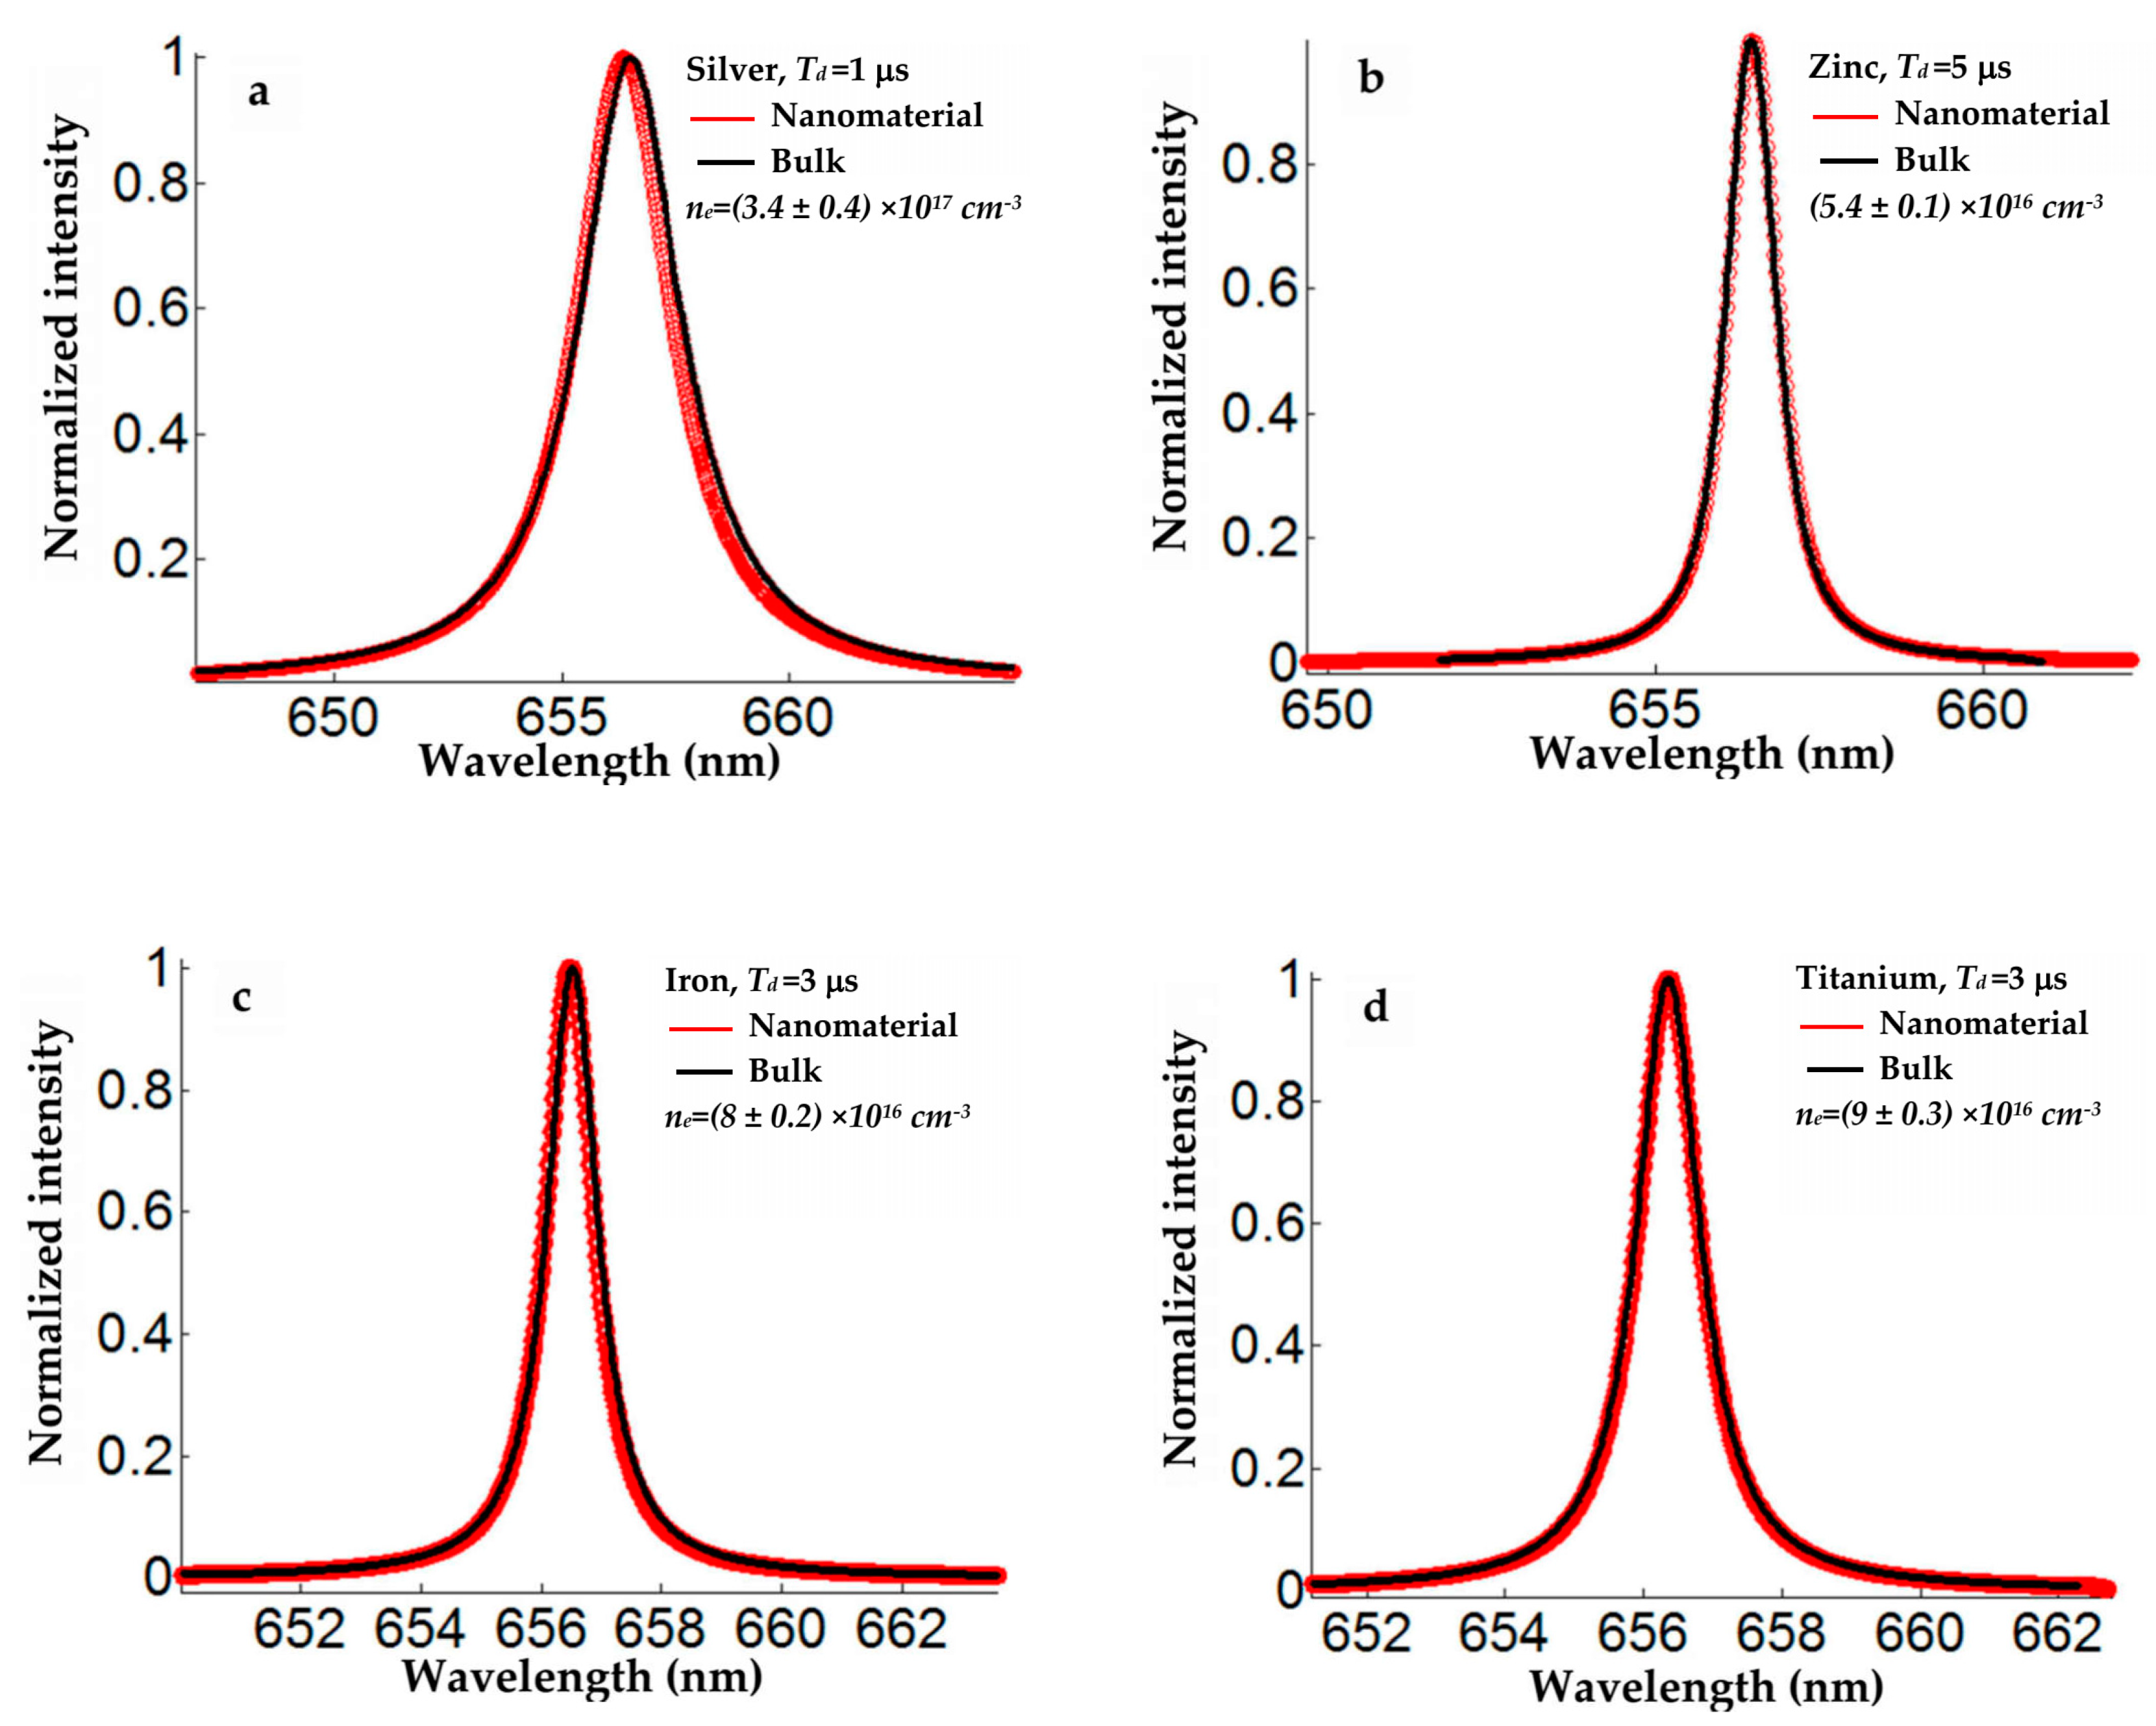
Figure 5.
Boltzmann plots (after corrections against self-absorption and apparatus sensitivity). (a) for Ag I-lines at delay time of 3 μs, (b) Zn I-lines at delay time of 5 μs. Blue circles refer to bulk material and red squares to nanomaterial together with vertical displacement factors .
Figure 5.
Boltzmann plots (after corrections against self-absorption and apparatus sensitivity). (a) for Ag I-lines at delay time of 3 μs, (b) Zn I-lines at delay time of 5 μs. Blue circles refer to bulk material and red squares to nanomaterial together with vertical displacement factors .
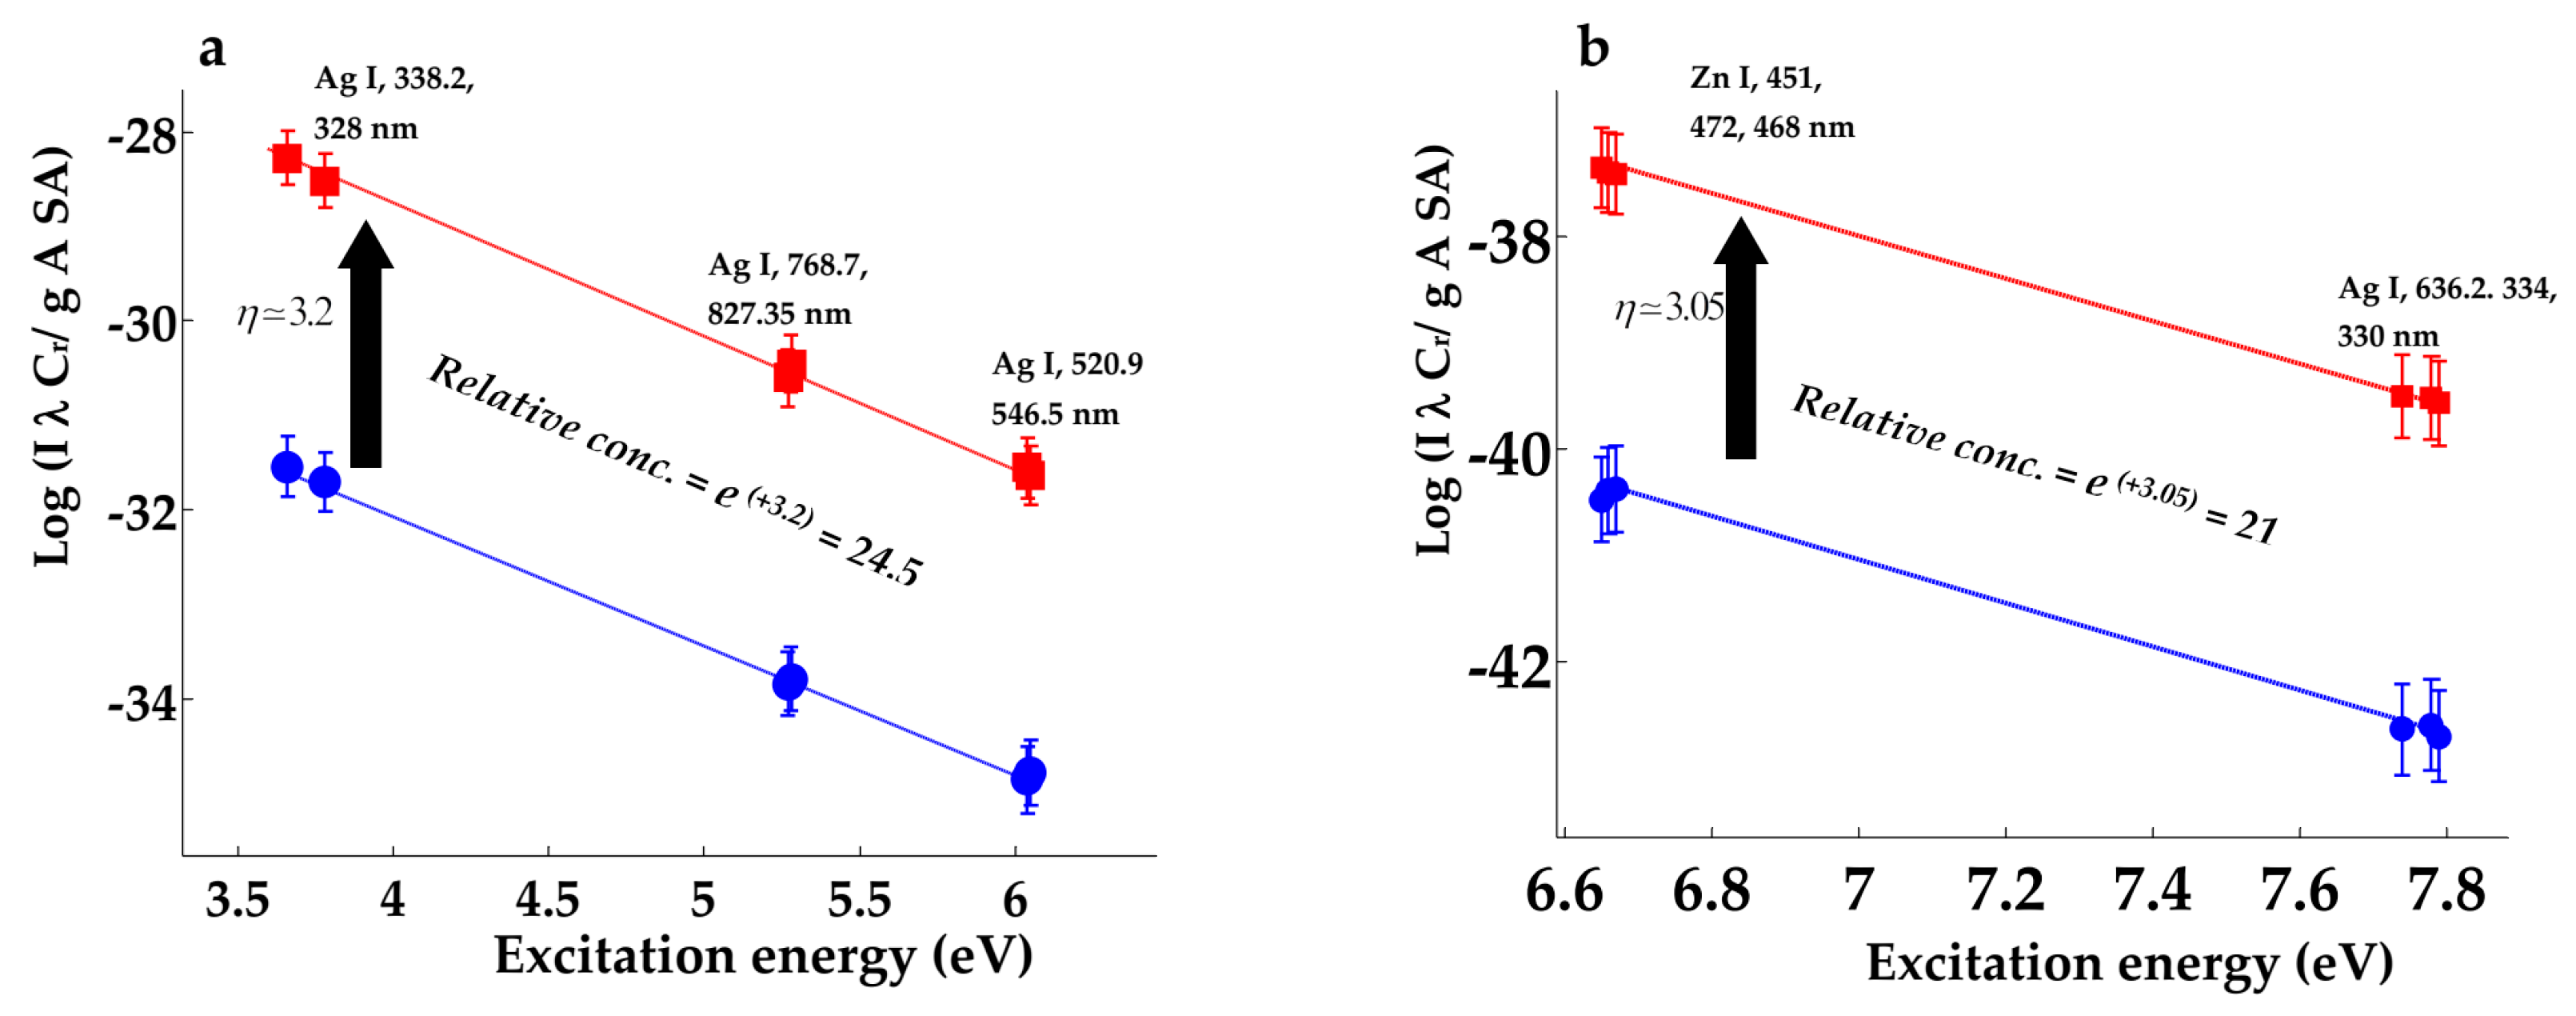
Figure 6.
Fitting of the data points () with the numerical fitting factors suggested in expression (1). (a and b) are plotted on a logarithmic scale for the silver and zinc , (c and d) are plotted on a linear scale for the iron and titanium, (black disks before correction against SA, flat squares after the correction).
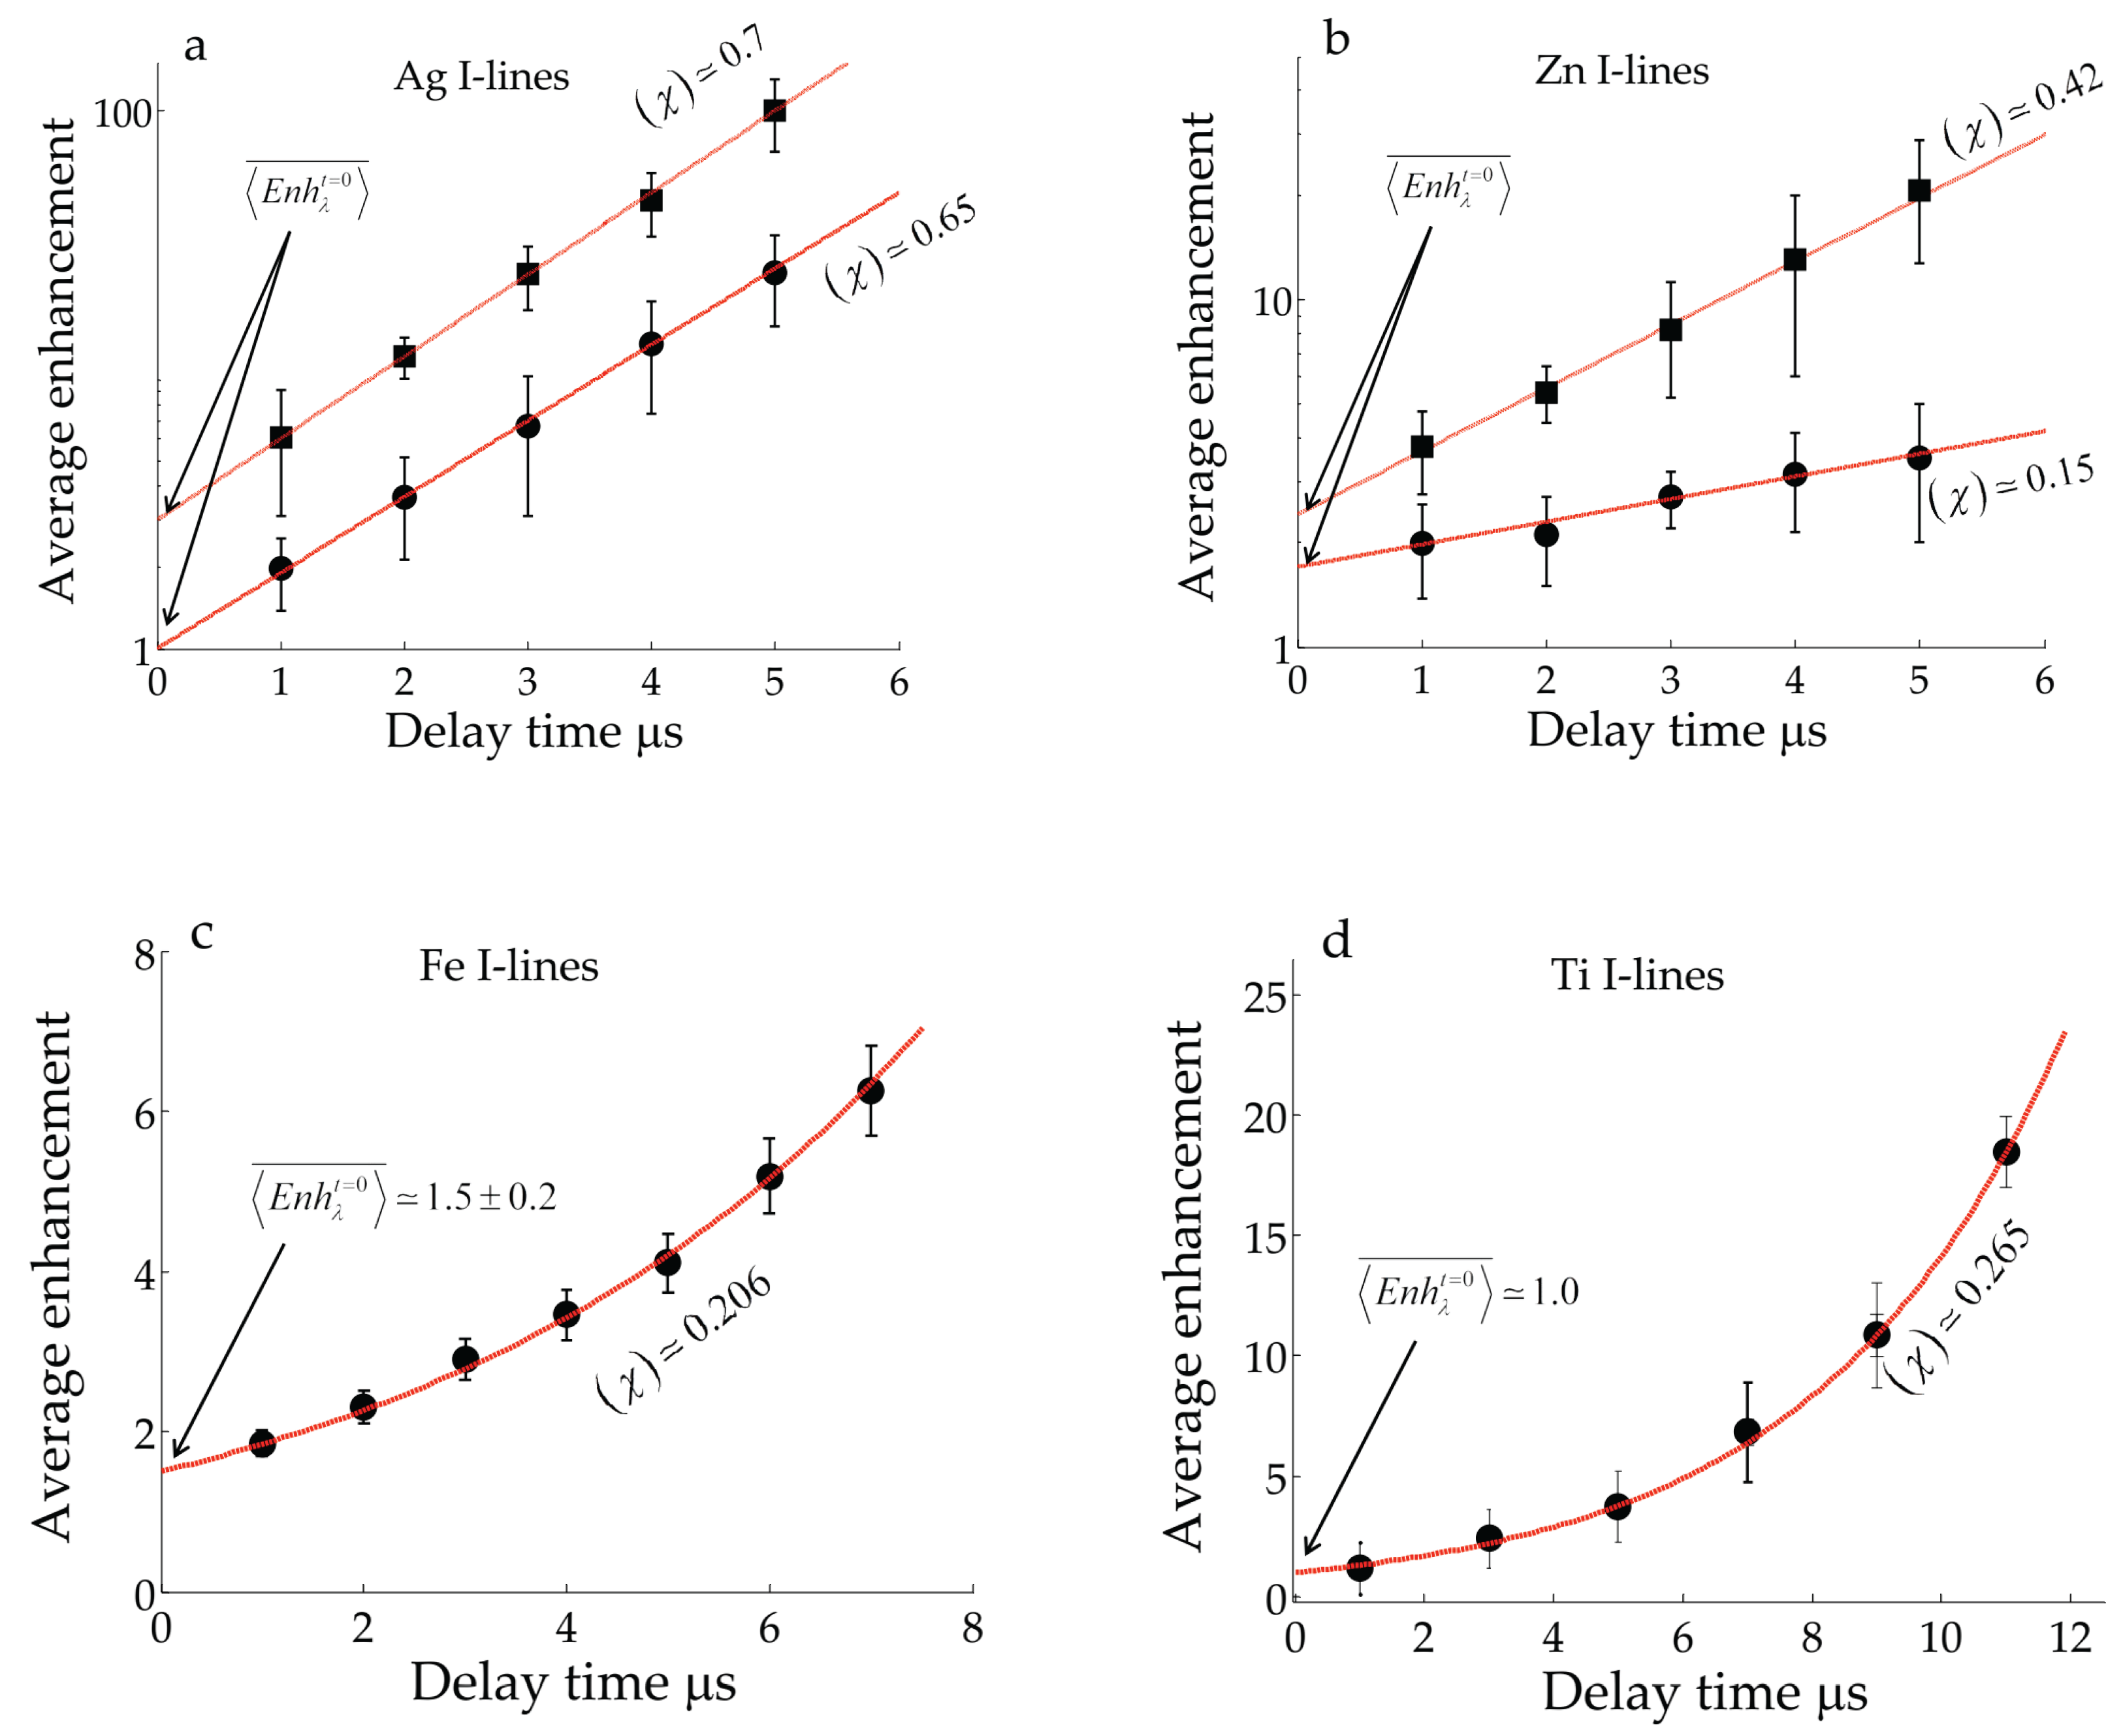

Table 1.
Atomic parameters and Stark braodening parameters of identified lines.
| Element | Wavelength (nm) |
Transition probability (s−1) |
Statistical weight | Energy of upper state (eV) | Stark broadening parameter (nm) /reference density (cm−3) | Ref. |
| Ag I lines | 546.54 | 8.6e+07 | 6 | 6.04 | 0.0262 /0.66×1017 | [17] |
| 520.90 | 7.5e+07 | 4 | 6.043 | 0.0242/0.66×1017 | [17] | |
| 768.77 | 3.0e+05* [18] | 2 | 5.27 | 0.146/ 1×10¹⁷ | [17] | |
| 827.35 | 5.5e+05* [18] | 2 | 5.27 | 0.167/ 1×10¹⁷ | [17] | |
| 338.28 | 1.3e+08 | 2 | 3.66R | 0.0042/1×1017 | [17] | |
| 328.06 | 1.4e+08 | 4 | 3.77R | 0.0041/1×1017 | [17] | |
| Zn I lines | 481.08 | 7.00e+007 | 3 | 6.65 | 0.125/2.70×1017 | [19] |
| 472.20 | 4.58e+007 | 3 | 6.65 | 0.137/2.70×1017 | [19] | |
| 468.01 | 1.55e+007 | 3 | 6.65 | 0.107/2.70×1017 | [19] | |
| 636.23 | 4.70e+007 | 5 | 7.74 | 0.503/2.70×1017 | [20] | |
| 334.55 | 1.00e+8* | 6* | 7.78 | 0.0488/1×1017 | [19] | |
| 330.27 | 1.001e_008* | 4* | 7.78 | 0.0488/1×1017 | [19] |
* means that the presented values are the average over more than two or more values given of some of the unresolved spectral lines as [16];, and . Superscript (R) means that the transition is resonance.
Table 2.
Plasma parameters; nano-based target (red color) and bulk-based target (blue color).
| Delay | 1μs | 2μs | 3μs | 4μs | 5μs | ||||||||||||||
| Measured electron density (× 1017 cm−3) | |||||||||||||||||||
| Element | Nano | Bulk | Nano | Bulk | Nano | Bulk | Nano | Bulk | Nano | Bulk | |||||||||
| Silver | 4.29±0.1 | 4.2±0.08 | 1.8±0.12 | 1.79±0.10 | 0.89±0.04 | 0.89±0.03 | 0.55±0.15 | 0.55±0.13 | 0.23±0.04 | 0.23±0.05 | |||||||||
| Zinc | 4.4± | 4.7±0.7 | 2.5±0.9 | 2.4±0.8 | 1.2±0.40 | 1.4±0.5 | 0.7±0.26 | 0.7±0.24 | 0.64±0.08 | 0.54±0.07 | |||||||||
| Iron | 4.42±0.8 | 4.8±0.5 | 1.47±0.09 | 1.27±0.09 | 0.83±0.07 | 0.77±0.08 | 0.42±0.08 | 0.43±0.07 | 0.35±0.02 | 0.33±0.05 | |||||||||
| Titanium | 3.4±0.7 | 3.4±0.03 | 1.8±0.08 | 1.7±0.03 | 0.99±0.05 | 0.91±0.04 | 0.72±0.07 | 0.69±0.02 | 0.52±0.04 | 0.54±0.03 | |||||||||
| Measured electron temperatures (eV) | |||||||||||||||||||
| Element | Nano | Bulk | Nano | Bulk | Nano | Bulk | Nano | Bulk | Nano | Bulk | |||||||||
| Silver | 1.04±0.1 | 1.09±0.09 | 0.89±0.08 | 0.89±0.06 | 0.72±0.05 | 0.72±0.07 | 0.63±0.07 | 0.60±0.02 | 0.51±0.04 | 0.55±0.06 | |||||||||
Table 3.
Average amount of enhanced emission over different spectral lines
| Delay | 1 μs | 2 μs | 3 μs | 4 μs | 5 μs | 7μs | ||||||
| Silver | 2.4 | 6.1 | 3.4 | 12.2 | 6.6 | 24.66 | 5.9 | 46.14 | 8.2 | 100 | ---------- | ------- |
| Zinc | 1.98 | 3.76 | 2.1 | 5.4 | 2.7 | 8.2 | 3.15 | 13 | 3.5 | 21 | ---------- | ------- |
| Iron* | 1.85 | ----- | 2.3 | ----- | 2.9 | ----- | 3.4 | ----- | 4.1 | ----- | 6.2 | ----- |
| Titanium* | 1.18 | ----- | ----- | ---- | 2.4 | ----- | ---- | ------ | 3.7 | ----- | 6.8 | ----- |
Uncorrected lines (red color) and corrected lines (blue color). * Means that the presented values of enhanced emission are subjected to errors around 10-15 %.
Table 4.
Numerical values of fitting parameters to data points, for different elements.
| With corrections against SA | Without corrections against SA | |||
| χ(μs)−1 | χ(μs)−1 | |||
| Silver | 3 | 0.7 | 1.0 | 0.65 |
| Zinc | 2.4 | 0.42 | 1.7 | 0.15 |
| Iron | ------------- | ------------------ | 1.5 | 0.206 |
| Titanium | ------------------ | ---------------- | 1.0 | 0.265 |
Table 5.
Rates of change of logarithmic spectral line intensity , and radiative relaxation rate marked with red color for different elements.
Table 5.
Rates of change of logarithmic spectral line intensity , and radiative relaxation rate marked with red color for different elements.
| Uncorrected emission against SA | Corrected emission against SA | |||||
| χ(μs)−1 | χ(μs)−1 | |||||
| Silver | - 1.79 | - 1.07 | + 0.63 | - 1.01 | - 0.31 | + 0.7 |
| Zinc | - 1.56 | - 1.41 | + 0.17 | -1.05 | -0.63 | + 0.41 |
| Iron* | - 0.59 | - 0.39 | + 0.202 | -------- | --------------- | ----------- |
| Titanium* | - 0.49 | - 0.25 | + 0.232 | -------------- | -------------- | -------- |
Disclaimer/Publisher’s Note: The statements, opinions and data contained in all publications are solely those of the individual author(s) and contributor(s) and not of MDPI and/or the editor(s). MDPI and/or the editor(s) disclaim responsibility for any injury to people or property resulting from any ideas, methods, instructions or products referred to in the content. |
© 2025 by the authors. Licensee MDPI, Basel, Switzerland. This article is an open access article distributed under the terms and conditions of the Creative Commons Attribution (CC BY) license (http://creativecommons.org/licenses/by/4.0/).
Copyright: This open access article is published under a Creative Commons CC BY 4.0 license, which permit the free download, distribution, and reuse, provided that the author and preprint are cited in any reuse.


