
Submitted:
15 July 2025
Posted:
17 July 2025
You are already at the latest version
Abstract
Nowadays, most satellite altimeters have proven effective in providing datasets on sea surface changes in oceans towards nearshore zones. The need to extend satellite sea level and wave records closer to the coast has been a focus of several studies investigating the accuracy of observations in shallow water areas and coastal zones, with the aim of monitoring spatial and temporal changes in the hydrodynamics. The recently launched Surface Water and Ocean Topography (SWOT), is the first wide-swath interferometric altimetry mission. Here, we integrate SWOT observations with 9 existing altimeters for assessing the Significant Wave Height (SWH) at regional and local scales with a special focus on high energetic periods. The monitoring of storms using multisource altimeters offer the possibility to enhance their evolution with full coverages. The combination of SWOT with conventional altimeters improves the time-sampling to capture the variability modes from inter-monthly to inter-daily scales, including storms; and the spatial sampling that would be expanded thanks to the SWOT 2D consistent view. The frequency analysis of SWH along tracks highlights the wavelength of wave features and their changes during storms. This challenging issue benefits from ongoing works of new altimeters, including SWOT, to offer reliable estimates of coastal waves.
Keywords:
coastal waves
; storm events
; multi-source altimetry
; significant wave height
1. Introduction
In the context of global climate change and the increasing human pressure on ecosystems, coasts and estuaries are more vulnerable to environmental hazards and are currently facing an intensification of natural hazards [1]. These hazards have become more serious in the last decade due to the overexpansion of urbanization and infrastructures that these areas are facing, together with climate change effects including sea-level rise and storminess increases [2]. Other factors are worth mentioning, operating at shorter timescales, such as climate fluctuations between seasons and changes in storm patterns [3]. The risks of extreme weather events, such as extreme waves and water levels, are increasing with global warming and rising sea levels. Such events are considered hotspots of global high risk and pose a significant threat to coastal communities and infrastructure and becoming a major challenge facing the international community [4]. The monitoring of extreme hydrodynamics is crucial for mitigating the natural and socio-economic impacts of coastal hazards. It is traditionally based on the use of in-situ measurements made by different networks, as tide gauges and wave buoys, that are considered the most reliable tool for observing the distribution of energy and hydrodynamic features from ocean to nearshore and coastal zones [5]. However, observational data are relatively sparse and their spatial distribution is extremely limited in some areas where the deployment of in-situ sensors is not feasible. Limited by the spatial coverage, (i.e., localized measurements), coastal hydrodynamics induced by different physical drivers, have not been well documented and are currently lacking at local scales [6].
The use of numerical models is increasingly used as an alternative to overcome the shortcomings of in situ monitoring of extreme waves and water levels from local to large scales and providing a scientific basis for issuing flood warnings
However, numerical modelling requires extremely high computational efforts and a large amount of real-time spatiotemporal observations to be coupled for improving the capacity prediction and reducing the numerical uncertainties. The growth of satellite observations during the last decades, including altimetry datasets, have deeply enhanced the temporal and spatial coverage of nearshore and coastal areas for providing several physical measurements, which can be used for timely and accurate monitoring of sea level hydrodynamics of both global and local studies at different time-scales from the short- to the long-term [7]. The applications of satellite altimeters for monitoring coastal hydrodynamics is still in its early stage [5] even with the several efforts carried out the past decade to demonstrate the potential of satellites for observing coastal changes [8].
These applications continue to be an active research area by exploring the recent advances of radar altimetry technology; e.g., the use of the Ka-band, SAR and InSAR techniques allowing improvements in spatial and range resolutions, lower noise level for conventional nadir altimetry [9-11].
These applications continue to be an active research area by exploring the pioneering advances of Radar altimetry technology. Although the difficulties to provide reliable observations in coastal areas, the monitoring of their changes is extremely important, including in areas where measurements are not typically available [12]. The use of such techniques depends on the system of interest (open coasts, deltas, wetlands, estuaries...) and also the availability of measurements for validation [7]. Therefore, an adequate characterization of coastal changes requires a coupling between different techniques to overcome the inherent limitations exposed by each technique used separately. The employment of multi-source altimetry dataset is helpful to supplement the observational data which is beneficial for monitoring the spatiotemporal evolution of physical parameters, providing accurate estimates of the geophysical variables and improving the prediction ability of numerical models [5]. With the progress of active micorwave remote sensing of SAR and InSAR [13], the enhanced observations of nearshore and coastal wave height (SWH), gain more insights to be substantially reachable using data from space e.g., [14,15].
Nowadays, new remote sensing opportunities are being offered, case of SWOT-SAR-interferometry wide-swath altimetry mission [16]. The SWOT (Surface Water and Ocean Topography) mission, using the low incidence INSAR technique, jointly developed by between NASA and CNES with contributions from the Canadian Space (CSA) and the United Kingdom Space Agency (UKSA), is the first mission to provide spatialized estimates of water levels over the ocean and inland hydrological systems.
The SWOT mission was launched in December 2022 for at least 3 years providing global 2D water height data. In contrast to conventional altimetry missions which samples the Earth surface (ocean and land) along the satellite ground-tracks, SWOT satellite mission uses a new type of instrument operating at Ka-band (35.5 GHz) Radar Interferometer (KaRIN) which achieves across-track interferometry measurements from a single satellite pass [17]. This innovative configuration of SWOT mission offers a unique capacity resolving kilometer-scale oscillations in global measurements of sea surface height (SSH) that can be used to map long swell parameters [18]. [19] have explored the measured interferometric decorrelation from SWOT KaRIn data to develop the spatial maps of significant wave height (SWH) with kilometric resolutions.
In the framework of this new mission, the present work has been carried out to investigate the accuracy to combine SWOT products with 9 conventional altimeters for assessing nearshore and coastal waves at regional (within the English Channel - NW Europe) and local scale (close to UK and French coasts) and enhancing their spatial and temporal monitoring in response to extreme events, produced during the winter periods 2022-2023 and 2023-2024.
Following the introduction, Section 2 describes the overall observations, available in the English Channel and outlines the different methods used. The performance of the multi-source altimetry dataset for monitoring the evolution of storms, including SWOT observations, is explained and discussed in Section 3. Finally, Section 4 concludes the main highlights of this work and provides further perspectives regarding the integration of SWOT to enhance the wave estimates in nearshore and coastal areas.
2. Materials and Methods
The monitoring of storms during the winter periods of 2022-2023 and 2023-2024 has been examined within the English Channel (Figure 1) the nearshore to coastal areas, using a multi-sensor approach of satellite altimetry, including in-situ measurements, SWOT observations and conventional altimeters.
2.1. In-Situ Observations
Five recent storms have been selected between 2023 - 2024, since the launch of SWOT mission, with different durations (Table 1): Noah and Mathis on April - July 2023, during SWOT Cal/Val and Ciaran, Karlotta and Pierrick since November 2023, during SWOT Science Orbit. The main characteristics of storms are displayed in Table 1. Storms were identified using the approach proposed by [17] that considers three key factors: storm wave height threshold, storm duration threshold, and storm independence criterion. The storm wave height threshold was determined by applying the 95th percentile to the significant wave height data [21,22]. The duration threshold was established at 12 hours, given that events exceeding this value would be able to induce significant coastal response. Storms with duration higher than 24 hours have been identified and characterized according to the maximum significant wave height (Hs,max), the peak wave period (Tp), the mean wave direction (°) and the energy content, calculated by the cumulated energy Estorm. The monitoring of changes in water levels and waves during the energetic winter seasons and the selected storms has been performed using in-situ measurements and satellite altimetry data at the regional scale of the English Channel (NW France).
A series of wave buoys and tide gauges along French and UK coasts has been explored in this work (Figure 1): 3 wave buoys (1 in France close to Brest and 2 in the middle of the English Channel), extracted from Copernicus database (Global Ocean- In-Situ Near-Real-Time Observations, https://data.marine.copernicus.eu/product/INSITU_GLO_PHYBGCWAV_DISCRETE_MYNRT_013_030), provide hourly timeseries of significant wave height, peak period and the mean wave direction ( only for 6200069). The 15 min and 10 minute delayed validated water level measurements are given by tide gauges covering UK (BritishOceanographic Data Centre:https://www.bodc.ac.uk/data/hosted_data_systems/sea_level/uk_tide_gauge_network) and French (SHOM – REFMAR: https://data.shom.fr/donnees/refmar) coasts respectively. The different wave buoys have been used to a compared analysis of the observed SWH from the multi-source altimeter dataset and the distribution of the period.
2.2. Altimetry Observations: SWOT and Conventional Missions
2.2.1. SWOT Altimetry Data
Using two Synthetic Aperture radar (SAR) antennas separated by a 10 m mast for interferometry in orbit, SWOT provides the first two-dimensional high-resolution measurements of water sea surface height from space. Thanks to the radar system of SWOT, the coverage over a swath of 120 km (with a 20 km nadir gap) is provided, offering the first direct observations of ocean topography and land surface water in two dimensions. The averaging of a large number of pixels is performed to reduce noise while ensuring the resolution of small-scale signals [17].
For assessing SWOT’s interferometric abilities to measure the nearshore hydrodynamics, the Level 2 (L2)- Low Rate (LR) “Expert” SWOT product [23] have been extracted from KaRIn. For each pass, an L2 data product covers the full KaRIn swath width, which spans 10-60 Km on each side of the nadir track. Sea surface height, sea surface height anomaly and significant wave height are provided on a geographically fixed, swath-aligned 2x2 km2 grid.
The L2 LR Expert products, available during SWOT Cal/Val and Science Orbit periods have been used in this paper (SWOT_L2_KaRIn_SSH_Expert: 10.24400/527896/a01-2023.015, CNES-AVISO) for monitoring the hydrodynamics from nearshore to coastal areas during high energy conditions within the English Channel.
The SWH has been processed from the interferometric KaRIn acquisitions based on the independent combinations of radar returns (interferometers), known as interferometric correlation which is statistically explored to encode the normalized variance between the two radar signals as stated in the work of [19] where the algorithms used for the 2D inversion are more developed for reducing the uncertainties of observations. In this work, we have used only the altimetry nadir measurements.
2.2.2. Conventional Altimetry Data
In this work, 9 conventional (Low Resolution Modulation and SAR modes processing) altimetry missions have been considered to investigate the hydrodynamics within the English Channel (Table 2). 2.5 years (Jan 2022–May 2024) of multi-source satellite altimeters (Saral, Cryosat-2, Jason-3, Sentinel 3A, Sentinel 3B, Sentinel 6, Hai Yang-2B, Hai Yang-2C, CFOSAT wave scatterometer (L2, 5Hz) with SWOT observations to monitor nearshore and coastal waves, including extremes during 5 selected marine storms (Table 1). The temporal and spatial features of waves are investigated from combining the satellite altimetry dataset and the contribution of SWOT for enhancing such features and complementing existing coastal in-situ observations. The SSH and SWH satellite altimetry observations have been extracted from Copernicus platform (https://data.marine.copernicus.eu/product). The frequency of sampling along the track is around 1 Hz for all used altimeters, except for CFOSAT with 4.5 Hz sampling,
2.3. Methodology
2.3.1. Multi-Source Altimetry Coverage in the English Channel
The along-track spatially SWH, distributed by Validation and Interpolation of Satellite Oceanographic Data Center (Copernicus), has been used to scan the spatial coverage of the English Channel from the Atlantic to the Normandy and UK regions (Figure 2) where the different tracks are displayed according to the depth changes: 34 tracks provided by Sentinel 3 (17 tracks from each mission A and B); 5 tracks provided by Sentinel-6, 12 tracks provided by SWOT and 8 tracks provided by CFOSAT. The different tracks, provided by the different altimetry missions, are displayed in Figure 4.e where a good coverage is provided by combining the used altimeters at different depths from ocean to nearshore and coastal areas.
A series of locations (white points in Figure 2) have been selected at different depths and crossing two successive tracks (ascending and descending passes) for optimizing the number of observations in each point. For each altimetry mission, the timeseries of SWH at each depth has been extracted for monitoring the evolution of wave height within the channel and close to both South and North coasts.
Here, the bathymetry information has been obtained from the European Marine Observation and Data Network (EMODnet) Bathymetry Portal [24]. The results of the EMODnet project, the digital terrain model (DTM), and the latest release has been explored in [22]. The consistency of the combined SWH observations, extracted from the different satellite altimeters, have been examined together with in-situ data to guarantee the coherence between the different altimetry data.
2.3.2. Spectral Analysis of Altimetry Data
The time-evolution of SWH observations, provided by different altimetry missions, have been analyzed using a non-stationary approach of a Continuous Wavelet Transform (CWT) to explore the spectral content of the hydrodynamic signal. The typical analyses of the sea-level variability have been performed for investigating the multi-timescale changes and their connection with extreme events [25,26]. The CWT is a well-known method that has been used over the past decade for data analysis in hydrology, geo-physics, and environmental sciences [27, 28]. The continuous wavelet transform produces either a time-scale or time-period with the means of the Fourier transform contour diagram on which time is indicated on the x -axis, period, or scale on the y -axis, and amplitude (called also variance, or power, etc.) on the z -axis.
3. Results
3.1. Monitoring of Waves During Storm Events
In this section, we investigate the evolution of nearshore and coastal waves during 4 different storms, occurred during the winter seasons of 2022-2023 (Storm Mathis) and 2023-2024 (Storms Ciaran, Karlotta, and Pierrick), using a multi-source altimetry dataset combined with SWOT for monitoring the different events: (1) Mathis (Figure 3.a) provided by 8 tracks including Jason 3 (two tracks), CFOSAT, Saral, Sentinel 3A, Sentinel 3B, HY-2C , HY-2B, and SWOT Cal/Val; (2) Karlotta (Figure 3.b) provided by 7 tracks including Cryosat-2, Sentinel 6A (two tracks), Sentinel 3A, Sentinel 3B, HY-2C and SWOT Scientific Orbit; (3) Pierrick (Figure 3.c) provided by 8 tracks including Sentinel 3A (S3A), Sentinel 3B (S3B), Sentinel 6 A (S6A) , HY-2C, HY-2B and SWOT; (4) Ciaran (Figure 3.d) provided by 11 tracks offered by most of the altimeters with more than 2 tracks for S3A, S6A and HY-2B.
During each storm, the coverage provided by the aforementioned altimeters crossing the English Channel in space (the area of sampling within the Channel) and time (the date and the hour of sampling during the storm) has been reported as displayed in Figure 3 for each storm. The monitoring of extremes exhibits a better coverage with more sampling tracks for longer storms, the case of Ciaran whose duration exceeds 24 hours which explains the frequency of sampling for each altimeter is more than two times during the storm. The distribution of the different tracks within the Channel and close to coastal zones (Figure 3) provide an excellent coverage in time, each 1-4 hours approximately, for mapping the highest waves of the storm (pic of the storm and its location) and their dissipation at the end of the storm and close to the coastline. Two different altimeters could operate at the same time in two different positions: (1) during a storm as CFOSAT and Saral ; (2) during Mathis on 31st March 6 PM and, S3A and S6A during Ciaran on 2nd November 9 PM.
According to Figure 3 (a-d), the mapping of SWH along the altimetry track at a defined time slot during the storm shows a heterogeneous distribution between both sides of the Channel and according to the depth. For example, the S3B track shows higher SWH close to Weymouth (UK) compared to Roscoff (France) during Mathis (31-March at 10h) and Pierrick (9 April at 7h) while wave heights are more significant close to the French side during Karlotta (10 Feb at 10h).
The SWH distribution, provided by S6A track during Karlotta (10 Feb 6 PM) and Ciaran (2 November 9 PM), exhibits a decreasing energy from the Atlantic to the Cardiff ‘s coast (Wales). HY-2B crossing the Channel from the Atlantic to the Devonport (UK) provides a significant variation of energy, related to changes in SWH, along the track during Ciaran storm (1 November 5h, beginning of the storm) with a significant dissipation at shallow areas and close to the coastline; this variation seems to be homogenous during Mathis storm (31 March 7h, beginning of the storm).
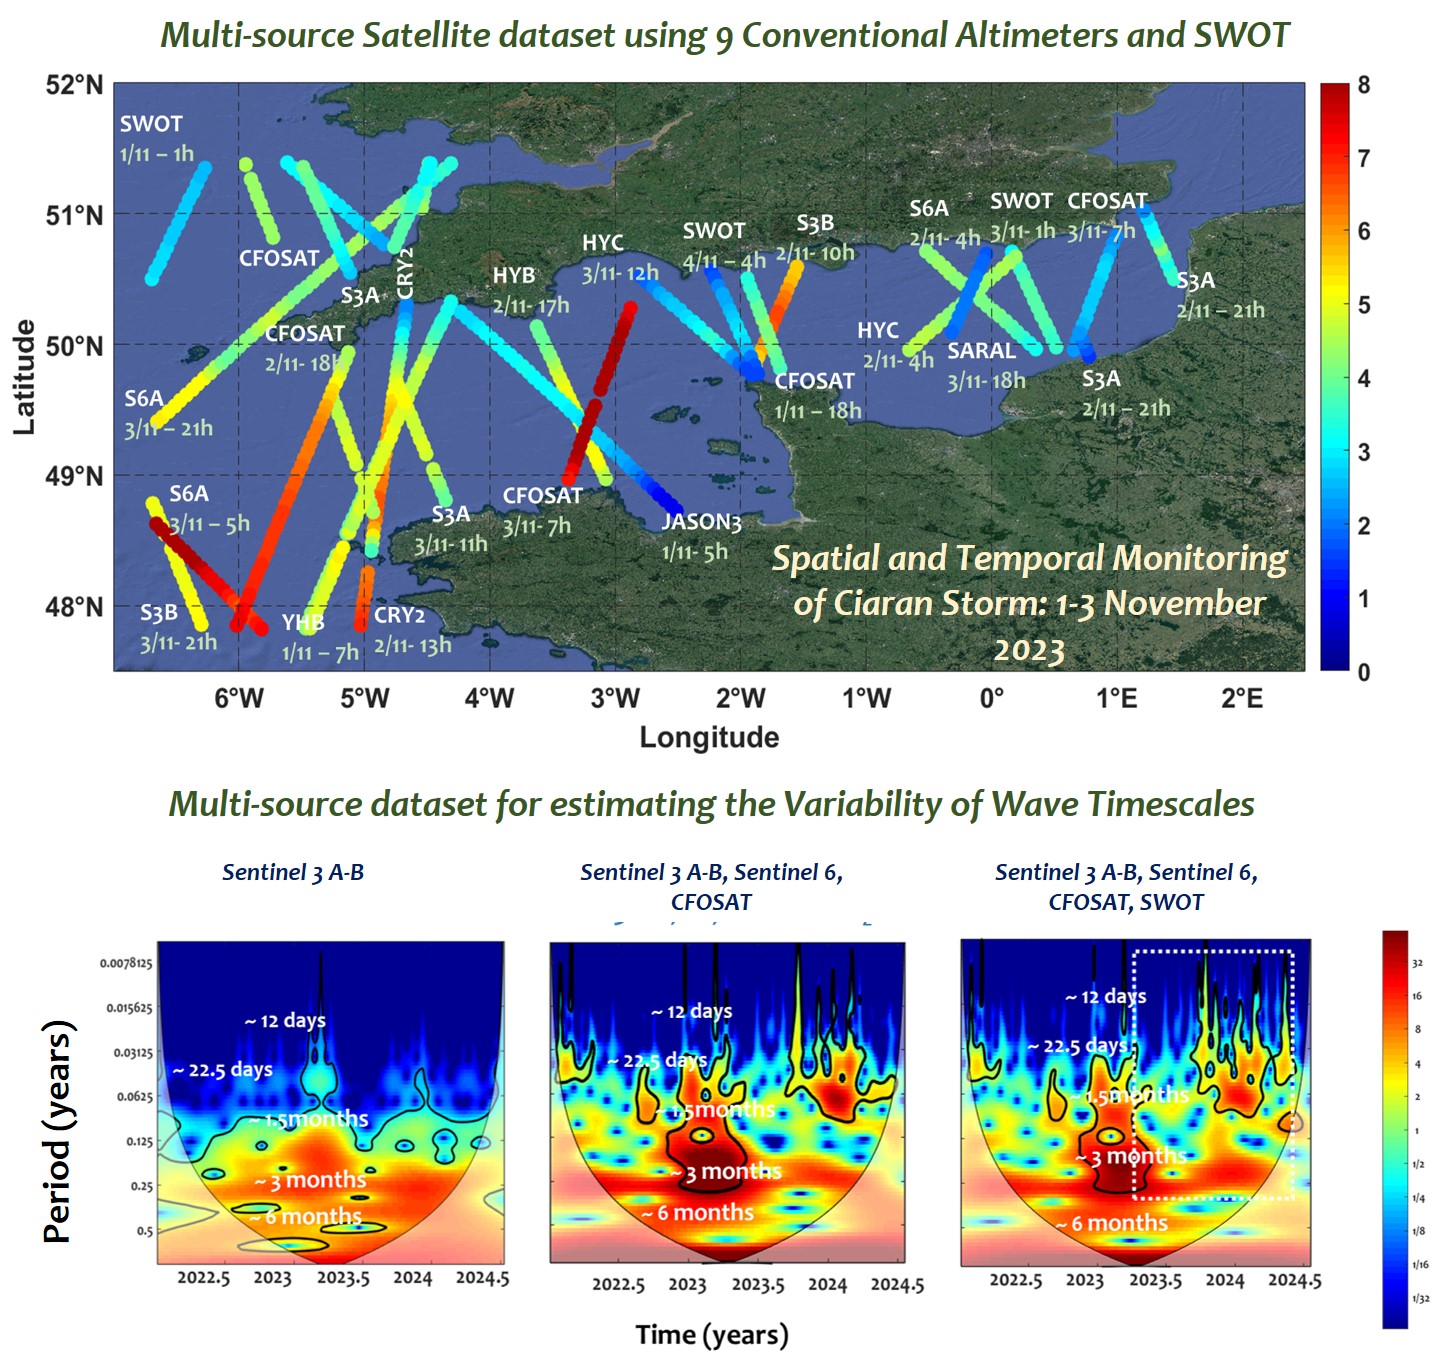
Figure 3.e displays the mapping of the SWH evolution during a period 5 days between 30 October and 4 November 2023 which includes CIARAN storm and 2 days pre- and post-storm, by combining 45 tracks including 7 passes of S3A, 5 passes of each S3B and S6A, and 4 passes of each Jason 3, Saral, CFOSAT and SWOT.
The use of the combined satellite dataset provides an excellent coverage in time and space from the North Atlantic to the entrance and along the Channel toward the North Sea. In addition to capturing the major extreme waves, multi-source satellite altimeters have also captured the distribution of wave energy pre- and post-storm, its dissipation in time and space (along the Channel and close to shallow areas).
3.2. Time-Evolution of Nearshore and Coastal Waves
The records of SWH have been extracted during the different altimeters and compared to the significant wave height provided by wave buoys (Figure 4): (1) 6200305 and the neighboring altimeter tracks of CFOSAT, SWOT, S-3A, S-3B and S-6A; 6200103 and the neighboring altimeter tracks of CFOSAT, SWOT, S-3A and S-6A; 6200069 and the neighboring altimeter tracks of CFOSAT, SWOT, S-3A and S-3B.
The overall comparison exhibited that the SWH altimetry observations estimate well the significant wave height, including maximum Hs values: The comparison of Hs with SWH from S-3A and S-3B exhibits a mean RMSE (root mean square error) of 0.75 m and an SD (Standard Deviation) of 0.62 m with an over estimation of moderate values (lower than 2 m) of 15%. Very good agreements are clearly observed CFOSAT, SWOT and S-6A with a mean RMSE (root mean square error) of 0.45 m and an SD (Standard Deviation) of 0.32 m.
Within the Channel and close to the Seine bay, the coherence between in-situ measurements (wave buoy 6200305) and altimetry observations, including S-6A, shows a small divergence with an over-estimation of SWH for moderate sea states and an under-estimation for energetic sea states. This divergence is mainly observed in sites with complex geometries and a significant change of depth, case of the semi-closed basin of the English Channel where the wave modulation is clearly observed between both French and UK sides, induced by wave reflection that should be highly manifested under energetic periods and storms [25]. Altimetry observations were extracted at the nearest point from the wave buoys, located in the nearshore areas and at a certain distance from the coast. Then, an exact comparison is not possible and the errors between measurements and observations is mainly explained by the distance between the wave buoy and the altimetry track.
The combined altimetry dataset composed of S3A, S3B, S6A, CFOSAT and SWOT has been explored in this part to analyze the temporal coverage of SWH at different depths in the Channel from deeper to nearshore and coastal areas, as shown in Figure 2. The time-series of SWH has been extracted from the crossing tracks of S3A-B (combining the two missions), S6A, CFOSAT and SWOT are displayed in Figure 5.a, Figure 5.b, Figure 5.c, Figure 5.d, respectively. The time-variation of SWH, provided by the combination of the five altimetry missions, is presented in Figure 5.e. The different evolutions have been constructed from the entrance of the Channel to the shallow areas at depth ranging approximately between ~ 100 m and ~ 20 m. The SWH time-evolutions, provided by S3A-B, S6A and SWOT (Figure 5.a, b and e), offer a high-resolution dataset with several sampling in time and seem to be slightly limited by CFOSAT (Figure 5.e). The different evolutions exhibit a series of multi-timescale variability of waves, from seasonal to interannual scales between 2023 and 2024, with moderate waves during May-Oct and energetic waves during Nov-April induced by winter storms.
The overall changes of waves in time and space are clearly reproduced by SWOT data (Figure 5.e) covering the period July 2023-2024 (only the SWOT Science Orbit observations are used).Figure 5.f shows the time-evolution of SWH provided by different combinations of satellite altimeters: (2) S3A-B, (2) S3A-B with S6A and (3) S3A-B with S6A and SWOT. The comparison between the three evolutions demonstrates that the combination 3 optimizes the capture of wave features and wave peaks related to storms, during the period 2023-2024 (peaks f October, November 2023 and April 2024 are only captured by SWOT; yellow curve in Figure 5.f). The different patterns are mainly explained by the time-changes in wave features, captured separately by each altimeter, along the Channel and close to coastal areas. The mapping of such features is enhanced when the different altimeters are combined (Figure 5.e) where most of the short-scale variability are captured, including extreme events. The comparison of the SWH time-evolutions at different depths evidences the changes in wave features with a substantial dissipation of wave heights around ~60 -55 m depth and then at reduced depths of ~30-35 m.
The spectral analysis of the SWH timeseries, provided by the combinations of satellite altimeters, has been explored to present a preliminary investigation of SWOT accuracy to reproduce the SWH variability at different timescales, including the short scale of high energetic periods. The SWH data, extracted from the different combinations, have been performed at two different areas: (1) deeper area in the entrance of the Channel and close to the Channel Islands: PT for S3A-B, PB for S6A and PE for SWOT (red-dashed rectangle in Figure 2; the high panel of Figure 6 ) , (2) area with reduced depth within the Channel and close to the coast: PR for S3A-B, PA for S6A and PA for SWOT (yellow -dashed rectangle in Figure 2; the low panel of Figure 6). Then, the compared analyses of the SWH frequencies have been examined between the conventional altimeters CFOSAT, S3A (green-dashed rectangle in Figure 2; the high panel of Figure 7) and S6A with SWOT (PZ in Figure 2.e; the low panel of Figure 7).
The CWT diagrams, displayed in Figure 6, have been used comparatively for SWOT, S3A-B and S6A to investigate the accuracy of SWOT to capture the variability of SWH at different scales (frequencies/wavelengths) and their assigned power (variance). In the spectrum, provided by the different diagrams, the color scale represents an increasing power (variance) from blue to red. The wavelet plots highlight the existence of various wavelengths of variability; each color represents one of the energy bands with certain ranges of frequencies (Figure 6 and Figure 7). The CWT of the three altimeters, exhibit similar spots of power concentration (red color) with high variance (> 20%), distributed at different wavelength between ~3 months and 22.5 days, and differently structured with a heterogeneous distribution between the three altimeters. This distribution evidences that the SWH variability is produced at different timescales from inter-daily (22.5 days) to inter-monthly (~ 1.5, ~ 3 – and 6- months) scales controlling the different modes of SWH patterns.
The concentration of energy at the short scales of days could be partly exacerbated by the repeat cycle of the altimeter, case of Sentinel 3A-B, S6A and SWOT [). The non-homogenous distribution of the power , displayed at each timescale, depends on the frequency sampling of each altimeter S3A,B, S6A and SWOT (high frequencies could be provided when the density of sampling is higher) sand the length of the timeseries ( low frequencies are observed for longer timeseries with more sampling data). The low frequency, corresponding to the variability mode of ~ 6 months, is not observed in SWOT data for the limited sampling data during the period 2023-2024.
The distribution of energy during the period 2022-2024, displayed by the CWT diagrams of Figure 6, underlines a concentration of energy with higher variance at winter seasons of Oct 2022-March 2023 and Nov 2023- April 2024, including the energetic spots related to the short events of storms (clearly observed for S3A-B and S6A), to highlight the altering patterns of SWH at inter-monthly and seasonal scales.
Figure 7 shows the accuracy to the combined satellite altimeters for identifying the different modes of SWH variability at scales raging from days to seasons. The case of CFOSAT and S3A-, analyzed separately and jointly by combining both data close to Roscoff in the Channel Islands areas, is illustrated in the high panel of Figure 7. The CWT diagrams of both radar sensors highlight the existence of several modes from high frequencies of days ( between ~12 days and ~22.5 days) to low frequencies of months. The frequencies of 3~6 months are also displayed with a non-homogenous distribution along the study period and variance lower than 16%. The variance of the seasonal and inter-monthly scales increases to 32% for the combined S3A-B and CFOSAT dataset where the variability mode is well-structured. The inter-daily frequencies for the combined dataset seem to be better manifested and clearly displayed with more observable spots at ~22.5 – 12 days related to short and highly energetic events.
The accuracy of SWOT when it’s combined with S3A-B, S6A and CFOSAT is displayed in the low panel of Figure 7 where SWH dataset have been calculated from S3-AB, S3A-B combined with S6A and CFOSAT, at the Channel Islands PZ (Figure 2.e).
Similarly, the distribution of the different frequencies controlling the variability of SWH is clearly observed by S3A-B. This distribution is also observable by the combined products of S3A-B, S6A and CFOSAT with an increasing power (variance) and well-structured spots along the time for the different energy bands, corresponding to timescales. The extension of such spots is strongly related to the energetic periods of winter seasons in 2023 and 2024. The concentration of SWH structures during the last period 2024 is clearly shaped and basically controlled by the frequencies of ~1.5 months and ~ 3 months which are better observed by the combination of S3A-B, S6A and CFOSAT with SWOT. This demonstrates the accuracy of SWOT data for a better capture of SWH features at different frequencies when they are combined with other satellite missions.
The enhanced recognition of the SWH variability at different scales from the multi-source altimetry data is explained by the increasing of the temporal sampling, including the instantaneous observations carried out for short energetic periods, which is a limitation of the observations for an individual altimeter. This limitation concerns also the spatial sampling of conventional altimeters for the large number of sampling blanks between the cross-tracks of the satellite altimeters [29, 30]. With SWOT mission, the problems of the cross-track sampling blanks are partly overcome due to the two-dimensional wide swath altimetry data along the track which reduces the gap of data between SWOT tracks and enhance the full spatial coverage of a specific area.
3.3. Spatial-Evolution of Wave Features Along the Altimeter Tracks
In this part, the variability of SWH along the tracks has been examined for four different altimeters Sentinel S3-A, S6-A, CFOSAT and SWOT during Ciaran, one of the most energetic storm produced on November 2023 (1 Nov 10 pm – 3 Nov 4 am ): S3A and CFOSAT crossing the channel in the middle of the storm while S6A and SWOT covers the end of the storm (Figure 8a). The objective here is to give insights on the spatial evolution of wave features along the different tracks from the entrance of the Channel to the coasts. The spectral analysis of wavelet transform has been applied to the SWH signal along the altimeter tracks (Figure 8 b)
The simulated CWT diagrams of SWH highlight three main variability modes in space (along the track) corresponding to different wavelengths/frequencies (presented as wave period in the diagrams): waves with period > 14s, waves with periods 12s -10s; and waves with periods < 10s. The three classes of waves clearly exhibit the presence of various wave energy features that are differently distributed from the open ocean to the Channel and the coastal areas. The SWH variability, provided by S3A and S6A in the entrance of the Channel, is mainly controlled waves with high periods, ranging between 10s and 12s, and significant heights decreasing from the deep to shallow waters.
The SWH, provided by CFOSAT close to Roscoff in the Channel Islands areas, shows high values between 7 and 8 m and integrates different wave features: higher than 14s, lower than 10s and 12-10 s. Such features are limited to waves with small periods of ~8-9 s within the Channel, close to the Seine bay as observed along the track of SWOT (Figure 8 b). The observed wave features have been compared to in-situ measurements of wave period and height as shown in Figure 9 that summarizes the distribution of wave periods from buoys (red points in Figure 1 and Figure 8.a) during Ciaran storm.
Changes in wave features from the entrance to the center of the Channel are mainly explained by the modulation of the energy induced by the refraction of waves close to the sea bottom within the basin. The wave modulation is enhanced during storms with a significant reflection between UK and French coats, as demonstrated in Lopez et al. (2024) works. The small-scale variability of waves is clearly observed in the Channel Islands areas by CFOSAT exhibiting an interaction between different features frim the nearshore to the coastal zone. This interaction takes a non-linear behavior when the physical transformations of wave are simultaneously produced and more pronounced in complex bathymetries (Figure 1). The wave features explored from S3A track, covering the entrance of the Channel (around 100-120 m of depth) and crossing the UK island, show variabilities at small scales close the coast with the presence of limited wavelengths (waves of ~6-8 s of period). The modulated waves, observed by SWOT in the end of Ciaran storm, show homogenous structures with small waves of ~ 8-9 s of period.
The spectral analysis of SWH provides some insights on wave features and their changes with the bathymetry. This information is useful for understanding the fluctuations in wave frequencies, wave groups and wave height gradients. Their assessment from satellite altimeter is complex and needs data processing techniques involving satellite retracking [31]. The identification of the existing wave frequencies controlling the wave fluctuations along the satellite track enhances the accurate separation of SWELL waves from the SWH total signal especially in delay/Doppler altimetry date with high burst repletion frequency [32]. This fact is combined to the aliasing process, largely observed for SAR signal, implies the strong need of high-rate sampling along the track direction to fully capture long waves in the instrument ground cells, including in shallow areas and close to the coast [33].
4. Discussion
Monitoring nearshore and coastal waves using SWH observations from multi-source altimeters is crucial for clearly identifying the spatial variability of wave features at a specific timeslot during the storm. The combination of SWOT with other multi-source satellite altimeter data would improve the spatial coverage of the SWH changes and their mapping from the nearshore to the coastal zones; case of S3A and S6A and HY, Saral, Jason3 and CFOSAT, in the Seine Bay while Cryosat-2 altimetry seems to operating in the entrance of the Channel and close to Channel Islands (UK).
In this work, compared analyses of the significant wave height provided by altimeters and wave buoys have been performed in case of time matching for CFOSTA, S-3A, S-3B, S-6A and SWOT. The quantitative differences between satellites and measurements should be mainly explained by the space matching reflecting the obvious spatial features of waves with are strongly related to the depth and the distance from the coastline.
Indeed, nearshore and coastal waves are generally exposed to different physical processes (refraction, diffraction), responsible for their modulation on some zones and their dissipation in other areas depending on the topographical factors of the bottom and the geometry of the coastal areas. Such substantial wave modifications could be highly pronounced in specific locations (meters to few kilometers) in the nearshore- coastal zones; which makes difficult their comparison with buoys distant from altimetry observations. Furthermore, the wave frequencies used from buoys to assess the significant wave height should be correlated with the SWH values provided by altimeters. It is an important point to be investigated in depth to hold the correct comparison and improve the matching between both datasets. Similar insights have been examined in [34] work where the SWH measurements from buoys have been corrected by means of data matching, error statistics, and linear least-squares fitting with the aim to improve the accuracy of wave in-situ measurements. They have found that this correction changes in time and seems to be highly consistent with that of the 10-m wind during the observation period, and its average value reaches 3.8 m.
Wave features under Ciaran, one of the most energetic storm in the English Channel during the winter season 2023-2024, have been examined from the spectral analysis of SWH along -track for CFOSAT, SWOT, S-3A and S-6A. Different wavelengths have been identified during the storm from the entrance of the Channel to the coast, useful for mapping their changes with the bathymetry and assessing the fluctuating wave frequencies, wave groups and wave height gradients; which is crucial for understanding the modulations of waves, including wave refraction and reflection in a semi-closed system, case of the English Channel, between UK and French coasts.
The decreasing quality of the altimetry-derived geophysical parameters could be generated by the narrow sampling window in the satellite along-track direction limiting the capture of long waves in the instrument ground cells [38]. The distortion of wavelength would be significantly observed when the ocean wavelengths are of the same order as the delay/Doppler altimeter along-track [39]. Then, the development of accurate techniques for processing altimetry observations is key for assessing the different wave components and understanding their complex interactions; which is an important challenge in oceanography field.
In the light of the overall results provided in this work, we recognize that satellite altimeters play an important role for monitoring waves and enhancing our understanding of their evolution from deep to shallow waters, case of the English Channel considered as a semi-open basin exposed to a complex dynamic monitored by a significant energy modulation between UK and French sides [32]. While a single satellite altimeter has the opportunity for observing the hydrodynamic features, multi-source satellite altimeters offer a great probability for enhancing the spatial and temporal coverage to capture waves, including during short events. 9 conventional satellite altimeters have been used in this work with the revolutionary mission SWOT for mapping waves along tracks within the English Channel and close to UK and French coastal areas. Their combination has been explored for monitoring the time and spatial evolution of storm waves. The repeat orbit of each satellite altimeter is longer than 10 days and the track of most of satellites is only observed once for a storm shorter than 24h; they are observed more than twice for longer storms, and more frequently for extended periods beyond ~ 5 days (case of Figure 5.e).
[5] have used 25-year of multi-source satellite altimeters and coastal tide gauge data for monitoring storm surges, including those generated during extreme events in China’s coastal regions. They have demonstrated the relevance of the combined satellite altimeters for assessing the changes in features of storm surges, accounting for nearly 26% of storm surge events identified from tide gauges, and capturing several signals of extreme events as well as the spatial and the temporal dynamic of surges. The use of multi-sources of altimeter data in real-time to improve wave model analyses and forecasts at global scale has been introduced by [35]. They have generated the significant wave height timeseries from the Wave Model WAM with the assimilation of ERS-2 and JASON-1 to show the impact of the data assimilation is better when two different altimeters are used instead of one for the improvement of wave forecast. [36] have implemented a data assimilation scheme for wave forecasting in the Indian Ocean using the SARAL/AltiKa, Jason-2 and Jason-3 altimeters combined with the Optimal Interpolation technique. They have exhibited the impact of data assimilation towards a considerable improvement up ~ 15% of the reliability of wave predictions in the Indian Ocean. This improvement is limited to ~4–6% for wind forecasting. [37] have investigated the sensitivity of the projected wave characteristics and their impact on the sea level changes by developing a dynamical downscaling over the northeastern Atlantic for the 1970–2100 period under the SSP5–8.5 climate change scenario. They have assimilated altimetry data to improve a regional 3D wave model to demonstrate the largest impact of sea level and wave changes on the wide continental shelf where shallow-water dynamics prevail, especially in macro-tidal areas, case of Mont-Saint Michel Bay in France.
The contribution of the satellite altimeters is not limited to the monitoring of the hydrodynamic features in a specific area but it is useful for an accurate description and the time and space evolution of wave dynamics; which is crucial to enhance the reliability of numerical models for simulating extreme events by providing more operational real-time data via their assimilation, and promote an accurate forecasting tool [5]. Integrating multi-source satellite altimeters for mapping the temporal and spatial evolution of physical parameters, case of waves in this work, is crucial for the validation of models and the assimilation of data; which is strongly required to enhance the reliability of models by reducing the uncertainties of numerical simulations.
5. Conclusions
In the present research, a multi-source altimetry dataset, including the new mission SWOT, has been developed using 10 different satellites for monitoring the nearshore and coastal waves in the English Channel and close to UK a French coasts with a special focus on high energetic periods and storms. SWOT altimetry observations have been integrated with existing satellite altimeters at regional scale of the Channel and local scale of the coast. The main finding of this work argues accurate observations, provided by the multi-source altimeters at nearshore and shallow areas. Slight limitations were identified in zones with very reduced depths with complex topographical factors, case of the center of the English Channel where wave modulation between French and UK sides is highly manifested under storms.
Nowadays, the satellite altimeters for monitoring coastal hydrodynamics are still in their infancy. Even though, the use of multisource satellite dataset by combining different altimeters with different repeat orbits is an excellent way to overcome the limitations of the spatial-temporal sampling of conventional nadir-pointing altimeters and offer the possibility to enhance the full coverage of waves. The combination of the conventional altimeters with the revolutionary mission SWOT brings an amazing enhancement of the time-sampling to capture the different modes of variabilities the from inter-monthly to inter-daily scales, including the short events of storms; and the spatial sampling that would be provided thanks to the consistent view, provided by 2D maps of SWOT interferometric swath.
This work presents the first investigation of the SWOT contribution, combined with 9 conventional altimeters, for monitoring coastal waves integrating both regional and local scales. The good performance of this altimetry fusion advocates that, further analyses of satellite accuracy require to be investigated in depth by gathering different products, including High Resolution data, for resolving the complex features in coastal areas. This challenging issue will benefit from ongoing works for offering reliable estimates of coastal changes, crucial for improving numerical models at both regional and local scales.
Author Contributions
For research articles with several authors, a short paragraph specifying their individual contributions must be provided. The following statements should be used “Conceptualization, E.I.T; E.S; M.D; F.F; C.L.S and S.I..; methodology, E.I.T; E.S; M.D; F.F; C.L.S, D.G.B; S.I.;.; validation, E.I.T., C. L.S .; formal analysis, E.I.T; E.S; M.D; C.L.S and S.I.; investigation, E.I.T; E.S; F.F M.D; C.L.S and S.I.; resources, E.I.T, F.F, L.F, A.C.; data curation, E.I.T, F.F, E.S, M.D.; writing—original draft preparation, X.X.; writing—review and editing, E.I.T; E.S; M.D; F.F; C.L.S and S.I.; D.G.B, L.A, A.C; visualization, X.X.; supervision, E.I.T, F.F, L.A, A.C.; project administration, E.I.T, A.C.; funding acquisition, E.I.T. All authors have read and agreed to the published version of the manuscript.” Please turn to the CRediT taxonomy for the term explanation. Authorship must be limited to those who have contributed substantially to the work reported.
Funding
This research received no external funding.
Data Availability Statement
The details regarding where data supporting reported results are provided, including links to publicly archived datasets analyzed or generated during the study. No new data were created.
Acknowledgments
This work was supported by the French Space Agency CNES (Centre National d'Etudes Spatiales) in the framework of the program SWOT4COST and the CNRS project EONES-SWOT. We thank also Ajejandro Bohé from CNES for his effective review of SWOT products used in this work. We extend our gratitude to SHOM and MetOffice for providing wave buoys dataset,
Conflicts of Interest
The authors declare no conflicts of interest.
References
- Nicholls, R. J., and C. Small. Improved estimates of coastal population and exposure to hazards released; Eos Trans. AGU, 83(28), 301–305; 2002. [CrossRef]
- Switzer, A. D. Coastal hazards: storms and tsunamis; Coast. Environ. Glob. Change,2017; pp 104-127.
- Masselink, G., & Gehrels, R. Coastal Environments and Global Change, 2015 Wiley-Blackwell. [CrossRef]
- Kreibich, H., Van Loon A.F., Schröter, K., Ward, P.J., Mazzoleni, M., Sairam, N., Abeshu, G.W., Agafonova, S., AghaKouchak, A., Aksoy, H., Alvarez-Garreton, C., A. The challenge of unprecedented floods and droughts in risk management. Nature, 2022; Aug;608(7921):80-86. Epub 2022 Aug 3. [CrossRef] [PubMed] [PubMed Central]
- Ji, T., Guosheng, L., Zhang, Y. Observing storm surges in China's coastal areas by integrating multi-source satellite altimeters, Estuar. Coast. Shelf Sci., 2019; Volume 225, 106224, ISSN 0272-7714; 2019. (https://www.sciencedirect.com/science/article/pii/S0272771419300253).
- Dodet, G., Castelle, B., Masselink, G., Scott, T., Davidson, M., Floc'h, F., Jackson, D., & Suanez, S. Beach recovery from extreme storm activity during the 2013–14 winter along the Atlantic coast of Europe. Earth Surf. Process. Landf., 2019, 44(1), 393-401. [CrossRef]
- Laignel, B., Vignudelli, S., Almar, R. et al. Observation of the Coastal Areas, Estuaries and Deltas from Space; Surv Geophys 44, 2023, 1309–1356 (2023). [CrossRef]
- Abdalla, S., Kolahchi, A., Ablain, M., Adusumilli, S., Aich Bhowmick, S., …. al., Altimetry for the future : Building on 25 years of progress, Adv. Space Res., 2021, Volume 68, Issue 2, Pages 319-363, ISSN 0273-1177. [CrossRef]
- Bonnefond, P., Verron, J., Aublanc, J., Babu, K. N., Bergé-Nguyen, M., Cancet, M.,... & Watson, C. The benefits of the Ka-band as evidenced from the SARAL/AltiKa altimetric mission: Quality assessment and unique characteristics of AltiKa data. J. Remote Sens., 2018, 10(1), 83. [CrossRef]
- Quartly, G. D., Nencioli, F., Raynal, M., Bonnefond, P., Nilo Garcia, P., Garcia-Mondéjar, A., ... & Lucas, B. The roles of the S3MPC: Monitoring, validation and evolution of Sentinel-3 altimetry observations. J. Remote Sens., 2020, 12(11), 1763. [CrossRef]
- Idžanović, M., Ophaug, V., & Andersen, O. B. Coastal sea level from CryoSat-2 SARIn altimetry in Norway. Adv. Space Res., 2018, 62(6), 1344-1357.
- Han, G. Altimeter surveys, coastal tides, and shelf circulation. Encyclopedia of Coastal Science, 2027, eds C. W. Finkl and C. Makowski (Berlin: Springer Science & Business Media). [CrossRef]
- Schlembach, F., Passaro, M., Dettmering, D., Bidlot, J., Seitz, F.. Interference-sensitive coastal SAR altimetry retracking strategy for measuring significant wave height, Remote Sens. Environ. 2022. [CrossRef]
- Benveniste, J., Mandea, M., Melet, A., Ferrier, P. Earth observations for coastal hazards monitoring and international services: a European perspective. Surv. Geophys., 2020, 41(6):1185–1208. [CrossRef]
- Mears, C. A., and F. J. Wentz. A Satellite-Derived Lower-Tropospheric Atmospheric Temperature Dataset Using an Optimized Adjustment for Diurnal Effects. J. Climate, 2017, 30, 7695–7718. [CrossRef]
- Morrow, R., Fu, L. L., Ardhuin,, F., Benkiran, M., Chapron, M., et al. Global Observations of Fine-Scale Ocean Surface Topography With the Surface Water and Ocean Topography (SWOT) Mission. Front. mar. sci., 2017, 6, ⟨10.3389/fmars.2019.00232⟩. ⟨hal-02194574⟩.
- Fu, L.âL., Pavelsky, T., Cretaux, J.âF., Morrow, R., Farrar, J. T., Vaze, P., et al. The Surface Water and Ocean Topography Mission: A breakthrough in radar remote sensing of the ocean and land surface water. Geophys. Res. Lett., 2024, 51, e2023GL107652. [CrossRef]
- Ardhuin, F., Molero, B., Bohé, A., Nouguier, F., Collard, et al. Phase-Resolved Swells Across Ocean Basins in SWOT Altimetry Data: Revealing Centimeter Scale Wave Heights Including Coastal Reflection. Geophys. Res. Lett., 2024, Science from the Surface Water and Ocean Topograp hy Satellite Mission, 51 (16), pp.e2024GL109658. ff10.1029/2024GL109658ff.
- Bohé, A. , Chen, A., Dubois, P., Fore, A., & Molero, B., Peral, E., Raynal, M., Stiles, Bryan, Ardhuin, F., Hay, A., Legresy, B., Lenain, L., Bôas, A. Measuring Significant Wave Height Fields in Two Dimensions at Kilometric Scales With SWOT. IEEE Trans. Geosci., Remote Sens., 2025, PP. 1-1. 10.1109/TGRS.2025.3551605.
- Mendoza, E. T., Jimenez, J. A., and Mateo, J.: A coastal storms intensity scale for the Catalan sea (NW Mediterranean). Nat. Hazards Earth Syst. Sci., 2024, 11, 2453–2462. [CrossRef]
- Castelle, B., Marieu, V., Bujan, S., Splintre, K., Robinet, A., Senechal, N., Ferreira, S.. Impact of the Winter 2013-2014 Series of Severe Western Europe Storms on a Double-Barred Sandy Coast: Beach and Dune Erosion and Megacusp Embayments. Geomorphology, 2015, 238, 135-148. [CrossRef]
- López Solano, C., Turki, E.I., Mendoza, E.T. et al. Hydrodynamic modelling for simulating nearshore waves and sea levels: classification of extreme events from the English Channel to the Normandy coasts. Nat Hazards, 2024, 120, 13951–13973. [CrossRef]
- PL D-105502, “SWOT Algorithm Theoretical Basis Document: Level 2 KaRIn Low Rate Sea Surface Height -L2_LR_SSH Science Algorithm Software,”.
- EMODnet Bathymetry Portal. Available online: https://www.emodnet-bathymetry.eu/data-products (accessed on 4 September 2023).
- Turki, I., Massei, N., Laignel, B.. Linking Sea Level Dynamic and Exceptional Events to Large-scale Atmospheric Circulation Variability: Case of Seine Bay, France. Oceanologia, 2019, 61 (3) (2019), pp. 321-330. [CrossRef]
- Turki, I., Massei, N., Laignel, B., Shafiei, H. Effects of Global Climate Oscillations on Intermonthly to Interannual Variability of Sea levels along the English Channel Coasts (NW France). Oceanologia, 2020,Volume 62, Issue 2, 2020, Pages 226-242, ISSN 0078-3234. [CrossRef]
- Labat, D. Recent advances in wavelet analyses: Part 1. A review of concepts. J. Hydrol., 2005, 314 (1–4) (2005), pp. 275-288. [CrossRef]
- Torrence, C., Compo, G.P. A practical guide to wavelet analysis B. Am. Meterol. Soc., 1998, 79 , pp. 61-78. [CrossRef]
- Cazenave, A., Palanisamy, H., Ablain, M. Contemporary sea level changes from satellite altimetry: What have we learned? What are the new challenges?, Adv Space Res, 2018, Volume 62, Issue 7, 2018, Pages 1639-1653. ISSN 0273-1177. [CrossRef]
- Peng, F., Deng, X. Validation of Sentinel-3A SAR mode sea level anomalies around the Australian coastal region. Remote Sens. Environ., 2020, Volume 237, 2020, 111548. [CrossRef]
- De Carlo, M., & Ardhuin, F. Along-track resolution and uncertainty of altimeter-derived wave height and sea level: Re-defining the significant wave height in extreme storm. J. Geophys. Res. Oceans, 2014, 129, e2023JC020832. [CrossRef]
- Rieu, P., Moreau, T., Cadier, E., Raynal, M., Clerc, S., Donlon, C., & Maraldi, C.. Exploiting the Sentinel-3 tandem phase dataset and azimuth oversampling to better characterize the sensitivity of SAR altimeter sea surface height to long ocean waves. Adv Space Res,, 2021, 67(1), 253–265. [CrossRef]
- Rieu, P., Moreau, T., Raynal, M., Cadier, E., Thibaut, P., Borde, F., et al. First SAR altimeter tandem phase: A unique opportunity to better characterize open ocean SAR altimetry signals with unfocused and focused processing. Ocean Surface Topography Science Team, 21–25 October 2019.
- Jianjun K., Runyu M., Yiting C., Hongli, F., Comparative analysis of significant wave height between a new Southern Ocean buoy and satellite altimeter. Atmos. Ocean. Sci. Lett., 2021, Volume 14, Issue 5, 2021, 100044, ISSN 1674-2834. [CrossRef]
- Skandrani, C., Lefevre, J. M., Queffeulou, P. Impact of Multisatellite Altimeter Data Assimilation on Wave Analysis and Forecast. Mar. Geod., 2004, 27(3–4), 511–533; 200. [CrossRef]
- Seemanth, M., Remya, P.G., Aich Bhowmick, S., Sharma, R., Nair, T.M.B., Kumar, R., Chakraborty, A. Implementation of altimeter data assimilation on a regional wave forecasting system and its impact on wave and swell surge forecast in the Indian Ocean, Ocean Eng., 2021,Volume 237; 2021; 109585, ISSN 0029-8018. [CrossRef]
- Chaigneau, A. A., Law-Chune, S., Melet, A., Voldoire, A., Reffray, G., and Aouf, L. Impact of sea level changes on future wave conditions along the coasts of western Europe, Ocean Sci., 2023, 19, 1123–1143. [CrossRef]
- Moreau, T., Tran, N., Tison, C., Le Gac, S., Boy, F., & Boy, F. Impact of long ocean waves on wave height retrieval from SAR altimetry data. Adv. Space Res., 2018, 62(6), 1434–1444. [CrossRef]
- Reale, F., Carratelli, E., Laiz, I., Di Leo, A., & Fenoglio-Marc, L. Wave orbital velocity effects on radar doppler altimeter for sea monitoring. J. Mar. Sci. Eng, 2020, 8(6). [CrossRef]
Figure 1.
Bathymetry map of the English Channel. The position of wave buoys is also illustrated.
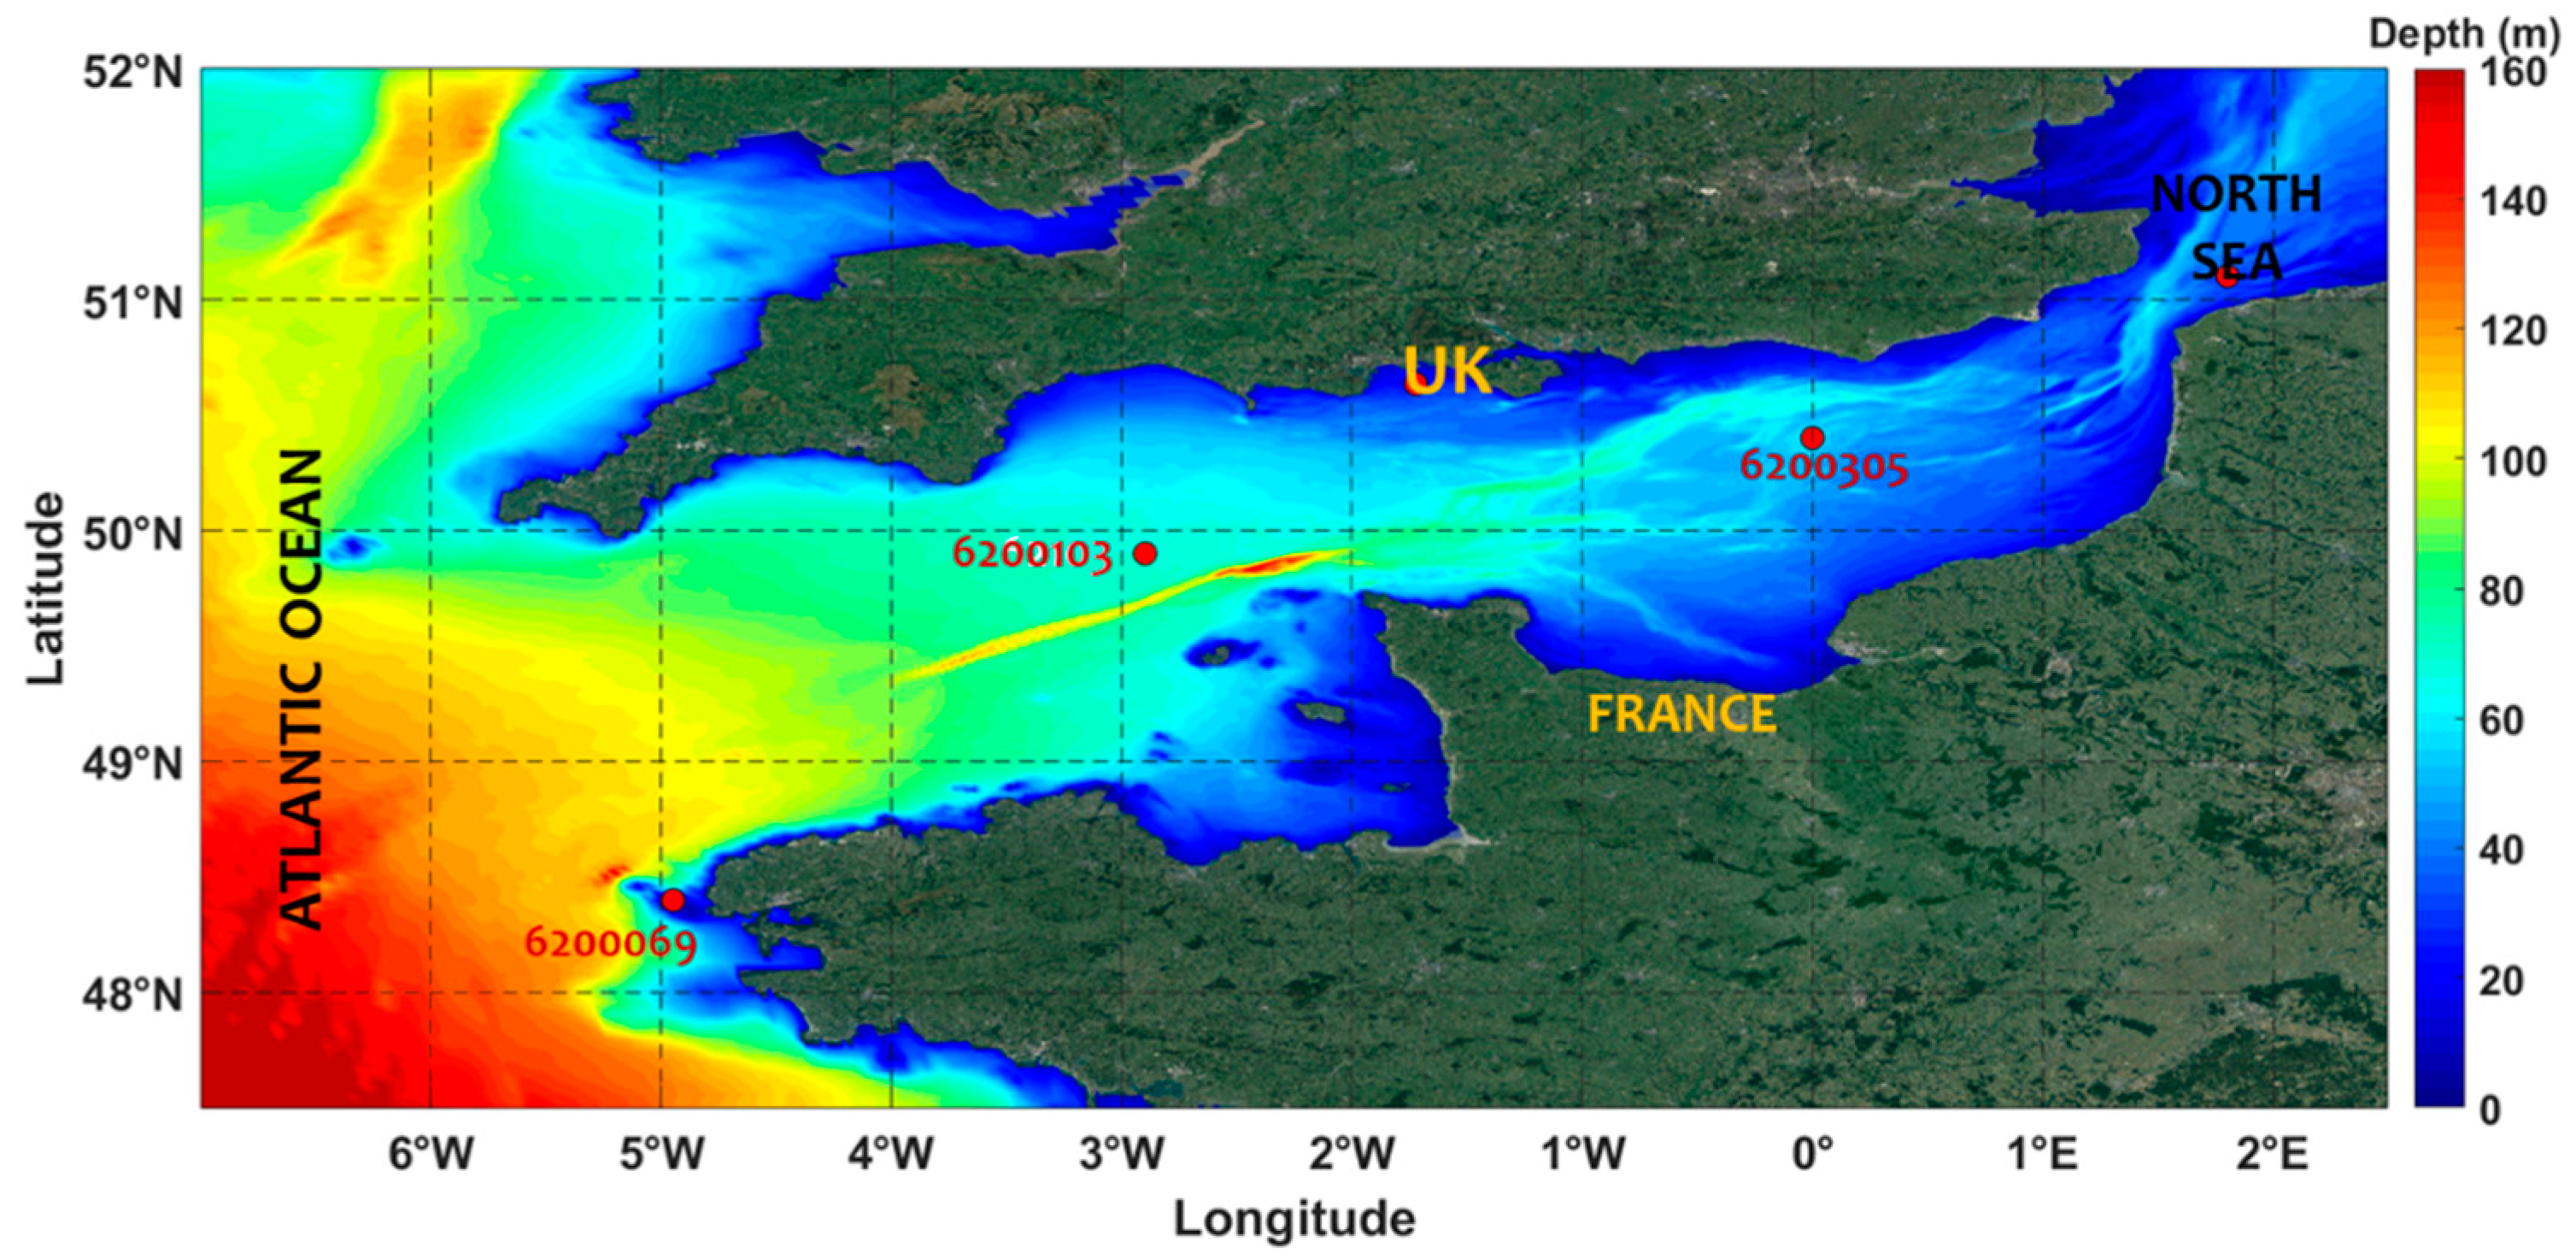
Figure 2.
Satellite tracks during the period 2022-2024 within the English Channel provided by Sentinel 3A/B (a), Sentinel 6 (b), CFOSAT (c), SWOT nadir (d) and the combined satellite altimetry tracks (e).
Figure 2.
Satellite tracks during the period 2022-2024 within the English Channel provided by Sentinel 3A/B (a), Sentinel 6 (b), CFOSAT (c), SWOT nadir (d) and the combined satellite altimetry tracks (e).
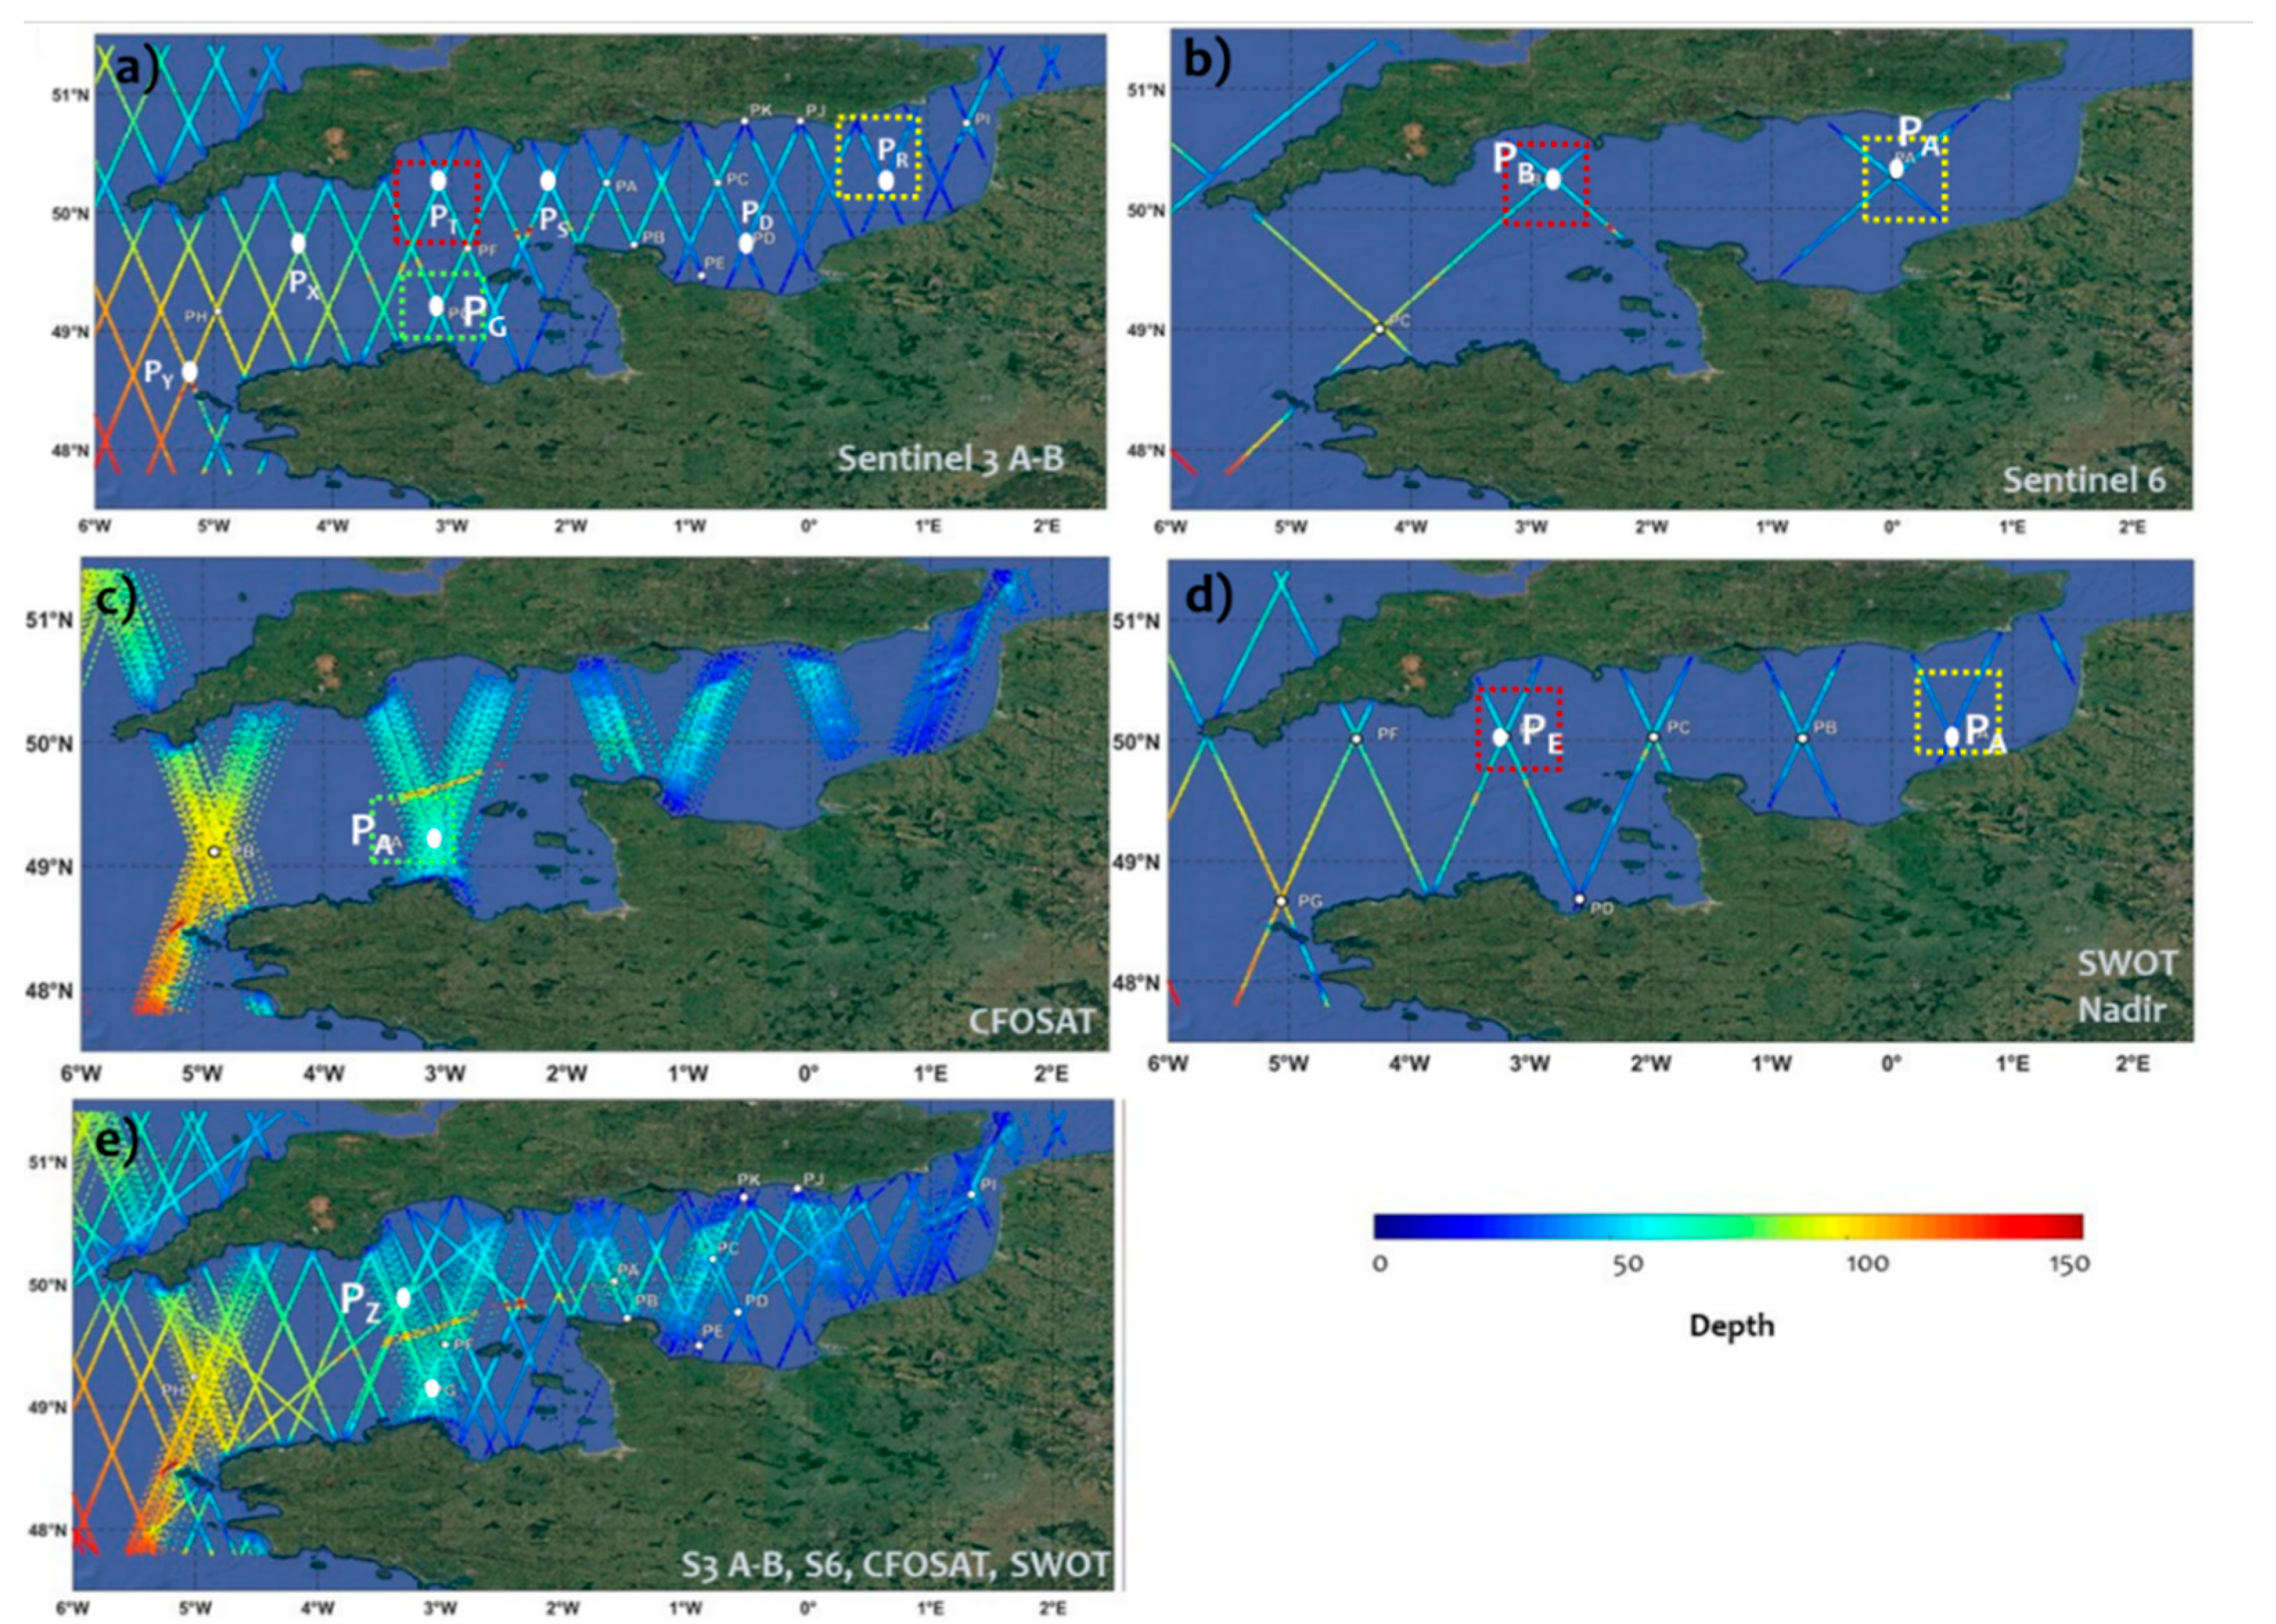
Figure 3.
Monitoring of marine storm along the English Channel and French/UK coasts: coupling of SWOT with conventional missions: Mathis (a), Karlotta(b), Pierrick (c), Ciaran (d) and Ciaran with 2 days pre- and post-storm (e).
Figure 3.
Monitoring of marine storm along the English Channel and French/UK coasts: coupling of SWOT with conventional missions: Mathis (a), Karlotta(b), Pierrick (c), Ciaran (d) and Ciaran with 2 days pre- and post-storm (e).
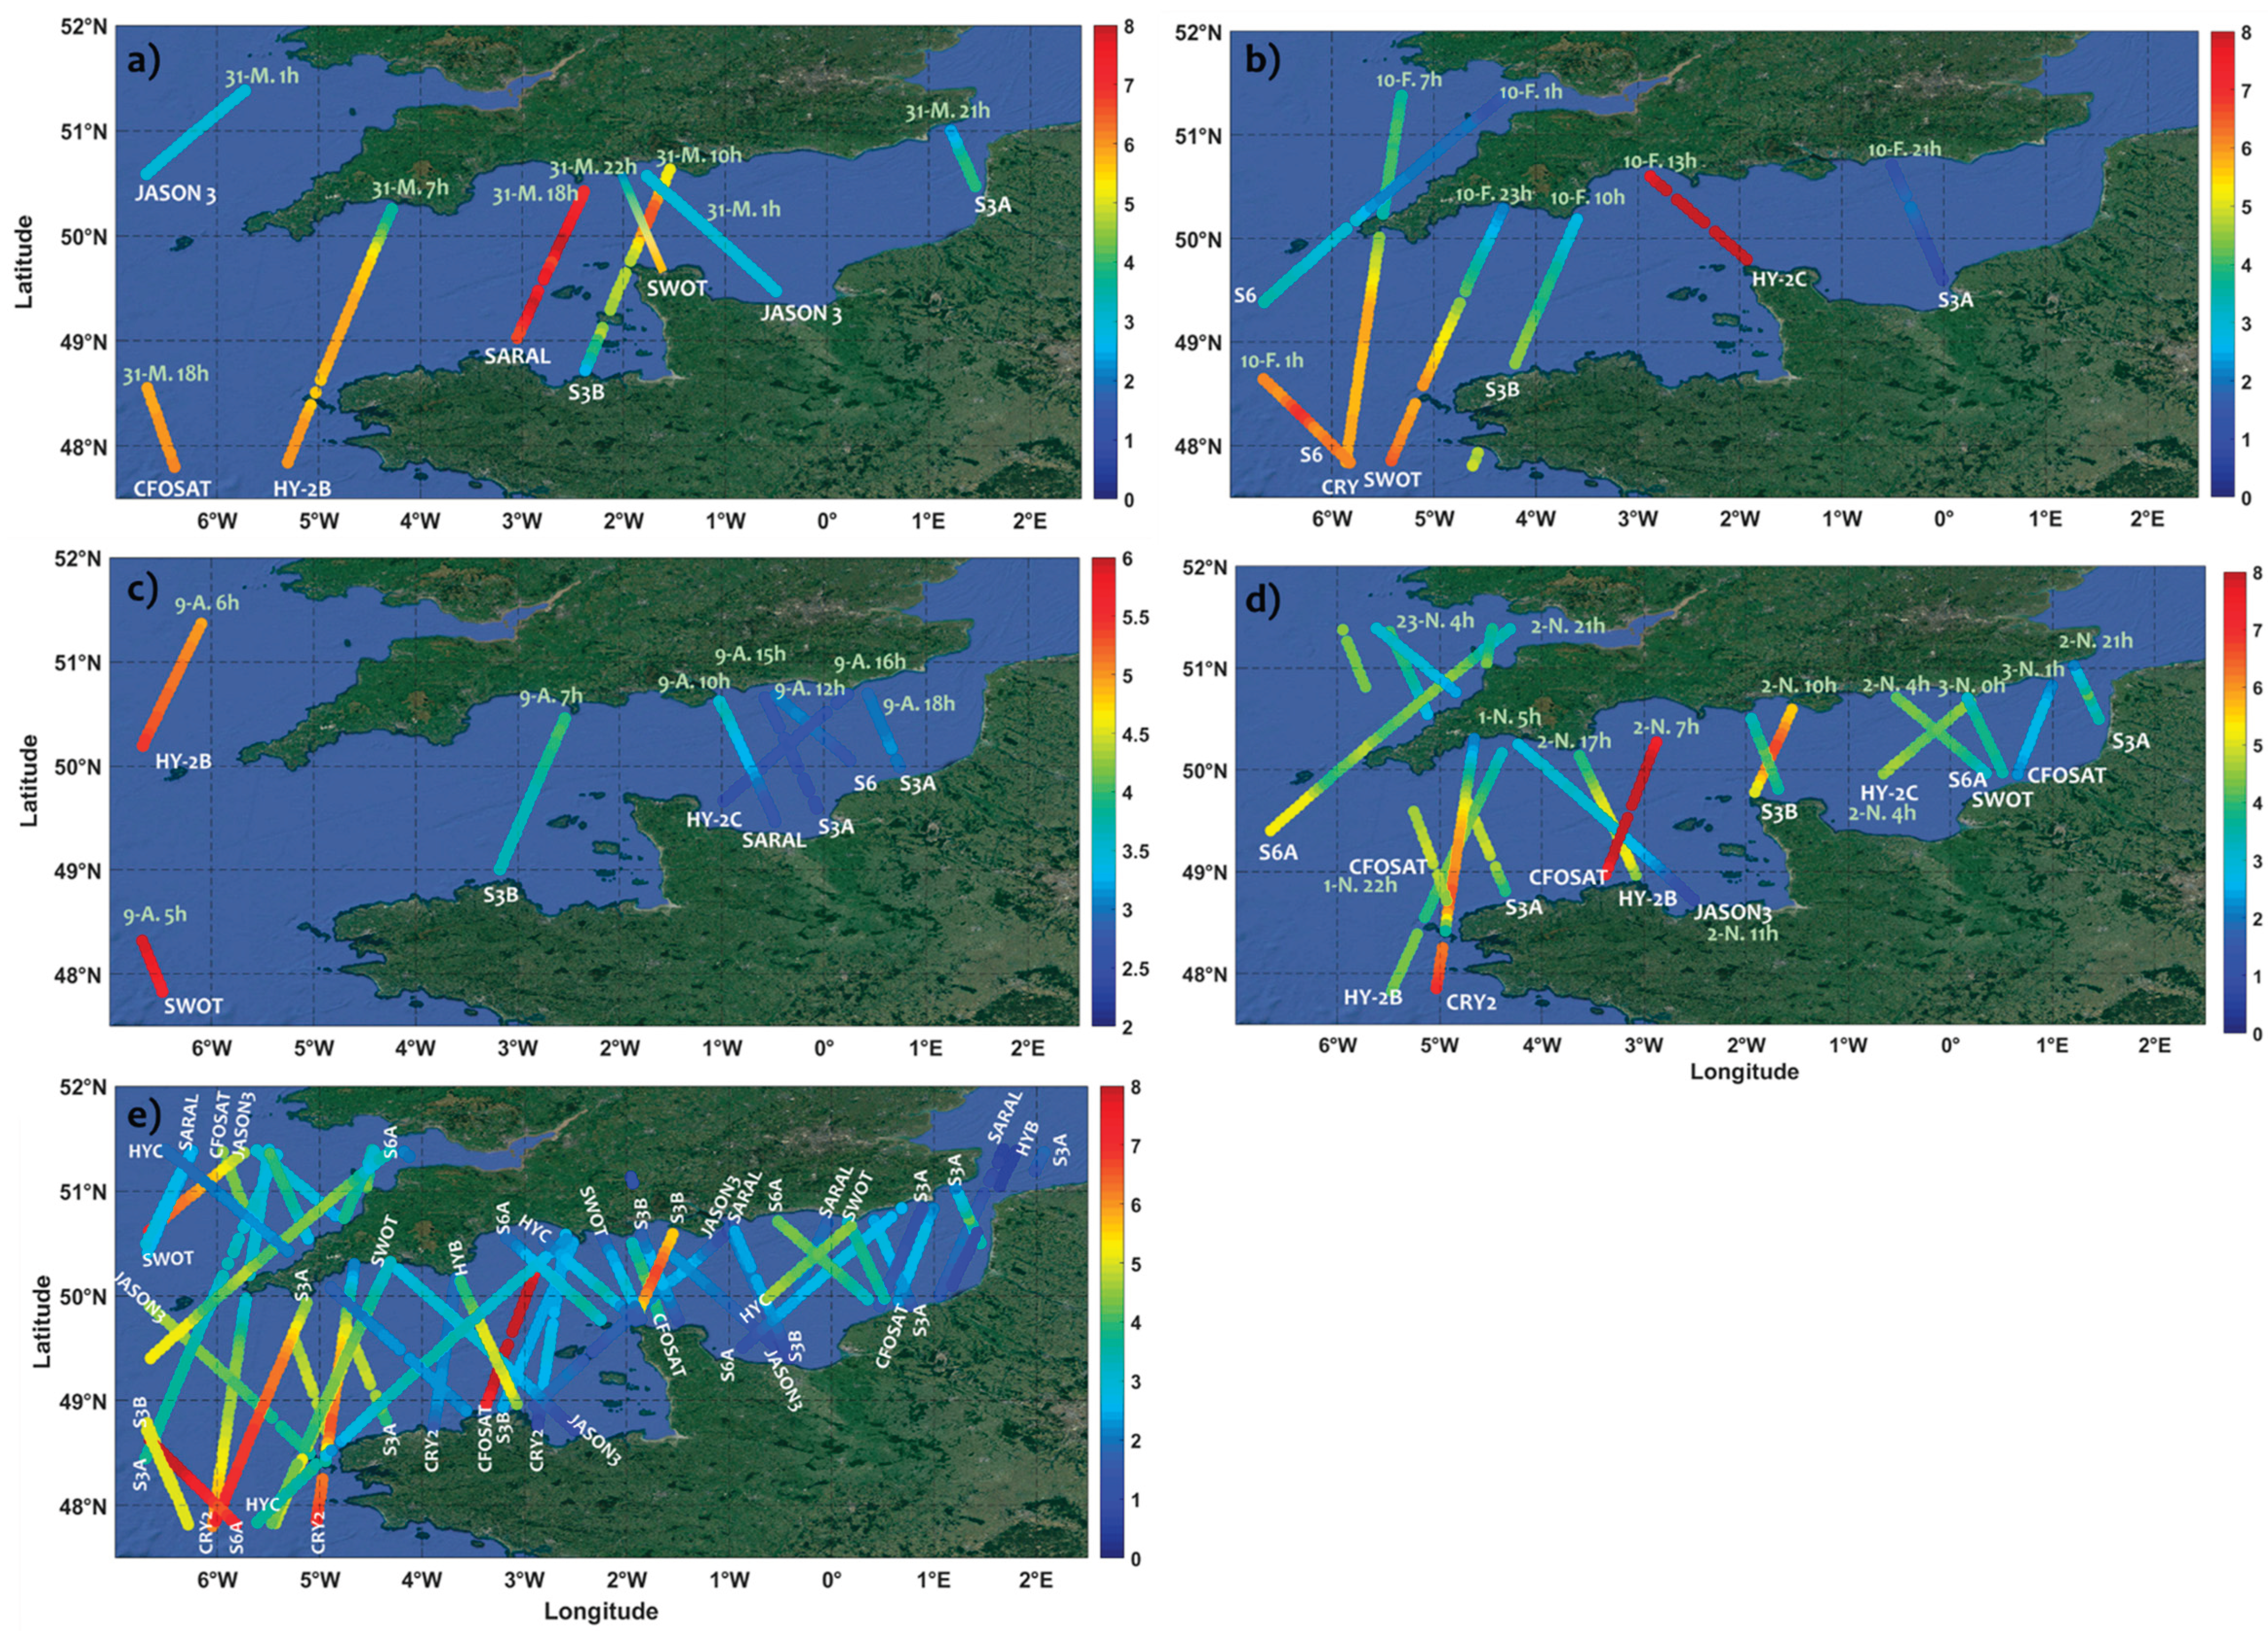
Figure 4.
Compared analysis of Hs with SWH (CFOSAT, SWOT, S 3-A, S-3B and S-6A) for the different buoys 6200305, 6200103 and 6200069.
Figure 4.
Compared analysis of Hs with SWH (CFOSAT, SWOT, S 3-A, S-3B and S-6A) for the different buoys 6200305, 6200103 and 6200069.
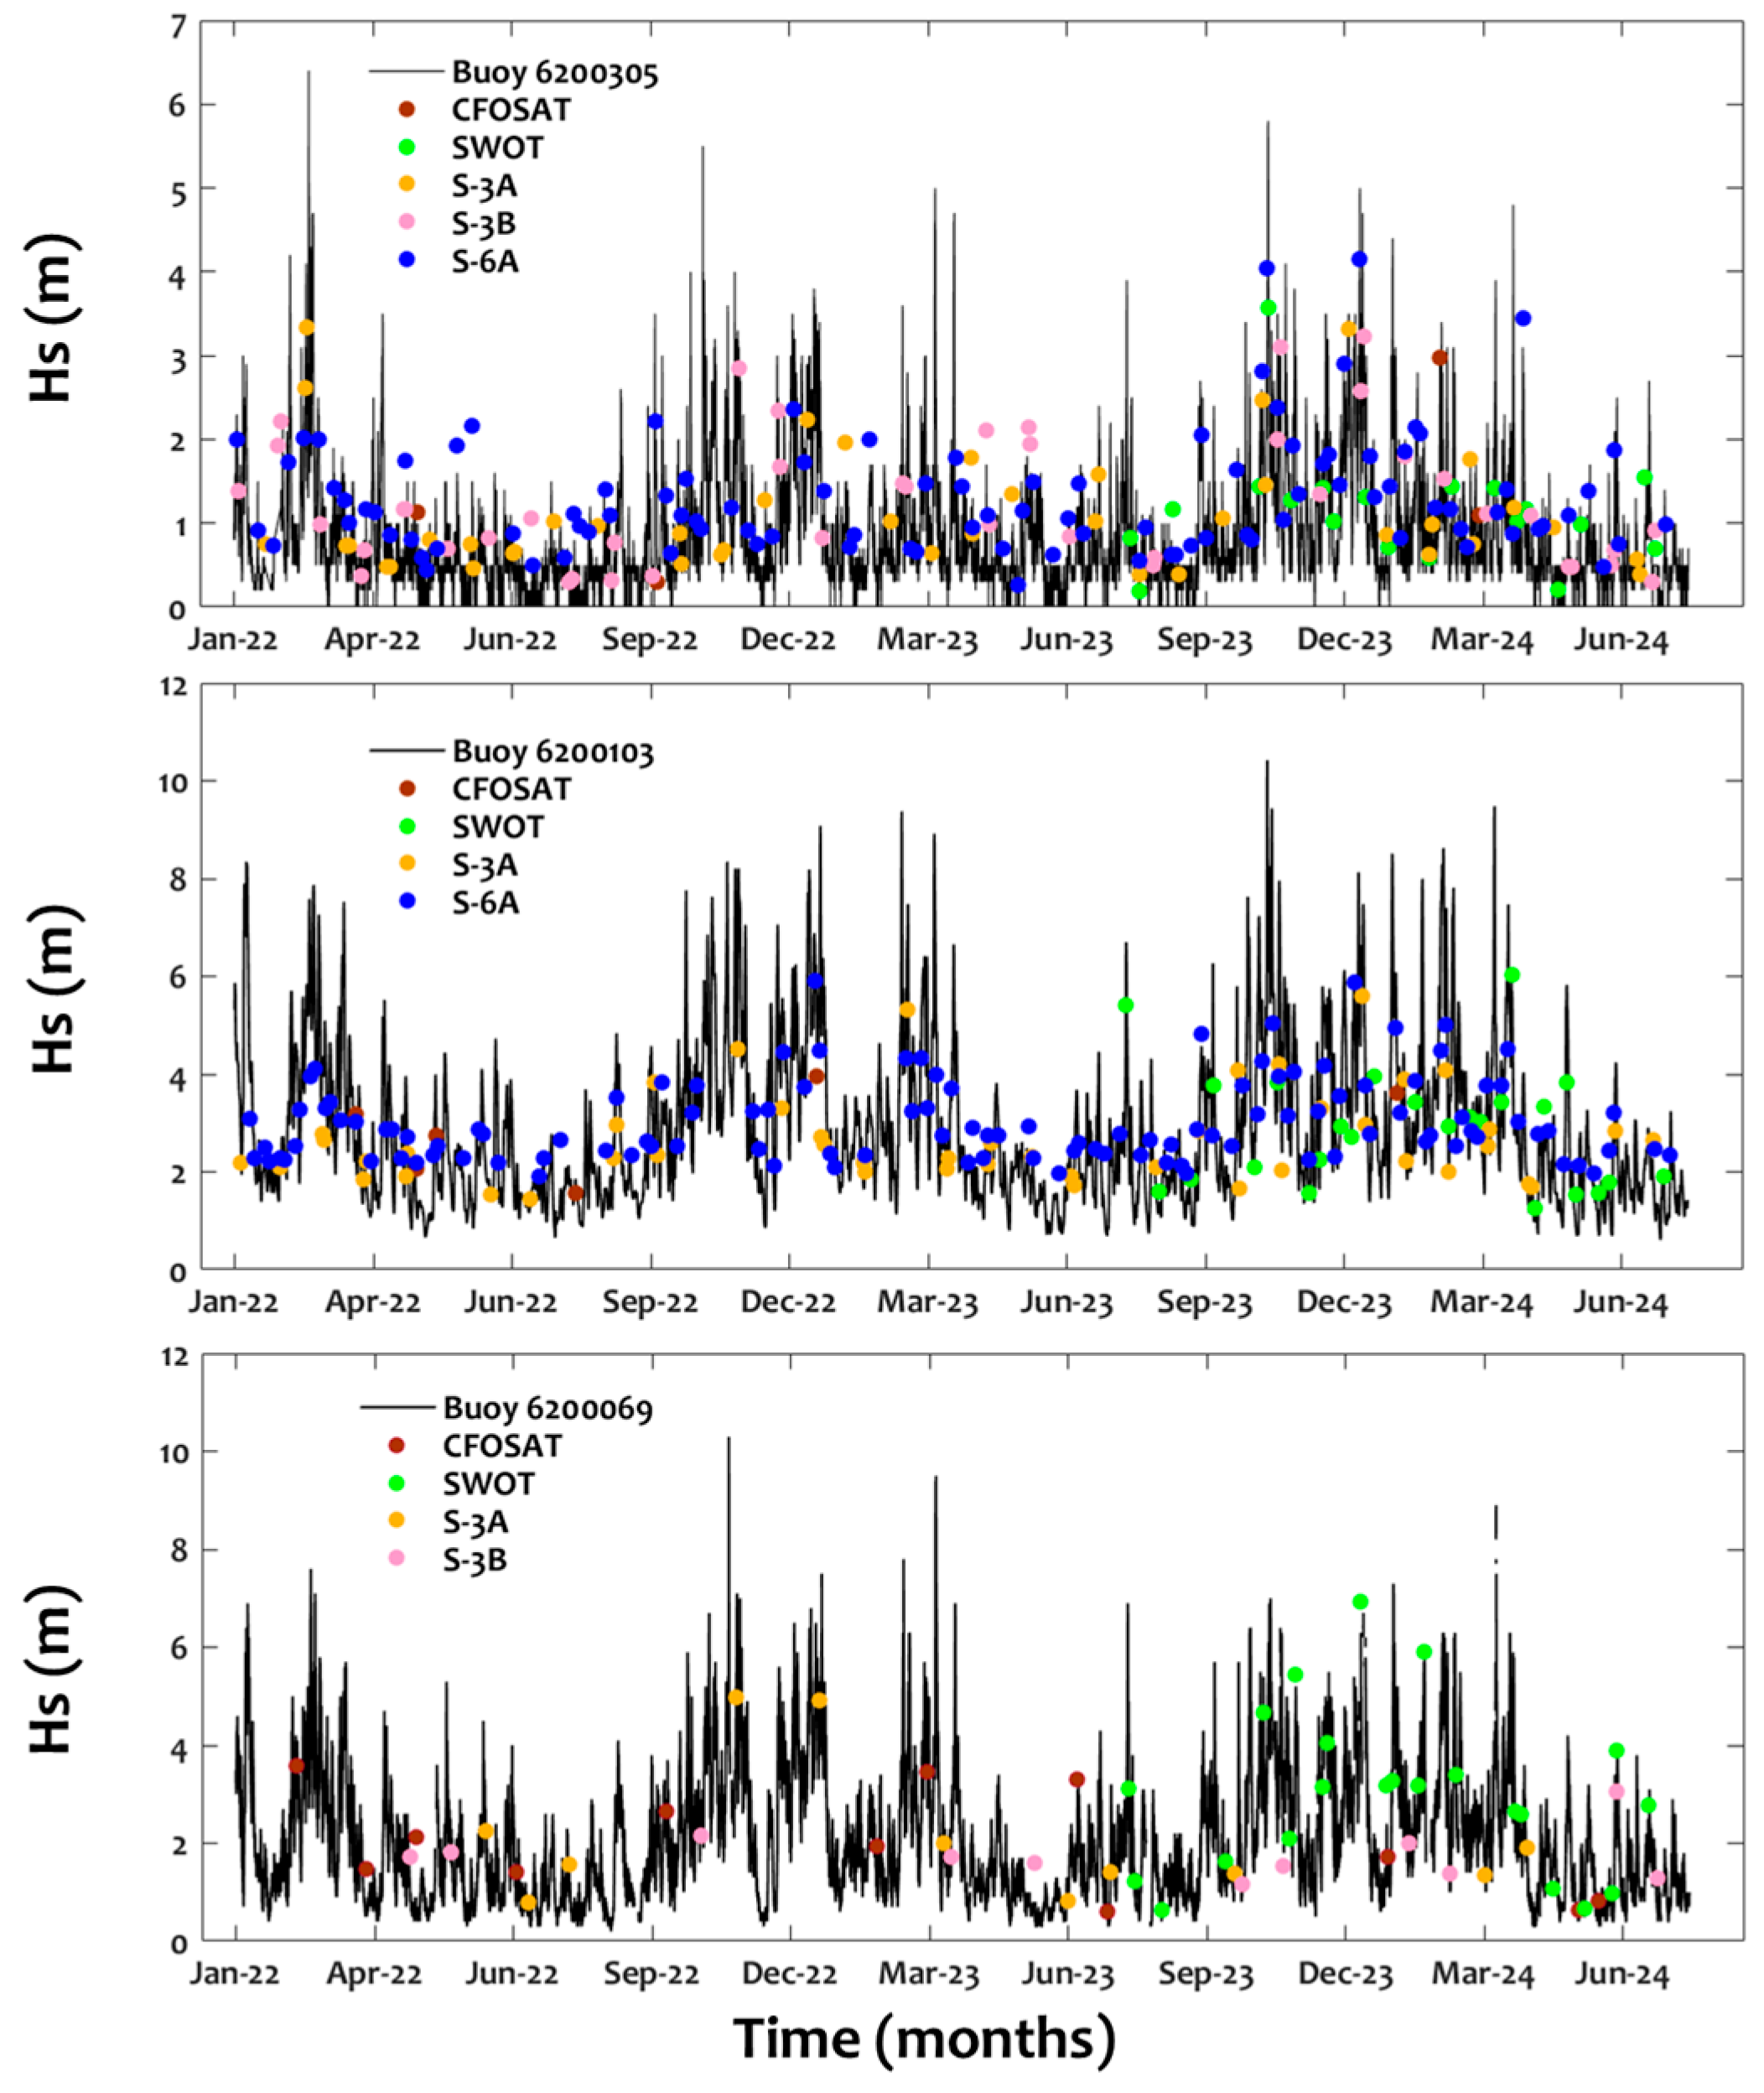
Figure 5.
Time-evolution of SWH during Jan 2022-July 2024 provided by Sentinel 3A-B (a), Sentinel 6 (b), CFOSAT (c), SWOT (d), multi-source satellite dataset (S3A-B, S6A, CFOSAT, SWOT) at different depths from deep to shallow water areas (e), SWOT combination with S3A-B and S6A (f).
Figure 5.
Time-evolution of SWH during Jan 2022-July 2024 provided by Sentinel 3A-B (a), Sentinel 6 (b), CFOSAT (c), SWOT (d), multi-source satellite dataset (S3A-B, S6A, CFOSAT, SWOT) at different depths from deep to shallow water areas (e), SWOT combination with S3A-B and S6A (f).
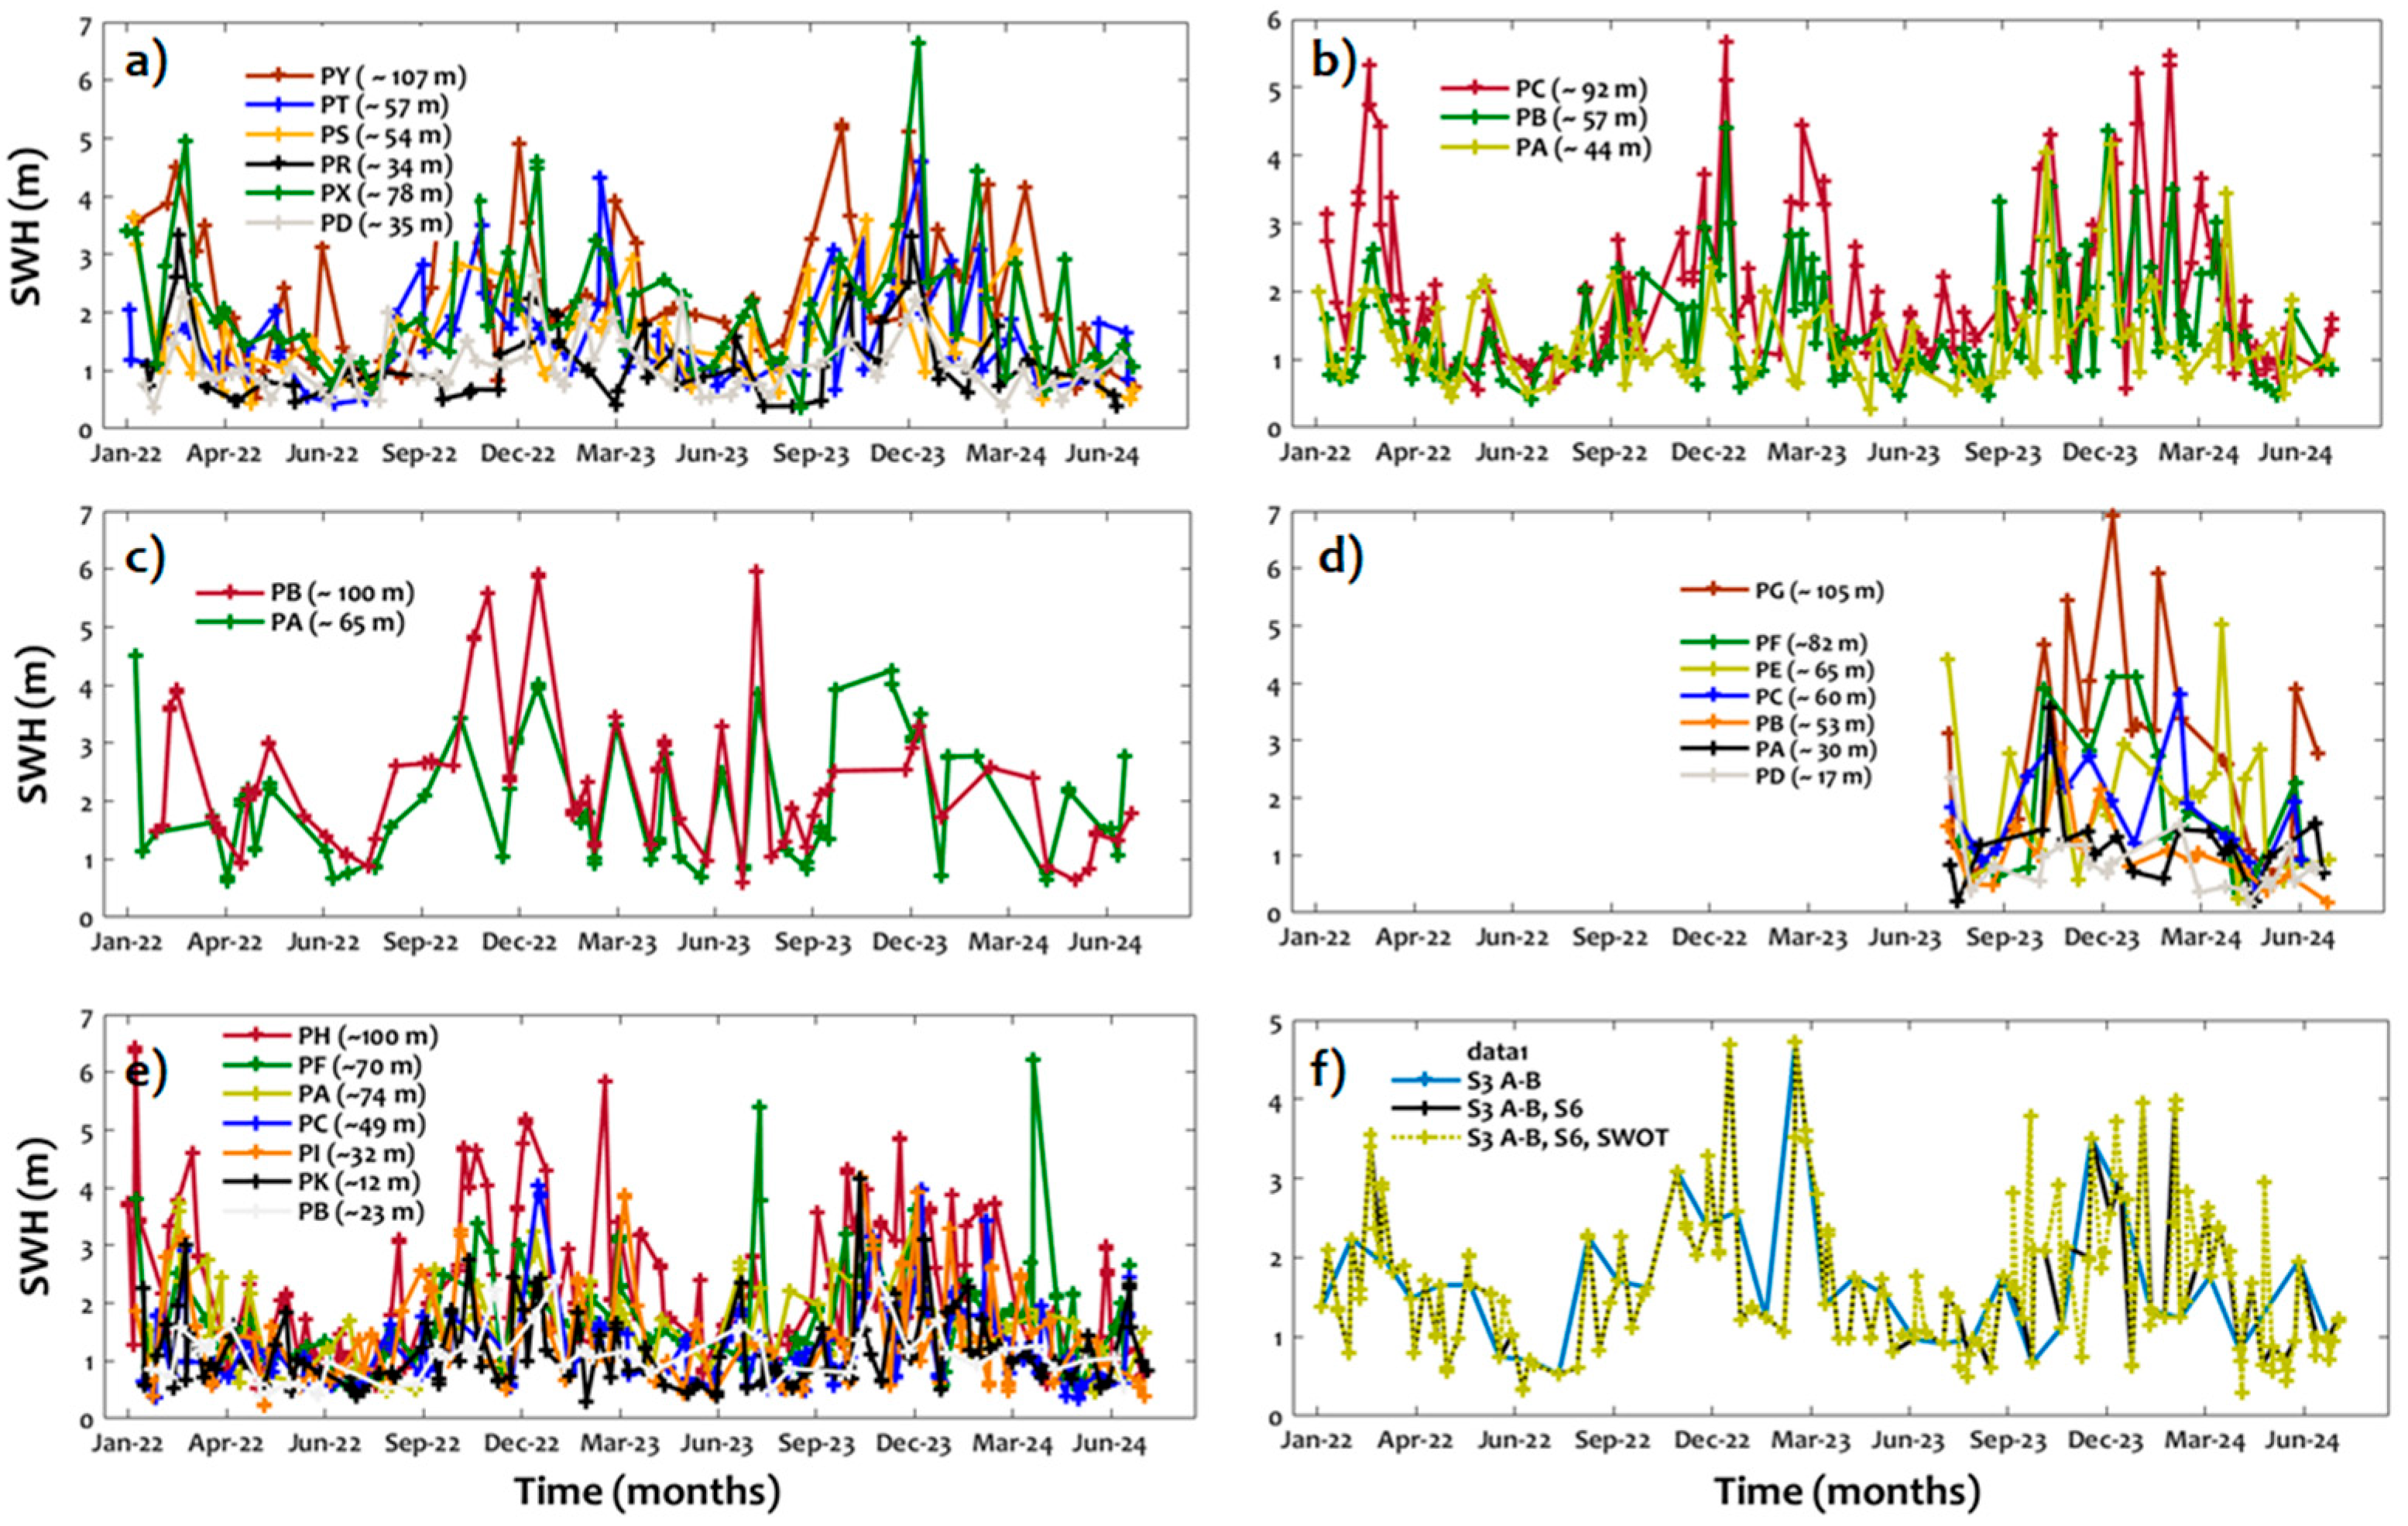
Figure 6.
CWT of SWH during the period Jan 2022-July 2024 provided by the multi-source satellite dataset (S 3A-B, S6A, CFOSAT and SWOT): Comparison between S3A-B, S6A and SWOT at deep (high Panel) and shallow (low panel) areas. The dashed-white rectangle limits the period of SWOT observations.
Figure 6.
CWT of SWH during the period Jan 2022-July 2024 provided by the multi-source satellite dataset (S 3A-B, S6A, CFOSAT and SWOT): Comparison between S3A-B, S6A and SWOT at deep (high Panel) and shallow (low panel) areas. The dashed-white rectangle limits the period of SWOT observations.
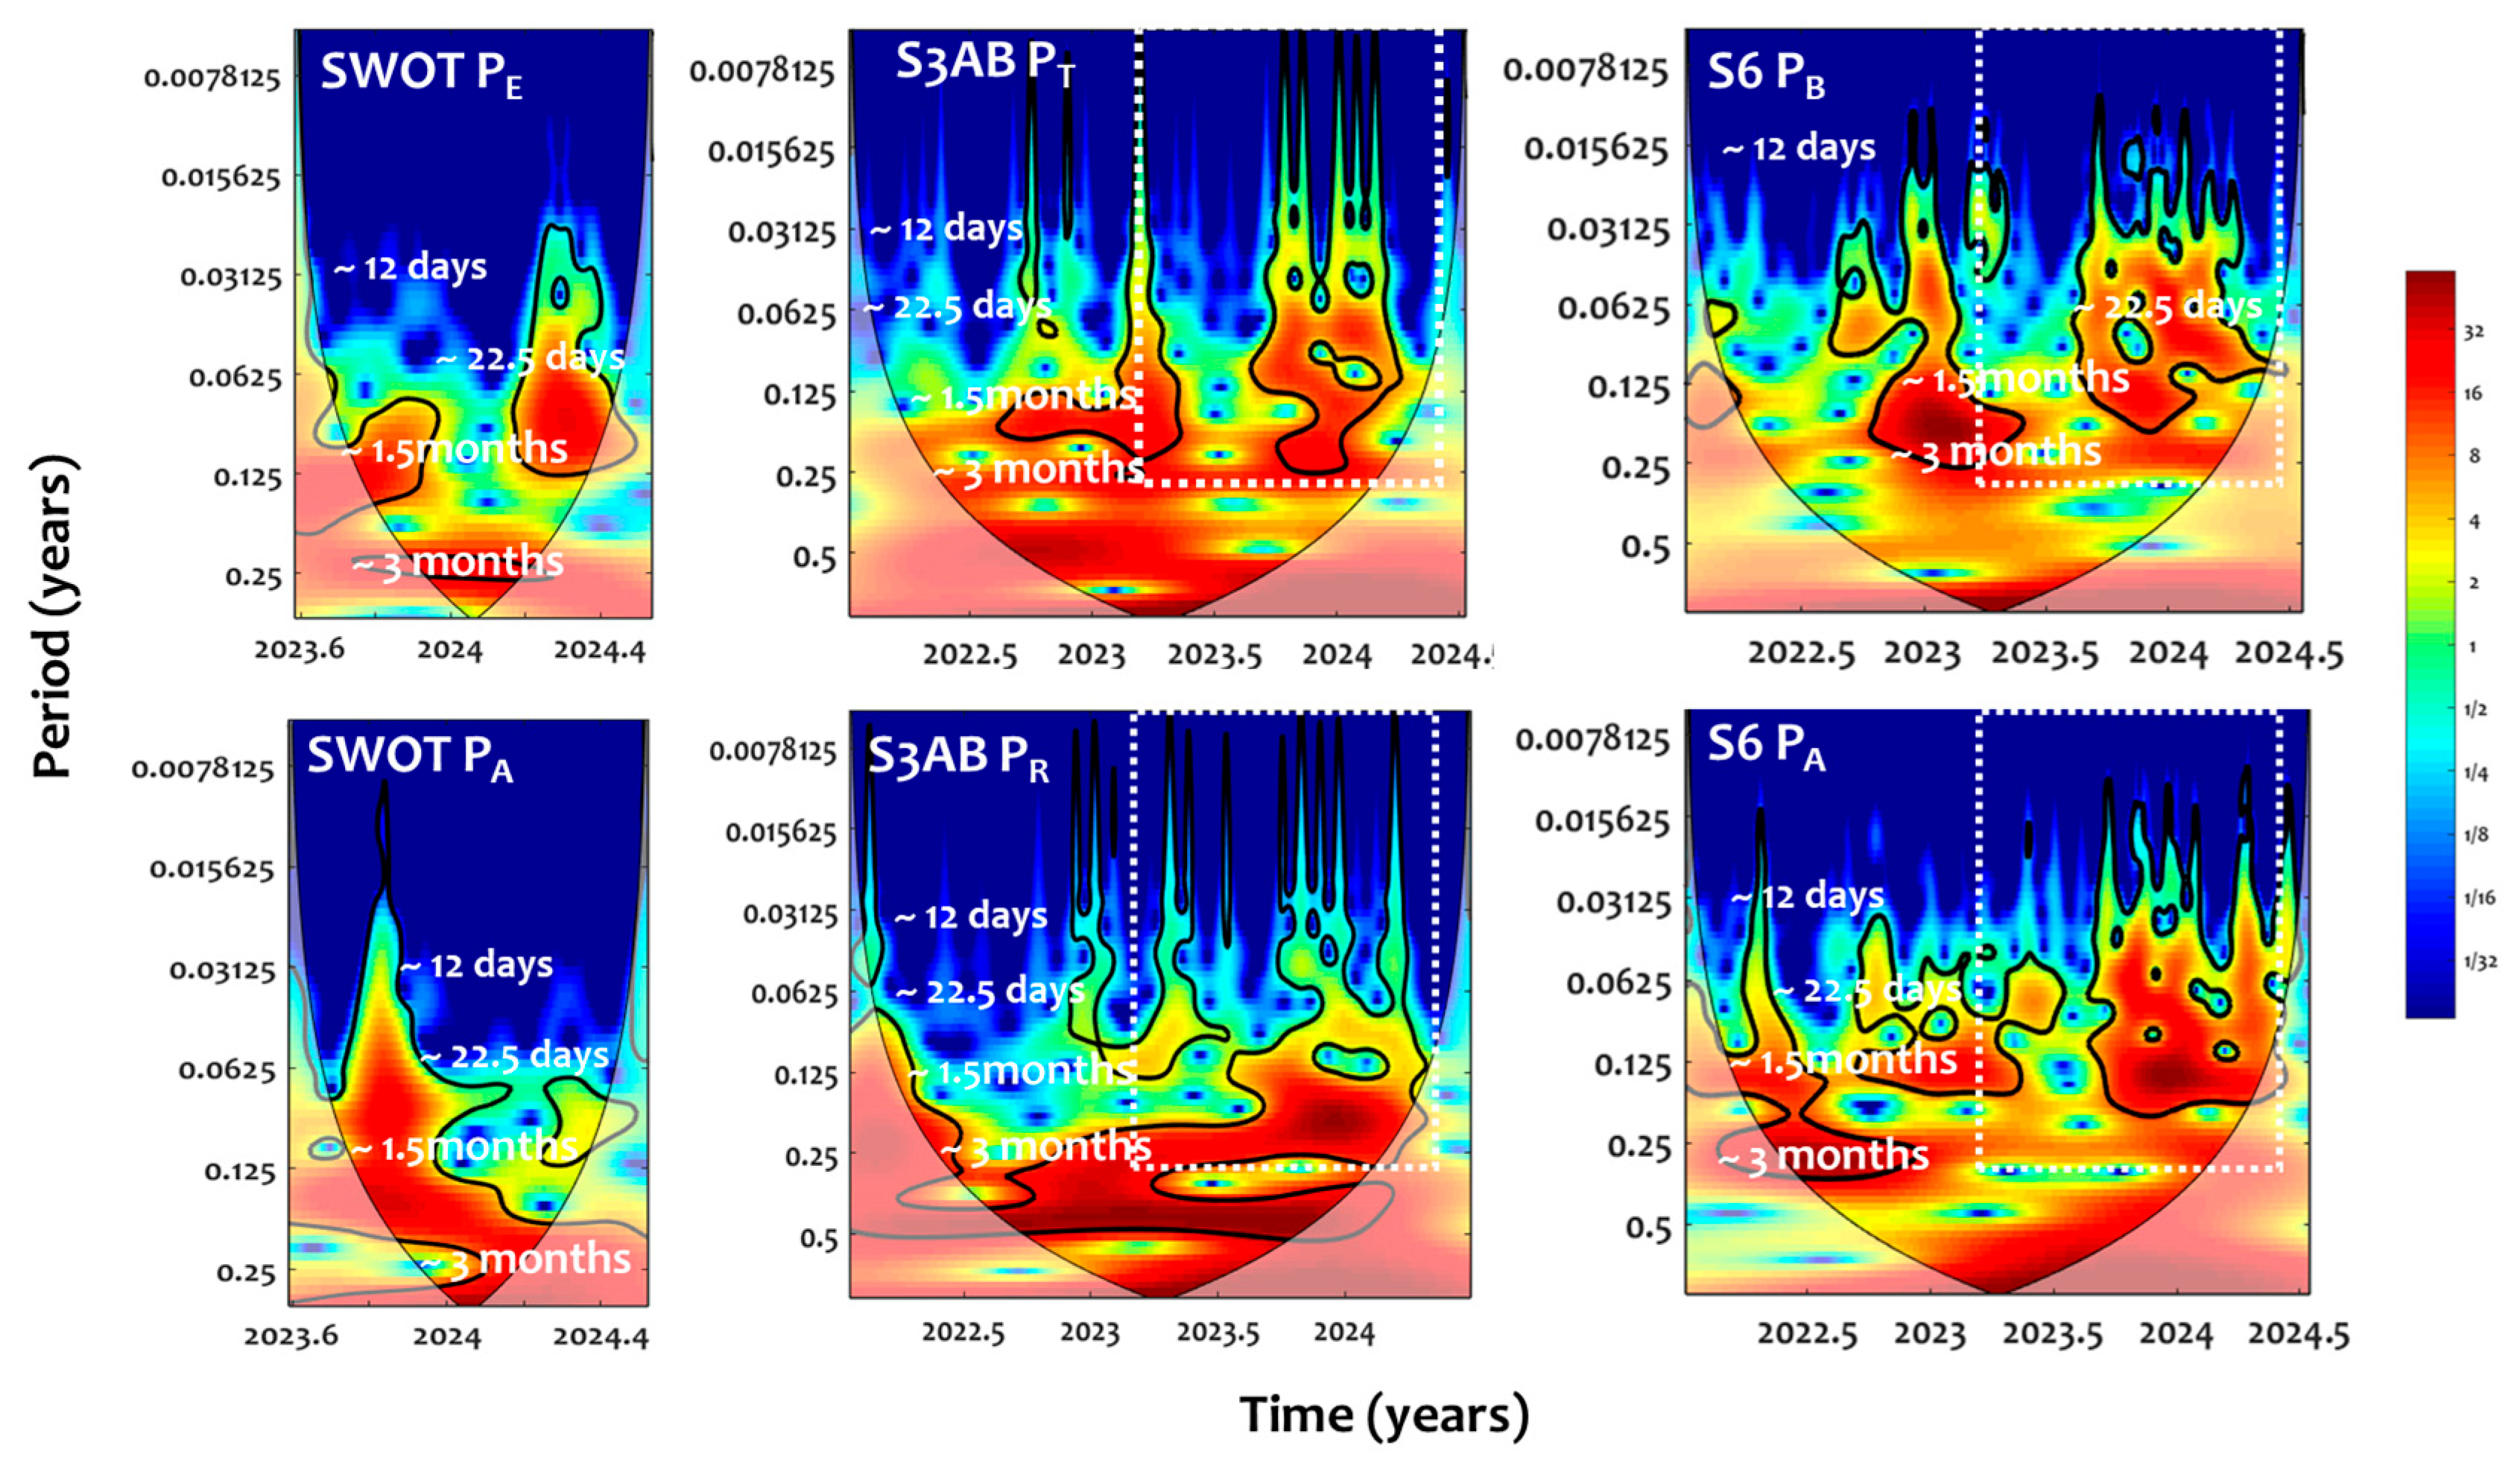
Figure 7.
CWT of SWH during the period Jan 2022-July 2024 provided by the multi-source satellite dataset (S 3A-B, S6A, CFOSAT and SWOT): combined altimetry dataset of S3A-B with CFOSAT (high panel) and S3A-B, S6A, CFOSAT with SWOT . The dashed-white rectangle limits the period of SWOT observations.
Figure 7.
CWT of SWH during the period Jan 2022-July 2024 provided by the multi-source satellite dataset (S 3A-B, S6A, CFOSAT and SWOT): combined altimetry dataset of S3A-B with CFOSAT (high panel) and S3A-B, S6A, CFOSAT with SWOT . The dashed-white rectangle limits the period of SWOT observations.
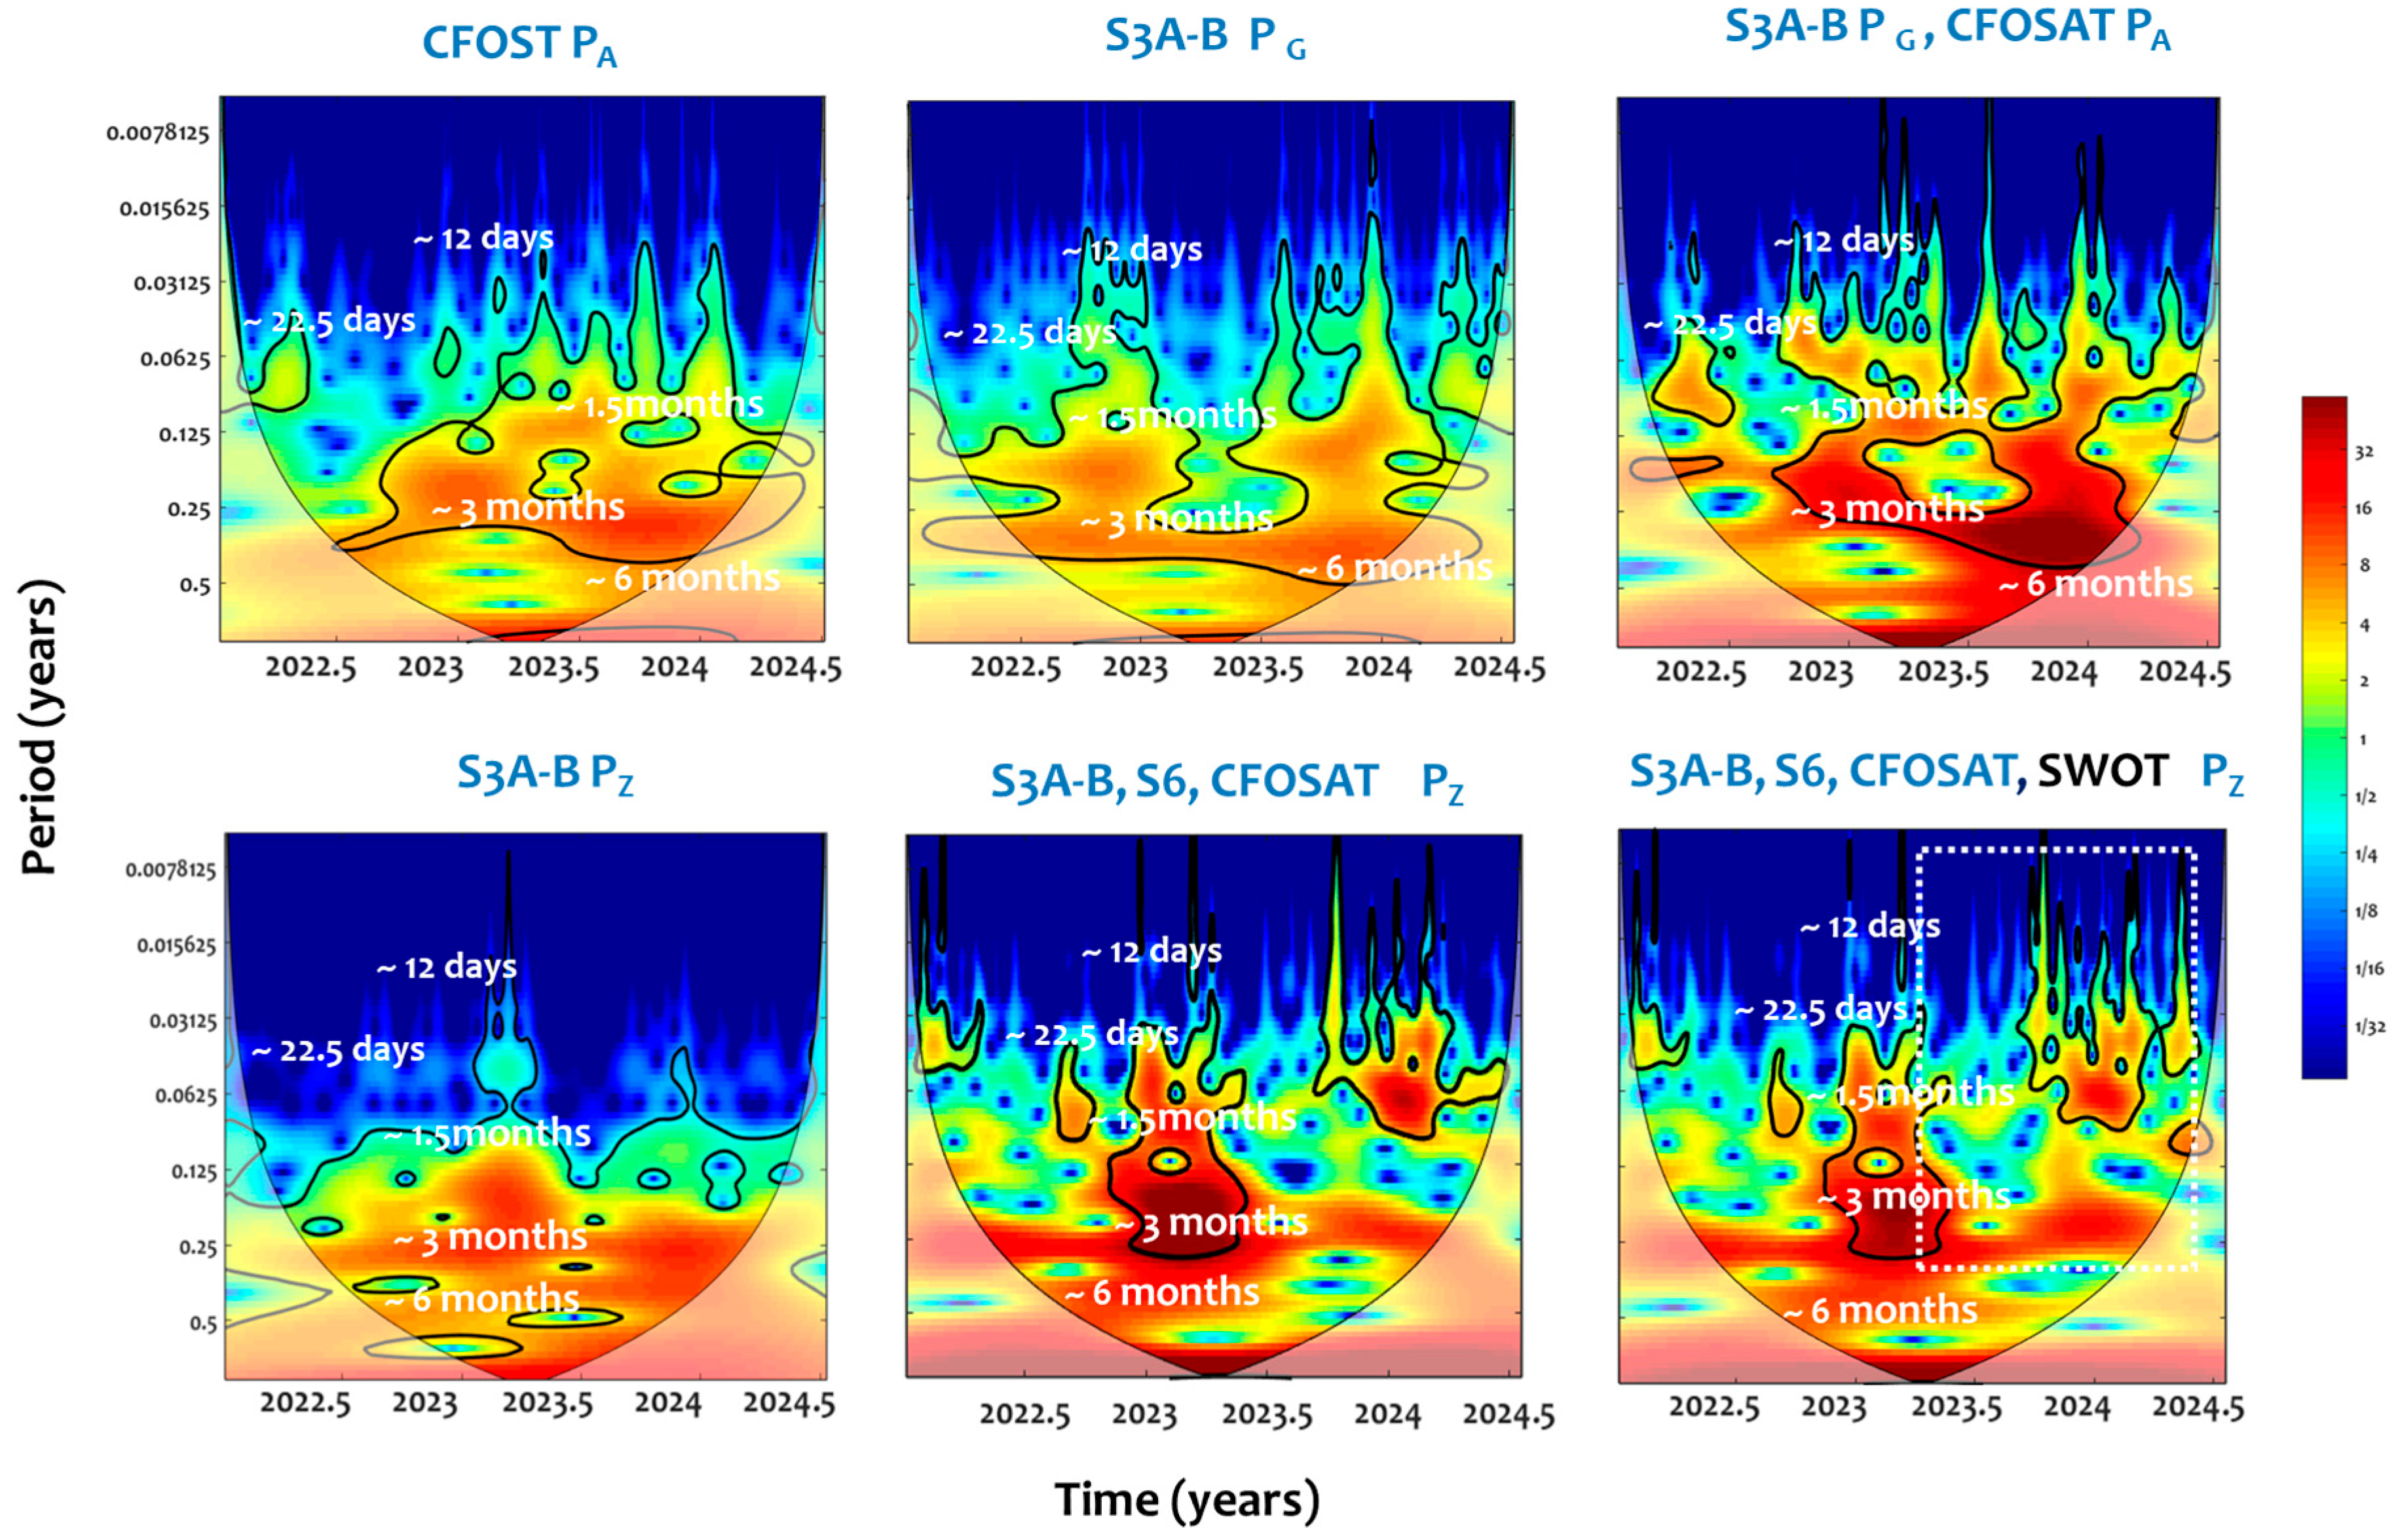
Figure 8.
CWT of SWH along the altimeter tracks during Ciaran storm: Sentinel 6A, Sentinel 3A, CFOSAT and SWOT.
Figure 8.
CWT of SWH along the altimeter tracks during Ciaran storm: Sentinel 6A, Sentinel 3A, CFOSAT and SWOT.
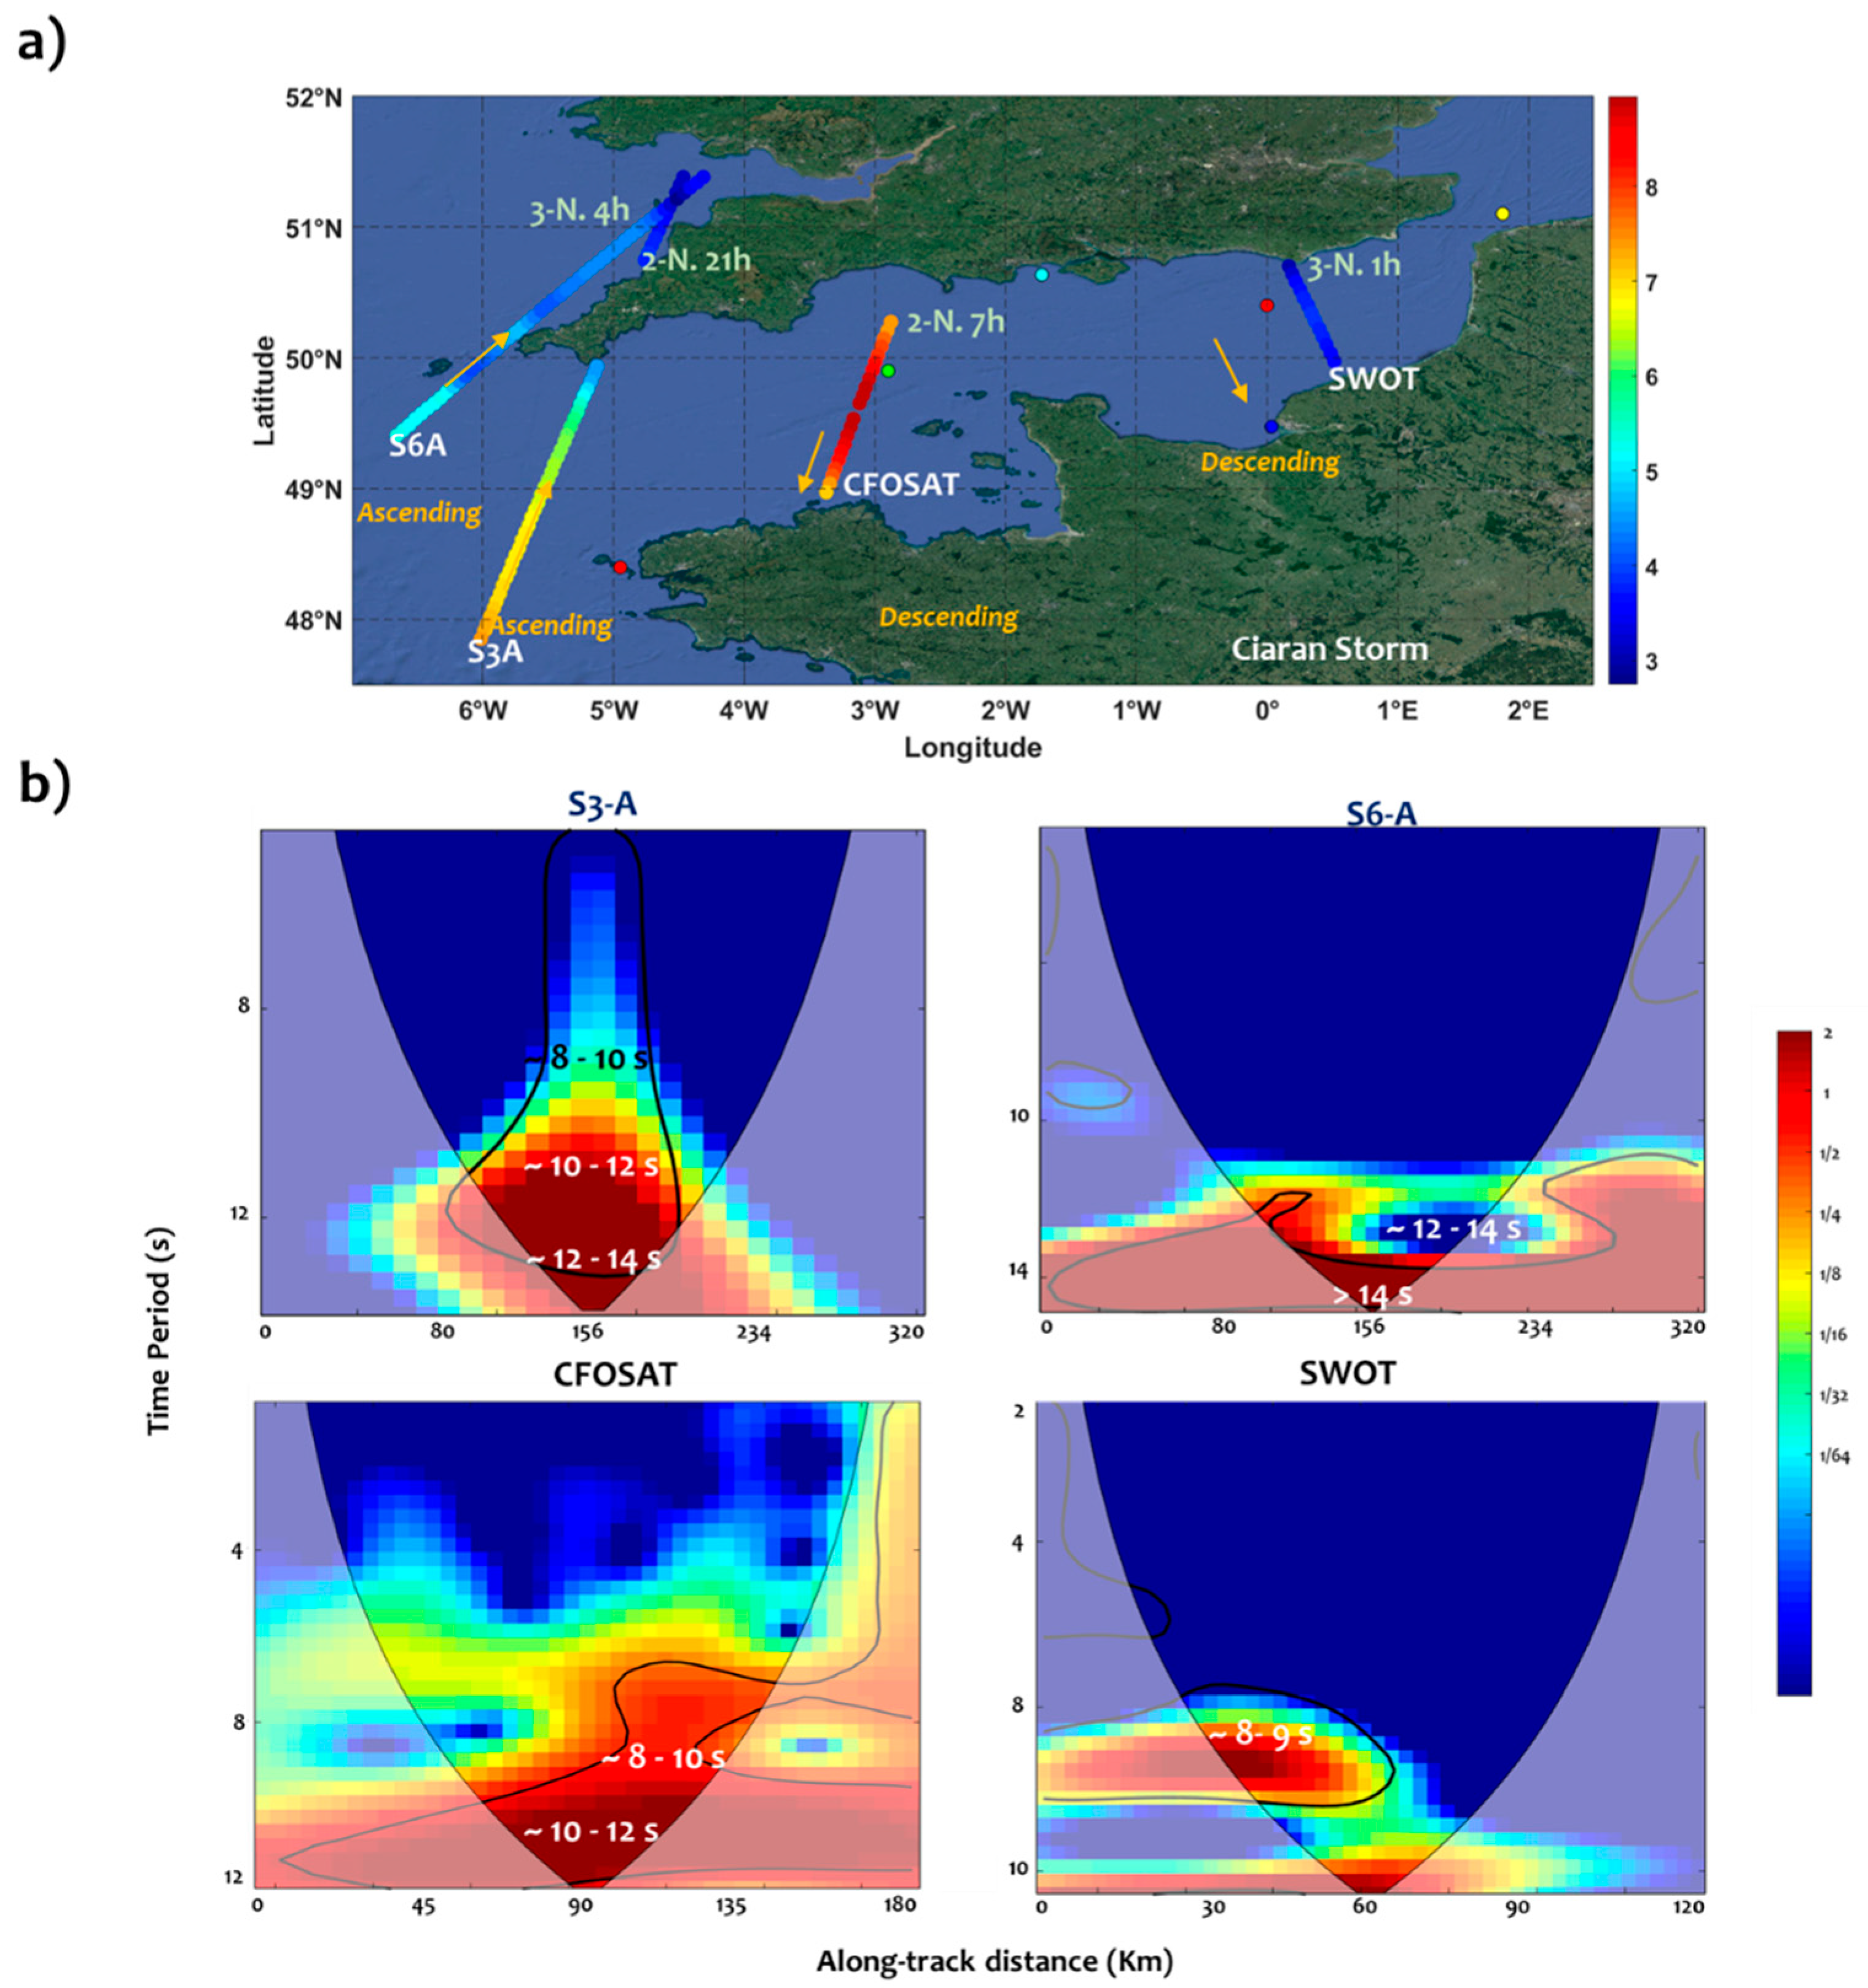
Figure 9.
Distribution of Tp during Ciaran storm using wave measurements from 6200103 (a) and 6200305 (b) buoys.
Figure 9.
Distribution of Tp during Ciaran storm using wave measurements from 6200103 (a) and 6200305 (b) buoys.
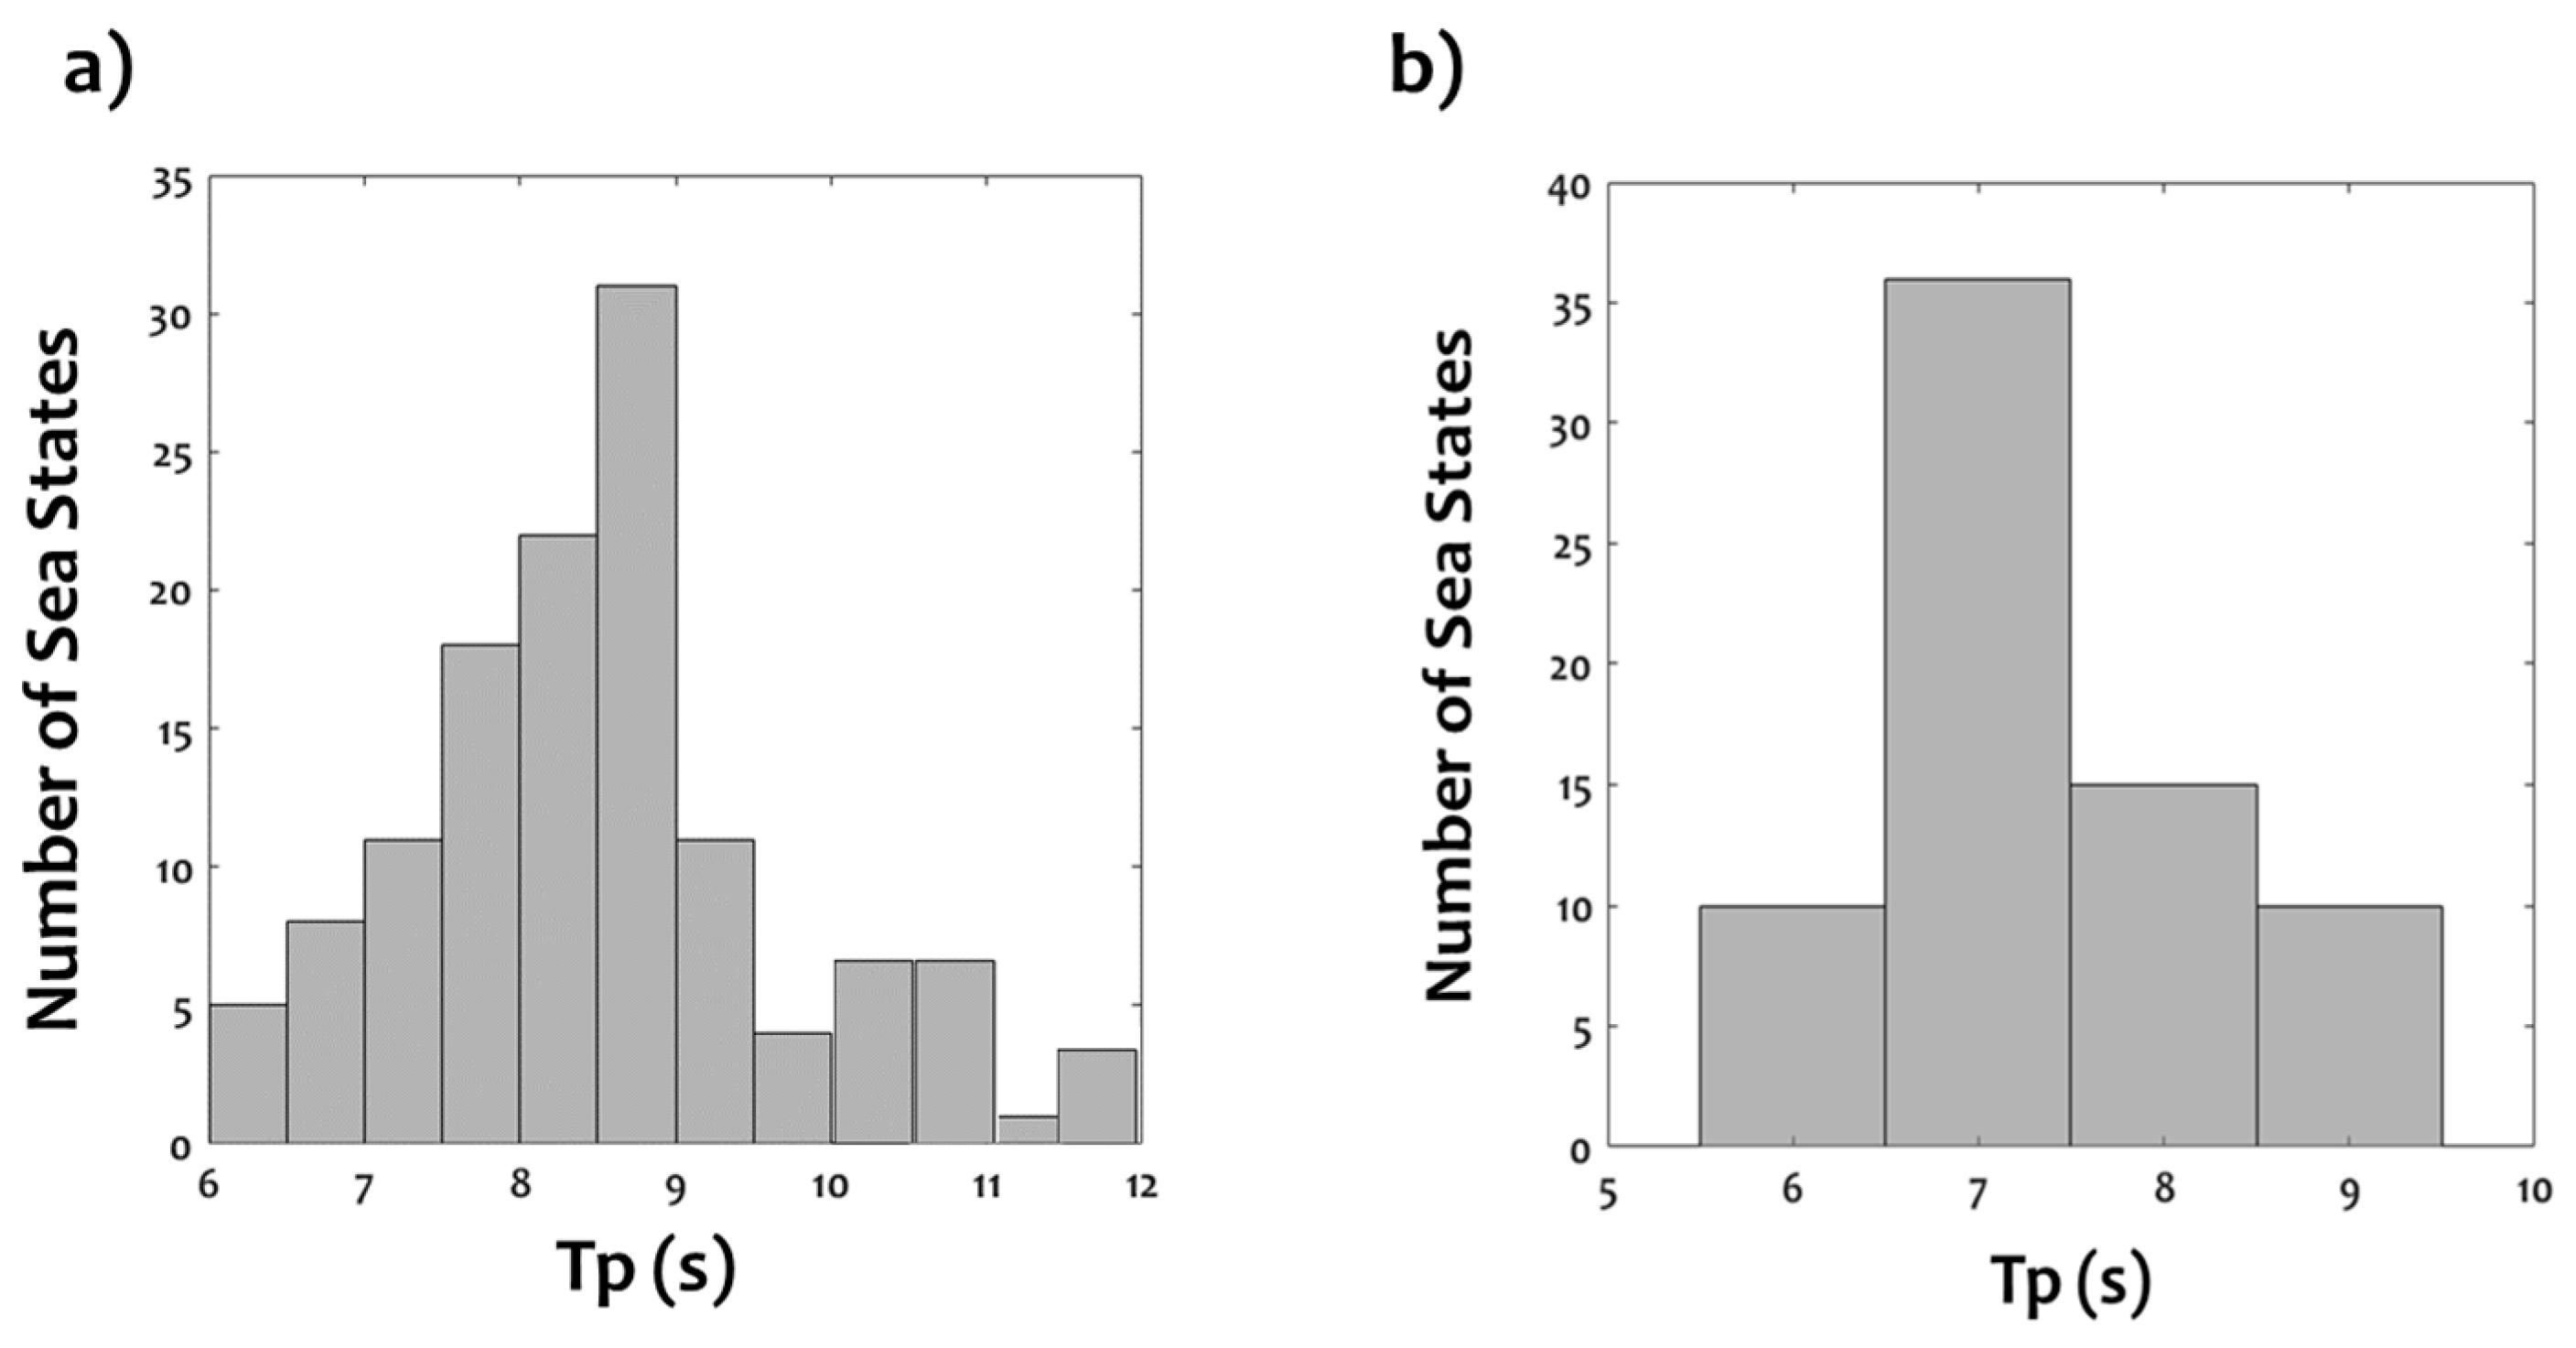

Table 1.
Selected storm events during both winters 2022/2023 and 2023/2024 and their physical characteristics within the Channel.
Table 1.
Selected storm events during both winters 2022/2023 and 2023/2024 and their physical characteristics within the Channel.
| STORM | Duration | Hs (max), Tm | E storm (m2/h) |
| Mathis 31/03 (4 am) – 01/04 (6 am) - 2023 |
|||
| 26 hours | 5 m, 9 s | 360.42 | |
|
Noah 12/04 (1 pm) – 13/04 (5 am) - 2023 |
16 hours |
4.7 m, 9 s | 249.44 |
|
Ciaran 01/11 (10 pm) – 03/11 (4 am) |
30 hours |
5,8 m, 11 s |
530.75 |
|
Karlotta 10/02 (10 am) – 11/02 (7 am) |
21 hours |
5,27 m, 8 s |
517.93 |
|
Pierrick 09/04 (10 am) – 09/04 (3 pm) |
13 hours | 4,8 m, 8 s | 173.1 |
Table 2.
General information of the conventional altimetry satellites, used in this work.
| Satellite Altimetry | Agency | Mission Duration | Altitude (km) | Inclination (°) | Repeat Cycle (days) |
| Saral | ISRO/CNES | 2023.02 | 800 | 98.55 | 35 |
| Cryosat-2 | ESA | 2010.04 | 717 | 92 | 30 |
| Jason-3 | NASA/CNES | 2016.01 | 1336 | 66 | 10 |
| Sentinel-3A/B | ESA | 2016.02/2018.04 | 814.5 | 98.65 | 27 |
| Sentinel-6A | ESA | 2020.11 | 1336 | 66 | 10 |
| Hai Yang-2B | CNSA | 2018.10 | 973 | 99.3 | 14 |
| CFOSAT | CNES/CNSA | 2018.10 | 500 | 97 | 13 |
| SWOT | NASA/CNES | 2022.12 | 890 | 77.6 | 21 |
Disclaimer/Publisher’s Note: The statements, opinions and data contained in all publications are solely those of the individual author(s) and contributor(s) and not of MDPI and/or the editor(s). MDPI and/or the editor(s) disclaim responsibility for any injury to people or property resulting from any ideas, methods, instructions or products referred to in the content. |
© 2025 by the authors. Licensee MDPI, Basel, Switzerland. This article is an open access article distributed under the terms and conditions of the Creative Commons Attribution (CC BY) license (http://creativecommons.org/licenses/by/4.0/).
Copyright: This open access article is published under a Creative Commons CC BY 4.0 license, which permit the free download, distribution, and reuse, provided that the author and preprint are cited in any reuse.


