
Submitted:
16 July 2025
Posted:
17 July 2025
You are already at the latest version
Abstract
Abstract
This study determined the water-use efficiency for post-weaning growth performance of different frame sizes beef cattle under intensive production system. A total of 33 beef cattle weaners of three different frame sizes (small, medium, and large) were randomly allocated individually to metabolic pens. Feed and water were provided ad libitum. The water intake (WI), feed intake (FI) and weight were measured across different feeding phases (starter, grower, and finisher). Water consumption (WC) average daily gain (ADG), weight gain (WG), water intake efficiency (WIE), water footprint per animal (WFP/AU) and WFP/kg were computed. The General Linear Model of Statical Analysis Software (SAS) was used to analyze the data, and means were separated using Fisher’s LSD test. Results showed that large frame size beef cattle had significantly (p< 0.05) higher initial and final weights, as well as higher FI (1025.21 kg) and WI (3394 L), compared to medium and small frame size beef cattle. Medium frame size beef cattle finished with higher ADG (1.48 kg/day) and WIE (20.15 L/kg gain), suggesting a more balanced efficiency between growth and water utilization. Small frame size beef cattle demonstrated higher water consumption efficiency (WCE) of 0.051 kg/L and lower water footprint per animal unit (WFP/AU) of 3822 L, indicating greater adaptability to water-limited conditions. These findings suggest that medium frame size beef cattle offer an optimal balance between productivity and resource efficiency.
Keywords:
sustainable production
; resource use
; environmental impact
1. Introduction
South Africa's beef cattle industry is a cornerstone of the agricultural sector, contributing significantly to rural livelihoods and the national economy [1]. However, the industry's sustainability faces challenges from climate variability and increasing competition for water resources [2]. While intensive production systems have the potential to enhance productivity, they also require efficient resource management to mitigate environmental impacts. Post-weaning growth performance is a critical phase in beef production, influencing overall productivity, economic returns, and resource utilization [3]. Understanding WUE during this phase is vital for adopting sustainable practices that support both economic viability and environmental conservation.
Water is an indispensable resource for livestock production, directly influencing animal health, growth, and overall productivity [4]. In intensive beef production systems, improving water-use efficiency (WUE) is a key factor in achieving sustainability, particularly in water-scarce regions like South Africa [5]. Water availability is a major constraint to agricultural productivity, further exacerbated by climate change, which increases the frequency and severity of droughts [6,7]. Consequently, developing reliable WUE indicators for post-weaning beef cattle is essential for ensuring optimal water utilization while maintaining growth performance.
Beef cattle production demands substantial water resources for drinking, feed production, and metabolic functions [8]. Research has shown that variations in water intake and utilization efficiency exist among different beef cattle frame sizes and production environments [9,10,11,12,13], necessitating a deeper evaluation of WUE at various growth stages [14,15]. Water-use efficiency indic0ators, such as water intake efficiency (WIE) and water-to-feed ratio (WFR), provide valuable insights into how animals utilize water to support growth and metabolic functions [16]. These indicators not only inform breeding and management strategies for enhancing productivity but also contribute to broader sustainability goals by minimizing water wastage and improving the resilience of livestock systems to environmental stressors [17]. Despite the significance of WUE in intensive production systems, limited research has explored its relationship with post-weaning growth traits in South African beef cattle. Given the unique environmental conditions, breed diversity, and management practices in the region, localized studies are essential to fill these knowledge gaps and develop targeted solutions.
Water scarcity and sustainable resource management are among the most pressing global challenges of the 21st century, particularly in agriculture [18,19]. The livestock industry plays a vital role in food security while simultaneously being a significant consumer of natural resources. Balancing productivity with environmental management is essential for aligning with the United Nations' Sustainable Development Goals (SDGs). Improving water-use efficiency in beef production contributes to enhanced food security (SDG 2) and sustainable livestock systems by ensuring optimal resource utilization [20]. The UN [21] argued that efficient water management practices that reduce wastage and promote responsible water use in livestock production will ensure the achievement of SGD 6 that aims for the availability of clean water for all. This study supports sustainable livestock farming by optimizing resource use and minimizing environmental impact, thereby addressing SDG 12 that supports responsible consumption and production and SDG 13 that aims to mitigate climate change by reducing water stress in drought-prone areas [22,23].
The aim of this study, therefore, is to determine the water-use efficiency for post-weaning growth performance of different frame sizes beef cattle under intensive production system. To achieve this aim, the study quantified individual water intake and utilization efficiency of post-weaning beef cattle, determine the relationship between water-use efficiency and key growth performance indicators and identify frame size specific differences in water-use efficiency among South African beef cattle. By addressing water-use efficiency in post-weaning beef cattle, this study contributes to the sustainability and resilience of South Africa’s livestock sector, ensuring long-term viability in the face of climatic and environmental challenges.
2. Materials and Methods
2.1. Experimental Design and Animal Feeds
The study was conducted at the animal nutrition section of the Agricultural Research Council – Production Institute (ARC-PI) in Pretoria, Gauteng, South Africa (25º 53' 59.6" S and 28º 12' 51.6" E). The area is characterized by an ambient temperature range of 18 to 29 ºC during summer and between 5 and 20 ºC during winter. Thirty-three [33] beef cattle weaners of three different body frame sizes (small, medium and large), representing three different breeds (Nguni, Bonsmara and Simmental, respectively) of similar age and body weight groups were obtained from stud cattle breeders. On arrival at the farm, animals were tagged and vaccinated following standard procedure. The animals were randomly assigned to treatments in a Completely Randomized Design, i.e. eleven [11] animals per body frame size and each animal is a replicate unit. Animals were allowed 28 days adaptation period, followed by data collection for a period 90 days. Commercial feedlot diets were used for the study (Table 1). Feed and water were provided ad libitum.
2.2. Performance Measurements
At the beginning and end of the trial, then at two-week intervals during the trial, animals were weighed using a platform electronic cattle-weighing scale (Rudweigh platform cattle scale, RW1500 series). Feed intake was recorded weekly by weighing feed offered to and refused by animals. Growth performance measurements (WG, ADG and FCR) were determined using the following equations:
where Wti – initial weight at the beginning of the experimental period and each feeding period.
Wtf – final weight at the end of each feeding period.
Fin – feed weighed in at the beginning of the week.
Fout – feed weighed out of feeders at the end of the week.
2.3. Water Efficiency Measures
Water intake (WI) of individual animals was measured daily at 08H00 in the morning before feeding. Water consumption was calculated by adding water intake and water in the feed. The moisture content of the feed was determined by the A.O.A.C method [24]. Water intake efficiency (WIE) was calculated as the ratio of WI to the weight gain (WG) of the animal. Water consumption efficiency (WCE) was calculated as the ratio of live weight gain of the animal to the total volume of water consumed (kg weight gained per litres of water consumed) [25,26]. The water footprint of a live animal consists of different components: the indirect water footprint of the feed and the direct water footprint of both drinking and service water [27] were computed. The following water use efficiency were computed:
where WFPblue – is the blue water footprint.
Wserv. – service water used for cleaning.
2.4. Statistical Analysis
The water use efficiency data were analysed using repeated measures techniques of SAS 9.4 [28] in PROC MIXED considering the covariance structure of the observed data. The following statistical model was used:
where = measurement of response (WI, WC, WIE, WCE, WFR, WFP/AU and WFP/kg when the time was included as a classification variable) on the jth herd of the ith frame size treatment (small, medium and large) at the kth time (feeding phase), μ = overall mean, Ti = fixed effect of beef cattle frame size (small, medium and large), Wk = fixed effect of the kth time on measurements (k = 1, 2, 3), (TW)ik = interaction between ith frame sizes and kth time, = random effect associated with the jth house on the ith breed group, = random error associated with the kth animal in the ith frame size at the jth time. The mean separation was conducted using the Fisher’s LSD test (p<0.05). Pearson moment correlation coefficient (r) was computed to determine the relationship between water footprint indicators with growth performance traits as follows:
The significance of correlation was tested using the t-test for Pearson’s correlation:
where n is the sample size. A p-value < 0.05 was considered statistically significant.
3. Results
3.1. Growth Performance, Feed and Water Intake
Table 2 presents the means and least significant differences (LSDs) of growth performance of beef cattle under intensive production system. The initial weight was significantly (p<0.05) lower in small frame size beef cattle (159.77 kg) compared to medium (228.41 kg) and large frame size beef cattle (265.14 kg). Large frame size beef cattle reached significantly (p<0.05) higher final weight (412.73 kg), followed by medium (383.46 kg) and small (292.14 kg) frame size beef cattle. Large and medium frame size beef cattle consumed significantly (p<0.05) more feed (1021.59 kg and 1025.21 kg, respectively) for the entire feeding period compared to small frame size beef cattle (813.68 kg). However, there were no significant (p>0.05) differences in feed consumed between large and medium frame size beef cattle. Large frame size beef cattle had significantly (p<0.05) higher WI (3394.09 L) and WC (3471.88 L), followed by medium (WI: 3095.64 L and WC: 3174.07 L) and small frame size beef cattle (WI: 2510.64 L and WC: 2572.88 L). There were no significant (p>0.05) differences across all beef cattle frame sizes for WG.
Medium frame size beef cattle had a higher ADG (1.48 kg/day), significantly (p<0.05) outperforming small frame (1.26 kg/day) and not significantly (p > 0.05) different from the large frame size beef cattle (1.41 kg/day). Feed conversion ratio (FCR) and WFR did not differ significantly (p>0.05) among beef cattle frame sizes. Large frame size beef cattle exhibited significantly (p<0.05) higher WIE (23.15 L/kg) compared to small (19.37 L/kg) and medium (20.15 L/kg) frame size beef cattle. Small and medium frame size beef cattle showed significantly (p<0.05) higher WCE (0.051 kg/L and 0.049 kg/L, respectively) compared to large frame size beef cattle (0.042 kg/L). No significant (p>0.05) differences were observed in WFP/kg. Large frame size beef cattle had significantly (p<0.05) higher WFP/AU (4407 L) than medium (4185 L) and small (3822 L) frame size beef cattle.
Figure 1 presents growth performance traits of three beef cattle frame sizes across feeding phases. Large frame size beef cattle consistently showed significantly (p<0.05) higher weights at each feeding phase (starter: 313.32 kg, grower: 370 kg and finisher: 412.73 kg), followed by medium (starter: 283.59 kg, grower: 337.73 kg and finisher: 383.45 kg) and small frame size beef cattle (starter: 251.09 kg, grower: 292.14 kg and finisher: 283.59 kg). Weight gain (WG) was higher during the starter and grower phases for all frame sizes and the finisher period showed lower WG. Medium frame size beef cattle showed higher ADG across all phases. The ADG for the small frame size beef cattle was significantly (p<0.05) lower during the grower feeding phase (1.003 kg). Feed intake increased during the grower period and declined during the finisher feeding phase across all frame sizes. Medium and large frame size beef cattle had higher FI (starter: 311.86 kg, grower: 358.32 kg and finisher: 355.03 kg) and (starter: 321.92 kg, grower: 358.95 kg and finisher: 340.72 kg) respectively, compared to the small frame size beef cattle (starter: 234.39 kg, grower: 293.29 kg and finisher: 285.70 kg). Both WI and WC were higher during the grower feeding phase for all beef cattle frame sizes. Large frame size beef cattle consumed significantly (p<0.05) more water than small and medium frames across all periods.
The large frame size beef cattle had a significantly (p<0.05) lower WIE during the starter feeding phase (22.73 L/kg) compared to the medium (16.56 L/kg) and small frame size beef cattle (16.99 L/kg). Small and medium frame size beef cattle had significantly (p<0.05) higher WCE during the starter (0.061 kg/L and 0.062 kg/L, respectively) and finisher (0.051 kg/L and 0.040 kg/L, respectively) feeding phases compared the large frame size beef cattle (0.045 kg/L and 0.040 kg/L for starter and finisher phases respectively). During the grower feeding phase, WCE was not significant (p>0.05) among the beef cattle frame sizes. Large frame size beef cattle had significantly (p<0.05) higher WFP/AU across all feeding phases. During the finisher phase, the large frame size beef cattle had higher WFP/AU (4602 L), followed by the medium (4295 L) and the small frame size beef cattle (3712 L). The WFP/kg increased significantly over the feeding phases. During the starter feeding phase the WFP/kg for the small (25.36 L/kg) and medium (23.58 L/kg) frame size beef cattle were similar (p>0.05) but both were significantly lower (p<0.05) than the large frame size beef cattle (31.27 L/kg). During the grower feeding phase, WFP/kg was not significantly different (p>0.05) across all beef cattle frame sizes ranging from 55.60 L/kg for the medium, 58.60 L/kg for the large and 63.03 L/kg for the small frame size beef cattle. The large frame size beef cattle had significantly (p<0.05) high WFP/kg (108.77 L/kg) during the finisher feeding phase compared to the medium and small beef cattle frame sizes. The medium (95.47 L/kg) and small (93.99 L/kg) beef cattle frame sizes were significantly similar (p>0.05).
Figure 2.
Efficiency measures of beef cattle over time (FCR: feed conversion ratio, WFR: water-to-feed ratio, WIE: water intake efficiency (L/kg gain), WCE: water consumption efficiency (kg gain)/L, WFP/kg: water footprint per kg gain (L/kg gain), WFP/AU: water footprint per animal unit (L)).
Figure 2.
Efficiency measures of beef cattle over time (FCR: feed conversion ratio, WFR: water-to-feed ratio, WIE: water intake efficiency (L/kg gain), WCE: water consumption efficiency (kg gain)/L, WFP/kg: water footprint per kg gain (L/kg gain), WFP/AU: water footprint per animal unit (L)).
3.2. Correlations
The Pearson correlation analysis revealed significant interrelationships between water-use indicators and performance traits of the combined beef cattle frame sizes during the post-weaning growth phase under intensive production (Figure 3). Water consumption efficiency (WCE) exhibited a moderate positive correlation with ADG (r=0.499; p<0.05) and WG (r=0.499; p<0.05), indicating that animals with superior growth performance utilized water more efficiently. In contrast, WCE was significantly (p<0.05) and negatively correlated with WIE (r=-0.987), FCR (r=-0.886), and WFP/kg (r=-0.828), implying that improved efficiency reduces overall water demand and environmental impact per unit of meat produced. Water intake efficiency (WIE) and FCR were positively and strongly correlated (r=0.890; p<0.05), and both variables correlated with WFP/kg (r=0.847 and 0.844, respectively). Both WIE and FCR were negatively correlated with ADG (r=-0.520) and WG (r=-0.594), emphasizing that fast-growing cattle tend to be more resource efficient. Water footprint per kilogram (WFP/kg) was significantly and negatively correlated with ADG (r=-0.835; p<0.05) and WG (r=-0.835; p<0.05), confirming that animals that gain weight more rapidly reduce the amount of water needed per kilogram of beef produced. Interestingly, WFP/AU correlated positively with WI (r=0.923), WC (r=0.923), and final body weight (r=0.869), all statistically significant (p<0.05). Feed intake (FI) correlated strongly with WI (r=0.884, p<0.05), WC (r=0.889, p<0.05), and final Wt. (r=0.931, p<0.05), but showed only weak correlations with FCR (r=0.275, p>0.05) and WIE (r=0.276, p>0.05). The WFR showed a moderate positive correlation with WIE (r=0.517, p<0.05) and WI (r=0.514, p<0.05), while negatively correlated with WCE (r=-0.507, p<0.05).
The Pearson correlation analysis revealed several significant correlations between water and performance parameters for small frame size beef cattle under intensive production systems (Figure 4). A strong and positive correlation was observed between WI and WC (r=1.000; p<0.05). Similarly, WI showed strong positive correlations with WFP/AU (r=0.911; p<0.05) and FI (r=0.634; p<0.05). Water consumption efficiency (WCE) was strongly and positively correlated with WG (r=0.890; p<0.05) and ADG (r=0.890; p<0.05). Conversely, strong negative correlations were found between feed conversion ratio (FCR) and both WG and ADG (r=-0.931; p<0.05), indicating that as feed efficiency improves (i.e., lower FCR), weight gains increase. In contrast, FCR was positively correlated with water footprint (WFP; r=0.935) and WIE (r=0.930; p<0.05). Both WFP and WIE were strongly and negatively associated with WCE (r = -0.986 and -0.984, respectively; p<0.05), affirming that higher water input per unit of gain leads to diminished water-use efficiency. Moreover, WFP and WIE exhibited strong positive correlations with FCR, reinforcing the interdependence between feed and water conversion metrices. Final Wt. was positively correlated with total WI (r=0.776; p<0.05). Furthermore, final Wt. was positively correlated with FI (r=0.788; p<0.05). Finally, WFP/AU was positively correlated with WI (r=0.911) and WC (r=0.910; p<0.05). Notably, WFP/AU did not correlate significantly with WCE.
The Pearson correlation analysis (Table 5) revealed multiple significant relationships among water and performance indicators in medium frame size beef cattle raised under intensive conditions. There was a perfect positive correlation between WI and WC (r=1.000; p<0.05). Water intake (WI) was also positively correlated with WFP/AU (r=0.791), final Wt. (r=0.558), and FI (r=0.555), all significant (p<0.05). Notably, WC shared similar significant correlations with WFP/AU (r = 0.799), and FI (r=0.572). Water footprint per animal unit (WFP/AU) was strongly positively correlated with final Wt. (r=0.748), and FI (r=0.755). However, WFP/AU had only a poor positive correlation with growth traits such as WG and ADG (r=0.089 each), both non-significant (p>0.05). Growth traits showed a strong negative correlation with the FCR, including WG and ADG (r=-0.795; p<0.05). Additionally, WG and ADG were strongly positively correlated with WCE (r=0.876; p<0.05). Conversely, WG and ADG exhibited strong negative correlations with WIE (r=-0.851) and WFP/kg (r=-0.867), both statistically significant (p<0.05). Water consumption efficiency (WCE) was negatively correlated with WI (r=-0.552) and WC (r=-0.542), while positively correlated with WG and ADG (r=0.876). In contrast, WIE and WFP had strong positive correlations with FCR (r=0.900 and 0.942, respectively). Water-to-feed ratio (WFR) had a moderate positive correlation with WI and WC (r=0.505 and 0.488), and significant positive associations with WIE (r=0.734) and WFP (r=0.558) but was negatively correlated with WG and ADG (r=-0.593).
Figure 5.
Pearson correlations between water metrics and performance traits in medium frame size beef cattle under intensive production systems.
Figure 5.
Pearson correlations between water metrics and performance traits in medium frame size beef cattle under intensive production systems.
Pearson correlation coefficients presented in Figure 6 demonstrate key Pearson correlations between water metrics and performance traits in large frame size beef cattle under intensive production systems. Strong and significant positive correlations were found between WI and WC (r=1.000; p<0.05), WFP/AU (r=0.992), final Wt. (r=0.835), and FI (r=0.845). Water consumption (WC) showed high positive correlations final Wt. (r=0.838), FI (r=0.851), and WFP/AU (r=0.993). Weight gain (WG) and ADG were positively correlated with WI (r=0.616), WC (r=0.620), final Wt. (r=0.792), and FI (r=0.697), all statistically significant (p<0.05). Water consumption efficiency (WCE) displayed a strong positive correlation with WG (r=0.888; p<0.05) and ADG (r=0.888; p<0.05), and a strong negative correlation with WFP/kg (r=-0.992) and WIE (r=-0.999). Conversely, WIE and WFP showed strong negative correlations with WG (r=-0.884; p<0.05) and ADG (r=-0.929; p<0.05) and strong positive correlations with FCR (r=0.946; p<0.05) for WIE and r=0.956; p<0.05) for WFP). Feed conversion ratio (FCR) was also negatively associated with body weight (r=-0.503 for Wt.), FI (r=-0.271), and WCE (r=-0.945; p<0.05). The WFR showed weak but positive correlations with WI (r=0.189) and WFP (r=0.301), but these were not statistically significant (p>0.05).
4. Discussion
Frame size is a fundamental classification trait in beef cattle that affects growth patterns, feed efficiency, and resource requirements. Defined by the animal's height and body length to age and breed, frame size is used to predict mature body weight and carcass characteristics [29]. In the context of reducing resources and increasing production efficiency, understanding how frame size influences growth performance and water consumption is critical. Beef cattle with larger frame sizes typically exhibit higher ADG compared to smaller frame size beef cattle. This could be due to their extended growth periods before reaching physiological maturity, allowing for prolonged muscle deposition [12,13]. While this characteristic enables these animals to finish with heavier weights, it often comes at the cost of increased feed requirements and delayed fattening and increases production costs [30]. However, when adjusted for carcass composition, both large and small frame size beef cattle can exhibit similar growth efficiencies [31,32]. The ADG and FCRs of small and large frame size beef cattle did not differ significantly. This suggests that while larger frame size beef cattle may reach higher absolute weights, the efficiency of growth relative to body size can be comparable across different frame sizes.
However, this is in contrast with the study by Ziegler et al. [33] who indicated that larger frame size beef cattle tend to have higher growth rates compared to smaller frame size beef cattle. This difference in growth patterns necessitates strategic management decisions based on production goals and market demands. Moreover, larger frame size beef cattle require more feed resources, which can impact the carrying capacity of a given environment [33,34,35]. In resource-limited settings, smaller frame size beef cattle may offer advantages due to their lower maintenance requirements and higher relative efficiency [9,36,37]. Therefore, aligning frame size with environmental conditions and resource availability is essential for sustainable production.
The water requirements of beef cattle are influenced by a variety of factors, including the frame size of the animal [25,38]. These differences in body size directly influence water consumption, as larger animals require more water to maintain normal physiological functions compared to smaller animals (NRC, 2000; [39]. In larger frame cattle, this demand is heightened due to their greater feed intake. Insufficient water intake can result in digestive inefficiencies, reduced feed intake, and poor weight gain, which ultimately impacts production performance in beef cattle. This becomes more pronounced in larger frame size beef cattle due to their larger maintenance requirements that will not be met with reduced WI that consequently affecting FI [40].
It is estimated that beef cattle consume 3.5 to 7% of their body weight in water daily. This range can vary depending on environmental and dietary conditions. Larger animals not only require more water due to size but also because of their higher feed intake. Dry matter intake (DMI) is directly correlated with water consumption. Cattle with higher DMI need more water to facilitate rumen fermentation and nutrient absorption [31,41]. Large frame size beef cattle, consuming more feed to support their growth, thus have increased water needs. These differences were observed in the current study for both the WI and WC wherein the larger frame sizes have higher water intake and consumption followed by the medium frame size, then the small frame size beef cattle having the lowest. Similar trends were noticed throughout the feeding phases.
In beef cattle, growth efficiency refers to how effectively an animal converts input resources (feed and water) into body weight gain. Improving this efficiency means reducing feed costs and enhancing profitability. Large frame size beef cattle have a genetic predisposition for greater mature weights [13,37]. Large frame size beef cattle typically grow at a steady rate but require a longer time to reach market weight, leading to extended finishing periods [33]. Medium frame size beef cattle exhibit faster growth rates and improved feed efficiency, making them an optimal choice for producers seeking a balance between growth and input resources. Small frame size beef cattle reach maturity faster but have lower absolute growth potential and final body weights, which may limit carcass yield in certain market conditions.
However, in the current study, the medium frame size beef cattle demonstrated the highest ADG, indicating superior growth efficiency during the production cycle. The findings suggest that growth rate is not solely dependent on size but also on the efficiency of nutrient utilization. Findings from this study indicated that ADG and FCR did not differ significantly between small and large frame size cattle, implying that despite their higher body weights, large frame size beef cattle may not always be the most efficient in converting feed into weight gain. This aligns with findings from Arboitte et al. [9] and McAllister et al. [30] who emphasized that larger frame size beef cattle require higher feed inputs to sustain their growth. The tendency for large frame size beef cattle to reach physiological maturity at heavier weights pose major challenges like extended finishing periods that ultimately increase production inputs. This finding aligns with findings by Nyamushamba et al. [40] and Ismail and Al-Ansari [36], which highlights that in low-input or extensive systems, smaller frame size beef cattle may be preferred because they require less maintenance feed and reach market weight sooner, making them more cost-effective.
Water-use efficiency (WUE) is a critical measure in evaluating the sustainability of beef production. It includes parameters such as the WFR, WIE, WCE and the overall water footprint of the production system. Water-to-feed ratio indicates the volume of water consumed per unit of feed intake and is typically higher in large frame size beef cattle due to their elevated FI. Although these animals are capable of higher growth rates, their increased FI results in a proportionately higher WFR. However, a study by Arboitte et al. [9] indicated that medium frame size beef cattle utilize feed and water most efficiently for daily growth, which aligns with findings from the current study. This implies similar water requirements per unit of feed intake across beef cattle frame sizes (WFR). Efficient feeding strategies and the inclusion of high-moisture forages can help improve this ratio, especially in large-framed breeds.
Water intake efficiency reflects the amount of water required to produce one kilogram of live weight gain. Large frame size beef cattle, while achieving higher absolute weight gains, often do so with increased WI. This can result in a lower water-use efficiency compared to small or medium frame size beef cattle. This difference becomes critical in water-limited regions, where minimizing input for the same output is a priority. Terry et al. [42] highlights that genetic selection and nutritional management can help improve water-use traits without compromising performance. For instance, the current study showed that smaller frame sizes are more efficient in converting water intake into weight gain as demonstrated by lower WIE and higher WCE. Selecting animals with favourable growth-to-water intake ratios is increasingly relevant in climate-smart beef production systems.
The water footprint of beef cattle is influenced by frame size with large frame size beef cattle generally having a higher WFP due to their longer feedlot duration, higher feed requirements, and greater maintenance needs [25,36]. Large frame size beef cattle had a higher WFP/AU, indicating a greater environmental impact. The environmental sustainability of beef production is closely linked to resource use efficiency [43] (Capper and Bauman, 2013). Strategies to improve feed efficiency, such as genetic selection and nutritional management, can also enhance water-use efficiency, thereby reducing the overall environmental footprint of beef cattle operations [25,36]. No significant (p>0.05) differences were observed in WFP/kg, suggesting that frame size does not influence water use relative to weight gain. This highlights the increased environmental impact of larger frame sizes in terms of water use (WFP/AU), likely due to reduced growth rates and increased maintenance energy requirements (FCR). Palhares et al. [15] and Ridoutt et al. (2022) emphasize that improving overall system efficiency—such as by reducing days on feed, optimizing diet formulations, and reducing water losses—has a greater impact on water footprint reduction than simply changing the animal’s frame size.
The relationship between growth performance and water traits in beef cattle is a complex interaction, influenced by several physiological. Growth performance in beef cattle, which includes WG and FI, is closely linked to WI and WC. According to research by NRC (2000), as cattle grow and increase in body size, their water requirements correspondingly increase. Large frame size cattle have higher maintenance needs and thus consume more water to support their heavy bodies [44]. Furthermore, as cattle consume more feed their WI and WC increases to aid in the digestion and assimilation of nutrients. Water intake is positively correlated with FI, and cattle consuming larger quantities of feed are generally observed to consume more water as well [27,45]. This aligns with findings from the current study. FI was positively correlated to WI and WC across all beef cattle frame size during the starter feeding phase. However, a different trend was observed for the small frame size beef cattle during the grower feeding phase, where the FI was negatively correlated with WI and WC. On the medium frame size beef cattle, these traits had very weak positive correlations indicating almost no influence of WI on FI, contrary to the norm [16,46,47]. Dehydration or insufficient water intake can lead to reduced feed consumption and poor digestion, ultimately impacting weight gain. When cattle are not adequately hydrated, their ability to digest and metabolize feed is compromised, which can result in stunted growth and poor feed conversion [47,48]. Therefore, ensuring an adequate and consistent water supply is essential for supporting healthy WG and optimal FI.
Water intake efficiency is a critical metric for assessing the efficiency with which cattle convert water into body weight. In general, efficient cattle are those that require less water to gain weight. Studies by [25,46] suggests that WIE is influenced by both genetic and environmental factors. For instance, cattle with higher WIE tend to perform better in terms of growth, as they utilize water more effectively to convert feed into body mass [42,49]. This is evident from the strong correlations between WCE and ADG observed in this study across all beef castle frame sizes. However, WIE can vary between different cattle frame sizes, with small frame size beef cattle being more efficient in converting feed and water into weight gain under similar conditions. Improving WIE can lead to better growth performance and enhanced WCE [42]. Optimizing water usage can help minimize the environmental impact of beef production while maintaining healthy growth rates.
Furthermore, the WFR is an indicator of water efficiency in beef production. Studies have shown that WFR is positively correlated with feed conversion ratio (FCR), indicating that more efficient cattle tend to have a lower WFR [49,50]. The water footprint of beef cattle is a crucial environmental metric, especially in the context of sustainability in livestock production. The water footprint is indirectly related to growth performance, as more efficient cattle that gain weight quickly require less water per unit of weight gain, thereby reducing their overall water footprint [26,51,52]. However, improving the water footprint at the herd level requires broader strategies, such as reducing water usage and improving water efficiency at all stages of beef production, from raising cattle to processing. In intensive beef production systems, improving water-use efficiency not only benefits environmental sustainability but also improves economic efficiency. Cattle that are more efficient in their water and feed use may be more cost-effective to raise, as they require less water to produce the same amount of meat.
5. Conclusions
This study highlights the significance of water footprint in intensive beef production systems and its impact on growth performance and environmental sustainability. The findings demonstrate that large-frame beef cattle exhibit higher absolute growth and water intake but impose greater environmental costs due to increased resource demands. In contrast, small-frame cattle show superior water-use efficiency, while medium-frame cattle present an optimal balance between growth performance and resource efficiency. The strong correlations between feed intake (FI), water intake (WI), and weight gain (WG) emphasize the interdependence of nutrition and hydration in cattle performance. Water intake efficiency (WIE) and water consumption efficiency (WCE) were found to be critical indicators for assessing cattle efficiency under intensive production, with smaller and medium-frame cattle exhibiting superior resource conversion rates. Additionally, water footprint per animal unit (WFP/AU) highlights the higher environmental impact of larger-frame cattle, reinforcing the need for sustainable management practices. These findings suggest that optimizing frame size selection, improving feed efficiency, and implementing strategic water management practices can enhance the sustainability of beef production systems in water-scarce regions. Future research should explore genetic and management interventions to further improve WUE while maintaining high growth performance. By aligning production strategies with environmental sustainability goals, the beef industry can contribute to more resilient and resource-efficient livestock systems.
Author Contributions
Conceptualization, B.M., K.N., A.N., M.R.; and T.M.; methodology, A.N. and M.R.; formal analysis, A.N.; investigation, A.N.; resources, A.N., B.M., K.N., and M.R.; data curation, A.N.; writing—original draft preparation, A.N.; writing—review and editing, B.M., K.N., M.R., and T.M.; visualization, A.N.; supervision, B.M., K.N., M.R. and T.M.; project administration, A.N., and B.M; funding acquisition, B.M. All authors have read and agreed to the published version of the manuscript.
Funding
This research was funded by Water Research Commission, grant number K5/2964.
Institutional Review Board Statement
The study procedures were approved by the Tshwane University of Technology Animal Research Ethics Committee (TUT-AREC) with reference number: AREC202306006. The study was conducted at the Agricultural Research Council, Animal Production.
Informed Consent Statement
Data Availability Statement
The Tshwane University of Technology (TUT) remains the owner of any intellectual property because of this study. No information is allowed to be used without the prior permission of TUT.
Acknowledgments
The authors acknowledge the support provided by the funder of this study, Water Research Commission, Tshwane University of Technology (TUT), and the Agricultural Research Council – Animal Production (ARC-AP). In addition, the authors would like to extend their gratitude to Nicolene Cochrane for assisting with the statistical analysis.
Conflicts of Interest
The authors declare no conflicts of interest. The funders had no role in the design of the study; collection, analyses, or interpretation of data; in the writing of the manuscript, or in the decision to publish the results.
References
- Nkadimeng M, Van Marle-Köster E, Nengovhela NB, Ramukhithi FV, Mphaphathi ML, Rust JM, et al. Assessing Reproductive Performance to Establish Benchmarks for Small-Holder Beef Cattle Herds in South Africa. Animals [Internet]. 2022 Nov 1 [cited 2025 Feb 9];12(21):3003. Available from: https://www.mdpi.com/2076-2615/12/21/3003.
- Scholtz M, Maiwashe A, Neser F, Theunissen A, Olivier W, Mokolobate M, et al. Livestock breeding for sustainability to mitigate global warming, with the emphasis on developing countries. SA J An Sci [Internet]. 2013 Oct 22 [cited 2025 Feb 10];43(3):269. Available from: http://www.ajol.info/index.php/sajas/article/view/95630.
- Barbero RP, Malheiros EB, Nave RLG, Mulliniks JT, Delevatti LM, Koscheck JFW, et al. Influence of post-weaning management system during the finishing phase on grasslands or feedlot on aiming to improvement of the beef cattle production. Agricultural Systems [Internet]. 2017 May [cited 2025 Feb 10];153:23–31. Available from: https://linkinghub.elsevier.com/retrieve/pii/S0308521X16305170.
- Lalman D, Holder A. NUTRIENT REQUIREMENTS OF BEEF CATTLE. 2014;1–24.
- Mpandeli S, Naidoo D, Mabhaudhi T, Nhemachena C, Nhamo L, Liphadzi S, et al. Climate Change Adaptation through the Water-Energy-Food Nexus in Southern Africa. IJERPH [Internet]. 2018 Oct 19 [cited 2025 Feb 9];15(10):2306. Available from: https://www.mdpi.com/1660-4601/15/10/2306.
- Pahlow M, Snowball J, Fraser G. Water footprint assessment to inform water management and policy making in South Africa. WSA [Internet]. 2015 Apr 21 [cited 2025 Feb 10];41(3 April). Available from: https://watersa.net/article/view/10972.
- Meza I, Eyshi Rezaei E, Siebert S, Ghazaryan G, Nouri H, Dubovyk O, et al. Drought risk for agricultural systems in South Africa: Drivers, spatial patterns, and implications for drought risk management. Science of The Total Environment [Internet]. 2021 Dec [cited 2025 Feb 10];799:149505. Available from: https://linkinghub.elsevier.com/retrieve/pii/S0048969721045794.
- Wagner JJ, Engle TE. Invited Review: Water consumption, and drinking behavior of beef cattle, and effects of water quality. Applied Animal Science [Internet]. 2021 Aug [cited 2025 Feb 9];37(4):418–35. Available from: https://linkinghub.elsevier.com/retrieve/pii/S2590286521001075.
- Arboitte MZ, Brondani IL, Restle J, Freitas LDS, Pereira LB, Cardoso GDS. Carcass characteristics of small and medium-frame Aberdeen Angus young steers. Acta Sci Anim Sci [Internet]. 2012 Jan 1 [cited 2025 Feb 9];34(1):49–56. Available from: http://periodicos.uem.br/ojs/index.php/ActaSciAnimSci/article/view/12463.
- Silanikove, N. Effects of heat stress on the welfare of extensively managed domestic ruminants. Livestock Production Science [Internet]. 2000 Dec [cited 2025 Feb 10];67(1–2):1–18. Available from: https://linkinghub.elsevier.com/retrieve/pii/S0301622600001627.
- Effects of heat stress on the welfare of extensively managed domestic ruminants. Livestock Production Science [Internet]. 2000 Dec [cited 2025 Feb 10];67(1–2):1–18. Available from: https://linkinghub.elsevier.com/retrieve/pii/S0301622600001627.
- Lagreca GV, Neel JP, Lewis RM, Swecker WS, Duckett SK. How Does Frame Size, Forage Type, and Time-on-Pasture Alter ForageFinished Beef Quality? J Anim Sci Res [Internet]. 2018 [cited 2025 Feb 9];2(3). Available from: https://www.sciforschenonline.org/journals/animal-science-research/JASR-2-119.
- Barro AG, Marestone BS, Dos S. ER, Ferreira GA, Vero JG, Terto DK, et al. Genetic parameters for frame size and carcass traits in Nellore cattle. Trop Anim Health Prod [Internet]. 2023 Apr [cited 2025 Feb 9];55(2):71. Available from: https://link.springer.com/10.1007/s11250-023-03464-z.
- Onyango CM, Nyaga JM, Wetterlind J, Söderström M, Piikki K. Precision Agriculture for Resource Use Efficiency in Smallholder Farming Systems in Sub-Saharan Africa: A Systematic Review. Sustainability [Internet]. 2021 Jan 22 [cited 2025 Feb 9];13(3):1158. Available from: https://www.mdpi.com/2071-1050/13/3/1158.
- Palhares JCP, Morelli M, Novelli TI. Water footprint of a tropical beef cattle production system: The impact of individual-animal and feed management. Advances in Water Resources [Internet]. 2021 Mar [cited 2025 Feb 9];149:103853. Available from: https://linkinghub.elsevier.com/retrieve/pii/S0309170821000087.
- Dickhoefer U, Ramadhan MR, Apenburg S, Buerkert A, Schlecht E. Effects of mild water restriction on nutrient digestion and protein metabolism in desert-adapted goats. Small Ruminant Research [Internet]. 2021 Nov [cited 2025 Feb 9];204:106500. Available from: https://linkinghub.elsevier.com/retrieve/pii/S0921448821001772.
- Boulay AM, Drastig K, Amanullah, Chapagain A, Charlon V, Civit B, et al. Building consensus on water use assessment of livestock production systems and supply chains: Outcome and recommendations from the FAO LEAP Partnership. Ecological Indicators [Internet]. 2021 May [cited 2025 Feb 10];124:107391. Available from: https://linkinghub.elsevier.com/retrieve/pii/S1470160X2100056X.
- Gupta GS, Orban A. Water is life, life is water: (Un)sustainable use and management of water in the 21st century. CJSSP [Internet]. 2018 Jun 26 [cited 2025 Feb 10];9(1):81–100. Available from: http://cjssp.uni-corvinus.hu/index.php/cjssp/article/view/246.
- Kummu M, Guillaume JHA, De Moel H, Eisner S, Flörke M, Porkka M, et al. The world’s road to water scarcity: shortage and stress in the 20th century and pathways towards sustainability. Sci Rep [Internet]. 2016 Dec 9 [cited 2025 Feb 10];6(1):38495. Available from: https://www.nature.com/articles/srep38495.
- FAO. The State of Food and Agriculture 2023 [Internet]. FAO; 2023 [cited 2025 Jun 9]. Available from: http://www.fao.org/documents/card/en/c/cc7724en.
- UN, editor. Groundwater making the invisible visible. Paris: UNESCO; 2022. 225 p. (The United Nations world water development report).
- Street, K. Sustainable Development Goals: Country Report 2023. 2023. [Google Scholar]
- Filho WL, Wall T, Salvia AL, Dinis MAP, Mifsud M. The central role of climate action in achieving the United Nations’ Sustainable Development Goals. Sci Rep [Internet]. 2023 Nov 23 [cited 2025 Jun 9];13(1):20582. Available from: https://www.nature.com/articles/s41598-023-47746-w.
- Horwitz W, AOAC International, editors. Official methods of analysis of AOAC International. 18. ed., current through rev. 1, 2006. Gaithersburg, Md: AOAC International; 2006. 2400 p.
- Ahlberg CM, Allwardt K, Broocks A, Bruno K, Taylor A, Mcphillips L, et al. Characterization of water intake and water efficiency in beef cattle1,2. Journal of Animal Science [Internet]. 2019 Dec 17 [cited 2025 Feb 9];97(12):4770–82. Available from: https://academic.oup.com/jas/article/97/12/4770/5628908.
- Pereira GM, Egito AA, Gomes RC, Ribas MN, Torres Junior RAA, Fernandes Junior JA, et al. Water requirements of beef production can be reduced by genetic selection. Animal [Internet]. 2021 Mar [cited 2025 Feb 9];15(3):100142. Available from: https://linkinghub.elsevier.com/retrieve/pii/S1751731120301440.
- Mekonnen MM, Hoekstra AY. A Global Assessment of the Water Footprint of Farm Animal Products. Ecosystems [Internet]. 2012 Apr [cited 2025 Feb 11];15(3):401–15. Available from: http://link.springer.com/10.1007/s10021-011-9517-8.
- SAS Institute. Base SAS 9.4 Procedures Guide, Seventh Edition. 2017.
- Nkrumah JD, Okine EK, Mathison GW, Schmid K, Li C, Basarab JA, et al. Relationships of feedlot feed efficiency, performance, and feeding behavior with metabolic rate, methane production, and energy partitioning in beef cattle1. Journal of Animal Science [Internet]. 2006 Jan 1 [cited 2025 Mar 24];84(1):145–53. Available from: https://academic.oup.com/jas/article/84/1/145/4804175.
- McAllister TA, Stanford K, Chaves AV, Evans PR, Eustaquio De Souza Figueiredo E, Ribeiro G. Nutrition, feeding and management of beef cattle in intensive and extensive production systems. In: Animal Agriculture [Internet]. Elsevier; 2020 [cited 2025 Feb 9]. p. 75–98. Available from: https://linkinghub.elsevier.com/retrieve/pii/B9780128170526000057.
- Galyean ML, Hales KE. Feeding Management Strategies to Mitigate Methane and Improve Production Efficiency in Feedlot Cattle. Animals [Internet]. 2023 Feb 20 [cited 2025 Mar 24];13(4):758. Available from: https://www.mdpi.com/2076-2615/13/4/758.
- Malau-Aduli AEO, Curran J, Gall H, Henriksen E, O’Connor A, Paine L, et al. Genetics and nutrition impacts on herd productivity in the Northern Australian beef cattle production cycle. Veterinary and Animal Science [Internet]. 2022 Mar [cited 2025 Feb 9];15:100228. Available from: https://linkinghub.elsevier.com/retrieve/pii/S2451943X21000636.
- Ziegler RL, Musgrave JA, Meyer TL, Funston RN, Dennis EJ, Hanford KJ, et al. The impact of cow size on cow-calf and postweaning progeny performance in the Nebraska Sandhills. Translational Animal Science [Internet]. 2020 Oct 1 [cited 2025 Feb 9];4(4):txaa194. Available from: https://academic.oup.com/tas/article/doi/10.1093/tas/txaa194/5940764.
- Nguyen DV, Nguyen OC, Malau-Aduli AEO. Main regulatory factors of marbling level in beef cattle. Veterinary and Animal Science [Internet]. 2021 Dec [cited 2025 Feb 9];14:100219. Available from: https://linkinghub.elsevier.com/retrieve/pii/S2451943X21000545.
- Gerber PJ, Mottet A, Opio CI, Falcucci A, Teillard F. Environmental impacts of beef production: Review of challenges and perspectives for durability. Meat Science [Internet]. 2015 Nov [cited 2025 Feb 13];109:2–12. Available from: https://linkinghub.elsevier.com/retrieve/pii/S0309174015300139.
- Ismail M, Al-Ansari T. Enhancing sustainability through resource efficiency in beef production systems using a sliding time window-based approach and frame scores. Heliyon [Internet]. 2023 Jul [cited 2025 Feb 9];9(7):e17773. Available from: https://linkinghub.elsevier.com/retrieve/pii/S2405844023049812.
- Lagreca G, Neel J, Lewis R, Swecker WJ, Duckett S. How Does Frame Size, Forage Type, and Time-on-Pasture Alter ForageFinished Beef Quality? J Anim Sci Res [Internet]. 2018 [cited 2025 Jan 28];2(3). Available from: https://www.sciforschenonline.org/journals/animal-science-research/JASR-2-119.php.
- Golher DM, Patel BHM, Bhoite SH, Syed MI, Panchbhai GJ, Thirumurugan P. Factors influencing water intake in dairy cows: a review. Int J Biometeorol. 2021 Apr;65(4):617–25.
- Burgos MS, Senn M, Sutter F, Kreuzer M, Langhans W. Effect of water restriction on feeding and metabolism in dairy cows. American Journal of Physiology-Regulatory, Integrative and Comparative Physiology [Internet]. 2001 Feb 1 [cited 2025 Feb 9];280(2):R418–27. Available from: https://www.physiology.org/doi/10.1152/ajpregu.2001.280.2.R418.
- Nyamushamba GB, Mapiye C, Tada O, Halimani TE, Muchenje V. Conservation of indigenous cattle genetic resources in Southern Africa’s smallholder areas: turning threats into opportunities — A review. Asian-Australas J Anim Sci [Internet]. 2016 Mar 22 [cited 2025 Feb 10];30(5):603–21. Available from: http://www.ajas.info/journal/view.php?doi=10.5713/ajas.16.0024.
- Miller GA, Auffret MD, Roehe R, Nisbet H, Martínez-Álvaro M. Different microbial genera drive methane emissions in beef cattle fed with two extreme diets. Front Microbiol [Internet]. 2023 Apr 13 [cited 2025 Feb 9];14:1102400. Available from: https://www.frontiersin.org/articles/10.3389/fmicb.2023.1102400/full.
- Terry SA, Basarab JA, Guan LL, McAllister TA. Strategies to improve the efficiency of beef cattle production. Miglior F, editor. Can J Anim Sci [Internet]. 2021 Mar 1 [cited 2025 Feb 9];101(1):1–19. Available from: https://cdnsciencepub.com/doi/10.1139/cjas-2020-0022.
- Klopatek SC, Oltjen JW. How advances in animal efficiency and management have affected beef cattle’s water intensity in the United States: 1991 compared to 2019. Journal of Animal Science [Internet]. 2022 Nov 1 [cited 2025 Mar 24];100(11):skac297. Available from: https://academic.oup.com/jas/article/doi/10.1093/jas/skac297/6692300.
- Johnson JJ, Dunn BH, Radakovich JD. UNDERSTANDING COW SIZE AND EFFICIENCY. 2010.
- Pastor AV, Ludwig F, Biemans H, Hoff H, Kabat P. Accounting for environmental flow requirements in global water assessments [Internet]. Global hydrology/Theory development; 2013 [cited 2025 Feb 9]. Available from: https://hess.copernicus.org/preprints/10/14987/2013/hessd-10-14987-2013.pdf.
- Dressler EA, Shaffer W, Bruno K, Krehbiel CR, Calvo-Lorenzo M, Richards CJ, et al. Heritability and variance component estimation for feed and water intake behaviors of feedlot cattle. Journal of Animal Science [Internet]. 2023 Jan 3 [cited 2025 Feb 11];101:skad386. Available from: https://academic.oup.com/jas/article/doi/10.1093/jas/skad386/7424049.
- Ojo AO, Mulim HA, Campos GS, Junqueira VS, Lemenager RP, Schoonmaker JP, et al. Exploring Feed Efficiency in Beef Cattle: From Data Collection to Genetic and Nutritional Modeling. Animals [Internet]. 2024 Dec 17 [cited 2025 Feb 9];14(24):3633. Available from: https://www.mdpi.com/2076-2615/14/24/3633.
- Devant M, Marti S. Strategies for Feeding Unweaned Dairy Beef Cattle to Improve Their Health. Animals [Internet]. 2020 Oct 18 [cited 2025 Feb 11];10(10):1908. Available from: https://www.mdpi.com/2076-2615/10/10/1908.
- Tedeschi LO, Abdalla AL, Álvarez C, Anuga SW, Arango J, Beauchemin KA, et al. Quantification of methane emitted by ruminants: a review of methods. Journal of Animal Science [Internet]. 2022 Jul 1 [cited 2025 Feb 9];100(7):skac197. Available from: https://academic.oup.com/jas/article/doi/10.1093/jas/skac197/6601311.
- O’Meara FM, Gardiner GE, O’Doherty JV, Lawlor PG. Effect of water-to-feed ratio on feed disappearance, growth rate, feed efficiency, and carcass traits in growing-finishing pigs. Translational Animal Science [Internet]. 2020 Apr 1 [cited 2025 Feb 9];4(2):630–40. Available from: https://academic.oup.com/tas/article/4/2/630/5815769.
- Gerbens-Leenes PW, Mekonnen MM, Hoekstra AY. The water footprint of poultry, pork and beef: A comparative study in different countries and production systems. Water Resources and Industry [Internet]. 2013 Mar [cited 2025 Feb 11];1–2:25–36. Available from: https://linkinghub.elsevier.com/retrieve/pii/S2212371713000024.
- Ridoutt BG, Page G, Opie K, Huang J, Bellotti W. Carbon, water and land use footprints of beef cattle production systems in southern Australia. Journal of Cleaner Production [Internet]. 2014 Jun [cited 2025 Feb 9];73:24–30. Available from: https://linkinghub.elsevier.com/retrieve/pii/S0959652613005349.
Figure 1.
Performance traits of beef cattle over time (Wt.: final weight (kg), FI: feed intake (kg), WI: water intake (L), WC: water consumption (L), WG: weight gain (kg), ADG: average daily gain (kg)).
Figure 1.
Performance traits of beef cattle over time (Wt.: final weight (kg), FI: feed intake (kg), WI: water intake (L), WC: water consumption (L), WG: weight gain (kg), ADG: average daily gain (kg)).
Figure 3.
Pearson correlation analysis between water-use indicators and performance traits of the combined beef cattle frame sizes during the post-weaning feeding period under intensive production.
Figure 3.
Pearson correlation analysis between water-use indicators and performance traits of the combined beef cattle frame sizes during the post-weaning feeding period under intensive production.
Figure 4.
Pearson correlations between water metrics and performance traits in small frame size beef cattle under intensive production systems.
Figure 4.
Pearson correlations between water metrics and performance traits in small frame size beef cattle under intensive production systems.
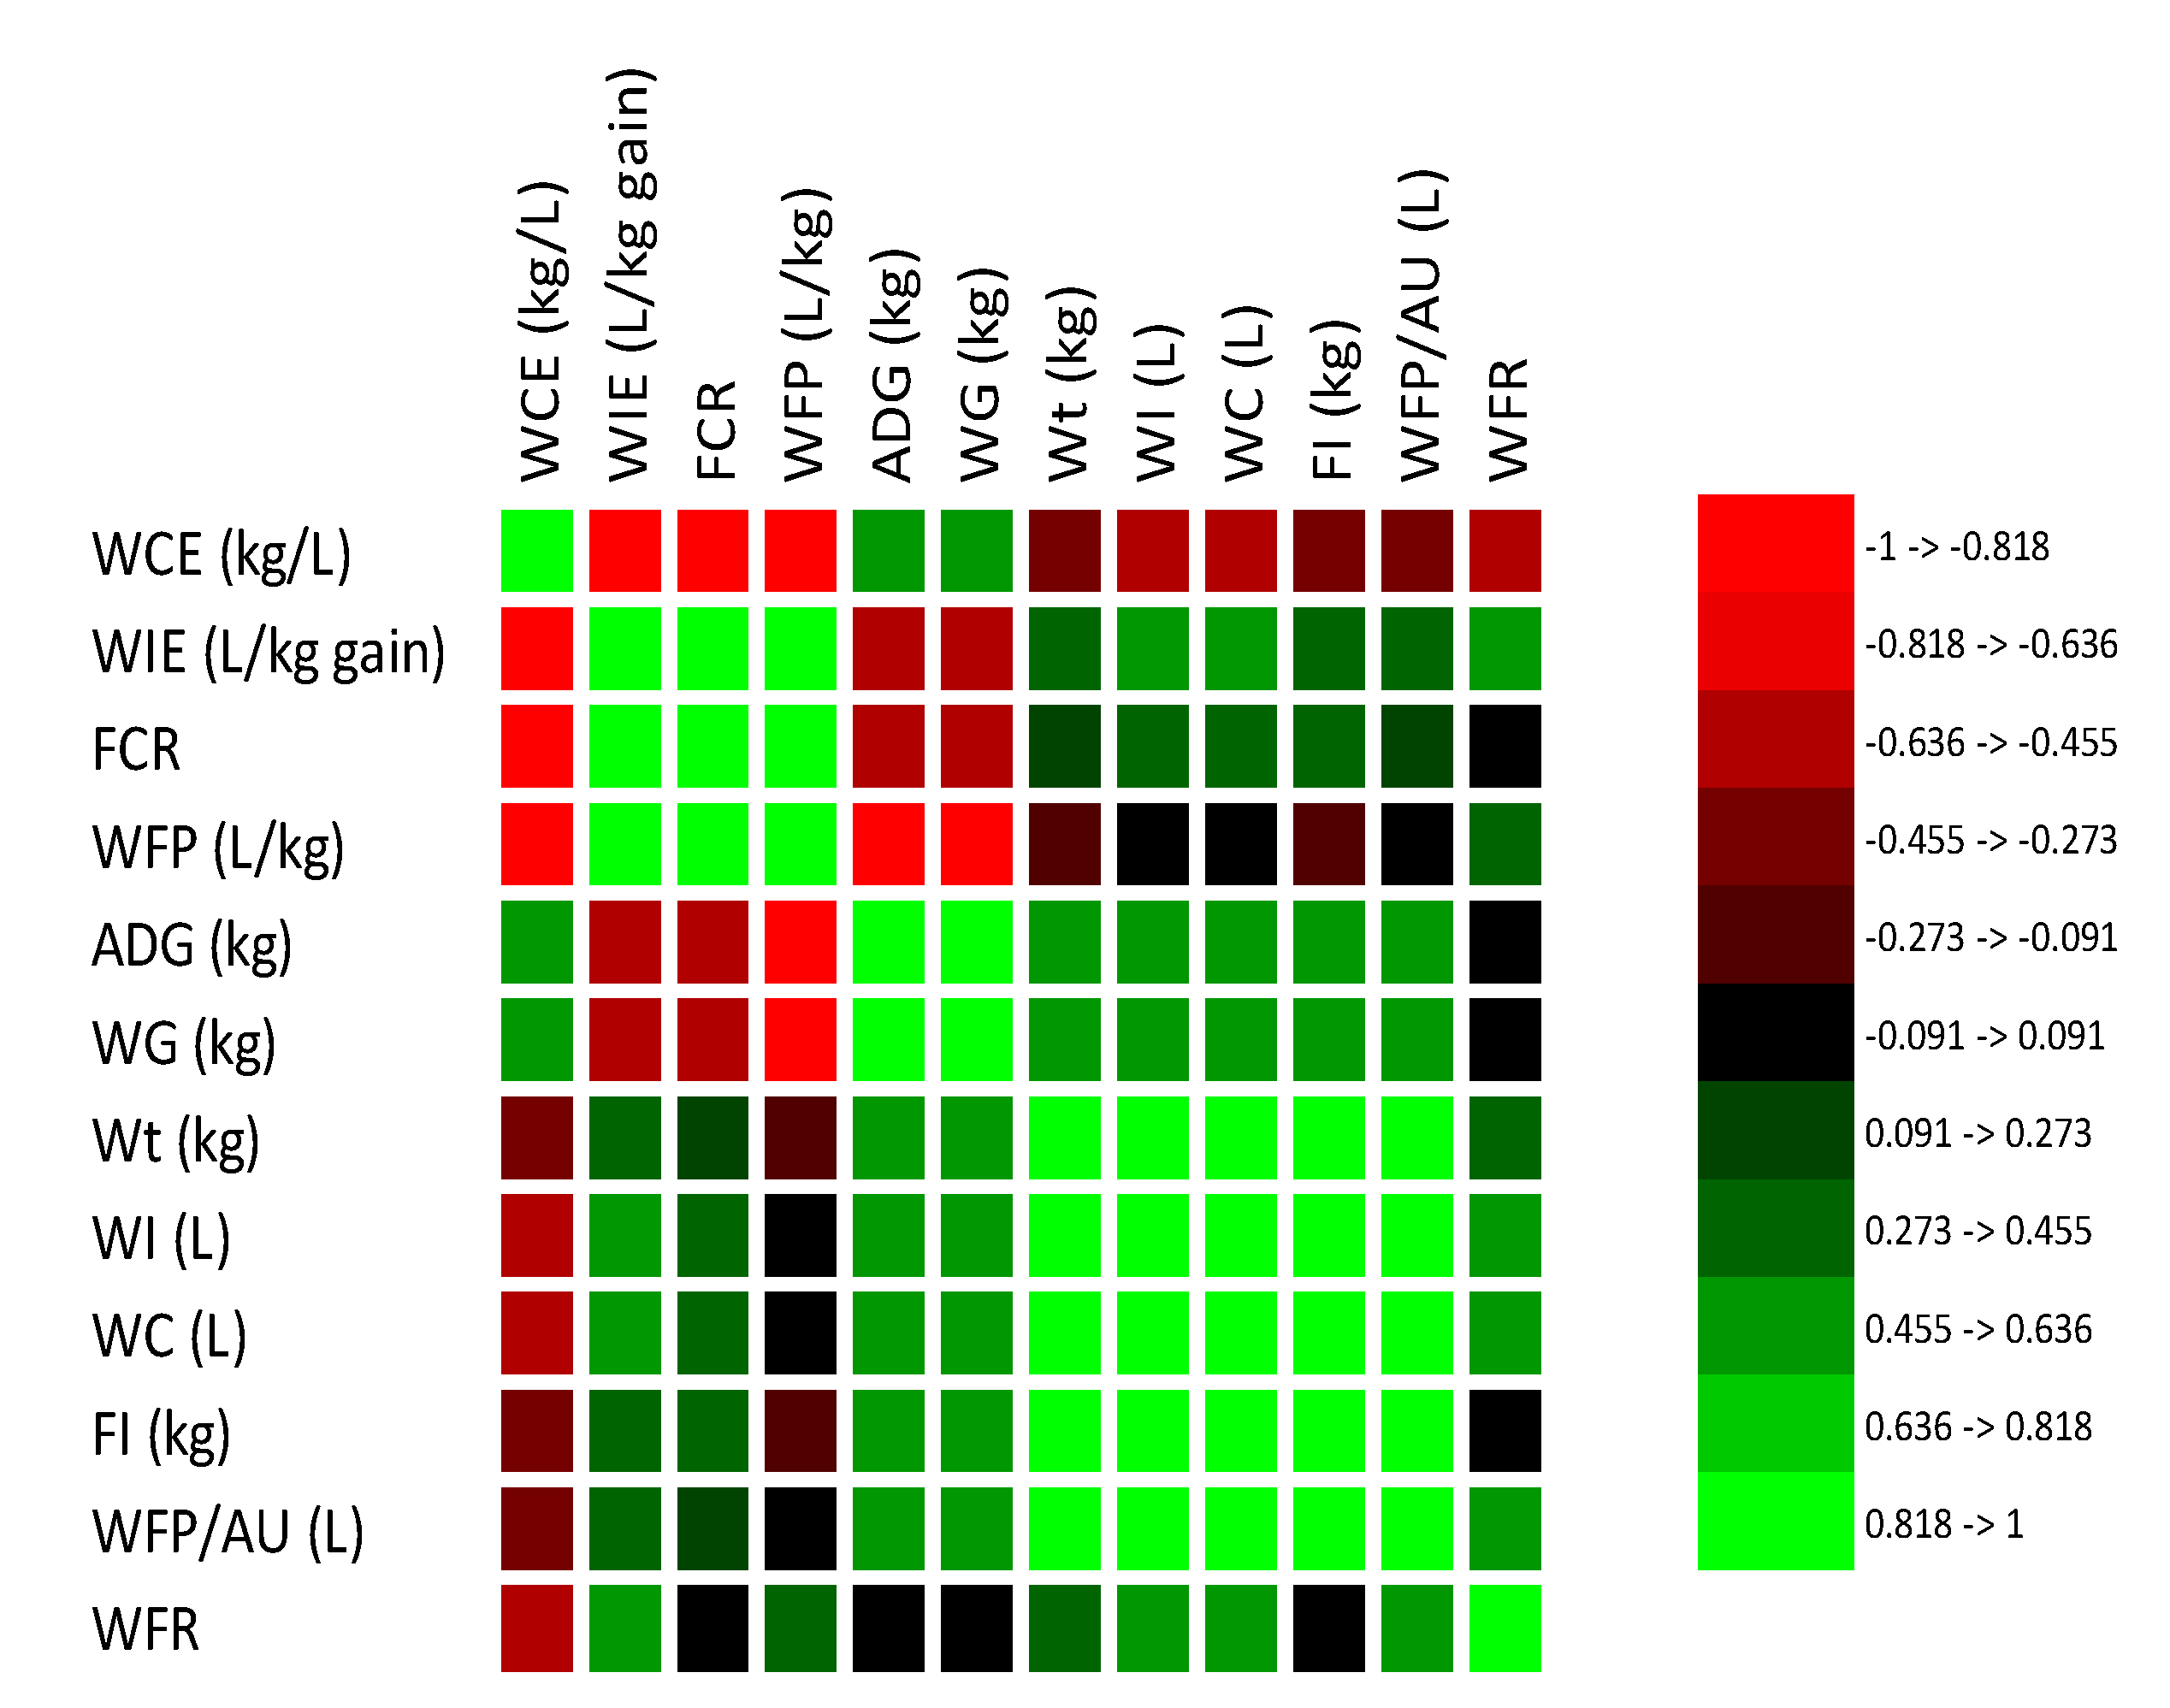
Figure 6.
Pearson correlations between water metrics and performance traits in large frame size beef cattle under intensive production systems.
Figure 6.
Pearson correlations between water metrics and performance traits in large frame size beef cattle under intensive production systems.


Table 1.
Post weaning diet of beef cattle under intensive production system
| Feed ingredient (kg) | Starter | Grower | Finisher | |
| Hominy chop | 630 | 670 | 690 | |
| Eragrostis hay | 200 | 180 | 160 | |
| Soya oilcake | 80 | 60 | 60 | |
| Molasses | 60 | 60 | 60 | |
| Limestone | 15.0 | 15.0 | 15.0 | |
| Urea | 8.0 | 9.0 | 9.0 | |
| Salt | 5.0 | 5.0 | 5.0 | |
| Vit/mineral premix | 1.9 | 1.8 | 1.6 | |
| Estimated nutrient specifications (%) | ||||
| DM | 92.35 | 93.81 | 93.13 | |
| TDN | 74.22 | 74.69 | 75.26 | |
| NE (MJ/kg) | 6.81 | 6.85 | 6.91 | |
| CF | 8.41 | 7.69 | 7.08 | |
| CP | 13.72 | 13.39 | 13.51 | |
| Ca | 6.98 | 6.86 | 6.79 | |
| P | 3.13 | 3.10 | 3.14 | |
Table 2.
Means and LSDs of growth performance of beef cattle under intensive production system.
| Frame size | |||
| Measurements | Small | Medium | Large |
| Growth performance | |||
| Wti. (kg) | 159.77c±23.65 | 228.41b±23.65 | 265.14a±23.65 |
| Wtf. (kg) | 292.14c±27.27 | 383.46b±27.27 | 412.73a±27.27 |
| FI (kg) | 813.68b±47.03 | 1025.21a±47.03 | 1021.59a±47.03 |
| WI (L) | 2510.64c±156.3 | 3095.64b±156.3 | 3394.09a±156.3 |
| WC (L) | 2572.88c±158.8 | 3174.07b±158.8 | 3471.88a±158.8 |
| WG (kg) | 132.36b±15.11 | 155.05a±15.11 | 142.59a±15.11 |
| Efficiency measures | |||
| ADG (kg) | 1.26b±0.144 | 1.48a±0.144 | 1.41ab±0.144 |
| FCR | 6.30a±0.679 | 6.66a±0.679 | 6.97a±0.679 |
| WFR (L/kg FI) | 3.09b±0.130 | 3.02b±0.130 | 3.33a±0.130 |
| WIE (L/kg gain) | 19.37b±2.179 | 20.15b±2.179 | 23.15a±2.179 |
| WCE (kg gain/L) | 0.051a±0.005 | 0,049a±0.005 | 0,042b±0.005 |
| WFP/kg (L/kg gain) | 29.51a±3.074 | 27.21a±3.074 | 30.01a ±3.074 |
| WFP/AU (L) | 3822c±197.22 | 4185b±197.22 | 4407a±197.22 |
a,b,c Rows with different superscripts are significantly different at p<0.05. Wti: initial weight, Wtf.: animal final weight, FI: feed intake, WI: water intake, WC: water consumption, WG: weight gain, ADG: average daily gain, FCR: feed conversion ratio, WFR: water to feed ratio, WIE: gain to water efficiency, WCE: water to gain efficiency, WFP/KG: water footprint per kg gain, WFP/AU: water footprint per animal unit.
Disclaimer/Publisher’s Note: The statements, opinions and data contained in all publications are solely those of the individual author(s) and contributor(s) and not of MDPI and/or the editor(s). MDPI and/or the editor(s) disclaim responsibility for any injury to people or property resulting from any ideas, methods, instructions or products referred to in the content. |
© 2025 by the authors. Licensee MDPI, Basel, Switzerland. This article is an open access article distributed under the terms and conditions of the Creative Commons Attribution (CC BY) license (http://creativecommons.org/licenses/by/4.0/).
Copyright: This open access article is published under a Creative Commons CC BY 4.0 license, which permit the free download, distribution, and reuse, provided that the author and preprint are cited in any reuse.


