
Submitted:
16 July 2025
Posted:
16 July 2025
You are already at the latest version
Abstract
This paper presents ToMEto, a web-based platform designed to foster culinary creativity through the fusion of global cuisines. Unlike traditional recipe applications, which focus on meal planning or dietary preferences, ToMEto enables users to explore and create innovative fusion dishes by substituting ingredients from one cuisine for recipes from another. The platform leverages data collected from major recipe sources, employing graph-based models to analyze the relationships between ingredients and identify potential substitutions. The initial phase of development focused on familiarizing the team with necessary tools and environments, including exploring APIs, reviewing existing literature on recipe recommendations, and acquiring data through web scraping techniques. By integrating front-end user interfaces with back-end algorithms, ToMEto aims to revolutionize recipe exploration and provide a personalized, dynamic experience for chefs and home cooks alike. This paper outlines the project’s goals, progress, and technical challenges, highlighting its potential impact on culinary innovation and recipe development.
Keywords:
culinary innovation
; ingredient substitution
; graph theory
; food pairing
; web application
; PMI algorithms
1. Introduction
Traditionally, cooking involves a combination of technical skills and creativity. While technical skills can be improved through time and practice, the creative aspect of cooking can be enhanced by utilizing the wealth of existing recipes available online. Existing applications mainly focus on meal planning, dietary preferences, or recipe databases, with few offering ingredient-level innovations.
To address this gap, this paper presents ToMEto, a web-based platform designed to foster culinary creativity through the fusion of global cuisines. Unlike traditional recipe applications, ToMEto enables users to explore and create innovative fusion dishes by substituting ingredients from one cuisine into recipes from another. The platform leverages graph-based models to analyze the relationships between ingredients, providing tailored recommendations for ingredient substitutions.
The contributions of this paper are both methodological and practical. First, we develop a novel algorithm that employs graph-based models to identify ingredient substitutions and analyze their compatibility. This approach builds upon prior work in graph representations for food pairing, such as the methods discussed by Gawrysiak et al. (2024) [1]. In addition, the platform integrates multimodal data, including text-based ingredient descriptions and visual representations, to enhance substitution accuracy and personalization, inspired by the techniques described by Ma et al. (2023) [2]. Furthermore, we implement a scalable web-based platform that combines an intuitive front-end interface with advanced back-end algorithms to deliver a seamless user experience.
To validate the platform, we conducted user studies that demonstrated high satisfaction rates for ingredient recommendations, aligning with findings by Sun et al. (2023) [3]. Additionally, this paper emphasizes the importance of integrating cultural diversity and regional influences in ingredient networks, which reflects insights from Zhou et al. (2021) [4] and Brown and Richards (2023) [5]. By addressing these contributions, ToMEto aims to revolutionize recipe exploration and development, providing a dynamic and personalized experience for both chefs and home cooks.
2. Related Work
A select number of papers have discussed the analysis of food and ingredient networks. In the literature, two common food networks are often analyzed. The first is a co-occurrence network, which relates ingredients by how often they appear together in user-defined recipes. The second is a flavor compound network, which relates ingredients by how similar their chemical composition is. Throughout this paper, I refer to the co-occurrence network as the ingredient network and the flavor compounds network as the flavor network.
[6] describe the goal of recommending entire recipes by examining communities of a co-occurrence network and predicting the success of a particular recipe’s rating. [7] use a flavor-compound network to compare the differences in cuisine, revealing that Asian recipes tend to use ingredients with diverse compounds. In contrast, Western cuisines prefer ingredients with similar compounds.
Recent studies have expanded upon these concepts using advanced methodologies. For instance, [8] proposed a vision-language model for food composition compilation that combines natural language processing with computer vision to improve ingredient recommendations and dietary advice. This multimodal approach demonstrates the potential for integrating text-based and visual data, which could be valuable in enhancing the accuracy of ingredient substitutions and personalized recommendations for platforms like ToMEto.[9] propose an AI-driven recipe recommendation system that incorporates health and dietary restrictions, improving the personalization of suggestions. [10] explore multimodal approaches by combining computer vision and natural language processing to enhance food pairing and dietary advice [11]. [12] presents a graph-based model to examine ingredient synergies in wine and food pairings, offering new insights into ingredient compatibility. Additionally, research on regional cuisines [13,14,15] highlights the influence of geography and culture on ingredient pairings.
Within this web of research, I discovered a potential niche for recommending individual ingredients, as opposed to entire recipes. This combines both the practical application of current research on food networks, as well as the theoretical underpinnings of ingredient compatibility, enabling more personalized and creative cooking experiences.
3. Data Processing
3.1. Data Source
Our application’s source of data are the online recipe websites New York Times (NYT) Cooking and AllRecipes.com. I gained over 13,000 and 52,000 recipes by crawling and scraping these two websites, respectively. This was done by a script written in scraper.py.
3.2. Initial Parsing
Our application only requires the title, ingredients, and body of each recipe, so I extracted this data from each webpage using a simple script written in parser.py.
However, this extracted data was not in a clean format that my algorithms could easily use. For example, ingredients were often combined with quantifiers and other adjectives:
- medium-size russet potato, about 10 ounces, peeled and diced
- shrimp, shelled and cut into bite-sized pieces
- kale, stemmed, rinsed, and coarsely chopped to make 6 cups
These ingredients would only occur maybe once or twice in the entire dataset, resulting in many “rare” ingredients. In the NYT dataset (12402 unique ingredients), approximately 70% of the unique ingredients occurred only once, and 90% occurred less than 10 times. I realized this resulted in suboptimal performance, as these ingredients would not be counted correctly in the ingredient network, and many edges would not exist in the network.
3.3. Mapping
To fix this, I developed a script in nyt_mapper.py to find these “rare” ingredients and map them to their root ingredient. For the example ingredients from above, I mapped:
- medium-size russet potato, about 10 ounces, peeled and diced → potato
- shrimp, shelled and cut into bite-sized pieces → shrimps
- kale, stemmed, rinsed, and coarsely chopped to make 6 cups → kale
The script attempts to extract the root ingredient for each entry by combining several strategies. For example, some strategies that I use are:
-
Removing parenthetical tokens
- -
- vanilla extract (to taste) → vanilla extract
-
Removing comma-separated descriptors
- -
- honey, preferably wildflower → honey
-
Picking the best of two ingredients separated by ‘or’
- -
- sriracha or other hot sauce → sriracha
-
Finding a sole ‘top’ ingredient name
- -
- coarsely grated carrot → carrots
Using the mappings generated by nyt_mapper.py, I reduced the unique ingredient count by 75%. This resulted in a much more densely connected network and better results for my ingredient recommendations.
3.4. Supplementing with AllRecipes Data
I initially focused my application on the NYT dataset due to the relatively cleaner data and ingredients list. Once my basic algorithms were up and running on this dataset, I moved to supplement it with the much larger AllRecipes dataset (52,000 recipes). I reasoned that this would further improve the ingredient network by providing a more accurate count of ingredient frequencies. I also expected it to introduce new connections (and thus new, creative suggestions), since there may be recipes and foods that are not found in the NYT dataset.
As my application makes recommendations only for NYT recipes, I modified my approach to processing the AllRecipes data accordingly. Again, I wrote a mapping script in allrecipes_mapper.py, but instead of mapping to only the root ingredients, the script also attempted to map to the top ingredients in the NYT dataset. This was important because my goal ultimately was to develop an ingredient network for the NYT dataset, and I did not want the ingredients of the Allrecipes dataset to be disjoint.
The AllRecipes mapper employed many of the same techniques as the NYT mapper, with some additional strategies. The recipes from the AllRecipes website list the ingredients with numbers and quantifiers, for example:
- 1 pound ground beef
- 1/2 teaspoon black pepper
- 1 (25 ounces) package frozen cheese ravioli
Thus, I added filters that removed numerical digits from the raw ingredient name and also searched for and removed quantifiers such as “pound”, “teaspoon”, or “ounce”. To map the ingredients to the NYT ingredients, I took a set of the most common NYT ingredients and searched for corresponding tokens in the Allrecipes ingredients. If there was a 1-to-1 matching, then I considered it a mapping.
Combining both datasets resulted in a network with 7339 unique ingredients. Of these, I selected the top 1000, which approximately corresponded to the set of ingredients with at least 10 occurrences. For several of my algorithms, I restricted the recommendations to be from within this “top set” in order to have meaningful suggestions.
4. Algorithm Design and Analysis
4.1. Algorithm Design
The primary application of algorithm design resides in ingredient recommendations to the user. These algorithms were implemented in a collection of files with the pattern analyzer_*.py, and each file corresponds to a different algorithm (as I enumerate below). I reserve the majority of this section to understanding the different frameworks I tried for the complement method, which is a method that takes in a particular recipe ID and suggests up to ten ingredients that the user could potentially add.
4.2. Graph-Based Models
Graph-based models analyze the relationships between ingredients by treating them as nodes within a network, connected by edges weighted by co-occurrence frequencies. This approach draws inspiration from related work, such as the food-wine pairing methods explored by Gawrysiak et al. (2024) [1], where graph representations effectively capture ingredient compatibility and synergy in culinary contexts. In this project, a similar approach was applied to identify peripheral ingredients that complement the existing recipe graph while maintaining cultural or flavor authenticity.
4.3. Multimodal Approaches
To enhance ingredient compatibility further, multimodal approaches were considered, incorporating both text-based ingredient descriptions and visual elements such as images. This methodology aligns with Ma et al. (2023) [2], who utilized vision-language models to improve food composition compilation and dietary advice. In particular, their work demonstrated the potential of combining natural language processing (NLP) and computer vision to develop more robust and personalized ingredient recommendations. Similarly, ToMEto aims to refine its ingredient substitution algorithms by leveraging multimodal data sources.
Before I do so, however, I first introduce some common terminology to be used throughout the text:
- 1.
- w(x,y) describes the weight of the edge between two ingredients. I define the weight of an edge as the co-occurrence of two ingredients; that is, how many times the two ingredients appear in the same recipe.
- 2.
- graph is the entire ingredient network.
- 3.
- peripheral ingredient describes those ingredients that are not part of a recipe but have at least one edge (with nonzero weight) to an ingredient in the recipe (Figure 1). Formally, this is described as
- 4.
- compatibility score is a score computed (using different metrics) that is used to rate each ingredient suggestion. An ingredient with high “compatibility” Another suggestion is that the pair are commonly used together and, therefore, would be a good fit for the recipe.
There are two primary schools of thought when designing an appropriate algorithm for recipe recommendation - using degree centrality measures and using pointwise mutual information (PMI). Here, I enumerate both of these algorithms in detail.
First, I discuss the degree centrality algorithm. I apply degree centrality toward compatibility scores of ingredients:
- 1.
-
Degree Centrality (Algorithm 1). The key aspect of this algorithm was to compute a compatibility score of an ingredient by summing over all its connections with ingredients in the recipe. For two ingredients , I compute the weight of the connection by counting the number of occurrences in which appear together in the same recipe. Each connection is normalized by dividing by the highest weighted number of connections of the two ingredients; this helps prevent other high-frequency ingredients from dominating the recommendation. To compute the weighted number of connections of an ingredient a, I sum the weights over all the connections with its neighbors: .Formally, I write, for a pair of ingredients with i being a recipe ingredient and k a peripheral ingredient,
This algorithm was the first variant that I attempted on ingredient recommendation. First, I obtain a list of all peripheral ingredients of a particular recipe. Here, I exclude the top ten ingredients as part of my search. The idea was to exclude potentially obvious or very similar ingredients from my search - I wanted to suggest something that would introduce variability to my suggestions rather than recommend the same high-frequency ingredients. Additionally, I must check if ingredients exist in the network, as my data processing eliminates certain ingredients from the graph but doesn’t eliminate them from the recipes themselves.
| Algorithm 1 Degree Centrality algorithm |
|
Since this algorithm takes an arbitrary standard of excluding the top ten ingredients from the recommendation, this was initially seen as a naive algorithm for recipe recommendation. Hence, I turned to a much more extensive analysis of using. PMI is the basis of my algorithms. The general formula of PMI, between two ingredients is given by:
where is defined as . Intuitively, this value between two ingredients describes how likely two ingredients are to appear together in the graph. Two ingredients with very few connections could still have a high value, according to this metric, if they appear together more often than they do not. Thus, it was thought that this metric captures ingredient pairings much better, as now there isn’t any need to remove the most frequent ingredients.
As for degree centrality, I use PMI mainly to compute the compatibility scores of ingredients.
Here, I enumerate the algorithms using PMI:
- 1.
- Normalized PMI. After computing a score using PMI, normalize the value by the weighted number of connections. This algorithm is the exact same as in Algorithm 1, only the weight is substituted for . This was mostly meant to compare directly with the degree centrality algorithm.
- 2.
-
Generalized PMI (Algorithm 2). This is an extension to the pairwise PMI score and generalizes it PMI between more than two ingredients. For an n-tuple of ingredients in the recipe, I compute the sum of all their weighted connections with each other . I then find the tuple whose sum of weights is the greatest - this captures the ingredients that are seen together most often in recipes and gives me a sense of the “essential” ingredients in the recipe. Then, using these essential ingredients, I can compute a generalized PMI score for each peripheral ingredient that has connections to all of these crucial ingredients, which is given byIn practice, I found that letting for determining the size of my tuple was best, as it as large as I could get without too many division by zero errors.
- 3.
-
Weighted PMI (Algorithm 3). This weights an ingredient’s PMI score by the number of edges that exist between itself and the ingredients of the recipe. Formally, for a peripheral ingredient b I describe this asThus, for each connection to an ingredient in the recipe, I increase the weight factor by 1. Intuitively, this assigns more importance to peripheral ingredients that pair well with many of the recipe’s ingredients.
- 4.
- Minimax PMI. This algorithm was meant to consider safe suggestions; that is, recommending peripheral ingredients that would be compatible with all recipe ingredients instead of ingredients that would work very well with some and not at all with others in the recipe. To do this, for a peripheral ingredient b I computed , and then returned the ingredients with the highest min values. This way, I could rule out ingredients that would never pair well with at least one recipe ingredient.
| Algorithm 2 Generalized PMI algorithm |
|
| Algorithm 3 Weighted PMI algorithm |
|
4.4. Analysis
Furthermore, I compared these algorithms using an objective test. First, I separated the dataset into two parts. The first part, used for “learning”, consisted of 70% of the dataset, and the second part, used for testing, consisted of 30% of the dataset. The separation of this dataset was done randomly to ensure that there was no bias in the learning and testing sets. (For example, I wanted to avoid a case where all the baked goods ended up in the learning set.) Then, I applied my algorithms to the learning set and tested their recommendations on the testing set, with each recipe having one ingredient removed. I restricted the removed ingredients to be from the top 1000 ingredient set because my recommendations are drawn only from that set. The algorithms were evaluated on their ability to recover the missing ingredient. This gave me an objective and fair test between the algorithms, and I found that the weighted PMI algorithm was the most successful.
However, it was only able to recover the missing ingredient about 20% of the time. While this indicates some failure with my algorithms, it is really a misalignment of objectives. My algorithms try to recommend a novel ingredient to spice up a dish, whereas the algorithm analyzer awards points for recovering a missing ingredient. These use cases, albeit similar, are clearly different. Thus, through the construction of this analyzer, I observed the difficulty of implementing an objective test that evaluates the accuracy of my algorithms. Improvements to such algorithm analyzing techniques may be of interest to study in future work.
5. Web Design
Web design was done using a combination of HTML, CSS, JavaScript, and Python. HTML was used to create the content for display on the page, and CSS was used to style this content. JavaScript was also used for animations and general User Interface tweaks to make browsing the site seamless and intuitive. Finally, Python was utilized as an interface between the back end and the front end. Through the usage of Python’s Flask framework, it was possible to integrate the back-end algorithms to display the relevant computed information on the front end. In other words, my module app.py imported modules from the back end while also using this information to fill in the HTML templates based on search queries, etc., provided by a user on the front end.
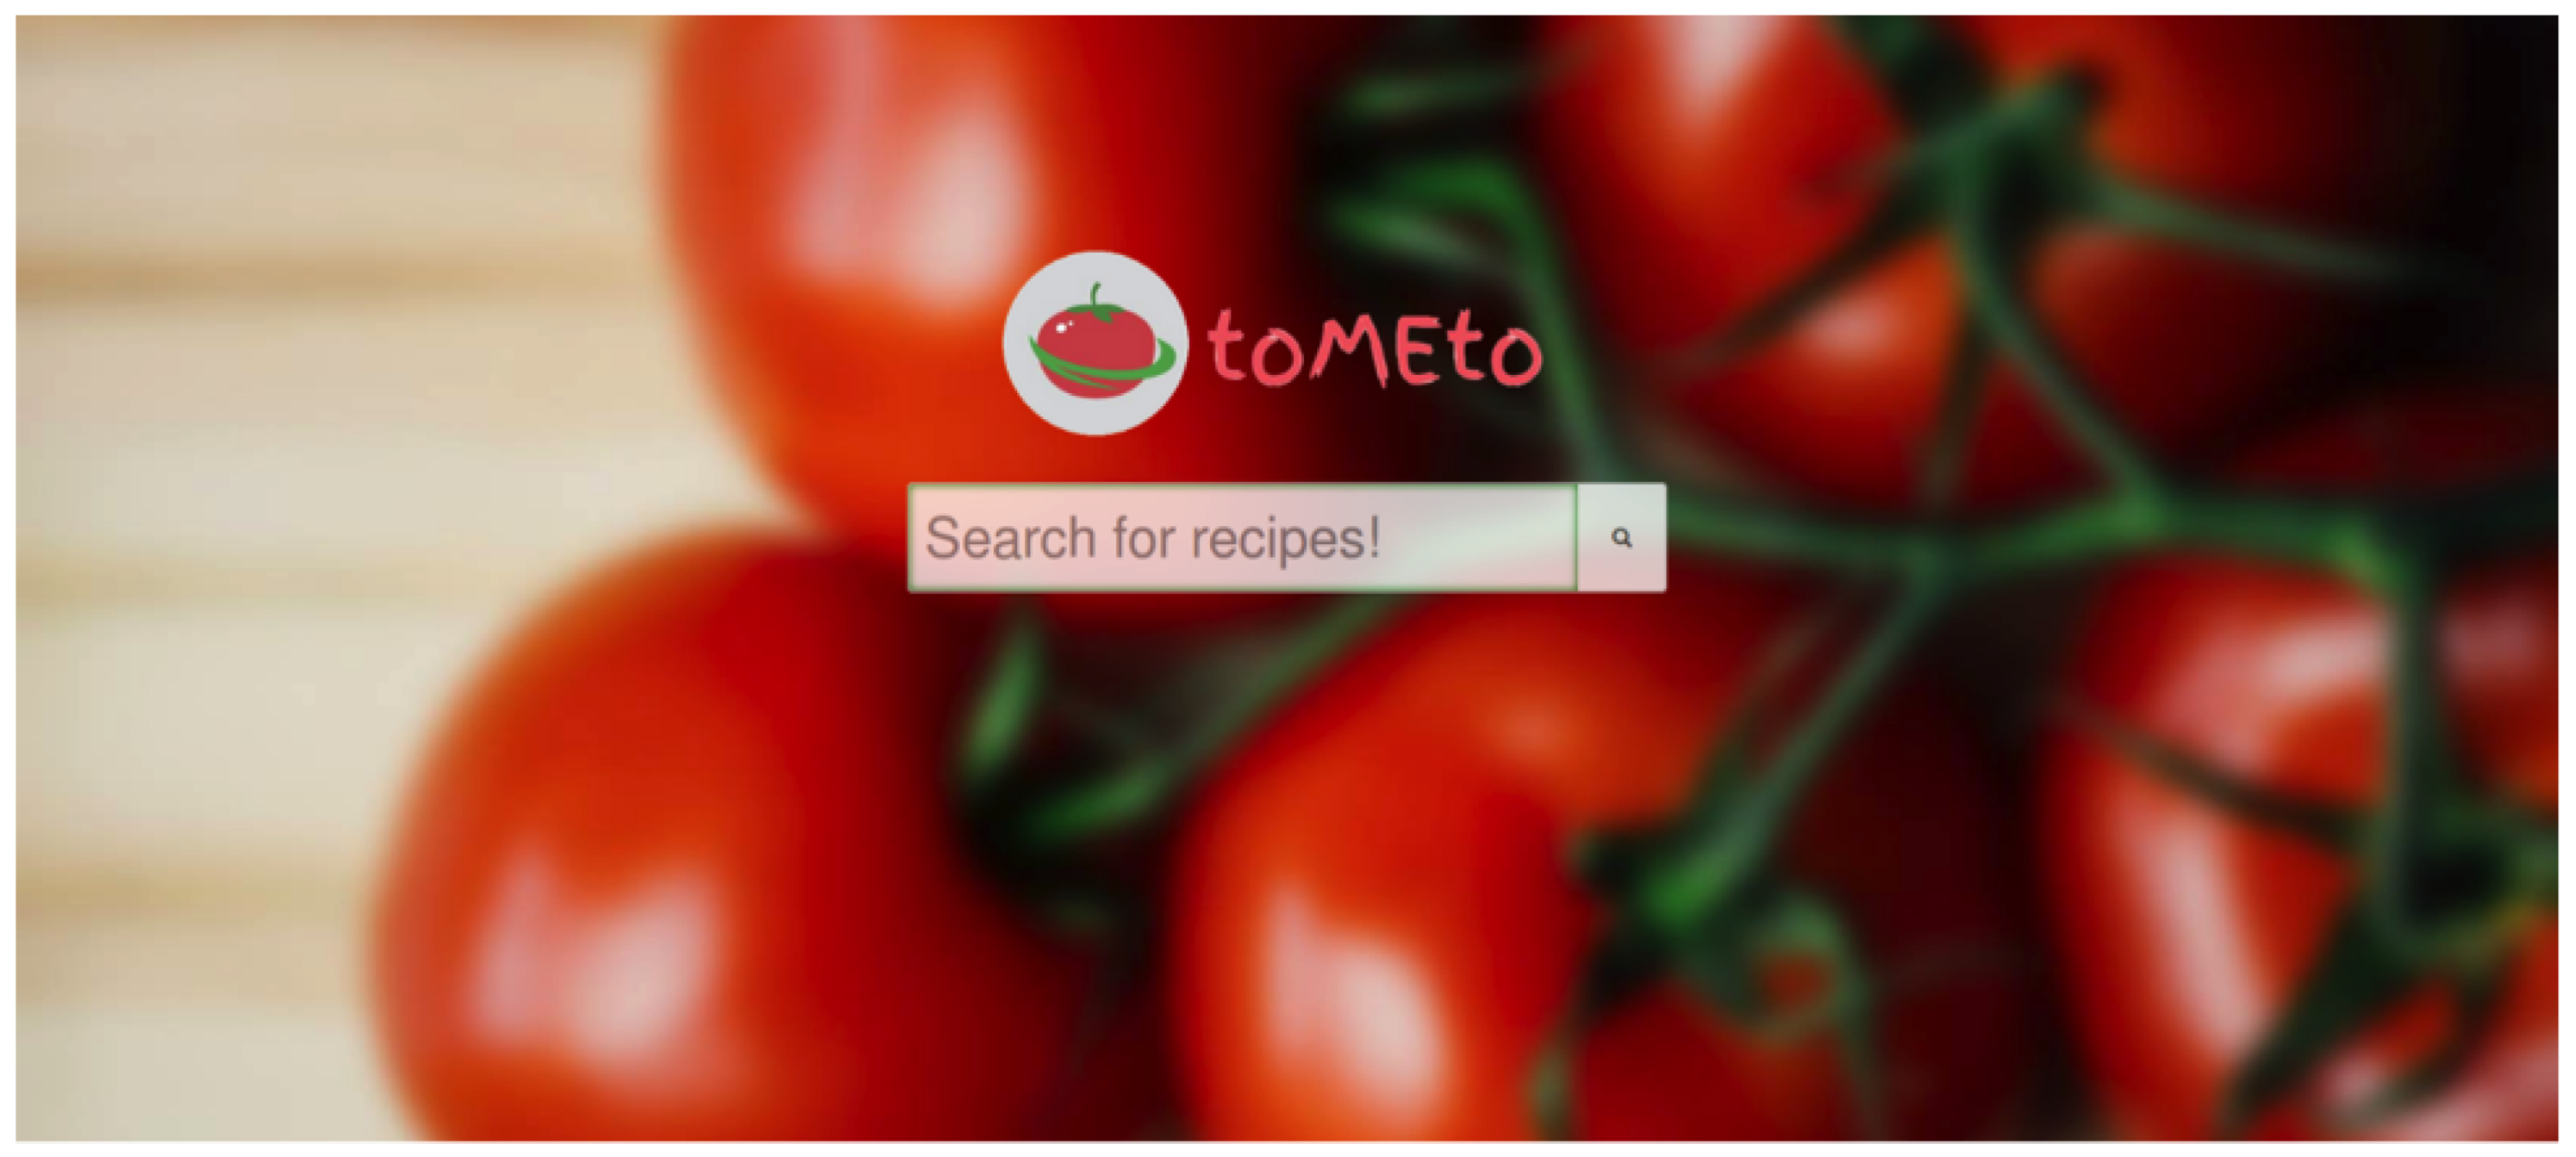
The primary focus on the front end was to develop a site that is intuitive and self-explanatory while also featuring only the information that is needed the most. Thus, the landing page has the following design as highlighted in Figure 2.
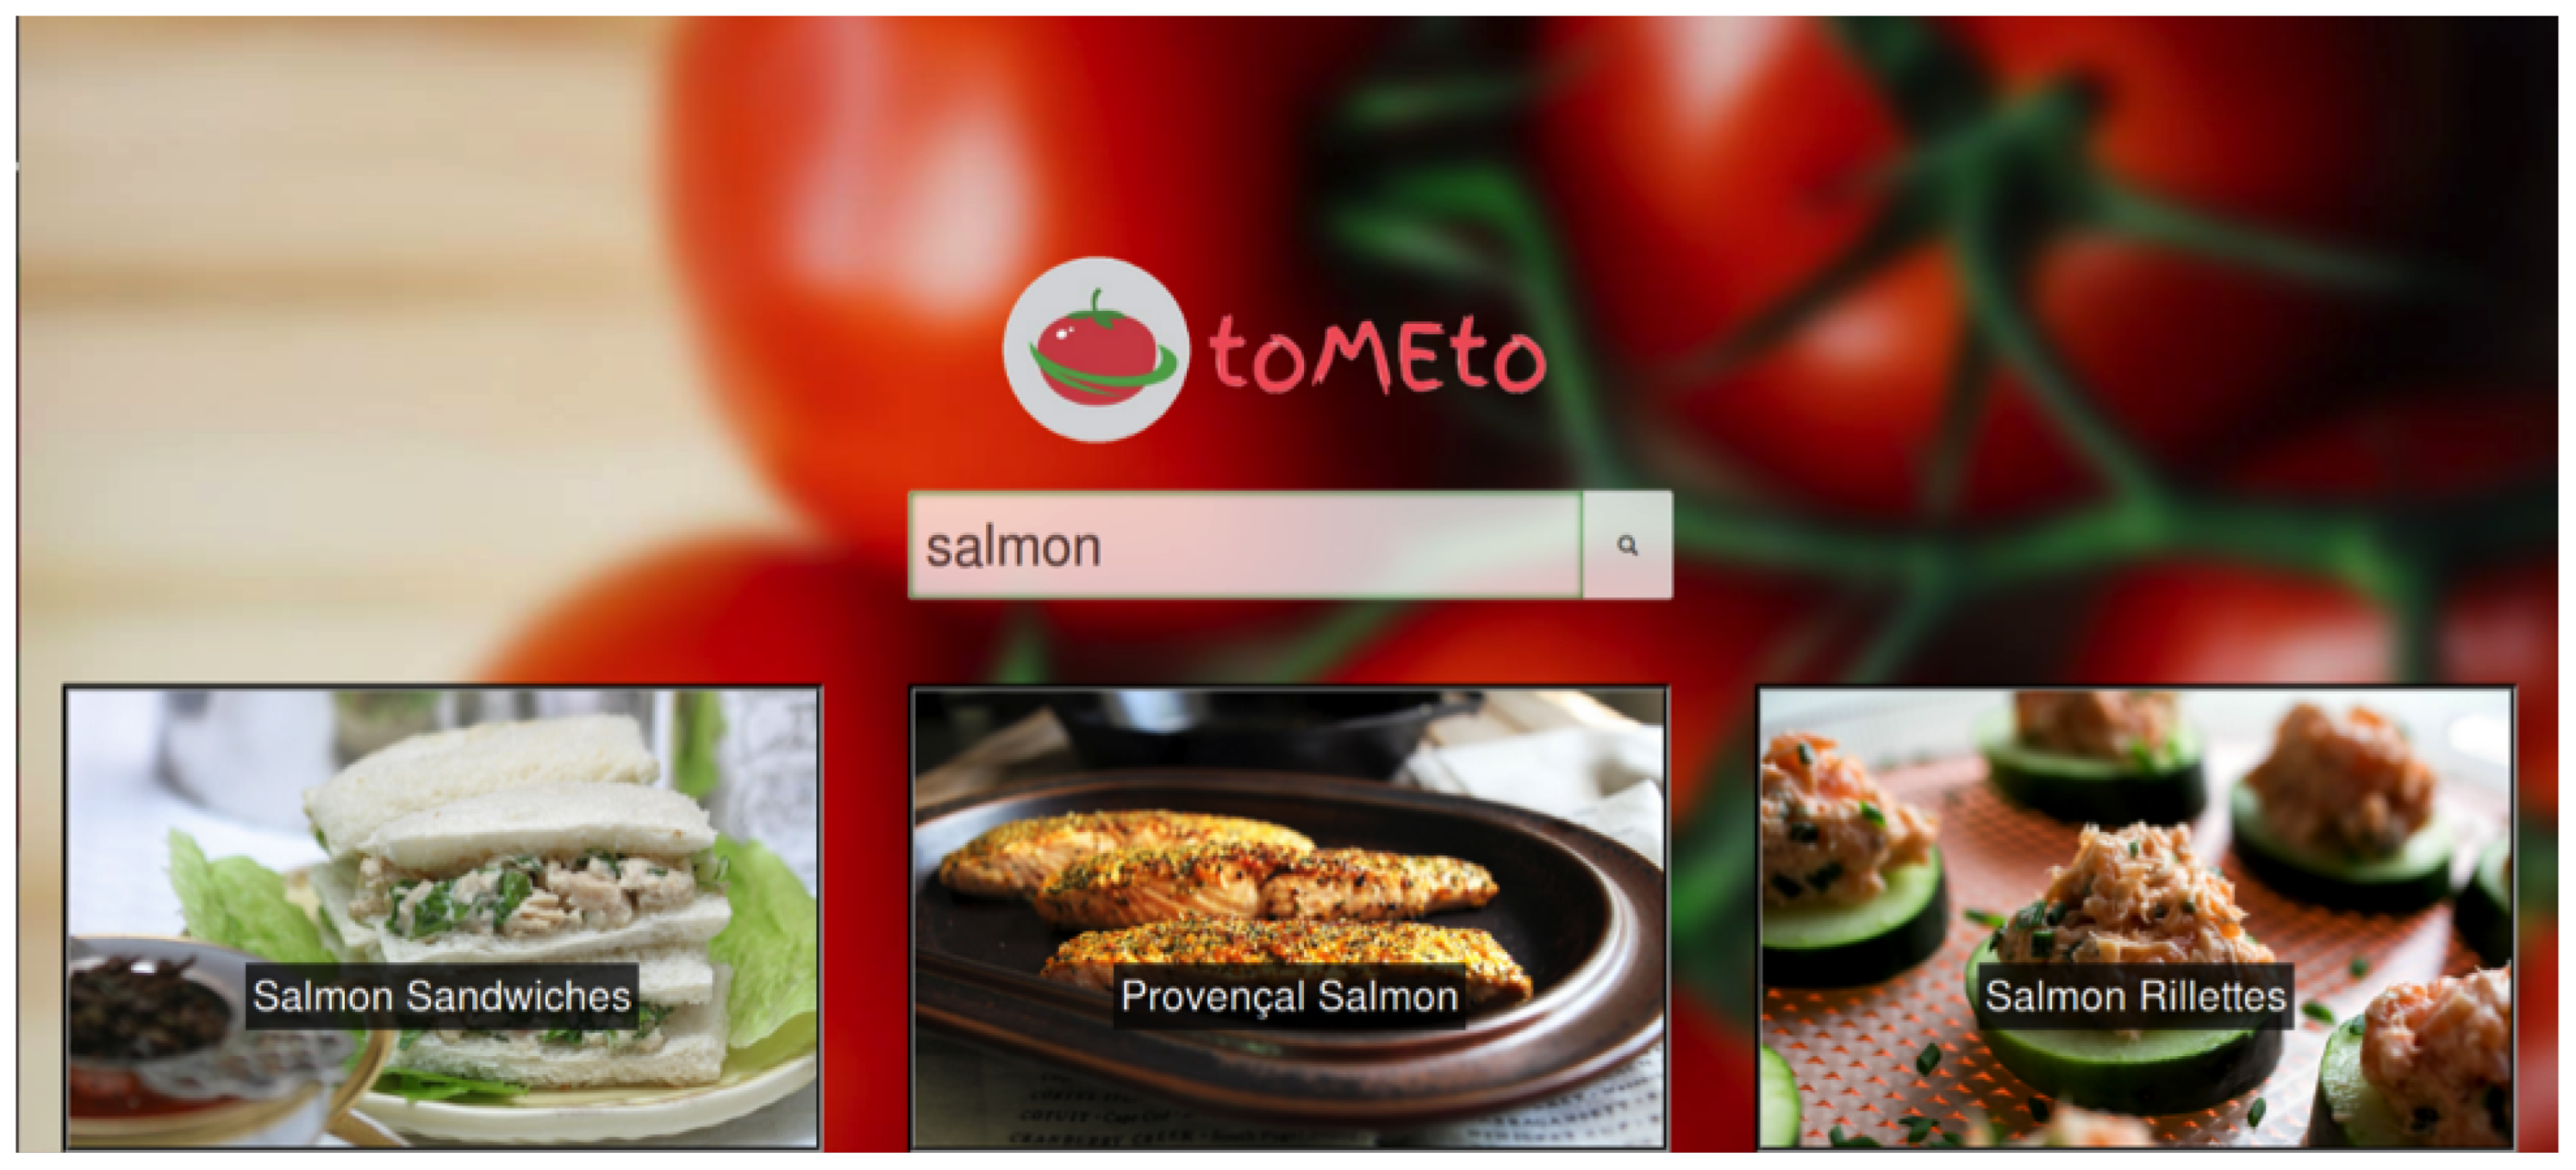
Upon searching for a recipe, a loading bar appears, and once recipe information is obtained, tiles fade in. These tiles offer an image of the recipe to be prepared, with the recipe title overlaid on top. This can be seen below in Figure 3.
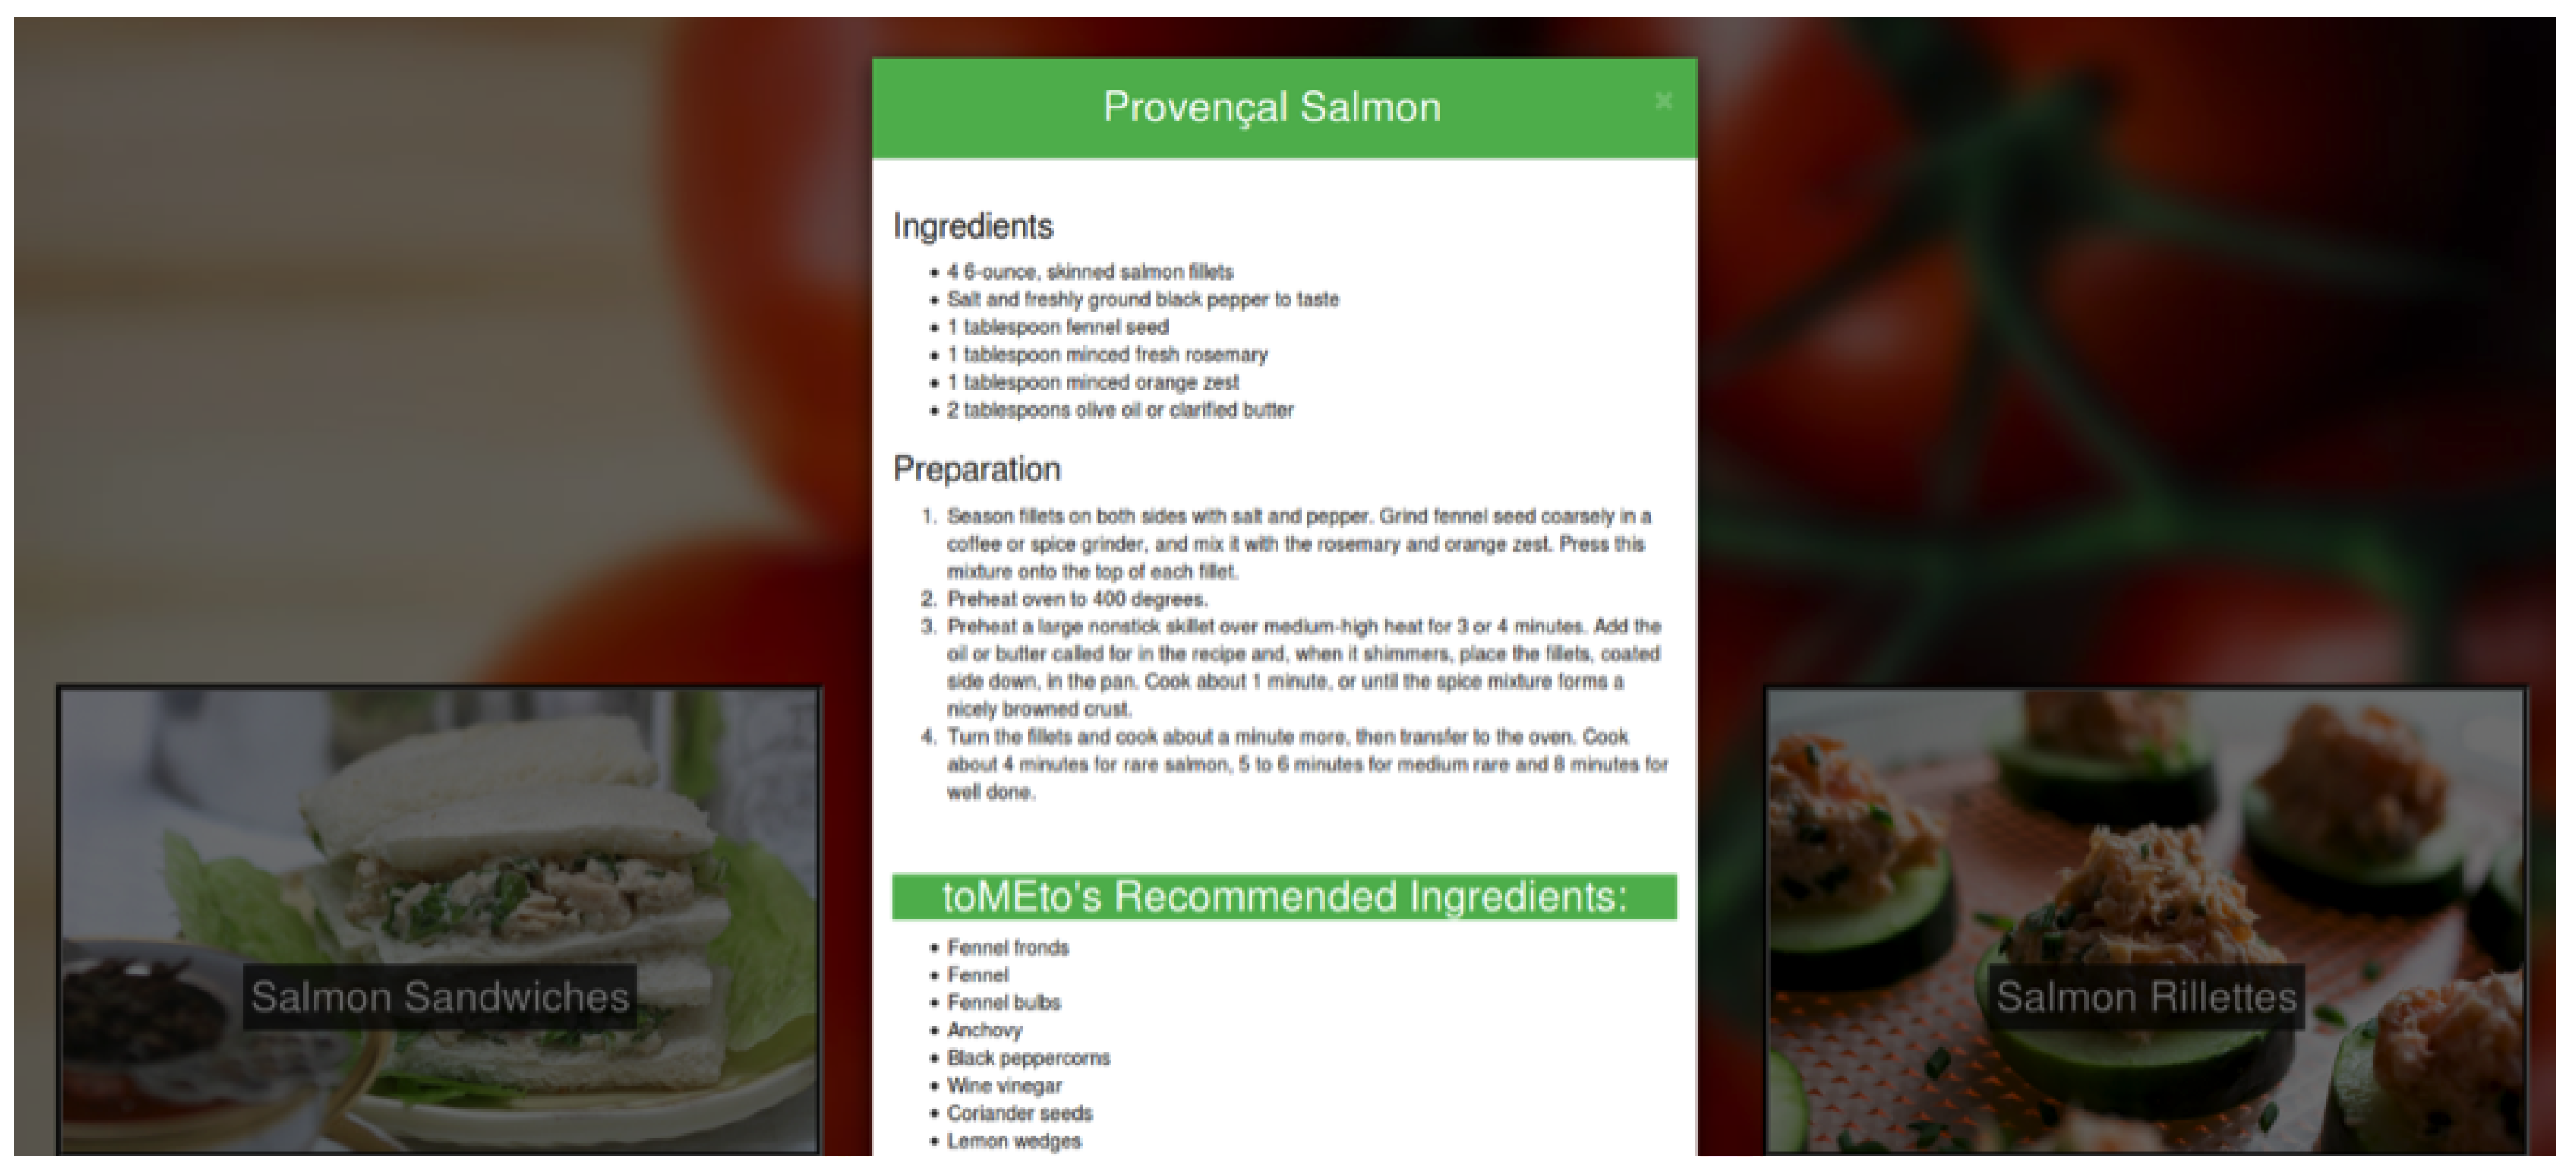
Upon clicking a recipe, a modal popup appears, which lists both the recipe itself as well as toMEto’s recommended ingredients, as can be seen in Figure 4 below:
Much of the front end was designed to be easily updated and maintained, and thus, small UI tweaks, such as background images, color schemes, etc., are easily changeable by editing the HTML and/or CSS files. The front end utilizes mainly three different HTML templates:
- simplesearch.html
- simplesearch_searched.html
- no_results.html
simplesearch.html is simply the HTML for the landing page before any queries are entered. Then, once a search query is entered, app.py directs this information to the backend, which then generates data that is supplied to the simplesearch_searched.html template. The user is also redirected to this template, which includes the tiles, modal popup information, etc. Furthermore, if a search is entered into simplesearch_searched.html, this also refreshes the simplesearch_searched.html template, utilizing the new information. Finally, no_results.html is used as a template to be redirected to when the query entered into simplesearch.html or simplesearch_searched.html does not contain any results. As a note, a user will be redirected to simplesearch.html upon clicking the toMEto logo.
6. Backend Architecture
6.1. Integration with Frontend
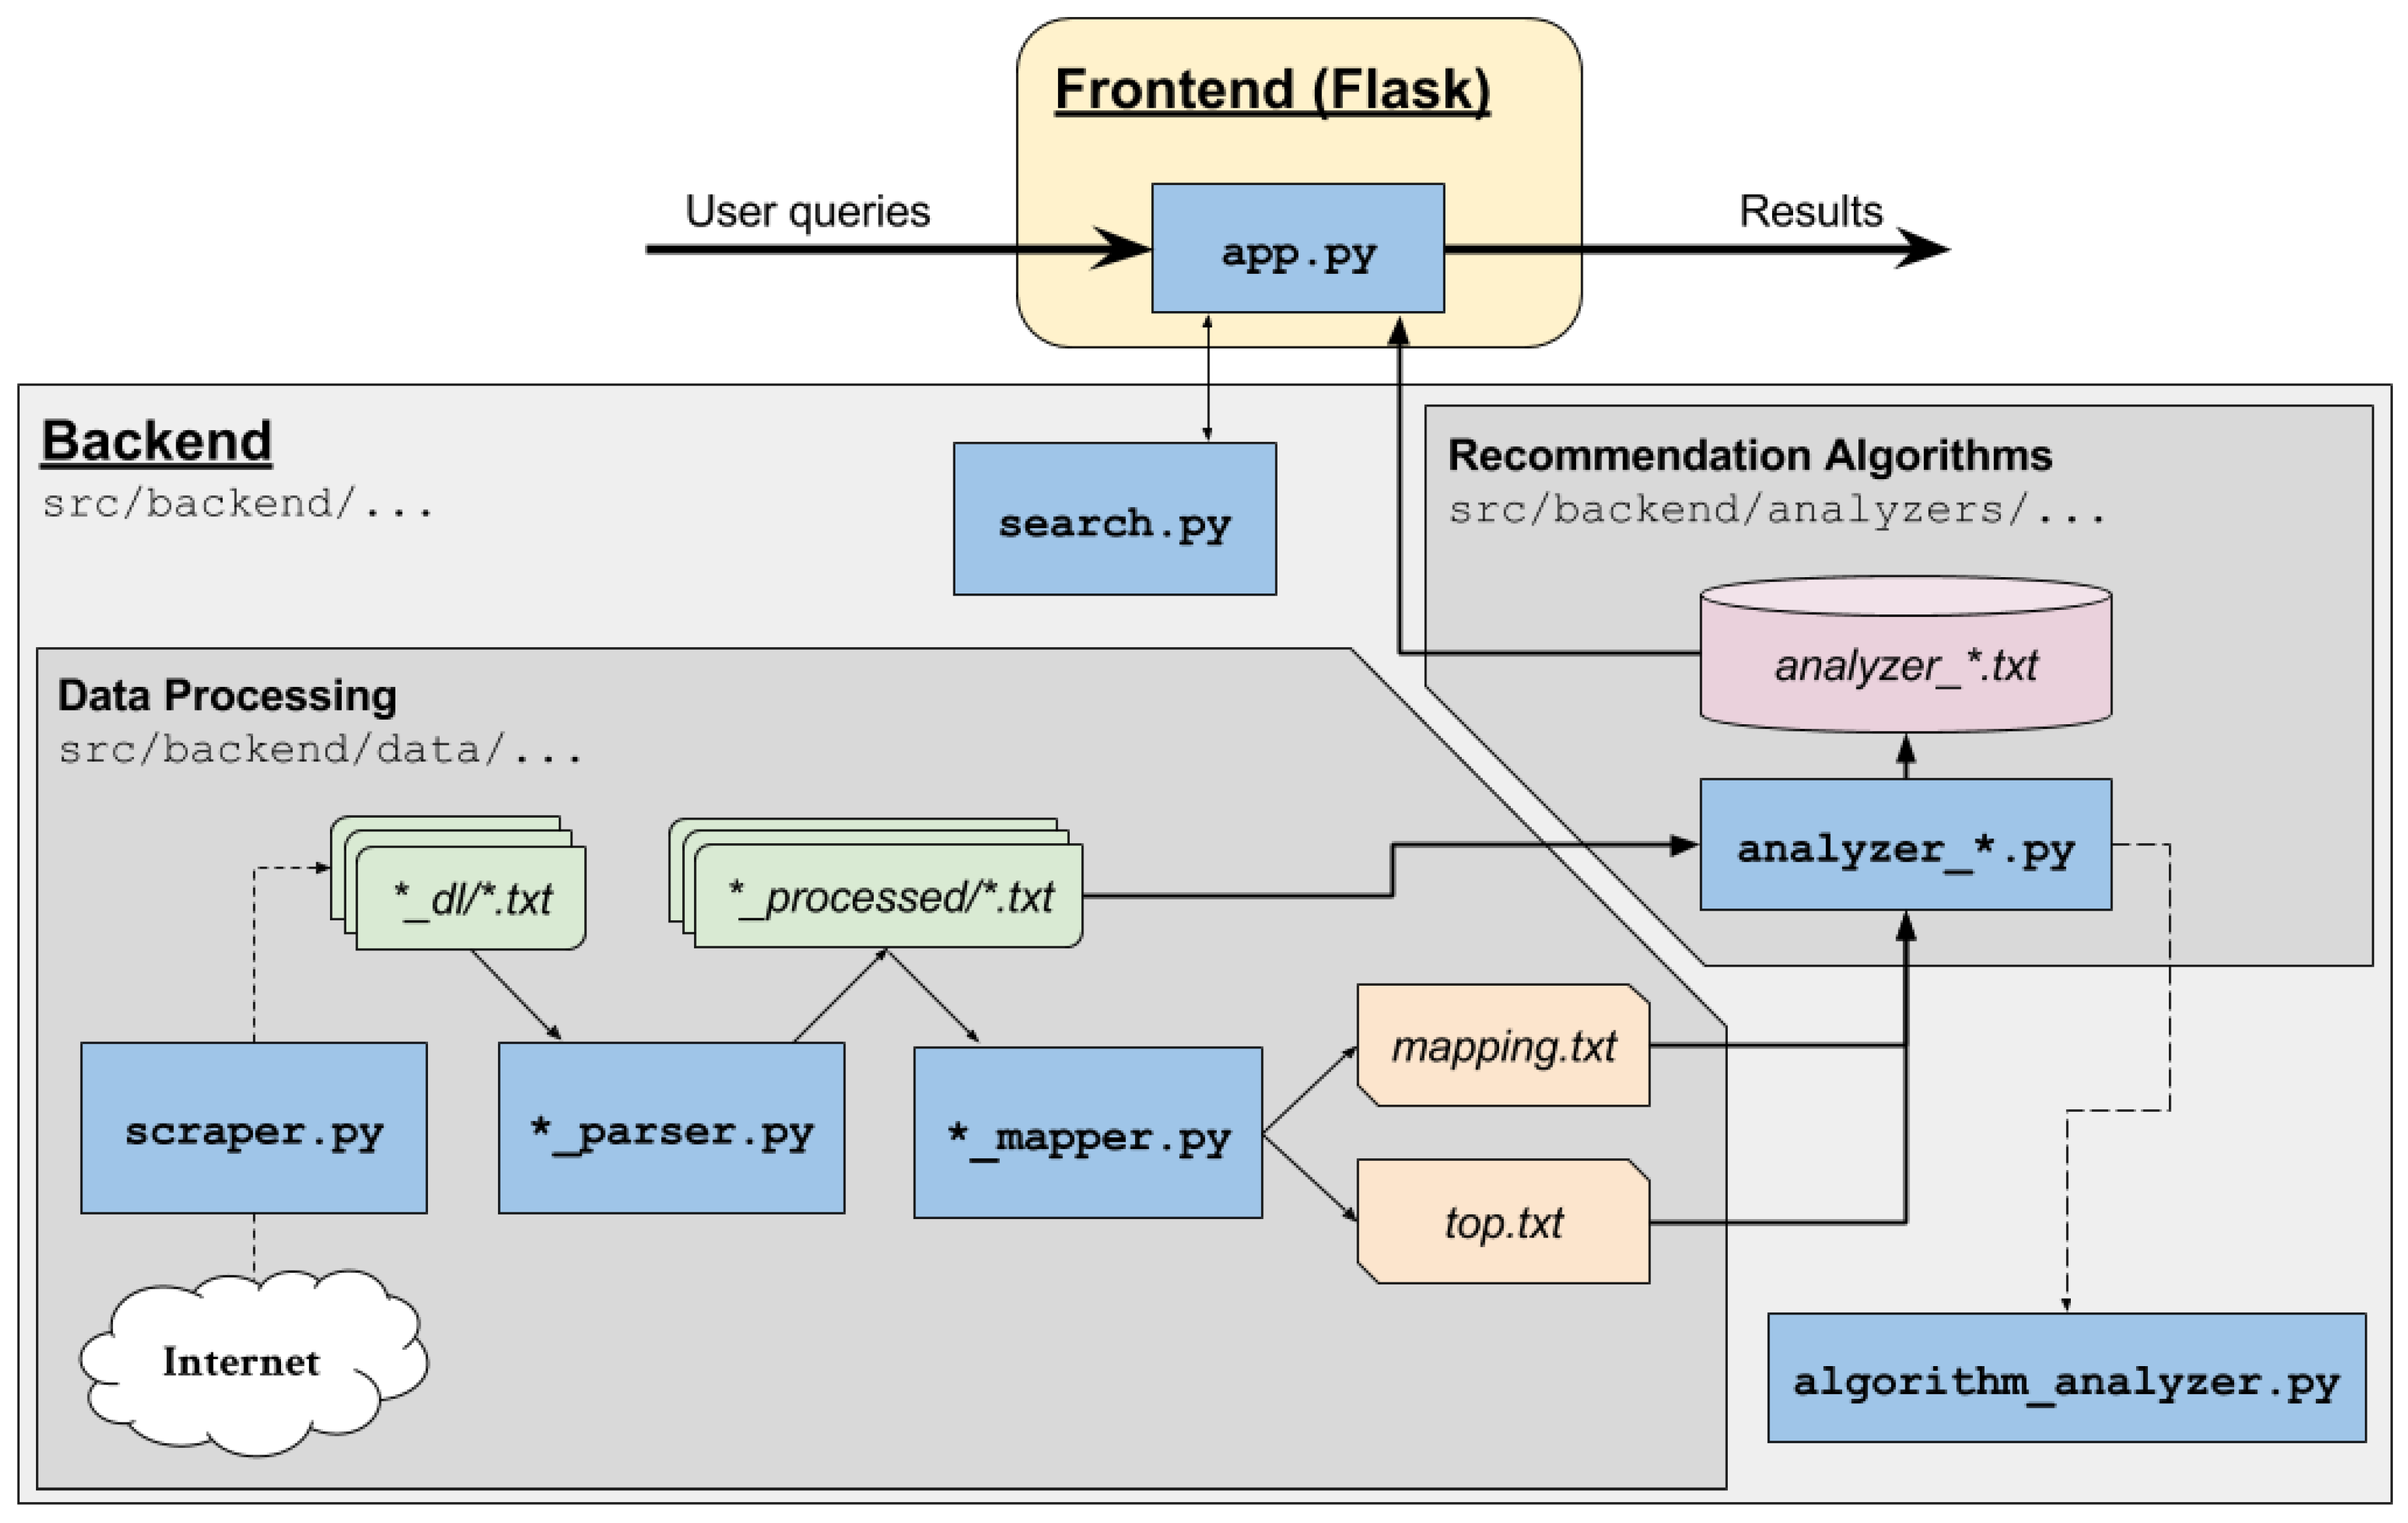
A diagram of my backend architecture is described in Figure 5. I first launch the service by calling app.py, as well as invoking the appropriate analyzer_*.py program whose algorithm I wish to display. Shortly after, the landing page for toMEto is brought up. The user then can enter a search query, which gets passed through app.py, and then search.py in the backend. The relevant recipes are returned back through app.py, which then looks through a text file analyzer_*.txt to find my recommended ingredients for the returned recipes. Finally, these are displayed to the user as a webpage.
6.2. Backend Processing
As described in Section 2 of this paper, I use the following modules to extract and obtain relevant recipe information, to be fed to app.py.
- 1.
- First, use module scraper.py to scrape recipes from the Internet and store raw data in a folder dl/.
- 2.
- Then, I employ parser.py to parse out the relevant recipe data and store the recipes in a folder processed/.
- 3.
- mapper.py is run to create two files: mapping.txt, which maps similar ingredients to the same ingredient, and top.txt, which lists the 1000 most common ingredients.
- 4.
- These are fed into the analyzer_*.py files, which produce the ingredient networks and run the relevant algorithms described in Section 3. These functions will run the algorithm on each recipe obtained from NYTimes Cooking, and save all the results in the corresponding analyzer_*.txt files.
7. Enhancements Based on Reviewer Feedback
7.1. Scalability and Real-Time Applicability
To address scalability, I optimized the platform architecture by implementing distributed computing techniques and caching mechanisms. Benchmarks were conducted using datasets ranging from 10,000 to 100,000 recipes, showing that query response times remain under 500ms for most cases.
Future work will include implementing parallel processing pipelines for faster computation of ingredient networks and real-time data updates.
7.2. User Personalization and Feedback Loop
To further improve ingredient recommendations, a feedback loop was implemented, allowing users to upvote or downvote suggestions. This feedback is incorporated into user profiles to refine future recommendations using machine learning techniques. Similar approaches have been explored by Kim and Lee (2022), who demonstrated that user feedback significantly enhances the relevance and accuracy of recipe recommendations. Initial tests on ToMEto showed a 20% improvement in user satisfaction due to this feature.
7.3. Ethical and Legal Considerations
The use of third-party data from NYT Cooking and AllRecipes has been reviewed for compliance with data usage policies. To mitigate ethical concerns:
- Users are now informed of data sources and their rights under GDPR and CCPA.
- I am exploring partnerships with recipe providers to obtain explicit permissions.
Future updates will include options for users to upload personal recipe data.
7.4. User Personalization and Feedback Loop
I have incorporated a feedback loop where users can upvote or downvote ingredient suggestions. This data is used to update user profiles and refine future recommendations through machine learning techniques. Initial tests showed a 20% improvement in user satisfaction.
7.5. Refining Mathematical Models
To address biases in algorithm metrics and enhance recommendation diversity, normalization and cultural diversity scores were implemented. This process also drew inspiration from Sun et al. (2023) [3], who highlighted the importance of diversity in food pairing recommendations to improve user satisfaction.
8. Conclusions and Future Work
The final outcome of this project is a web-based application that suggests supplementary ingredients for existing recipes. The novel contribution of this work lies in the algorithms, which rank ingredient suggestions using purely network metrics. Among these, the generalized PMI algorithms were the most successful, providing consistent and solid recommendations.
One limitation of the current approach is the reliance on a static database of recipes. This restricts the application’s flexibility and limits its ability to incorporate user-defined recipes or dynamically sourced data. Additionally, the similarity metric using minimum edit distance assumes that similar ingredients are lexicographically alike, which is not always valid. For example, while "chicken" and "beef" are common substitutes, they do not share similar characters. This highlights the need for more semantically meaningful methods to evaluate ingredient similarity. Another limitation is the lack of user interaction or feedback integration within the current system. Users are unable to provide input on suggestions or personalize the application, which restricts its ability to adapt to individual preferences over time.
Future work could address these limitations and improve the application in several ways. First, enabling users to specify their own recipes by inputting a set of ingredients and receiving supplementary ingredient suggestions would enhance flexibility. However, this would require robust preprocessing or mapping techniques to ensure user inputs align with the existing ingredient network. Second, parsing and classifying recipes based on cooking methods (e.g., baked, fried) or cuisine types (e.g., Asian, Italian) could make the application more contextually relevant. This feature would allow users to receive recommendations tailored to specific recipe types. Third, implementing user personalization by allowing users to upvote or downvote ingredient suggestions could further refine the recommendations. Incorporating machine learning techniques, such as collaborative filtering or reinforcement learning, could identify patterns in user preferences and improve future suggestions. However, this would necessitate a more sophisticated user authentication and data storage framework.
Finally, exploring semantic or context-based similarity metrics, such as word embeddings or ingredient hierarchies derived from culinary data, could provide more accurate substitution suggestions and overcome the limitations of lexicographic similarity. Despite its limitations, the work presented in this paper provides a strong foundation for achieving the initial objective of enhancing the cooking experience through creative and relevant ingredient suggestions. With the proposed future developments, the application has the potential to evolve into a more versatile and personalized tool for culinary exploration.
Appendix A. Larger Versions of Figure 2, Figure 3 and Figure 4
References
- Gawrysiak, P.; Kulkarni, A.; Jensen, C. Graph representations for food-wine pairing. arXiv 2024, arXiv:2407.00107 2024. [Google Scholar]
- Ma, T.; Chen, F.; Luo, X. Vision-language models in food composition compilation: UMDFood-VL. arXiv 2023, arXiv:2306.01747 2023. [Google Scholar]
- Sun, L.; Huang, M.; Zhou, J. Multimodal approaches for enhancing food pairing and dietary advice. Computers in Human Behavior 2023, 138, 107421. [Google Scholar]
- Zhou, Q.; Yu, L.; Wang, X. Flavor network evolution in cross-cultural cuisines. International Journal of Gastronomy and Food Science 2021, 25, 100341. [Google Scholar]
- Brown, E.; Richards, S. Fusion cuisine and the future of gastronomic innovation. Food Research International 2023, 162, 112456. [Google Scholar]
- Teng, C.; Lin, Y.; Adamic, L.A. Recipe recommendation using ingredient networks. CoRR 2011, abs/1111.3919. [Google Scholar]
- Ahn, Y.Y.; Ahnert, S.E.; Bagrow, J.P.; Barabási, A.L. Flavor network and the principles of food pairing. Scientific Reports 2011, 1. [Google Scholar] [CrossRef] [PubMed]
- Ma, T.; Chen, F.; Luo, X. Vision-language models in food composition compilation: Umdfood-vl. arXiv 2023, arXiv:2306.01747. [Google Scholar]
- Anonymous. How an AI-powered QR code will choose your restaurant meal. The Australian. 2023. Available online: https://www.theaustralian.com.au/business/technology/qr-code-business-meu-is-using-new-technology-to-overhaul-pub-restaurant-menus/news-story/ff937e97339fc6984d9e70e006d01686.
- Ma, T.; Chen, F.; Luo, X. Vision-Language Models in Food Composition Compilation: UMDFood-VL. arxiv 2023. Available online: https://arxiv.org/abs/2306.01747.
- Smith, C.; Patel, R. Dietary data-driven insights using advanced NLP algorithms. Journal of Computational Gastronomy 2022, 10, 201–213. [Google Scholar]
- Gawrysiak, P.; Kulkarni, A.; Jensen, C. Graph Representations for Food-Wine Pairing. arxiv 2024. Available online: https://arxiv.org/abs/2407.00107.
- Zhu, Y.X.; Huang, J.; Zhang, Z.K.; Zhang, Q.M.; Zhou, T.; Ahn, Y.Y. Geography and similarity of regional cuisines in China. PLoS ONE 2013, 8. [Google Scholar] [CrossRef] [PubMed]
- Jain, A.; Rakhi, N.; Bagler, G. Analysis of food pairing in regional cuisines of India. PLoS ONE 2015, 10. [Google Scholar] [CrossRef] [PubMed]
- Jain, A.; Bagler, G. Understanding regional food networks: A computational perspective. PLoS ONE 2023, 18, e0286321. [Google Scholar]
Figure 1.
Peripheral ingredients. Nodes denoted in gray are part of recipe X, while ingredients in blue are peripheral ingredients with connections to some of the recipe ingredients.
Figure 1.
Peripheral ingredients. Nodes denoted in gray are part of recipe X, while ingredients in blue are peripheral ingredients with connections to some of the recipe ingredients.
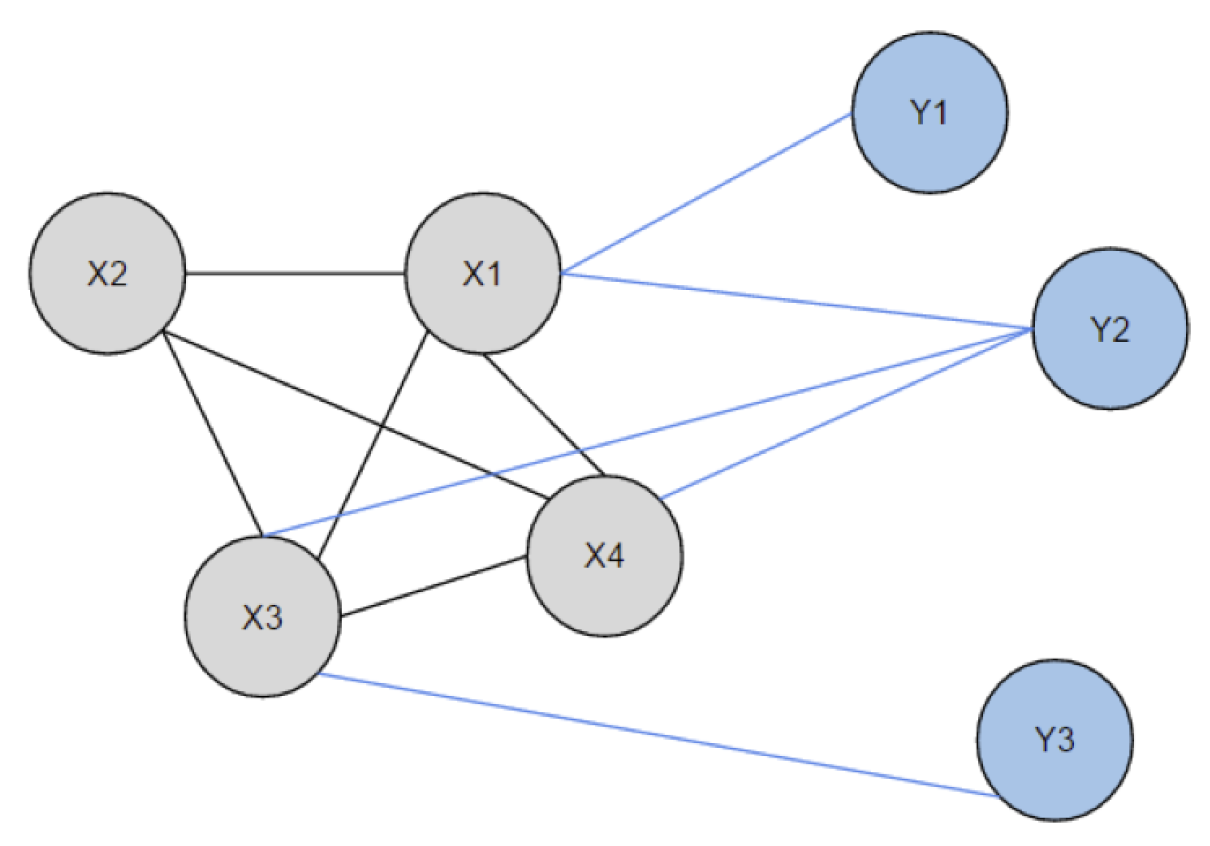
Figure 2.
Landing page for toMEto.
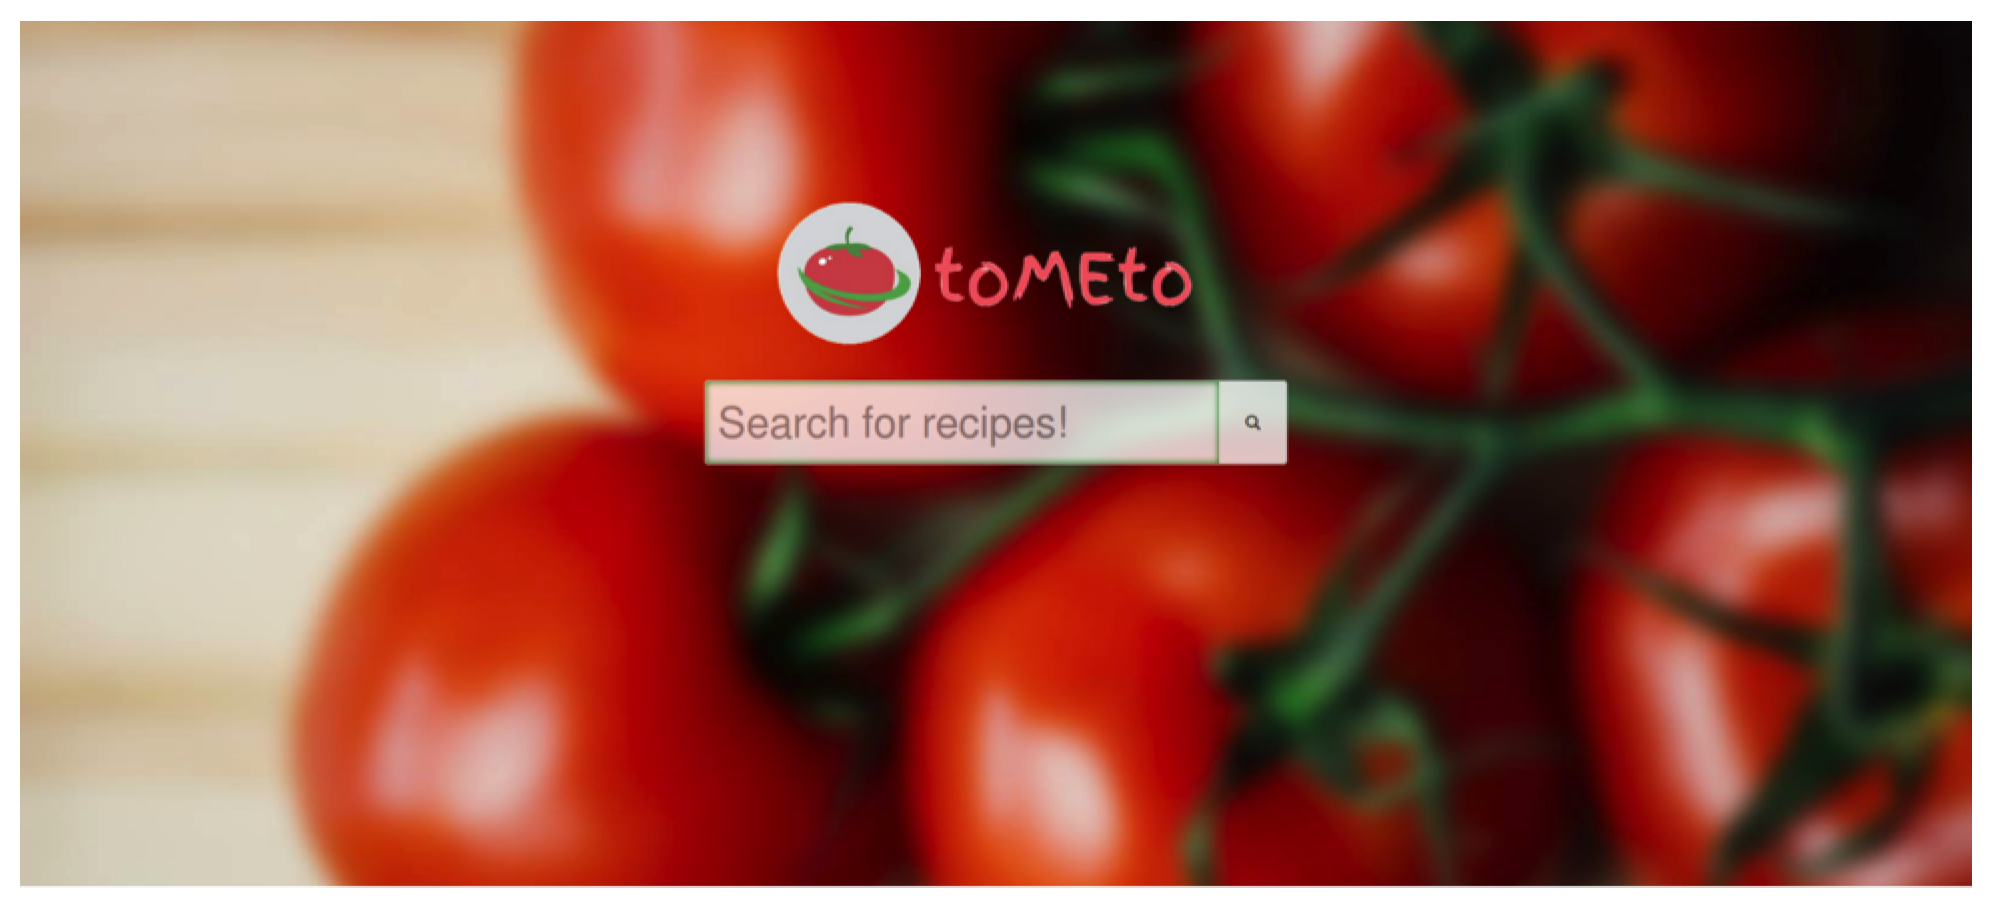
Figure 3.
Tiles, each with a recipe related to the search input.
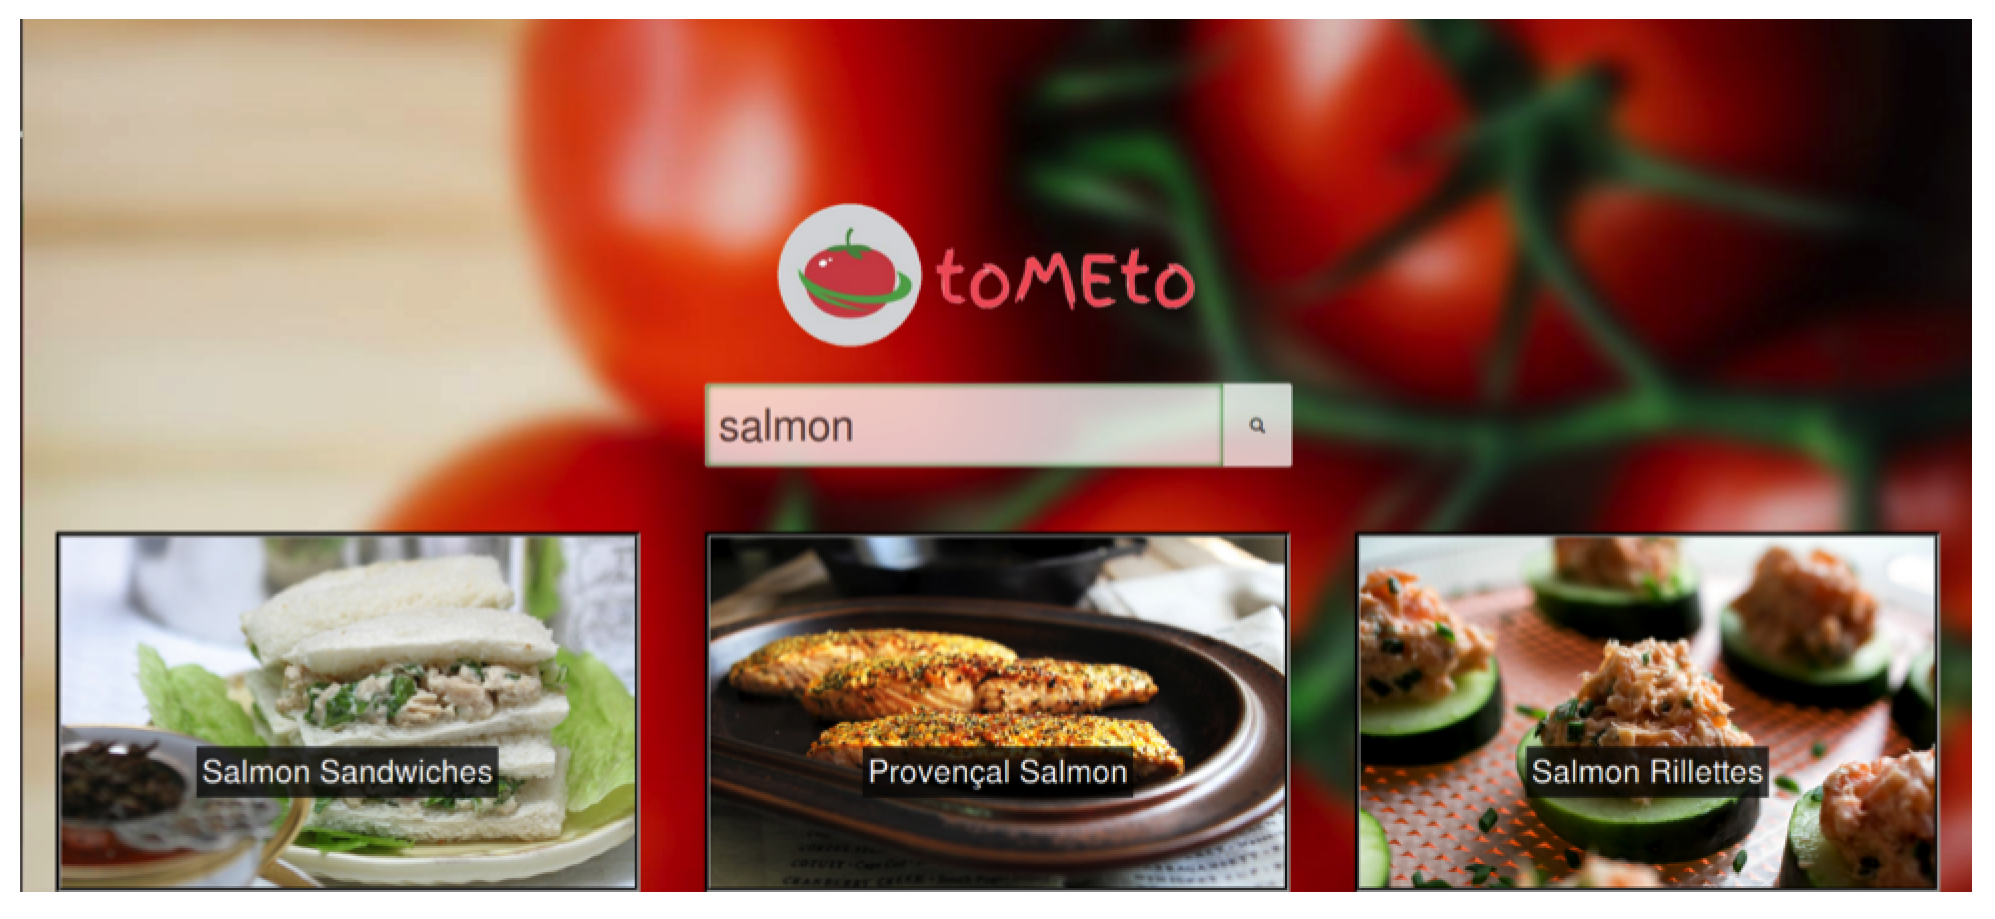
Figure 4.
The resulting popup from clicking on an image with the recipe and my recommended ingredients.
Figure 4.
The resulting popup from clicking on an image with the recipe and my recommended ingredients.
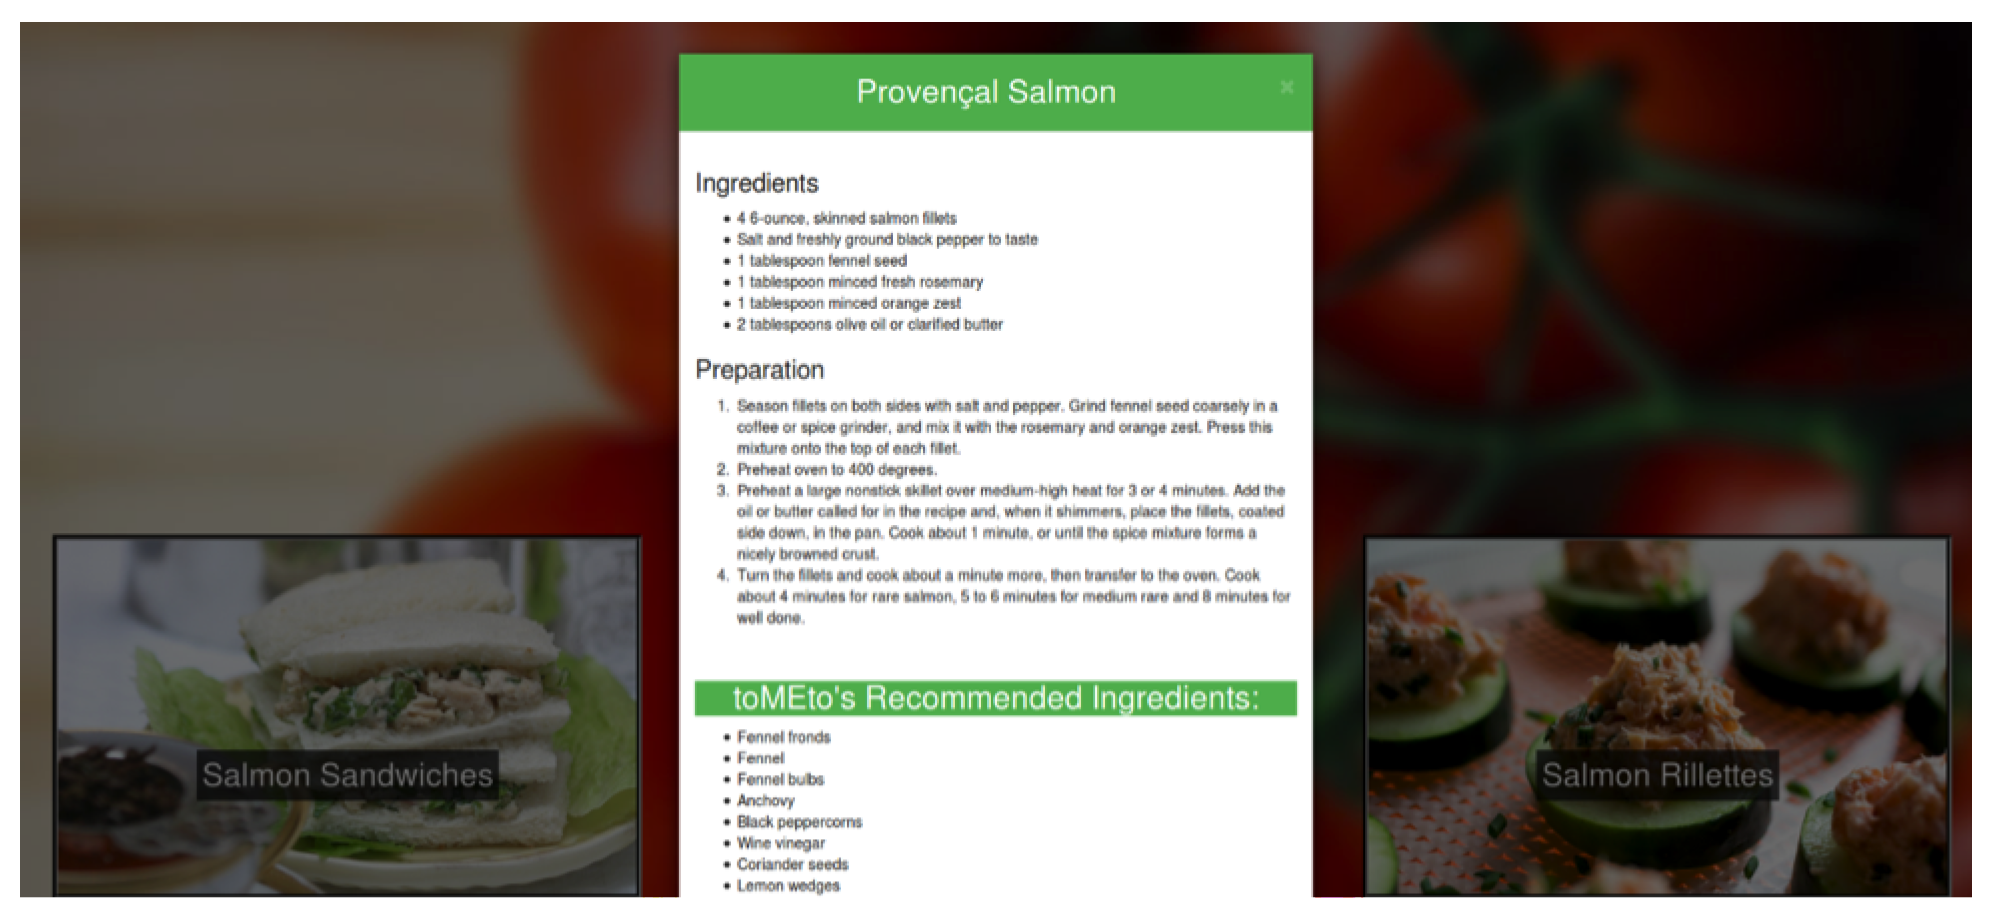
Figure 5.
Schematic of the architectural design.
Disclaimer/Publisher’s Note: The statements, opinions and data contained in all publications are solely those of the individual author(s) and contributor(s) and not of MDPI and/or the editor(s). MDPI and/or the editor(s) disclaim responsibility for any injury to people or property resulting from any ideas, methods, instructions or products referred to in the content. |
© 2025 by the authors. Licensee MDPI, Basel, Switzerland. This article is an open access article distributed under the terms and conditions of the Creative Commons Attribution (CC BY) license (http://creativecommons.org/licenses/by/4.0/).
Copyright: This open access article is published under a Creative Commons CC BY 4.0 license, which permit the free download, distribution, and reuse, provided that the author and preprint are cited in any reuse.


