
Submitted:
15 July 2025
Posted:
16 July 2025
You are already at the latest version
Abstract
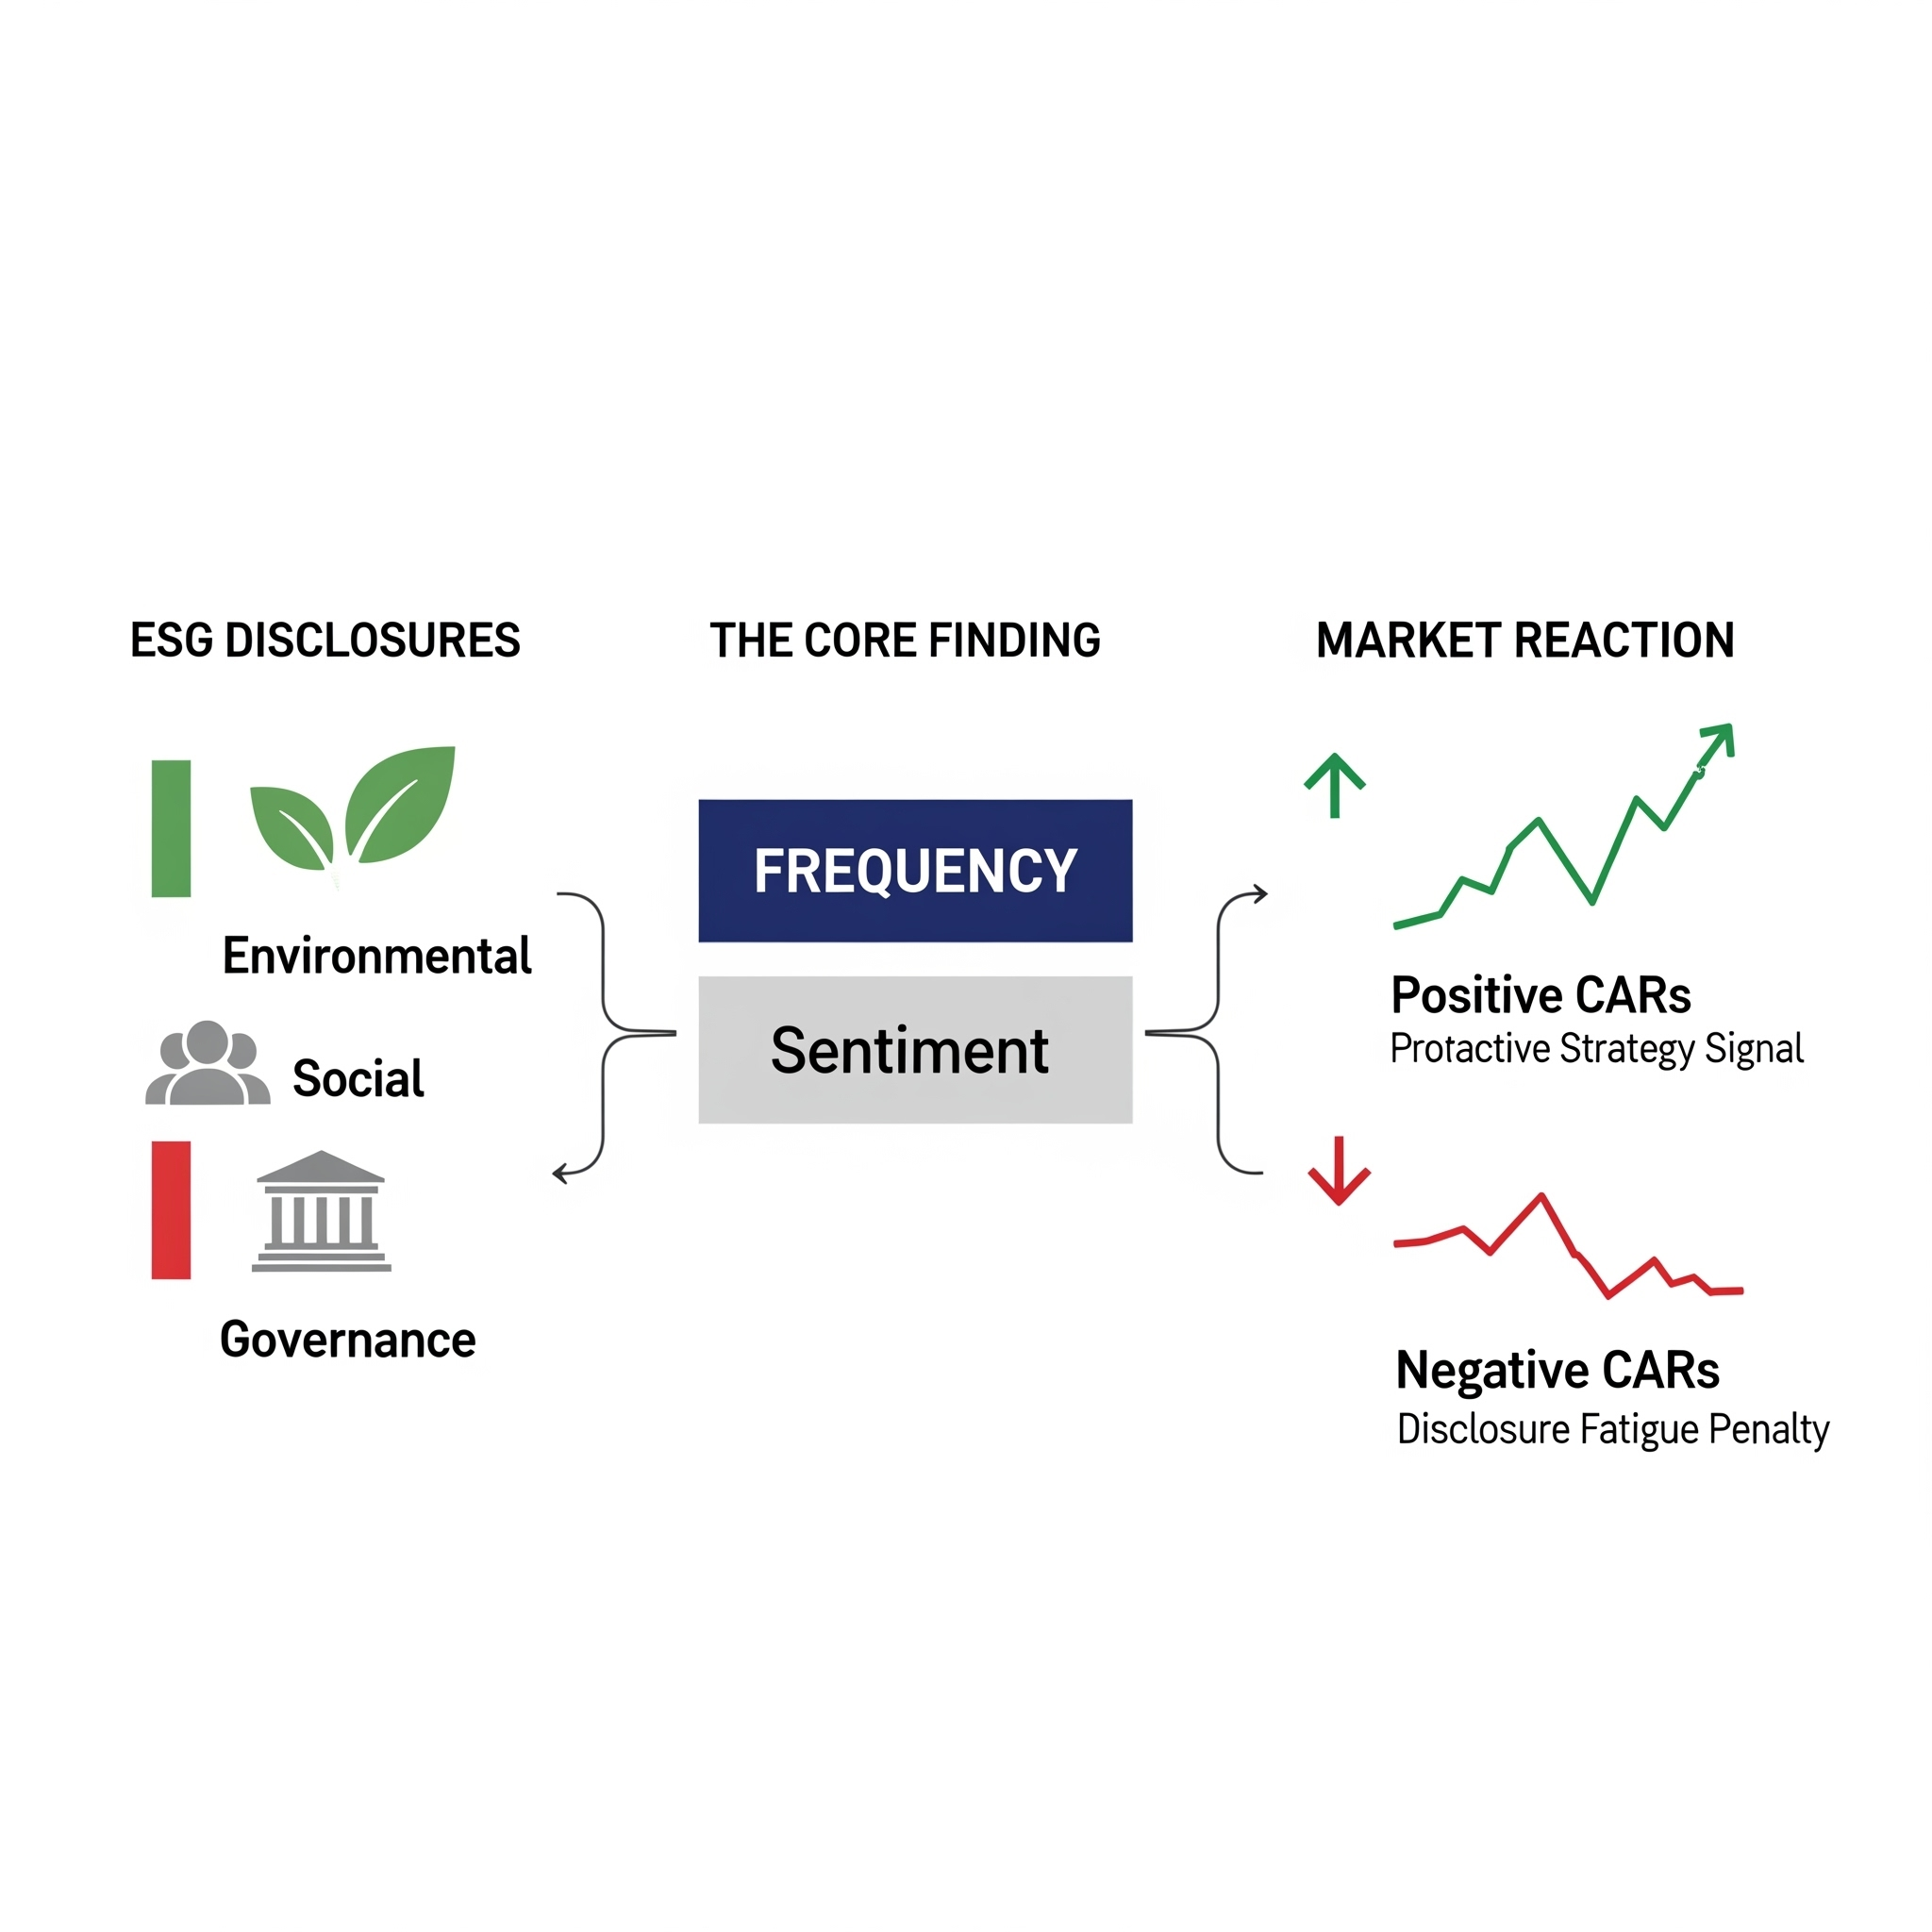
This study challenges the conventional wisdom that investor reactions to Environmental, Social, and Governance (ESG) information are primarily driven by disclosure sentiment. We propose and test an alternative hypothesis: that for investors navigating information-rich environments, the frequency of ESG disclosures can serve as a more potent signal of a firm's underlying commitment and risk profile than the linguistic tone of the announcements themselves. Focusing on Taiwan's capital market—a globally pivotal technology hub—we analyze 2,576 firm-initiated ESG events from 2014 to 2023 using an event study methodology. We innovate by employing a BERT-based NLP model, specifically fine-tuned for Traditional Chinese, to disentangle the effects of disclosure frequency from sentiment. Our results reveal that announcement frequency is a more robust predictor of abnormal returns than sentiment, but its effect is highly contingent on the ESG pillar. A higher frequency of negative Social (S) and Governance (G) disclosures incurs a significant market penalty, whereas frequent proactive Environmental (E) disclosures are rewarded. These findings establish a "disclosure frequency premium/penalty" and offer critical, nuanced insights for corporate strategy and sustainable investment. By demonstrating how communication patterns shape market perceptions, this research directly informs UN SDG 12 (Responsible Production) and SDG 16 (Strong Institutions).
Keywords:
ESG
; sustainable finance
; sentiment analysis
; BERT
; event study
; disclosure frequency
1. Introduction
The integration of Environmental, Social, and Governance (ESG) criteria into financial analysis represents a paradigm shift in assessing corporate value and risk. This transition is no longer a matter of debate but a market reality, underscored by the significant valuation impacts following ESG-related controversies, such as Volkswagen’s emissions scandal in 2015 and Meta’s Cambridge Analytical data breach in 2018 [2]. As global standards evolve with the EU’s Corporate Sustainability Reporting Directive (CSRD) and the ISSB’s IFRS S1/S2, the focus is intensifying on timely, transparent, and verifiable event-based disclosures over static, annual ratings. This global momentum raises a critical question with profound implications for non-Western, export-driven economies: what is the relationship between the style and substance of ESG communication and market valuation? Is it a meaningful association, or is it perceived as symbolic "greenwashing"?
This question is particularly salient in Taiwan, which offers an ideal natural laboratory for testing whether how often firms communicate ESG information matters more than how positively they frame it. Taiwan's market is characterized by its pivotal role in global supply chains and a corporate landscape dominated by family-controlled firms, creating distinctive conditions for examining ESG communication effects. First, the island economy couples a state-led, phased-in mandate—spelled out in the Financial Supervisory Commission's (FSC) Corporate Governance 3.0 roadmap and its 2023 IFRS S1/S2 adoption timetable—with a public, stock-exchange-administered evaluation that ranks every issuer on a 1–7 scale where nearly one-third of the score derives from "Promotion of Sustainable Development". No comparable dual-track mechanism exists in the United States, where third-party raters (e.g., MSCI, Sustainalytics) operate outside the regulatory perimeter, nor in the EU, where scoring remains voluntary despite CSRD's legal heft.
Second, Taiwan's corporate landscape features family-controlled firms embedded in global supply chains—conditions that create parallels with, yet distinctions from, other advanced Asian markets. South Korea's chaebol-dominated corporate sector and Singapore's mandatory sustainability reporting regime highlight how different governance structures and regulatory environments may mediate ESG outcomes, but neither combines Taiwan's unique dual-track regulatory approach with its particular ownership concentration. If disclosure cadence truly acts as an information signal, it should do so most clearly where reporting is both compulsory and reputationally policed, yet ownership structures remain highly concentrated. While our focus is on Taiwan, these cross-national comparisons underscore the broader relevance of examining whether consistent ESG communication carries tangible market consequences across different institutional contexts.
Despite a burgeoning literature, existing ESG research suffers from two principal limitations that this study aims to address. First, the prevalent reliance on proprietary, low-frequency ESG ratings has been widely criticized for its methodological opacity and inability to capture market reactions to timely, firm-specific events [7,15]. Second, the growing body of work using textual analysis predominantly focuses on disclosure sentiment, operating on the assumption that positive tone is rewarded while negative tone is punished [24]. This narrow focus overlooks a crucial alternative signaling mechanism: disclosure frequency. In environments characterized by information asymmetry, the very act and cadence of communication may serve as a powerful heuristic for investors to assess a firm's transparency, legitimacy, and proactive risk management.
To address these gaps, this study pioneers a novel methodological approach. We employ a BERT-based model, specifically enhanced with the CKIP Lab’s Traditional Chinese knowledge base, to analyze the sentiment and frequency of ESG event announcements from Taiwanese listed companies between 2014 and 2023. This domain-specific adaptation allows for an unprecedented level of accuracy in interpreting localized financial terminology and cultural context, overcoming the limitations of generic NLP models. By focusing on discrete, firm-initiated events sourced directly from the Taiwan Economic Journal (TEJ) database, we bypass the latency and aggregation issues of rating agencies.
Our analysis yields a counterintuitive primary finding: the frequency of ESG disclosures emerges as a more robust predictor of cumulative abnormal returns (CARs) than the sentiment of those disclosures. This suggests that the market rewards the act of consistent communication, interpreting it as a signal of corporate legitimacy and proactive governance. We find this effect is highly heterogeneous across ESG pillars. In line with Legitimacy and Stakeholder theories, negative Social and Governance events—signals of breaches of the social contract or fiduciary duties—trigger the most severe and persistent market penalties. Conversely, a higher frequency of Environmental disclosures is met with a neutral-to-positive response, which we posit aligns with Signaling Theory: investors may interpret these as credible signals of a firm’s commitment to navigating long-term regulatory risks, particularly given the Taiwanese government’s green transition policies. Our findings also confirm that firm size and financial stability are significant moderators, with larger firms exhibiting greater capacity to absorb the market shocks from negative ESG news.
This study makes three distinct contributions to the literature. First, we advance the methodology of ESG analysis by demonstrating the superior efficacy of a linguistically and culturally adapted NLP model for a non-English context. Second, we challenge the conventional wisdom in sentiment-focused studies by providing strong evidence for the primacy of disclosure frequency, offering a new, theoretically grounded perspective on how markets process ESG information. Third, we provide granular, actionable insights for an under-researched capital market, revealing the specific ESG factors that drive value are associated with value creation in Taiwan. These findings have critical implications for corporate managers crafting disclosure strategies and for investors seeking to refine their risk assessment models in Asian markets.
2. Literature Review and Hypotheses Proposed
2.1. Theoretical Framework: How Markets Interpret ESG Information
The financial impact of ESG disclosures is not uniform; it is interpreted by investors through several theoretical lenses that explain how non-financial information is processed and priced. Legitimacy Theory posits that firms operate under a “social contract” with society. Disclosures, therefore, are a primary tool for firms to demonstrate their adherence to societal norms and expectations. Negative ESG events, especially in the social and governance realms, represent a breach of this contract, threatening the firm’s legitimacy and leading to negative market repercussions as investors price in the risk of sanctions, regulatory scrutiny, or loss of public trust [12].
This is complemented by Stakeholder Theory, which argues that a firm’s success depends on its ability to manage its relationships with a broad set of stakeholders, not just shareholders [18]. Negative S or G news directly harms key stakeholders (employees, customers, regulators), signaling potential disruptions to operations, supply chains, or revenue streams. The market, in turn, penalizes the firm for this increased stakeholder-related risk [24].
Finally, Signaling Theory suggests that in an environment of information asymmetry, corporate disclosures act as signals to investors about unobservable firm qualities, such as management competence or long-term strategy [29]. From this perspective, the act of disclosing can be as important as the content. Consistent, voluntary disclosure, even of neutral or mildly negative information, can signal transparency and proactive risk management, thereby reducing the firm’s cost of capital [14]. This is particularly relevant for complex, forward-looking environmental issues.
2.2. The Shift from Ratings to Real-Time Events and the Sentiment vs. Frequency Debate
Initial empirical research on ESG financial impact relied heavily on third-party ratings (e.g., MSCI, Sustainalytics). However, this approach has been challenged by a growing body of literature highlighting significant “rater divergence,” where different agencies provide conflicting assessments of the same firm due to opaque methodologies and subjective weighting schemes [7]. Furthermore, these ratings are updated infrequently, making them ill-suited for capturing the market’s immediate reaction to breaking news.
This has motivated a shift toward event-study methodologies that analyze the impact of discrete ESG news events on stock returns [9]. A central debate within this stream of research concerns what aspect of the news drives market reactions. The dominant assumption has been that the sentiment (positive or negative tone) of the disclosure is the primary driver. Studies consistently find an asymmetric response, where negative news triggers a much stronger stock price decline than the positive lift from good news, a finding often attributed to investor loss aversion [22,24].
However, an emerging perspective, informed by Signaling and Legitimacy theories, questions the primacy of sentiment. It posits that the frequency of disclosures may be a more powerful signal. In this view, frequent communication on ESG topics, regardless of sentiment, signals that management is attentive and in control, thus reducing information asymmetry and enhancing firm legitimacy. Conversely, a sudden, negative event from a typically silent company could be penalized more harshly. This suggests a crucial, yet under-researched, question: is it the tone of the message or the rhythm of communication that matters more to investors?
Based on this debate, we propose our first two competing hypotheses:
H1:
The sentiment of ESG news events is a significant determinant of a firm’s cumulative abnormal returns (CARs), with negative sentiment leading to negative CARs and positive sentiment leading to positive CARs.
H2:
The frequency of ESG disclosures is more significantly associated with CARs than the sentiment expressed in those disclosures.
2.3. Methodological Advancements: Leveraging BERT for Nuanced Textual Analysis
Analyzing the content and sentiment of ESG disclosures requires robust methodological tools capable of parsing complex, unstructured text. Early dictionary-based approaches, such as the financial lexicon [27], were a significant step forward but struggle with context, negation, and domain-specific terminology prevalent in ESG reports [25].
The advent of transformer-based models, particularly BERT (Bidirectional Encoder Representations from Transformers), represents a methodological leap [13]. BERT’s key innovation is its bidirectional attention mechanism, which allows it to understand a word’s meaning based on its full context (both preceding and succeeding words). This is crucial for ESG analysis, where phrases like “not in violation of environmental laws” can be easily misinterpreted by simpler models. While powerful, standard BERT models trained on general corpora (e.g., Wikipedia) are not optimized for the specific lexicon of finance or the unique linguistic characteristics of different languages.
Our study addresses this by employing a BERT model specifically enhanced with the CKIP Lab’s Traditional Chinese knowledge base. This methodological choice is a core contribution, as it tailors the model to the Taiwanese financial context, providing a more accurate interpretation of local terms, corporate names, and regulatory language. This approach avoids the known limitations of applying English-centric models to other linguistic environments and allows for a more reliable test of our hypotheses compared to using generic NLP tools.
2.4. Temporal Evolution of ESG Market Impact
Investor perceptions of ESG disclosures have likely evolved over time as sustainability issues moved into the mainstream. In the early years of our sample (2014–2018), ESG reporting in Taiwan was relatively nascent, whereas by 2019–2023, both regulatory frameworks and investor awareness had intensified. Global evidence also suggests that mandatory ESG disclosure regulations can improve the information environment and influence market behavior. We therefore expect that market reactions to ESG events became more pronounced in the latter part of our study period. Formally, we hypothesize:
H3:
Market reactions to ESG event disclosures are significantly stronger in the post-2019 period than in the pre-2019 period, reflecting heightened investor attention and regulatory scrutiny in recent years.
2.5. Differential Impacts of E, S, and G in the Taiwanese Context
The market does not view “ESG” as a monolith. The financial materiality and signaling content differ significantly across the three pillars, leading to varied market reactions:
- Governance (G): Consistent with both Stakeholder and Legitimacy theories, governance failures (e.g., fraud, executive misconduct) are often found to trigger the most immediate and severe negative market reactions. Such events signal a fundamental breach of fiduciary duty and can directly threaten firm stability and shareholder value [16,24];
- Social (S): Social issues (e.g., labor disputes, supply chain controversies, product safety) also elicit strong negative responses, as they threaten a firm’s brand reputation, customer loyalty, and operational continuity—its social license to operate. In an export-oriented economy like Taiwan, which is deeply integrated into global supply chains, negative social events can signal significant risk to international partners [26];
- Environmental (E): The impact of environmental news is more nuanced. While discrete negative events like industrial accidents cause sharp stock declines, the market reaction to proactive, positive E disclosures is often muted in the short term [9]. However, from a Signaling Theory perspective, a consistent frequency of E-related disclosures may be interpreted positively by investors as a sign of long-term risk management and alignment with evolving policy (such as Taiwan’s push towards a green energy transition).
This leads to two additional hypotheses:
H4:
The market reaction to ESG events is heterogeneous across pillars, with negative Social (S) and Governance (G) events triggering significantly more negative CARs than negative Environmental (E) events.
H5:
Firm size and financial stability significantly moderate the market’s reaction to ESG events, with larger and more stable firms better able to mitigate the negative impact of adverse news.
3. Methodology
3.1. Data and Sample Construction
The initial dataset for this study was constructed from the Taiwan Economic Journal (TEJ) database, a comprehensive source that aggregates and standardizes financial and non-financial disclosures from Taiwan’s Market Observation Post System (MOPS). We focused on firm-initiated ESG-related news announcements for all companies listed on the Taiwan Stock Exchange (TWSE) from January 1, 2014, to December 31, 2023.
It is important to clarify the scope of "firm-initiated" events within our sample. By sourcing data from the TEJ database, which systematically compiles official corporate filings from the Market Observation Post System (MOPS), our sample consists of disclosures that the companies themselves have formally announced to the public. This deliberate choice is central to our research question, which focuses on how a firm's own disclosure strategy—its decisions on what, when, and how often to communicate—is perceived by the market. We are therefore analyzing the market's reaction to the firm's official voice, not the entire universe of ESG-related news that might include third-party media reports or analyst commentary.
We acknowledge that this sampling strategy has a potential limitation: it may introduce a selection bias. This is because ESG controversies might first be reported by external media and only later (or in some cases, never) be formally addressed by the company through official channels. Consequently, our findings speak specifically to the market's reaction to official corporate disclosures, which may not always coincide with the initial moment the information becomes public. However, we argue that for the purpose of studying the signaling effect of a firm's communication patterns (i.e., frequency), focusing on the official corporate record provides a more direct, consistent, and replicable dataset for analysis.
The sample construction followed a multi-stage process:
- Keyword-Based Filtering: We developed a domain-specific lexicon of keywords for each of the three ESG pillars, tailored to the Taiwanese context. Keywords for Environmental (E) included terms related to carbon emissions, green energy, pollution, and ISO 14001. Social (S) keywords included labor relations, supply chain ethics, product safety, and corporate social responsibility. Governance (G) keywords covered board composition, executive compensation, internal controls, and shareholder rights. This initial automated search yielded over 5,000 potential events.
- Manual Verification and Classification: Each automatically flagged announcement was manually reviewed by two researchers to ensure its relevance and to eliminate routine or non-material disclosures (e.g., standard CSR report publications). This critical step ensures that our events represent substantive, new information to the market. Disagreements in classification were resolved by a third reviewer.
- Final Sample: The final, validated dataset comprises 2,576 unique ESG events. The distribution across pillars is as follows: 387 Environmental, 909 Social, and 1,280 Governance events. This composition, with a clear predominance of G and S events, aligns with patterns observed in other markets and provides a robust basis for testing the differential impact of each pillar. The annual frequency of events shows a marked increase post-2019, rising from an average of 185 per year (2014–2018) to 330 per year (2019–2023), reflecting the growing regulatory and investor focus on ESG in Taiwan.
3.2. Sentiment Analysis Methodology and Validation
3.2.1. Model Selection and Implementation
To quantify the sentiment of each ESG announcement, we employ a BERT-based model specifically pre-trained on a Traditional Chinese corpus by the CKIP Lab. This choice was deliberate. While alternative models like RoBERTa and XLNet offer certain performance advantages, the CKIP-BERT model’s specialization in the linguistic nuances of Taiwanese financial and corporate language provides superior contextual understanding compared to generic, multi-language models. This localization is critical for accurately interpreting ESG texts, which are often laden with specific regulatory terminology and cultural subtext. We chose this high-quality, pre-trained local model over fine-tuning a generic model on our own dataset for two reasons: (1) it leverages a much larger and more diverse Traditional Chinese corpus than our specific sample, ensuring broader linguistic coverage, and (2) it provides a more robust and replicable baseline for future research in the Taiwanese context.
The implementation process is as follows:
- Text Segmentation: As corporate announcements frequently exceed BERT’s 512-token input limit, each document was segmented into chunks of 512 tokens with a 256-token overlap. This sliding-window approach ensures that no contextual information at the seams of segments is lost.
- Sentiment Scoring: The CKIP-BERT model processes each chunk and outputs probabilities for “positive” and “negative” classes. The chunk’s sentiment score is calculated as: Sentiment Score = Positive Probability − Negative Probability. The final sentiment score for the entire document is the average of the scores of all its constituent chunks. A document is classified as positive if its final score is > 0 and negative otherwise.
3.2.2. Model Validation
To ensure the reliability and validity of our sentiment classifications - a step often overlooked in automated textual analysis - we performed a rigorous validation procedure. A random subsample of 300 news announcements (approximately 12% of the dataset) was manually coded as positive, negative, or neutral by two independent human annotators who were native speakers with financial literacy. The classifications from our BERT model were then compared against this human-annotated “gold standard.”
The level of inter-rater reliability between the two human coders was first established, yielding a Cohen’s Kappa of 0.86, indicating “almost perfect” agreement. Subsequently, the agreement between our model’s classification and the consolidated human rating was calculated, achieving a Cohen’s Kappa of 0.81. This high level of agreement with human coders provides strong evidence for the model’s validity and its ability to replicate nuanced human judgment, thereby ensuring the robustness of our primary independent variable.
3.3. Event Study and Econometric Models
3.3.1. Measuring Abnormal Returns
We use a standard event study methodology to measure the short- and long-term impact of ESG news on firm value. The market model is used to calculate abnormal returns (AR). The event date (T=0) is the public announcement date of the ESG news in the TEJ database. The estimation window is the 255-day period ending 46 days before the event date.
The abnormal return for stock i on day t is defined as:
where Ri,t represents the actual return of stock i at time t, and E(Ri,t) represents the expected return from the market model. The cumulative abnormal return (CAR) is computed as the sum of ARs over the event window:
where (T1, T2) defines the window relative to the event date (e.g., (0, +1), (0, +5), up to (0, +120)). We analyze CARs over several windows, from a short-term (0, +1) window to a long-term (0, +120) window, to capture both immediate reactions and longer-term adjustments. Notably, by focusing on short event windows (e.g., 0 to +1 or +5 days), we partially mitigate endogeneity concerns, as shorter windows reduce the likelihood of confounding events influencing the returns.
ARi,t = Ri,t – E(Ri,t),
3.3.2. Regression Analysis
To test our hypotheses, we employ a multiple regression model to examine the determinants of CARs. The model is specified as follows:
CARi (0,
T) = β0 + β1
Sentimenti+ β2 Frequencyi
+ β3 Pillari
+ β4 FirmSizei + β5 ROEi + β6 P/Bi
+ β7 Year FE + β8 Industry FE +ϵi,t,
+ β4 FirmSizei + β5 ROEi + β6 P/Bi
+ β7 Year FE + β8 Industry FE +ϵi,t,
where the dependent variable is the CAR for firm i over the specified window T(1, 5, 20, 60, or 120 days). Sentiment is the sentiment score of the ESG announcement (from our BERT model), Frequency is the number of ESG event announcements made by the firm in the quarter of the event, and Pillar is a categorical variable indicating the ESG pillar of the event (we also run separate models by pillar). Firm-level controls include FirmSize (log of total assets), ROE (return on equity), and P/B (market-to-book ratio). We include year and industry fixed effects to control for macroeconomic trends and sector-specific factors. Standard errors are clustered at the firm level.

Table 1.
Definitions of variables.
| Variables | Definitions |
|---|---|
| CARi (0, T) | Cumulative abnormal returns over the window from day 0 to day t, where t = 1, 5, 20, 60, 120. |
| Sentiment Score | The sentiment score calculated by the BERT model, derived using the formula: positive probability minus negative probability. |
| Frequency | The number of ESG event announcements made by the company in the current quarter. |
| Pillar | ESG event type, a dummy variable: 1 = Environmental events, 2 = Social events, 3 = Governance events. |
| Firm Size | Log of total assets of the firm. |
| ROE | Net profit divided by total shareholder equity. |
| P/B | Market value per share divided by book value per share. |
| Industry | Encoded based on the industry category codes of listed companies to identify different industry classifications. |
| Year | The calendar year in which the ESG event occurred, represented as a numerical value. |
3.4. Descriptive Statistics
Table 2 presents the descriptive statistics for the key variables in our analysis. The average CAR across all event windows is negative, providing initial support for the well-documented asymmetric market reaction to news, where negative information tends to have a disproportionate impact [22]. The standard deviation of CARs increases with the length of the event window, suggesting that while the initial impact may be consistent, long-term outcomes are subject to greater firm- and event-specific variation.
The mean Sentiment Score is heavily skewed to the negative (-0.81), indicating that firm-initiated ESG disclosures in Taiwan are predominantly related to adverse events or risk mitigation rather than purely positive announcements. This underscores the importance of a robust sentiment model, as the majority of texts are not trivially "good news." The Frequency variable shows considerable variation, with some firms having over 20 disclosures in a single quarter, allowing for a robust test of our hypothesis regarding the impact of communication rhythm. This descriptive foundation validates the suitability of our sample for investigating the nuanced drivers of market reactions to ESG information.
4. Empirical Findings and Analysis
This section presents the empirical results of our study. We begin with a descriptive analysis of market reactions using event study plots, followed by a detailed examination of cumulative abnormal returns (CARs) across different ESG pillars. Finally, we present the results of our multivariate regression models to formally test our hypotheses regarding the roles of sentiment, frequency, and firm-level characteristics.
4.1. Market Reaction to ESG Events: An Event Study Perspective
To provide an initial overview of the market's response to ESG disclosures, Figure 1 plots the average Abnormal Returns (AR) and Cumulative Abnormal Returns (CAR) for the full sample of 2,576 events around the announcement date (T=0).
Figure 1 plots the average Abnormal Return (AR) and the Cumulative Abnormal Return (CAR) for the full sample surrounding the event announcement date (T=0). The graph reveals two distinct patterns. The average AR exhibits only minor fluctuations around the event day, which suggests that the market's immediate, day-to-day reaction to ESG news is relatively muted. In contrast, the CAR reveals a clear and persistent downward trend following the ESG announcement. This pattern suggests that investors do not fully price the implications of ESG events instantaneously; rather, the information appears to be gradually assimilated over time, leading to a sustained negative valuation effect.
4.2. Differential Impact of Environmental, Social, and Governance Pillars
To test our hypothesis that the market reacts differently to the three ESG pillars (H4), we disaggregate the CAR analysis by event type. Table 3 presents the CARs for the full sample and for each of the E, S, and G subsamples over various event windows up to 120 days post-announcement.
The results in Table 3 reveal striking differences in market reactions, providing strong support for H4:
- Environmental (E) Events: The market response to environmental news is markedly different. The initial impact is a negligible –0.11%. Remarkably, this mild negative effect reverses over time, with the CAR turning positive and reaching +0.89% by day 120. This unique pattern suggests that while the market may have a slight negative initial reaction to environmental disclosures (perhaps due to short-term compliance costs or risk signals), investors eventually interpret recurring environmental initiatives as a sign of proactive management and long-term strategic planning. This finding is consistent with the observations of [23], who argue that transparency in sustainability initiatives can enhance firm value over time.
- Social (S) Events: These events trigger the most significant and immediate negative impact. The CAR on the event day is about –0.53%, deepening to nearly –2.0% by day 120. This powerful negative reaction aligns with our theoretical framework, suggesting that investors heavily penalize firms for events that directly violate their social contract with stakeholders, such as labor disputes or product safety failures, which can cause severe reputational damage and operational risk.
- Governance (G) Events: Governance-related news also results in a sustained negative trajectory, with a CAR of –0.28% on day 0 that deteriorates to approximately –2.38% by day 120. While the initial impact is less severe than for Social events, the long-term decline is the largest of the three pillars. This suggests that, although governance issues may be less sensational in the headlines, investors perceive them as having profound, long-term implications for firm stability and integrity, consistent with prior literature [9,16].
In sum, this descriptive analysis confirms that investors do not treat ESG as a monolithic concept. The immediate and severe penalties for S and G events, contrasted with the eventual positive re-rating for E events, underscore the importance of our disaggregated approach. However, this analysis does not control for other factors, which we turn to next.
4.3. Regression Analysis of CAR Determinants
To formally test our hypotheses and disentangle the effects of sentiment, frequency, and other firm characteristics, we conduct a series of multivariate regressions.
4.3.1. Full Sample Analysis
Table 4 presents the regression results for the full sample across five event windows (CAR1, CAR5, CAR20, CAR60, CAR120). The results provide clear evidence supporting our central hypotheses.
In brief, the regression coefficients indicate the following:
- The Primacy of Frequency over Sentiment (H1 vs. H2): The Sentiment Score variable is statistically insignificant in the shortest windows (CAR1, CAR5) and only becomes weakly significant in some longer windows. This finding provides only partial, weak support for H1. In stark contrast, the Frequency variable is highly significant and negative across all but the very shortest window. A higher frequency of ESG announcements in a quarter is associated with significantly lower CARs. This provides strong support for H2, suggesting that investors may perceive a high volume of ESG disclosures not as a reassuring sign of transparency, but as an indicator of underlying problems and heightened risk. In our discussion, we will elaborate on this phenomenon, which we term “Disclosure Fatigue,” interpreting it as a rational market heuristic. The market appears to react more to the signal of “trouble” implied by frequent ESG-related announcements than to the nuanced tone of those announcements.
- The Moderating Role of Firm Characteristics (H5): In line with H5, firm-level fundamentals play a critical role. Firm Size and ROE (profitability) are both associated with significantly more positive (or less negative) CARs across many windows. This indicates that larger, more profitable firms have the financial stability and resources to better mitigate the negative market impact of ESG events, confirming that strong fundamentals act as a buffer against ESG shock impacts.
Control variables and fixed effects behave as expected: for instance, the Year fixed effects show more negative CARs in later years (consistent with increasing scrutiny over time), and the industry effects are generally small.
4.3.2. Subgroup Analyses by ESG Pillar
To explore the nuances behind the full-sample results, we conduct separate regressions for each ESG pillar.
Environmental (E) Events (Table 5): The results for E events are striking and unique. The Frequency coefficient is consistently positive and highly significant across all windows. This is the opposite of the full-sample result and suggests that for environmental issues, frequent communication is rewarded by the market. Investors appear to interpret a steady stream of E-related news as a credible signal of proactive engagement with long-term sustainability trends, aligning with our Signaling Theory framework. This provides a powerful explanation for the positive long-term CAR trend observed in Figure 1 and Table 3.
Social (S) and Governance (G) Events (Table 6 and Table 7): For both S and G events, the Frequency coefficient is consistently negative and significant in the medium- to long-term windows, mirroring the full-sample result. This confirms that for issues directly related to stakeholder relations and corporate integrity, a high volume of disclosures is perceived negatively by investors, likely as an indicator of persistent problems. For G events, Firm Size is a strong positive predictor of CARs, suggesting that for governance matters, the market trusts larger firms more, perhaps due to more sophisticated board structures and internal controls
4.3.3. Period-Specific Analysis (Pre- vs. Post-2019)
To test for temporal variations in market reactions (H3), we split the sample into two periods: 2014–2018 (early adoption) and 2019–2023 (mature phase). The results are presented in Table 8 and Table 9.
The analysis reveals a structural shift in how the market processes ESG information, providing strong support for H3. In the 2014–2018 period, the frequency of disclosures has a limited and sometimes even positive effect on CARs. However, in the 2019–2023 period, frequency has a consistently strong and negative impact on CARs. This demonstrates that as investor awareness and regulatory scrutiny intensified after 2019, the market became more skeptical and discerning. What might have been viewed as a positive signal of transparency in the early period is now interpreted as a negative signal of underlying risk in the more mature phase.
5. Discussion
Our empirical analysis yields a series of interconnected findings that contribute to a more nuanced understanding of how ESG information is processed in a non-Western, export-oriented capital market. In this section, we discuss the theoretical and practical implications of our key results, focusing on three central themes: the primacy of disclosure frequency over sentiment, the distinct market logic for each ESG pillar, and the evolving nature of ESG investing in Taiwan.
5.1. The Rhythm of Communication Over the Tone: Disclosure Frequency as the Dominant Signal
The empirical results show a robust negative association between the frequency of S and G disclosures and a firm's cumulative abnormal returns. The central question is how to interpret this finding. This study proposes that frequency acts as a primary signal to investors; however, it is crucial to first acknowledge an alternative explanation rooted in endogeneity.
Endogeneity concerns that disclosure frequency is merely a symptom of a firm's underlying problems. Firms with poor management, weak internal controls, or chaotic operations are likely to experience more negative events (e.g., lawsuits, safety violations) and, consequently, are forced to issue more disclosures. Simultaneously, these intrinsic weaknesses lead to poor stock performance. In this view, high frequency and negative CARs are not causally linked; rather, they are both consequences of a third, unobserved variable—the firm's poor quality.
In contrast, this study frames this phenomenon through the lens of Legitimacy and Signaling Theories. This view posits that, even controlling for the content of the news, investors use the sheer volume of disclosures as a heuristic. A high frequency of problem-related announcements acts as a powerful signal that the firm is facing persistent turmoil, leading investors to update their risk assessment and penalize the stock. In essence, the communication pattern itself contains information.
While the study’s methodology cannot definitively disentangle causality from correlation, our findings—particularly the strengthening of this effect in the post-2019 mature market phase—are highly consistent with the framework in this study. The subsequent discussion will, therefore, interpret the results through this theoretical lens, while acknowledging the endogeneity concern as a vital avenue for future research.
The most striking finding of this study is the robust evidence supporting the dominance of disclosure frequency over sentiment in driving cumulative abnormal returns. While our results provide only weak and inconsistent support for H1 (the impact of sentiment), they offer compelling support for H2. The sentiment of a corporate announcement, whether positive or negative, appears to be of secondary importance to investors. Instead, the frequency of ESG-related communication emerges as the primary information signal, though its interpretation is highly context-dependent.
This challenges a significant stream of the ESG literature that focuses on sentiment as the main transmission channel for market reactions. We interpret this finding through the lens of Legitimacy and Signaling Theories. In an environment of high information asymmetry, investors may treat a high volume of disclosures not as a sign of transparency, but as an indicator of underlying operational or governance turmoil.
For Social and Governance events, the negative association with disclosure frequency suggests a market reaction we term "Disclosure Fatigue". It is crucial to clarify the precise meaning of this term within our framework. We do not use "fatigue" to imply an emotional or irrational investor response. Rather, we define it as a rational cognitive heuristic adopted by investors navigating environments of information overload and bounded rationality.
Specifically, when confronted with a high volume of disclosures on inherently negative topics (such as S and G failures), investors may rationally conclude that a detailed analysis of each individual event is inefficient. Instead, they may default to a simpler, powerful heuristic: the volume of signals serves as a proxy for the severity and persistence of underlying problems. This is a rational "where there's smoke, there's fire" assessment. Therefore, "Disclosure Fatigue" in this context describes the market's tendency to penalize the cumulative risk signaled by the pattern of frequent communication, rather than a weariness from processing the information itself. This interpretation aligns with our finding that the market reacts more to the rhythm of communication than to the nuanced tone of each message. This aligns with our regression results, which show a consistently negative coefficient for frequency in the full sample and for the S and G subsamples, especially in the post-2019 period.
5.2. A Tale of Three Pillars: Deconstructing the Market's Logic for E, S, and G
Our findings strongly support H4, demonstrating that the market does not treat ESG as one uniform category. The divergent reactions to each pillar reveal a sophisticated, multi-faceted risk assessment logic among investors in Taiwan.
The severe and persistent negative CARs following Social and Governance events confirm that breaches of the social contract and fiduciary duty are heavily punished. S and G issues often represent direct threats to a firm’s operational stability, brand reputation, and legal standing. For an economy like Taiwan’s, which is deeply embedded in global supply chains that are increasingly scrutinized for labor practices and ethical governance, these risks are particularly material.
The most intriguing result is the unique market response to Environmental events. The negative coefficient for frequency in the main model disappears and reverses to become consistently positive in the E-pillar subsample. This finding provides textbook support for Signaling Theory in the ESG context. We posit that this reflects a different signaling mechanism: in a market with strong, top-down policy incentives (i.e., Taiwan’s green transition initiatives), investors interpret frequent E-disclosures not as a sign of trouble, but as a costly and therefore credible signal of a firm’s proactive engagement and strategic alignment with sustainability goals. The act of consistent communication itself becomes a valuable intangible asset, indicating long-term risk management capabilities. Frequent reporting on environmental initiatives may thus signal an ability to navigate regulatory changes and capitalize on the green economy, leading to potentially contributing to higher valuations over time.
An alternative explanation for this positive effect, however, warrants consideration. It is plausible that, particularly within Taiwan's strong pro-green policy environment ("Green Finance Action Plan"), Environmental disclosures inherently contain more substantive "good news" (e.g., receiving government subsidies, technological breakthroughs, securing green bonds) than their S or G counterparts. From this perspective, the positive market reaction could be driven by the intrinsic value of the news content itself, a factor which may not be fully captured by our sentiment score alone.
While we acknowledge the validity of this viewpoint, several factors suggest that the signaling mechanism of frequency remains a critical, independent component. First, our regression models consistently control for sentiment; therefore, the significant and positive coefficient for Frequency captures an effect that exists above and beyond the linguistic tone of the announcements. Second, many proactive E-disclosures detail long-term capital investments, such as building new green facilities or committing to ambitious R&D for energy efficiency. These actions often represent significant short-term costs rather than immediate profits. In such cases, the disclosure's value lies not in immediate tangible gains, but in its function as a costly—and therefore credible—signal of a firm's long-term strategic commitment. Thus, even if some E-disclosures are substantively positive, we argue that the very act and rhythm of frequent communication provide an additional, valuable layer of information that the market rewards, a finding highly consistent with Signaling Theory.
5.3. The Evolution of ESG Maturity: A Market in Transition
The period-specific analysis provides compelling support for H3, revealing a structural shift in how the Taiwanese market prices ESG information. Before 2019, the market’s response to ESG disclosures was relatively muted, and a higher frequency of communication had a limited or even slightly positive effect. However, in the post-2019 period, coinciding with increased global and local regulatory focus on sustainability, the market became significantly more discerning and skeptical.
The consistently negative impact of disclosure frequency for S and G events only emerges in this later period. This suggests that the market has matured, moving from a phase of “learning” about ESG to a more advanced phase of "risk assessment". In this mature phase, investors are more adept at looking beyond the surface-level sentiment of disclosures to infer underlying risks from the pattern of communication. This is a clear sign of evolving market efficiency with respect to non-financial information: as ESG reporting became more standardized and expected, investors adjusted their heuristics, treating frequent problem-related disclosures as red flags.
5.4. The Enduring Importance of Fundamentals
Finally, our results consistently support H5, underscoring that firm fundamentals remain a critical moderator of ESG-related market reactions. Across nearly all models, firm size and profitability (ROE) act as significant buffers, mitigating the negative impact of adverse ESG events. This is intuitive: larger, more profitable firms have the financial resources, brand resilience, and managerial depth to weather ESG controversies more effectively than smaller, less stable firms. Even as ESG factors become increasingly material, investors clearly continue to evaluate them in conjunction with traditional measures of corporate financial health.
The moderating effect of firm size is particularly pronounced for Governance events, where the market appears to place greater trust in the established structures of larger corporations. This may reflect the perception that big firms have more robust governance mechanisms (e.g., more independent directors, better internal controls) to address and rectify issues when they arise.
In summary, our discussion highlights that: (a) "how often" a firm communicates about ESG issues can matter more to investors than “what tone” it uses, (b) investors differentiate sharply between E, S, and G issues, and (c) the market’s sensitivity to ESG communication has increased over time, especially for firms that may already be viewed as risky or troubled.
Broadly, our findings align with and extend evidence from other markets. For instance, [5] report that ESG controversies in South Korea lead to significant changes in investor trading behavior, underscoring the high sensitivity to negative ESG news events. In South Korea, the market's reaction to Governance (G) failures is likely amplified by the systemic risks posed by its family-controlled chaebol structure. A governance scandal in one affiliate can trigger fears of contagion across the entire conglomerate, leading to a more severe market penalty. Similarly, in Brazil, positive ESG news has been shown to prompt stock price gains while adverse ESG developments cause declines [28]. These patterns suggest that certain reactions—such as punishing bad ESG news—are common across markets, yet the magnitude and interpretation of ESG signals can be shaped by local context. In Singapore’s case, where ESG disclosure is mandated on a comply-or-explain basis since 2017, investors may have different expectations for corporate transparency.
Broadly, our findings contribute to a more nuanced global understanding of ESG materiality. The pronounced negative market reaction to Governance failures in our Taiwanese sample, for example, resonates with evidence from South Korea, where the systemic risks inherent in family-controlled chaebol structures can amplify the market penalty for governance-related scandals [5]. Similarly, the documented price impact of ESG news in Brazil [28] suggests a universal investor aversion to negative ESG developments.
However, our findings on the frequency premium for proactive Environmental disclosures appear particularly salient to Taiwan's unique political-economic context. For firms in Taiwan’s globally pivotal semiconductor industry, frequent E-pillar disclosures are likely interpreted by investors not merely as acts of corporate social responsibility, but as tangible signals of proactive risk management crucial for maintaining their license to operate within fiercely competitive and increasingly green global supply chains (e.g., meeting requirements from clients like Apple or adhering to EU regulations). This signaling is especially credible given the Taiwanese government's national "Net-Zero by 2050" policy and the "Green Finance Action Plan," which directly link corporate environmental performance to capital access.
Therefore, while certain market reactions to ESG news are globally consistent, the specific interpretation of disclosure patterns—such as frequency—is deeply embedded in the local institutional and industrial fabric. Our Taiwan-centric results thus demonstrate that effective ESG communication is not monolithic; its market impact is a complex interplay between the information itself and the expectations shaped by a market’s unique governance norms and industrial pressures.
6. Conclusions
This study set out to investigate the nuanced relationship between ESG event disclosures and sustainable value creation in Taiwan’s unique economic context. By employing a linguistically adapted BERT model, we move beyond traditional ratings and simplistic sentiment analyses to unpack the complex signals investors receive from corporate communications. Our findings reveal a sophisticated market logic that prioritizes the rhythm of communication over its tone, distinguishes sharply between the three ESG pillars, and has evolved significantly in its skepticism over the past decade.
- Our primary contribution is the robust evidence that for Social and Governance issues, disclosure frequency, rather than sentiment, is a more powerful predictor of negative market reactions. We interpret this through the lens of our "Disclosure Fatigue" framework, wherein investors, acting under bounded rationality, perceive a high volume of announcements as a rational signal of underlying systemic risk – a finding that enriches both Signaling and Legitimacy theories. In stark contrast, we find that a high frequency of Environmental disclosures is rewarded by the market, suggesting that in a policy environment geared towards a green transition, such communication is viewed as a credible signal of proactive risk management and strategic alignment. These heterogeneous effects, combined with the clear structural shift in market sensitivity pre- and post-2019, provide a granular, dynamic, and theoretically grounded picture of how a key Asian market prices ESG information.
6.1. Practical Implications
Our findings offer several actionable implications for key stakeholders:
- For Corporate Managers: A one-size-fits-all ESG disclosure strategy is suboptimal. We recommend a bifurcated approach: (1) Consolidate routine Environmental and Social initiatives into structured, comprehensive quarterly or annual sustainability reports. This signals consistent, proactive management without creating the negative “noise” of frequent, fragmented announcements. (2) By contrast, address material negative Social and Governance events with immediate, transparent, and decisive communication that outlines a clear remediation plan. For these legitimacy-threatening events, silence or infrequent communication is likely to be penalized more heavily than a swift, well-managed response.
- For Investors and Analysts: ESG analysis must evolve beyond surface-level sentiment scores. (1) Valuation models should incorporate disclosure frequency as a quantitative risk factor – particularly for S and G issues, where a high frequency of negative news may warrant a higher risk premium. (2) For Environmental issues in Taiwan and similar markets with strong green policy incentives, disclosure frequency should be considered a potential positive indicator of long-term strategic alignment and competitive advantage (rather than an automatic red flag).
- For Regulators and Policymakers: Our findings support policies that enhance the quality, rather than just the quantity, of disclosure. Regulators could consider developing guidelines inspired by the EU’s CSRD that encourage firms to report on their risk management processes for material S and G issues, rather than just the events themselves. This would help standardize information and reduce the market’s reliance on frequency as a proxy for risk. In addition, education efforts for investors on how to interpret ESG disclosures could mitigate overreactions to disclosure volume.
Finally, our research supports broader sustainability objectives. By highlighting the value of transparent and proactive ESG communication, we contribute to the UN Sustainable Development Goals — notably SDG 12 (Responsible Consumption and Production), through promoting accountable corporate practices, and SDG 16 (Peace, Justice, and Strong Institutions), by underscoring the importance of governance and transparency. Effective ESG disclosure not only influences investors but also aligns corporate behavior with societal goals, reinforcing the synergy between financial markets and sustainable development policy.
6.2. Limitations and Future Research
While this study provides significant insights, its limitations pave the way for important future research avenues.
- Contextual Specificity: Our study is focused on Taiwan. While this provides a deep and valuable analysis of a key market, the findings’ generalizability is not guaranteed. Future research should conduct direct comparative studies between Taiwan and other markets with different corporate governance structures and regulatory environments. A comparison with South Korea, for instance, would be particularly insightful to examine how its chaebol-dominated structure mediates market reactions to ESG news compared to Taiwan’s more fragmented corporate landscape. Similarly, examining a highly regulated context like Singapore could reveal how mandatory disclosure rules influence investor responses.
- Methodological Refinement: While our use of a localized BERT model is a key strength, there are avenues for further advancement. Future studies should explore the application of domain-specific large language models like FinBERT, which are pre-trained on massive financial corpora. Fine-tuning a FinBERT model on Traditional Chinese financial texts could potentially capture the nuances of ESG disclosures with even greater precision than the general-purpose BERT used here, allowing for an even more powerful test of the limited role of sentiment that we observe. Additionally, despite our careful validation, automated sentiment analysis can still misclassify contextual nuances; improved NLP models or hybrid human–machine approaches could further enhance the reliability of sentiment measurements in ESG narratives.
- Exploring Causal Mechanisms and Endogeneity: Our event study methodology identifies strong correlations, but a deeper exploration of causal mechanisms is warranted. One potential endogeneity concern is that firms with underlying problems might both issue more ESG disclosures and experience worse performance, biasing our results. While our short window approach helps isolate immediate market reactions, it cannot fully establish causality. Future studies could enhance causal inference by employing quasi-experimental designs (such as exploiting regulatory shocks or instrumental variables) to address this issue. Qualitative methods, such as management interviews and detailed case studies of specific ESG events, could also be used to uncover the decision-making processes behind corporate disclosure strategies and the precise channels through which investor perceptions are formed.
- Frequency Definition: In this study, frequency is measured as the raw count of ESG announcements within a given quarter. While this approach is straightforward and effectively captures the "rhythm" of communication, it inherently treats all events as equal, thereby not distinguishing by their potential severity or materiality. For example, the market's reaction mechanism is likely to differ significantly between a firm reporting a single, catastrophic governance failure and another firm reporting five minor, unrelated social infractions within the same period. Our current measure does not capture this critical dimension. Future research could develop more sophisticated, weighted frequency indices to address this limitation.
By pursuing these avenues, future research can build upon our findings to create an even more comprehensive and globally relevant understanding of the complex interplay between corporate sustainability, disclosure, and financial markets.
Supplementary Materials
The following supporting information can be downloaded at the website of this paper posted on Preprints.org, Figure S1: title; Table S1: title; Video S1: title.
Author Contributions
The author was responsible for the conceptualization, methodology, software, validation, formal analysis, investigation, data curation, writing—original draft preparation, writing—review and editing, and visualization of this manuscript.
Funding
This research received no external funding.
Institutional Review Board Statement
Not applicable.
Informed Consent Statement
Not applicable.
Data Availability Statement
The data presented in this study are available on request from the corresponding author. The ESG event data were obtained from the TEJ database under license and are not publicly available.
Acknowledgments
During the preparation of this study, the authors used ChatGPT o3 (OpenAI, version released July 2025) to edit the manuscript for language clarity, grammar, and style. The authors have reviewed and edited the output and take full responsibility for the content of this publication.
Conflicts of Interest
The authors declare no conflicts of interest.
References
- Alaparthi, S.; Mishra, M. BERT: A sentiment analysis odyssey. J. Mark. Anal. 2021, 9, 118–126. [Google Scholar] [CrossRef]
- Amel-Zadeh, A.; Serafeim, G. Why and how investors use ESG information: Evidence from a global survey. Financ. Anal. J. 2018, 74, 87–103. [Google Scholar] [CrossRef]
- Aue, T.; Jatowt, A.; Färber, M. Predicting Companies’ ESG Ratings from News Articles Using Multivariate Time Series Analysis. 2022; arXiv:2212.11765. [Google Scholar] [CrossRef]
- Barberis, N.; Shleifer, A.; Vishny, R. A model of investor sentiment. J. Financ. Econ. 1998, 49, 307–343. [Google Scholar] [CrossRef]
- Bang, J.; Ryu, D.; Yu, J. ESG controversies and investor trading behavior in the Korean market. Financ. Res. Lett. 2023, 54, 103750. [Google Scholar] [CrossRef]
- Bennani, L.; Le Guenedal, T.; Lepetit, F.; Ly, L.; Mortier, V.; Roncalli, T.; Sekine, T. How ESG Investing Has Impacted the Asset Pricing in the Equity Market. SSRN Working Paper No. 331 6862, 2018. [Google Scholar] [CrossRef]
- Berg, F.; Kölbel, J. F.; Rigobon, R. Aggregate confusion: The divergence of ESG ratings. Rev. Financ. 2022, 26, 1315–1344. [Google Scholar] [CrossRef]
- Busch, T.; Johnson, M.; Pioch, T. Corporate carbon performance data: Quo vadis? J. Ind. Ecol. 2022, 26, 350–363. [Google Scholar] [CrossRef]
- Capelle-Blancard, G.; Petit, A. Every little helps? ESG news and stock market reaction. J. Bus. Ethics 2019, 157, 543–565. [Google Scholar] [CrossRef]
- Chava, S.; Du, W.; Malakar, B. Do Managers Walk the Talk on Environmental and Social Issues? 390 0814, 2021. [Google Scholar] [CrossRef]
- Cheng, B.; Ioannou, I.; Serafeim, G. Corporate social responsibility and access to finance. Strateg. Manag. J. 2014, 35, 1–23. [Google Scholar] [CrossRef]
- Deegan, C. The legitimising effect of social and environmental disclosures – a theoretical foundation. Account. Audit. Account. J. 2002, 15, 282–311. [Google Scholar] [CrossRef]
- Devlin, J.; Chang, M.-W.; Lee, K.; Toutanova, K. BERT: Pre-training of Deep Bidirectional Transformers for Language Understanding. 2019; arXiv:1810.04805. [Google Scholar] [CrossRef]
- Dhaliwal, D. S.; Li, O. Z.; Tsang, A.; Yang, Y. G. Voluntary nonfinancial disclosure and the cost of equity capital: The initiation of corporate social responsibility reporting. Account. Rev. 2011, 86, 59–100. [Google Scholar] [CrossRef]
- Dorfleitner, G.; Halbritter, G.; Nguyen, M. Measuring the level and risk of corporate responsibility – an empirical comparison of different ESG rating approaches. J. Asset Manag. 2015, 16, 450–466. [Google Scholar] [CrossRef]
- Dyck, A.; Lins, K. V.; Roth, L.; Wagner, H. F. Do institutional investors drive corporate social responsibility? International evidence. J. Financ. Econ. 2019, 131, 693–714. [Google Scholar] [CrossRef]
- Fan, S. An exploratory study on the impact of ESG on business performance – focusing on listed companies in Korea and Taiwan. PLOS ONE 2024, 19, e0310447. [Google Scholar] [CrossRef]
- Freeman, R. E. Strategic Management: A Stakeholder Approach. Pitman: Boston, MA, USA, 1984.
- Friede, G.; Busch, T.; Bassen, A. ESG and financial performance: Aggregated evidence from more than 2000 empirical studies. J. Sustain. Financ. Invest. 2015, 5, 210–233. [Google Scholar] [CrossRef]
- Giese, G.; Lee, L.-E.; Melas, D.; Nagy, Z.; Nishikawa, L. Foundations of ESG investing: How ESG affects equity valuation, risk, and performance. J. Portf. Manag. 2019, 45, 69–83. [Google Scholar] [CrossRef]
- Grewal, J.; Hauptmann, C.; Serafeim, G. Material sustainability information and stock price informativeness. J. Bus. Ethics 2021, 171, 513–544. [Google Scholar] [CrossRef]
- Hartzmark, S. M.; Sussman, A. B. Do investors value sustainability? A natural experiment examining ranking and fund flows. J. Financ. 2019, 74, 2789–2837. [Google Scholar] [CrossRef]
- Ioannou, I.; Serafeim, G. The consequences of mandatory corporate sustainability reporting. Harvard Business School Research Working Paper No. 11-100, 2017. [CrossRef]
- Krüger, P. Corporate goodness and shareholder wealth. J. Financ. Econ. 2015, 115, 304–329. [Google Scholar] [CrossRef]
- Li, F.; Lundholm, R.; Minnis, M. A measure of competition based on 10-K filings. J. Account. Res. 2013, 51, 399–436. [Google Scholar] [CrossRef]
- Lins, K. V.; Servaes, H.; Tamayo, A. Social capital, trust, and firm performance: The value of corporate social responsibility during the financial crisis. J. Financ. 2017, 72, 1785–1824. [Google Scholar] [CrossRef]
- Loughran, T.; McDonald, B. When is a liability not a liability? Textual analysis, dictionaries, and 10-Ks. J. Financ. 2011, 66, 35–65. [Google Scholar] [CrossRef]
- Piccioni, C. A.; Bastos, S. B.; Cajueiro, D. O. Stock Price Reaction to Environmental, Social, and Governance News: Evidence from Brazil and Financial Materiality. Sustainability 2024, 16, 2839. [Google Scholar] [CrossRef]
- Spence, M. Job market signaling. Q. J. Econ. 1973, 87, 355–374. [Google Scholar] [CrossRef]
- Van Duuren, E.; Plantinga, A.; Scholtens, B. ESG integration and the investment management process: Fundamental investing reinvented. J. Bus. Ethics 2016, 138, 525–533. [Google Scholar] [CrossRef]
Figure 1.
Average Abnormal Return (AR) and Cumulative Abnormal Return (CAR) around ESG Event Announcements.
Figure 1.
Average Abnormal Return (AR) and Cumulative Abnormal Return (CAR) around ESG Event Announcements.
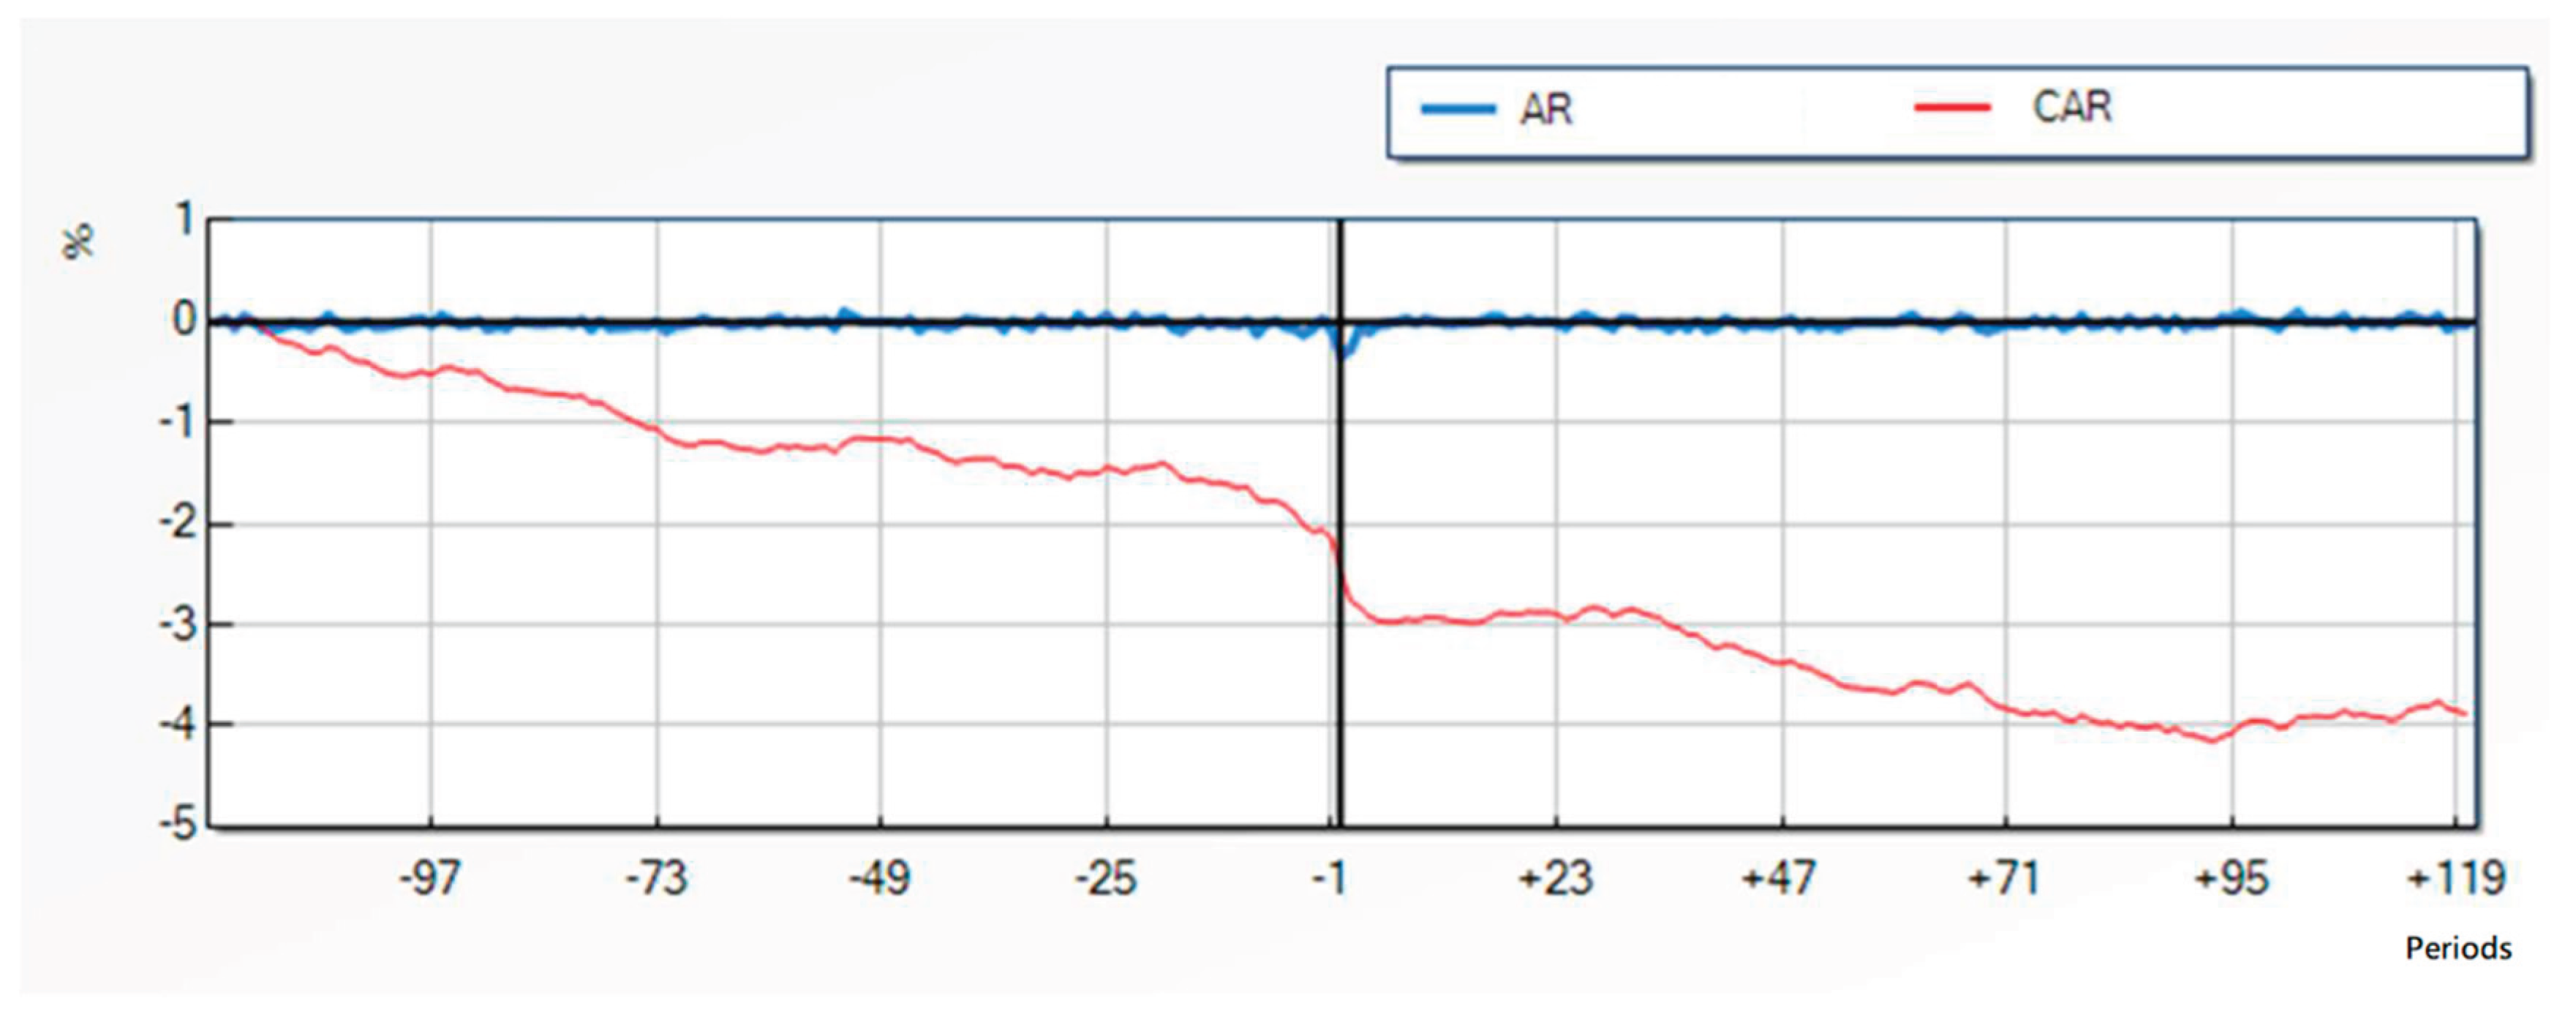
Table 2.
Descriptive statistics.
| Variables | Obs. | Mean | Median | SD | Min | Max |
|---|---|---|---|---|---|---|
| CAR1 (%) | 2576 | -0.9595 | -0.8562 | 6.3713 | -68.246 | 54.3363 |
| CAR5 (%) | 2576 | -1.1839 | -1.0941 | 7.4687 | -61.473 | 66.7988 |
| CAR20 (%) | 2576 | -1.0521 | -1.3716 | 10.8319 | -107.52 | 125.509 |
| CAR60 (%) | 2576 | -1.8411 | -2.9341 | 15.8175 | -147.23 | 101.732 |
| CAR120 (%) | 2576 | -2.0957 | -3.5039 | 21.3214 | -159.9 | 167.368 |
| Sentiment Score | 2576 | -0.8121 | -0.9825 | 0.3865 | -0.9965 | 0.9985 |
| Frequency | 2576 | 1.5703 | 1 | 1.5559 | 1 | 21 |
| Pillar | 2576 | NA | 2 | NA | 1 | 3 |
| Firm Size (log) | 2576 | 17.7939 | 17.4839 | 2.134 | 12.6046 | 23.2803 |
| ROE (%) | 2576 | 1.3542 | 1.88 | 13.2528 | -414.77 | 272.95 |
| P/B | 2576 | 1.8993 | 1.34 | 2.7587 | 0.19 | 75.58 |
| Industry | 2576 | NA | 23 | NA | 11 | 99 |
| Year | 2576 | NA | 2020 | NA | 2014 | 2023 |
Table 3.
Cumulative Abnormal Returns (CARs) by ESG Pillar Across Different Time Windows. The table shows CARs for All events, and separately for E, S, and G events, at horizons of 0, 1, 2, 3, 5, 10, 20, 30, 60, 120 days.
Table 3.
Cumulative Abnormal Returns (CARs) by ESG Pillar Across Different Time Windows. The table shows CARs for All events, and separately for E, S, and G events, at horizons of 0, 1, 2, 3, 5, 10, 20, 30, 60, 120 days.
| Sample | ALL | E | S | G |
|---|---|---|---|---|
| T | ||||
| 0 | -0.3442 | -0.1114 | -0.5332 | -0.2803 |
| 1 | -0.6147 | -0.137 | -0.7995 | -0.6279 |
| 2 | -0.689 | -0.0319 | -0.8309 | -0.7868 |
| 3 | -0.7812 | -0.0461 | -1.0123 | -0.8394 |
| 5 | -0.8391 | -0.1141 | -0.9957 | -0.9471 |
| 10 | -0.7817 | 0.3622 | -1.2665 | -0.7833 |
| 20 | -0.7073 | 0.5896 | -0.9034 | -0.9602 |
| 30 | -0.7001 | 0.9326 | -0.8962 | -1.0545 |
| 60 | -1.4963 | 0.8539 | -1.7656 | -2.0157 |
| 120 | -1.7509 | 0.8901 | -1.9901 | -2.3796 |
Table 4.
Full Sample Regression Results: The Impact of ESG Factors on CARs. The table displays coefficient estimates for Sentiment, Frequency, Pillar dummies, and control variables across the five CAR windows, with standard errors and significance levels.
Table 4.
Full Sample Regression Results: The Impact of ESG Factors on CARs. The table displays coefficient estimates for Sentiment, Frequency, Pillar dummies, and control variables across the five CAR windows, with standard errors and significance levels.
| Dependent Variable | CAR1 | CAR5 | CAR20 | CAR60 | CAR120 |
|---|---|---|---|---|---|
| Independent Variable | |||||
| Sentiment Score | 0.0869 | 0.0554 | .8991* | 0.7411 | 1.7981* |
| -0.2769 | -0.3491 | -0.5189 | -0.7686 | -1.0541 | |
| Frequency | -.1137* | -.1280** | -.2570** | -.5695*** | -1.1110*** |
| -0.0603 | -0.0641 | -0.0943 | -0.1178 | -0.1604 | |
| Pillar | -.3506* | -.4996** | -.7874** | -1.4244*** | -1.5435** |
| -0.18 | -0.2001 | -0.2779 | -0.4126 | -0.5574 | |
| Firm Size | .1135* | .1263* | 0.0909 | 0.2423 | .3623* |
| -0.0626 | -0.0732 | -0.1044 | -0.151 | -0.1993 | |
| ROE | .0268* | 0.0259 | 0.0406 | .0782* | .1511** |
| -0.0148 | -0.0171 | -0.0352 | -0.0462 | -0.0734 | |
| P/B | 0.1004 | 0.061 | 0.1816 | 0.1389 | 0.0819 |
| -0.0721 | -0.0673 | -0.1362 | -0.2097 | -0.2349 | |
| Industry | -0.0051 | 0.0014 | 0.005 | -.0297** | -0.0188 |
| -0.0061 | -0.0078 | -0.0119 | -0.0136 | -0.0173 | |
| Year | .1142** | .1157** | 0.073 | .2055* | 0.0879 |
| -0.0457 | -0.0534 | -0.0744 | -0.1093 | -0.1479 | |
| _Cons | -232.5937** | -235.8405** | -147.727 | -415.9157* | -179.152 |
| -91.8966 | -107.64 | -149.603 | -220.121 | 297.8411 | |
| F-test | 3.24** | 2.83** | 3.00** | 5.60*** | 8.44*** |
| R2 | 0.011 | 0.009 | 0.0099 | 0.0154 | 0.0207 |
The standard errors of the estimated coefficients are shown in parentheses. Statistical significance values at the 10%, 5%, and 1% levels are denoted by *, **, and ***, respectively.
Table 5.
Regression Results for E Events: Impact on CARs.
| Dependent Variable | CAR1 | CAR5 | CAR20 | CAR60 | CAR120 |
|---|---|---|---|---|---|
| Independent Variable | |||||
| Sentiment Score | 0.6066 | 1.1473 | 1.1462 | -0.3682 | 3.2252 |
| -0.6951 | -0.7438 | -0.8677 | -1.3377 | -1.0541 | |
| Frequency | .5663*** | .6115*** | 1.2766*** | 1.2415*** | .9589** |
| -0.1633 | -0.1704 | -0.2145 | -0.3642 | -0.4138 | |
| Firm Size | -0.3112 | -0.3273 | -.5248* | -1.2224** | -.8757* |
| -0.2132 | -0.2217 | -0.2966 | -0.4053 | -0.5306 | |
| ROE | .2245** | .2282** | 0.1482 | 0.1289 | .5918*** |
| -0.0756 | -0.08 | -0.1107 | -0.1244 | -0.1391 | |
| P/B | .7558* | 0.7344 | 1.1142 | 0.9432 | -0.3755 |
| -0.4428 | -0.4834 | -0.8371 | -0.9607 | -1.0706 | |
| Industry | -.0237** | -0.0177 | -0.0175 | -0.0341 | -0.0119 |
| -0.0111 | -0.0124 | -0.0201 | -0.0246 | -0.0294 | |
| Year | .2136* | 0.0407 | -0.091 | -0.0882 | -0.4637 |
| -0.1135 | -0.1212 | -0.1927 | -0.2671 | -0.3604 | |
| _Cons | -426.9975* | -77.5467 | 190.8369 | 197.547 | 953.2075 |
| -228.586 | -244.444 | -388.964 | -538.422 | -727.994 | |
| F-test | 3.89*** | 4.81*** | 7.44*** | 3.61*** | 6.86*** |
| R2 | 0.0898 | 0.0821 | 0.0653 | 0.0474 | 0.0872 |
The standard errors of the estimated coefficients are shown in parentheses. Statistical significance values at the 10%, 5%, and 1% levels are denoted by *, **, and ***, respectively.
Table 6.
Regression Results for S Events: Impact on CARs.
| Dependent Variable | CAR1 | CAR5 | CAR20 | CAR60 | CAR120 |
|---|---|---|---|---|---|
| Independent Variable | |||||
| Sentiment Score | -0.4069 | -0.6323 | -0.4549 | 0.4286 | 0.5441 |
| -0.4112 | -0.4783 | -0.8422 | -1.3539 | -1.6243 | |
| Frequency | -0.0609 | -.1513** | -.3178*** | -.5233*** | -1.2412*** |
| -0.0498 | -0.0581 | -0.086 | -0.0979 | -0.1509 | |
| Firm Size | 0.1162 | 0.0403 | -0.2519 | -0.1098 | -0.0491 |
| -0.0828 | -0.0992 | -0.177 | -0.2456 | -0.318 | |
| ROE | 0.0286 | 0.0478 | -0.1634 | 0.1786 | .6992** |
| -0.0593 | -0.0752 | -0.1523 | -0.2276 | -0.2574 | |
| P/B | .3416** | .3020** | .6747** | 0.1166 | -0.7132 |
| -0.1301 | -0.1286 | -0.2313 | -0.6384 | -0.7487 | |
| Industry | .0241* | .0365* | 0.0507 | 0.0358 | 0.0247 |
| -0.012 | -0.0193 | -0.0403 | -0.0327 | -0.0365 | |
| Year | .2663*** | .2904** | .3239** | .7548*** | .8765*** |
| -0.0747 | -0.0927 | -0.1298 | -0.1856 | -0.239 | |
| _Cons | -542.811*** | -590.5206** | -652.955** | -1524.76*** | -1769.45*** |
| -150.48 | -186.833 | -260.799 | -373.098 | -480.28 | |
| F-test | 5.33*** | 5.84*** | 5.84*** | 9.04*** | 15.2*** |
| R2 | 0.0645 | 0.0477 | 0.0477 | 0.0362 | 0.0673 |
The standard errors of the estimated coefficients are shown in parentheses. Statistical significance values at the 10%, 5%, and 1% levels are denoted by *, **, and ***, respectively.
Table 7.
Regression Results for G Events: Impact on CARs.
| Dependent Variable | CAR1 | CAR5 | CAR20 | CAR60 | CAR120 |
|---|---|---|---|---|---|
| Independent Variable | |||||
| Sentiment Score | 0.007 | -0.1306 | 1.059 | 0.8584 | 1.9598 |
| -0.4123 | -0.5594 | -0.7862 | -1.1172 | -1.6414 | |
| Frequency | -0.4983 | -0.159 | -.7797** | -1.4172** | -1.0903* |
| -0.328 | -0.3009 | -0.3815 | -0.5727 | -0.6401 | |
| Firm Size | .2420** | .2941** | .5811*** | .7954*** | .5772* |
| -0.0916 | -0.1138 | -0.1561 | -0.2315 | -0.3083 | |
| ROE | 0.0088 | 0.0064 | 0.0304 | 0.0702 | .1183* |
| -0.0096 | -0.011 | -0.0352 | -0.0466 | -0.0664 | |
| P/B | -0.0088 | -0.0511 | 0.027 | 0.127 | 0.2883 |
| -0.07 | -0.0616 | -0.11 | -0.1645 | -0.2218 | |
| Industry | -0.0152 | -0.0105 | -0.0052 | -.0541* | -0.0326 |
| -0.011 | -0.0126 | -0.0133 | -0.0208 | -0.0281 | |
| Year | 0.016 | 0.0601 | 0.0569 | -0.009 | -0.2063 |
| -0.0641 | -0.0754 | -0.1067 | -0.1565 | -0.22 | |
| _Cons | -36.4889 | -127.253 | -124.355 | 5.793 | 407.174 |
| -129.059 | -152.047 | -215.018 | -315.745 | -443.831 | |
| F-test | 1.63 | 1.62 | 3.13** | 3.85*** | 2.05** |
| R2 | 0.0109 | 0.0079 | 0.0177 | 0.0242 | 0.0149 |
The standard errors of the estimated coefficients are shown in parentheses. Statistical significance values at the 10%, 5%, and 1% levels are denoted by *, **, and ***, respectively.
Table 8.
Period-Specific Analysis of 2014–2018: Impact on CARs.
| Dependent Variable | CAR1 | CAR5 | CAR20 | CAR60 | CAR120 |
|---|---|---|---|---|---|
| Independent Variable | |||||
| Sentiment Score | 0.0168 | 0.3888 | 0.9873 | 0.9119 | 2.8327* |
| -0.5997 | -0.6985 | -0.8949 | -1.2271 | -1.6048 | |
| Frequency | 0.1797 | 0.0412 | .3892* | 0.161 | -0.0922 |
| -0.1241 | -0.1582 | -0.2297 | -0.2909 | -0.4067 | |
| Pillar | -0.0317 | -.4602* | -.6289* | -0.4169 | -0.6229 |
| -0.2366 | -0.2731 | -0.358 | -0.5645 | -0.7623 | |
| Firm Size | .1893** | 0.1889 | 0.1813 | 0.1107 | 0.5235 |
| -0.0957 | -0.116 | -0.1559 | -0.2412 | -0.3283 | |
| ROE | -0.0003 | 0.00004 | -0.0088 | 0.0224 | 0.0677 |
| -0.0078 | -0.007 | -0.016 | -0.0278 | -0.0495 | |
| P/B | 0.1102 | -0.0792 | 0.4252 | 0.4127 | -0.5995 |
| -0.1621 | -0.2047 | -0.2884 | -0.4588 | -0.628 | |
| Industry | 0.0097 | .0174** | -0.0023 | -0.0118 | 0.0087 |
| -0.0071 | -0.0082 | -0.0131 | -0.0183 | -0.028 | |
| Year | .4270** | .5282*** | .8025*** | 1.7671*** | 1.8845*** |
| -0.1428 | -0.1816 | -0.2268 | -0.3533 | -0.4699 | |
| _Cons | -866.0513** | -1068.49*** | -1620.76*** | -3564.45*** | -3804.62*** |
| -287.588 | -366.006 | -456.89 | -711.814 | -946.989 | |
| F-test | 2.74*** | 2.69*** | 3.54*** | 4.18*** | 3.37*** |
| R2 | 0.0192 | 0.0228 | 0.0281 | 0.0327 | 0.0334 |
The standard errors of the estimated coefficients are shown in parentheses. Statistical significance values at the 10%, 5%, and 1% levels are denoted by *, **, and ***, respectively.
Table 9.
Period-Specific Analysis of 2019–2023: Impact on CARs.
| Dependent Variable | CAR1 | CAR5 | CAR20 | CAR60 | CAR120 |
|---|---|---|---|---|---|
| Independent Variable | |||||
| Sentiment Score | 0.0895 | -0.1387 | 0.6511 | 0.3822 | 0.8439 |
| -0.2944 | -0.3994 | -0.6396 | -0.9575 | -1.3381 | |
| Frequency | -.1556** | -.1290** | -.3174*** | -.5163*** | -1.0784*** |
| -0.0665 | -0.0642 | -0.0895 | -0.1235 | -0.1664 | |
| Pillar | -.4797* | -0.3975 | -0.6129 | -1.7742*** | -1.6688** |
| -0.2525 | -0.2777 | -0.4087 | -0.5992 | -0.7899 | |
| Firm Size | 0.0255 | 0.0519 | -0.0089 | 0.2077 | 0.1538 |
| -0.0765 | -0.0891 | -0.1288 | -0.1825 | -0.2366 | |
| ROE | .1025*** | .1017*** | .1724*** | .2193*** | .3937*** |
| -0.0306 | -0.0327 | -0.0542 | -0.0823 | -0.0981 | |
| P/B | .1959** | .1709** | .3252** | 0.2877 | 0.4342 |
| -0.083 | -0.0792 | -0.1339 | -0.2484 | -0.2945 | |
| Industry | -0.0137 | -0.0074 | 0.0061 | -.0459** | -.0366* |
| -0.0085 | -0.0111 | -0.017 | -0.0184 | -0.0219 | |
| Year | 0.0669 | 0.1242 | .5048*** | 1.1821*** | 1.3438*** |
| -0.1097 | -0.1225 | -0.1859 | -0.2942 | -0.3917 | |
| _Cons | -135.06 | -252.217 | -1019.81*** | -2389.06*** | -2715.33*** |
| -221.739 | -247.711 | -375.789 | -594.792 | -791.756 | |
| F-test | 2.37** | 1.90* | 5.86*** | 8.98*** | 13.63*** |
| R2 | 0.0244 | 0.0169 | 0.0268 | 0.0362 | 0.0432 |
The standard errors of the estimated coefficients are shown in parentheses. Statistical significance values at the 10%, 5%, and 1% levels are denoted by *, **, and ***, respectively.
Disclaimer/Publisher’s Note: The statements, opinions and data contained in all publications are solely those of the individual author(s) and contributor(s) and not of MDPI and/or the editor(s). MDPI and/or the editor(s) disclaim responsibility for any injury to people or property resulting from any ideas, methods, instructions or products referred to in the content. |
© 2025 by the authors. Licensee MDPI, Basel, Switzerland. This article is an open access article distributed under the terms and conditions of the Creative Commons Attribution (CC BY) license (http://creativecommons.org/licenses/by/4.0/).
Copyright: This open access article is published under a Creative Commons CC BY 4.0 license, which permit the free download, distribution, and reuse, provided that the author and preprint are cited in any reuse.


