Submitted:
15 July 2025
Posted:
16 July 2025
You are already at the latest version
Abstract
This paper examines the relationship between talent allocation pattern and innovation in China. We use census data from 2005, 2010, and 2015 to estimate the concentration of talent in government departments at city level, representing the pattern of talent allocation. We find that the current talent allocation pattern negatively impacts corporate innovation. A one standard deviation increase in government talent concentration leads to 3.1% decrease in the average number of patent applications by industrial enterprises within the jurisdiction over the following three years. This negative effect is primarily driven by non-state-owned enterprises and small and medium-sized enterprises. The government-biased talent allocation pattern results in lower quality of R&D personnel in enterprises. Additionally, government departments with higher talent concentration have stronger tax collection abilities, leading to an increased real tax burden on enterprises and crowding out R&D expenditure, while failing to provide effective support for corporate innovation through public goods provision.
Keywords:
talent allocation
; innovation
; government capability
1. Introduction
Talent allocation is widely recognized as playing a critical role in shaping economic development (Baumol, 1990; Murphy et al.,
1991; Acemoglu, 1995; Hsieh et al., 2019). The diversion of talent into
unproductive or rent-seeking activities reduces aggregate productivity (Baumol,
1990), and countries with a disproportionate share of talent engaged in such
activities tend to experience markedly slower economic growth (Murphy et
al.,1991). This issue is particularly salient in developing countries, where the
overall stock of human capital is limited, making the efficient allocation of
talent especially important.
However, the public sector—as the typical
non-productive sector—continues to attract considerable interest in the labor
market due to its advantages in compensation, job security, and occupational
prestige (Shao et al., 2018; Cavalcanti and Santos, 2021). In developing countries such as China, the public sector
remains highly attractive to top graduates. According to the 2021 Annual
Report on Graduate Employment Quality released by Tsinghua University, one of
China's top universities, approximately 46.1% of its graduates chose to enter
government agencies and public service. This has drawn attention to talent
misallocation and raised concerns that insufficient investment in scientific
and technological talent may constrain innovation performance. Such concerns
are especially pressing as China strives to overcome the middle-income trap,
with the sustainability of its economic growth increasingly dependent on
innovation. This raises a critical question: does the government-biased talent
allocation pattern hinder innovation in China, and if so, to what extent?
However, micro-level empirical evidence on this issue remains limited.
This paper addresses above limitations and examines
how the concentration of government-employed talent affects innovation with
firm-level panel data. Using census data from 2005, 2010, and 2015, we
construct a proxy for city-level government talent concentration to capture the
allocation pattern between government and non-government sectors. We find that
the current pattern of talent allocation in government departments
significantly suppresses enterprise innovation: a one-standard-deviation
increase in government talent concentration at the city level is associated
with a 3.1% decline in the average number of patent applications by industrial
enterprises over the following three years. After controlling for the personal
characteristics of mayors, as well as whether turnover at the year, the results
remain highly significant. This negative effect is more pronounced for utility
model patents and is primarily driven by non-state-owned and small to
medium-sized enterprises,
I conduct a detailed examination of the underlying
mechanisms. On the one hand, the concentration of talent in government
departments leads to a significant decline in the quality—rather than the
quantity—of R&D personnel within firms. On the other hand, it affects state
capacity in a dual manner. As talent shifts toward the public sector, the
“grabbing hand” of government—its tax extraction capacity—is strengthened,
resulting in heavier tax burdens on firms and crowding out R&D investment.
Meanwhile, the “helping hand”—public goods provision—fails to improve
accordingly.
These findings carry important policy implications
for promoting enterprise innovation in China. It requires not only alleviating
the excessive concentration of talent in the public sector to release human
capital for innovation, but also incentivizing existing public-sector talent to
support firms through improved public service provision rather than through
taxation.
2. Literature Review
This study speaks to three strands of the
literature. First, it relates to researchs on talent or human capital
allocation and its economic consequences (Baumol, 1990; Murphy et al., 1991;
Acemoglu, 1995; Hsieh et al., 2019), with particular attention to the
distribution of talent between the public and private sectors (Gomes, 2018;
Albrecht et al.2019; Cavalcanti and Santos, 2021; Geromichalos and Kospentaris,
2022). These studies emphasize that excessive talent allocation to the public
sector may reduce aggregate output, employment, and total factor productivity.
Extending this perspective to the domain of innovation, Pan et al. (2020)
develop an endogenous growth model and find that the overexpansion of the
public sector reduces the inflow of R&D talent into the private sector in
China. This negative impact outweighs the positive effects of public services,
ultimately hindering the transition from imitation-based innovation to
independent innovation. Chen (2022) provides empirical evidence, based on
city-level cross-sectional data, that government-biased talent allocation
significantly suppresses innovation. This paper complements the empirical
literature on talent allocation and innovation (Chen, 2022) by utilizing
detailed firm-level panel data. It contributes by providing new insights into
firm-level heterogeneity—regarding ownership type and firm size—as well as
exploring underlying mechanisms and conducting comprehensive robustness checks.
Second, this study contributes to the literature on
bureaucratic quality and state capacity (He and Wang, 2017; Xu, 2018; Besley et
al., 2021; Moreira and Pérez, 2024). A high-quality bureaucracy is widely
recognized as essential for the effective functioning of public institutions
(Evans and Rauch, 1999; Leaver et al., 2021; Besley et al., 2021). Public
sectors staffed with more skilled personnel may be better positioned to deliver
high-quality public services, thereby enhancing firm productivity. However,
when talent is excessively concentrated in the public sector, these potential
benefits may be outweighed by the negative effects of diverting talent from
productive activities. This paper contributes to this line of inquiry by
analyzing how talent concentration in government affects state capacity along
two dimensions: taxation and public goods provision. The findings reveal that
while tax extraction capacity increases with talent concentration, the
provision of public goods does not improve accordingly.
In addition, this study relates to the substantial
body of literature on human capital and innovation (Romer, 1990; Gennaioli et
al., 2012; Squicciarini and Voigtländer, 2015), particularly empirical studies
(McGuirk et al., 2015; Sun et al., 2020; Moretti,2021; Zhang and Guo, 2025).
This paper adds to this literature by providing evidence that excessive
concentration of talent in the public sector directly reduces the quality of
R&D personnel in firms. I highlight that, for developing countries, achieving
a balanced allocation of talent between the public and private sectors—and
ensuring that sufficient human capital is directed toward innovation—may be
more critical than merely expanding the overall stock of human capital.
The paper is structured as follows: Section 3 presents the theoretical framework; Section 4 describes data sources, variable
definitions and descriptive statistics; Section 5 presents the empirical strategy and empirical results, including
baseline regression results, endogeneity treatment, robustness checks and
heterogeneity analysis; Section 6
presents mechanism analysis. Finally, Section 7
provides a summary.
3. Theoretical Framework
This paper examines the impact of talent allocation
patterns on innovation through three main mechanisms: including (1) the
quantity and quality of R&D talent within firms and state capacity, which
can be divided into two aspects: (2) the government's grabbing hand through tax
collection and its crowding-out effect on enterprise R&D investment; and
(3) the government's helping hand through the provision of public goods.
Quantity and Quality of R&D personnel:
Endogenous growth theory posits that technological progress is the fundamental
driver of economic growth (Romer 1990). Human capital is the key production
factor in generating new knowledge and technologies. Innovation activities
require a minimum threshold of human capital, as only individuals with a
certain level of educational attainment are qualified to engage in
R&D—referred to in this study as talent. Firms, as the principal agents of
technological innovation, rely heavily on such talent. However, government
departments require talented civil servants to ensure effective administration
and high-quality public service delivery. Given the relatively inelastic supply
of skilled labor in the short term, both government and firms compete for the
same talent pool, making talent allocation a zero-sum game.
Attractive benefits—such as wage premium and
generous pensions and job stability (Gomes, 2018; Albrecht et al. 2019;
Cavalcanti and Santos, 2021), as well as occupational prestige (Shao et al.,
2018; Xu and Adhvaryu, 2023)—make civil service positions highly appealing.
Additionally, merit-based recruitment allows government agencies to select top
candidates (Geromichalos and Kospentaris, 2022), leading to a talent allocation
pattern skewed toward the public sector. Although not all private-sector talent
engages in R&D, an excessive inflow of skilled workers into the public
sector shrinks the pool available to firms and raises recruitment costs.
Consequently, firms may be forced to reduce the size or quality of their
R&D teams. Thus, excessive talent allocation to the government sector
undermines both the quantity and quality of research talent available to firms.
Grabbing hand, tax burden and R&D
investment: Government departments are not only major employers in the
labor market but also play a critical role in policy implementation and public
service delivery. State capacity hinges on the quality of its civil service
workforce (Besley et al., 2021). This study focuses on two core government
functions frequently emphasized in the literature: tax collection and the
provision of public goods. For firms, the former represents the grabbing hand,
while the latter constitutes the helping hand.
From the perspective of tax collection, a
higher-quality bureaucracy enhances the government's capacity to enforce
taxation (Xu, 2018). Holding the size of the public workforce and nominal tax
rates constant, an inflow of more capable individuals into government
strengthens tax enforcement and reduces the scope for tax evasion and avoidance
by firms. However, for enterprises, a heavier tax burden may crowd out
expenditures otherwise allocated to R&D investment. Therefore, as talent
becomes increasingly concentrated in government departments, tax enforcement
capacity rises, actual tax burdens increase, and firms' R&D expenditures
decline accordingly.
Helping hand and provision of public goods: However,
what enterprises value more is the government's helping hand—its capacity to
provide essential public goods and services. Public infrastructure, such as
communication networks and transportation systems, promotes the flow of people
and information (Acemoglu, 2015; Agrawal et al.,2017; Yang et al, 2022).
Additionally, public services in education and healthcare can reduce
labor-related costs for firms. In this sense, a more capable bureaucracy
enhances the government's ability to deliver high-quality public services (He
and Wang, 2017; Dahis et al.,2023), thereby indirectly promoting firm
innovation. The greater the concentration of talent in government departments,
the more abundant the provision of public goods and the higher the quality of
services firms can rely on.
In conclusion, the concentration of talent in
government departments can have both positive and negative effects on
enterprise innovation. Theoretically, this implies an inverted U-shaped
relationship and there exists an optimal level of government talent
concentration that maximizes innovation output. When talent allocation
surpasses this optimal point and becomes excessively concentrated in government
departments, the negative effects outweigh the positive ones. Consequently, the
greater the concentration of talent in the public sector, the more enterprise
innovation is inhibited and vice versa. In the following sections, I use
firm-level data from China to first analyze the impact of the government-biased
talent allocation pattern on innovation and empirically test the mechanisms
discussed above.
4. Data Sources and Descriptive Statistics
4.1. Allocation Pattern of Talent
I construct an index to characterize the allocation
pattern of talent between government and non-government sectors. Following the
literature on human capital distribution between government and enterprises (Li
and Yin, 2017), we define Government Department Talent Concentration (GDTC)
as the ratio of the proportion of talent in government departments to that in
all non-agricultural employment sectors. The calculation is presented in
equation (1).
The data used to calculate talent concentration in
government departments are drawn from the subsample of 1% Population Sampling
Survey of 2005, the 2010 Population Census, and the 1% Population Sampling
Survey of 2015, which are currently the most comprehensive micro-survey data
covering almost all cities nationwide and with the largest sample size. In this
study, employees[1]
with a bachelor's degree or higher are defined as talent, and the intersection
of individual industry and occupation information is used to define government
department employees (i.e., civil servants[2])
and non-agricultural employees[3].
To mitigate sampling bias from small city samples, I exclude outliers and
cities with fewer than 20 sampled government employees, resulting in a final
sample of 819 observations across 273 cities for the period 2005–2015.
The first row of Panel A in Table 1 reports the descriptive statistics of
talent concentration in government departments at the city level, with an
average value of 5.072, indicating that, on average, the proportion of talents
in government departments is more than five times that of the overall
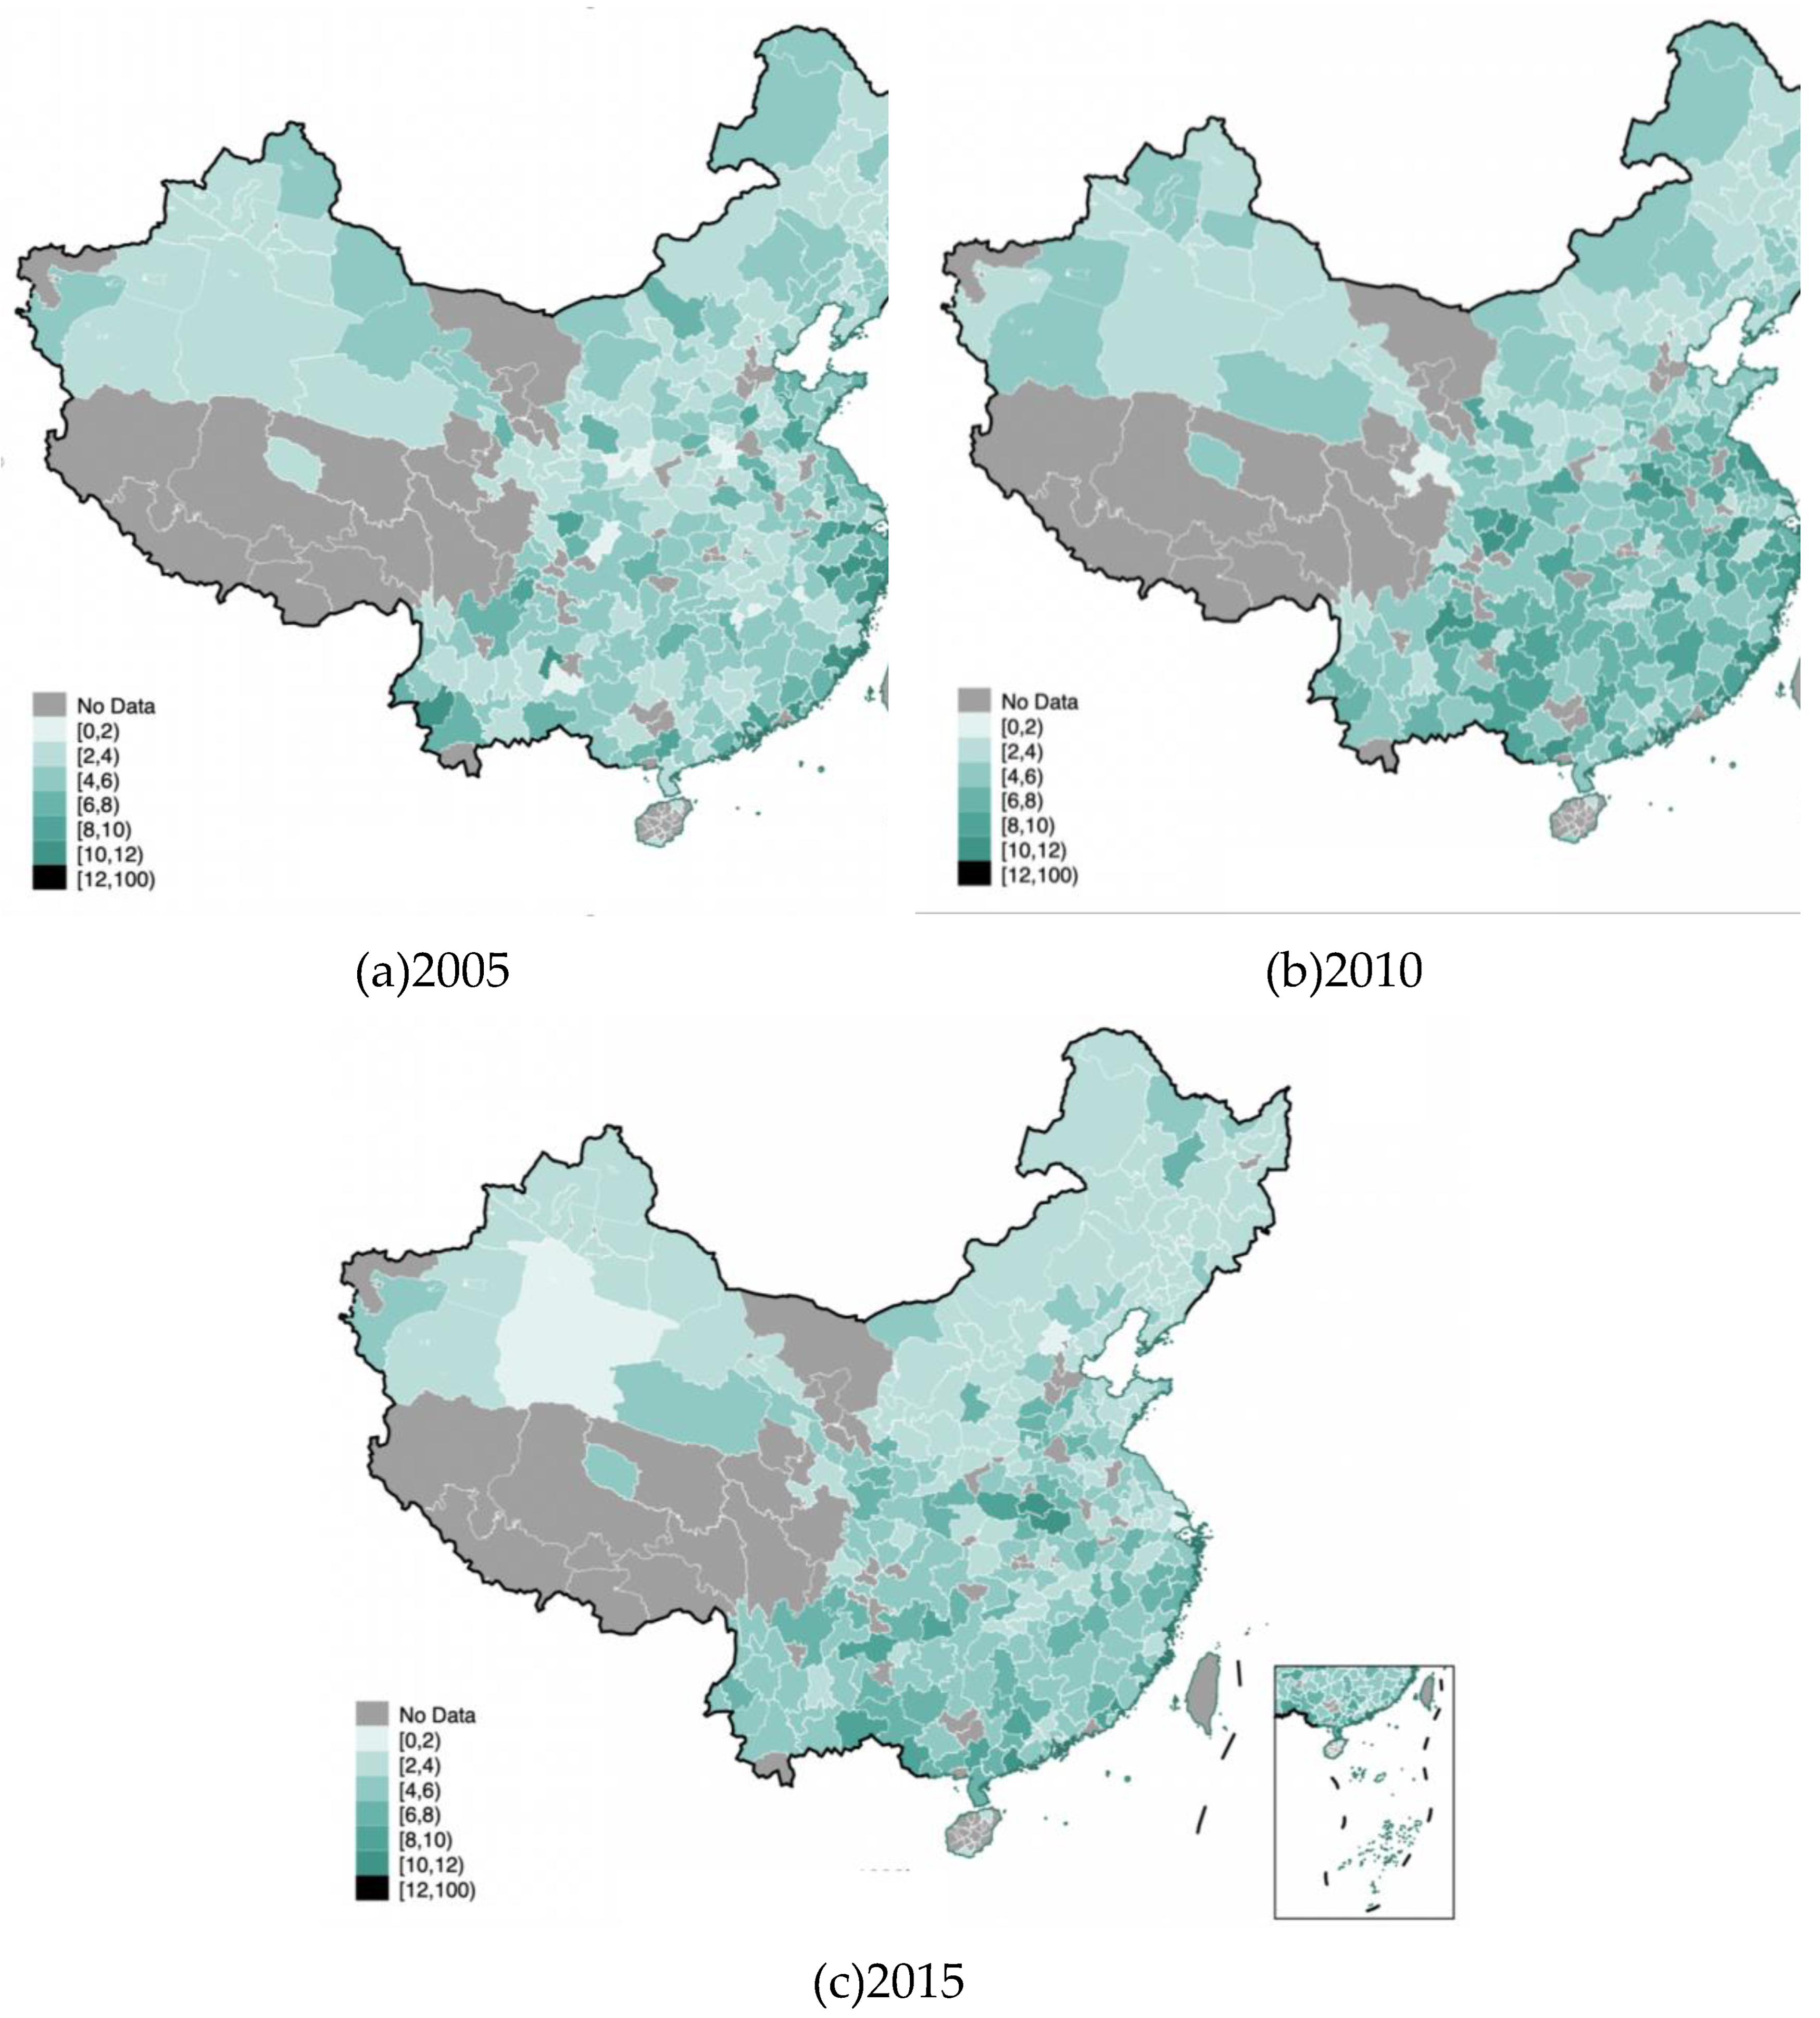
non-agricultural employed population. Figure A1
illustrates both the cross-city variation in government department talent
concentration (GDTC) and its evolution from 2005 to 2015. In 2005, the highest
levels of GDTC were primarily observed in the eastern coastal regions, likely
reflecting the earlier adoption of merit-based recruitment mechanisms. By 2010,
the national average GDTC had risen, and by 2015, the highest concentrations
were found in parts of central and southwestern China.
4.2. Firm-Level Data
To align with the years of the population census
data, this study uses industrial enterprise samples from 2005, 2010, and 2015.
The 2005 data are drawn from the China Industrial Enterprise Database (CIED),
while the 2010 and 2015 data are obtained from the National Tax Survey Database
(NTSD)[4]. Following
the matching method for industrial enterprise databases by Brandt et al.
(2012), I match and merge the enterprise samples from the two databases
sequentially according to corporate legal codes and enterprise names. Then I
clean the data[5] and check
operating status[6].
Finally, I get a balanced panel consisting of 25,460 continuously operating
enterprises from 2005 to 2019, with a total of 76,380 observations. Table 1 Panel B presents summary statistics for
the firm-level control variables, including total assets, number of employees,
firm age, debt-to-asset ratio, return on total assets, and dummy variables
indicating whether a firm is state-owned or an exporting enterprise.
4.3. Innovation Data
I use the number of invention patents and utility
model patents as measures of firm-level innovation output, excluding design
patents that are less related to technological innovation. The patent data is
sourced from the incoPat Database, which provides global intellectual property
data services. Following the matching procedure of Kou et al. (2020), I match
firm names and abbreviations from the industrial enterprise dataset to patent
applicants, retaining only exact matches to ensure accuracy. The matched data
cover patent applications filed between 2005 and 2019, yielding a total of
1,446,507 patent applications, of which 736,675 are invention patents. Figure 1 illustrates the trend in patent
applications (by first applicant) from 2005 to 2019. It is noteworthy that the
majority of patent applications are concentrated among a small group of large
firms. Even in 2019, less than one-quarter of the sample firms filed a patent
application in that year. indicating considerable heterogeneity in innovation
performance across firms.
I use census years (2005, 2010, and 2015) as base
years and examine firms' patent applications in subsequent years. Table 2 Panel A reports the total number of
patent applications filed over the following n years (log-transformed, plus
one), where n = 1, 2, 3, 4. Panel B reports a binary indicator for whether a
firm filed any patents. On average, sample firms filed 10.679 patents over the
next three years, while 29.6% of firms filed at least one patent.
5. Allocation Pattern of Talent and Innovation
5.1. Empirical Model
Based on the theoretical framework and data
structure, I specify the baseline regression as a two-way fixed effects model,
as shown in Equation (2):
denotes the innovation output of firm i in city c,
measured by patent applications over the next n years from base year t (t=2005,
2010, 2015). There are two forms of dependent variable, the number of
patent applications (logarithm of total number plus one) and whether a firm
filed any patents (1 for yes, 0 for no).
This setting accounts for the time lag between
R&D investment and the realization of patent outputs (Carlino, 2007). For
instance, patents filed in year t+3 may stem from R&D activities initiated
in year t, particularly for complex technologies requiring longer development
cycles. Moreover, the data indicate that, unlike a few large firms with
sustained innovation activities (e.g., Huawei, Gree), most small and
medium-sized enterprises (SMEs) display irregular and intermittent innovation
patterns. For example, if Firm A files no patents in year t+1, three in
t+2, and one in t+3, relying on a single year's data may introduce
measurement error. Using cumulative patent applications over multiple years
helps smooth short-term volatility, better capture innovation output, and
reduce measurement error. It also mitigates concerns about reverse causality to
some extent. Accordingly, this paper primarily uses the cumulative number of
patent applications over the next three years as the dependent variable.
is the core explanatory variable of this study,
representing the concentration of talent in government departments in city c
during year t, denotes the firm level fixed effects to control
for unobserved time-invariant effects, while represents year fixed effects. includes a set of city-level control variables:
per capita GDP (log-transformed), resident population (log-transformed), the
share of secondary and tertiary industry output[7],
the proportion of non-agricultural employment and the proportion of
non-agricultural workers with a bachelor's degree or higher.[8]
Additionally, a dummy variable is included to indicate whether the city was
designated as a national innovation pilot city in year t, capturing the
potential influence of regional innovation policies[9].
At the firm level, control variables include firm age (log-transformed), number
of employees (log-transformed), total assets (log-transformed), return on
assets, debt-to-assets ratio, ownership type (state-owned or non-state-owned),
and whether the firm is an exporter. Descriptive statistics are presented in Table 1. Furthermore, acknowledging significant
industry differences in patent applications (Hu et al., 2017), I control for
industry-year trends using two-digit industry codes. is error term, which is clustered at the
city-industry level.
5.2. Baseline Results
Table 3
presents the baseline regression results. Columns (1) to (3) sequentially add
city-level control variables, firm-level control variables, and industry-year
trends. Across all specifications, the coefficients on government department
talent concentration are consistently negative and statistically significant at
the 1% level, suggesting that a higher concentration of talent in government
departments significantly dampens firm-level innovation output. We take column
(3) as the baseline regression, which suggests that a one standard deviation
increase in talent concentration in government departments would result in a
3.1% decrease in the number of patent applications filed by firms over the
following three years.
Considering that patent applications are the
behavior of a minority of firms, columns (5) to (7) employ a binary indicator
for whether a firm files any patent applications over the subsequent three
years as the dependent variable. The results remain robust, indicating that
higher talent concentration in the public sector reduces the probability of
firms engaging in patenting activities.
As previously discussed, the relationship between talent concentration in government departments and firm innovation is theoretically expected to follow an inverted U-shape. In columns (4) and (8), I include the quadratic term of talent concentration in government departments. The results show that both the linear and quadratic terms are negative and insignificant, suggesting that the hypothesized inverted U-shaped relationship is not supported empirically.
Two possible explanations are proposed: first, the concentration of talent in government departments has already surpassed the optimal point, with the negative effects outweigh the positive effects; second, the hypothesized positive effects through improved public goods provision (Hypothesis 4) may be absent or insignificant. These possibilities will be further explored in the mechanism analysis. This will be examined further in the mechanism analysis.
Columns (1) to (4) of Table 4 use cumulative patent applications over the following 1 to 4 years (from t+1 to t+4) as dependent variables, while columns (5) to (8) use annual patent applications in each subsequent year (t+n) as the dependent variable. Across all specifications, the coefficients on government talent concentration are negative, indicating a consistent negative impact on firm innovation output. However, the magnitude and significance of this effect gradually diminish over time and become statistically insignificant after four years. These findings provide indirect support for using three-year forward patent applications as the primary outcome variable in the main analysis.
5.3. Endogeneity
Although forwarding the dependent variable helps mitigate concerns of reverse causality, and the regressions control for firm fixed effects, year fixed effects, and industry-specific trends, the results may still be subject to bias from unobserved time-varying factors, such as regional employment preferences, or cultural and political institutional factors like government rent-seeking, may have biased the results. To address this issue, I adopt an instrumental variable (IV) approach. Institutional environments often exhibit path dependence, and I use the talent concentration of the older generation of civil servants as an instrument. Parental career choices can influence those of their offspring, and persistent institutional inertia in government recruitment systems contributes to the intergenerational correlation in public-sector talent concentration. Importantly, the talent concentration of the previous generation is unlikely to directly affect firm-level innovation outcomes decades later, thereby satisfying the exclusion restriction required for a valid instrument.

Table 5.
Endogeneity—Instrumental Variable Estimation.
| (1) | (2) | (3) | (4) | |
| T+1 | T+2 | T+3 | T+4 | |
| Panel A. First-stage estimation | ||||
| GDTC | 0.457*** | 0.457*** | 0.457*** | 0.457*** |
| (0.046) | (0.046) | (0.046) | (0.046) | |
|
Panel B. Second-stage estimation Number of Patent Applications within the Following 3 Years | ||||
| GDTC | -0.023** | -0.035*** | -0.040*** | -0.033** |
|
Panel C. Second-stage estimation Whether the Firm Applies for Patents within the Following 3 Years | ||||
| GDTC | -0.017*** | -0.018*** | -0.018*** | -0.015*** |
| (0.005) | (0.005) | (0.005) | (0.005) | |
| Controls | YES | YES | YES | YES |
| Firm FE | YES | YES | YES | YES |
| Year FE | YES | YES | YES | YES |
| Industry trends | YES | YES | YES | YES |
| KP F-statistic | 109.262 | 109.262 | 109.262 | 109.262 |
| N | 76338 | 76338 | 76338 | 76338 |
Notes: Control variables include city-level control variables and firm-level control variables; Standard errors clustered are clustered at the city-industry level; *, *, *** denote significance at the 10%, 5%, and 1% levels, respectively.
I use the data from 1% subsample of the 1990 census, defining the parent generation of civil servants as those aged 40-60, 35-55, and 30-50, corresponding to the years 2005, 2010, and 2015, respectively. The talent concentration of this cohort is calculated and used as the instrumental variable. Table 6 Panel A reports the first-stage estimation results, showing a significant positive correlation between the instrumental variable and the , with a KP F-statistic of 109.262, well above the conventional threshold of 10, thus passing the weak instrument test. Panels B and C report the second-stage estimation results, where the dependent variables are the number of patent applications and whether file any patents in subsequent years, respectively. The IV estimates are slightly larger than the baseline OLS estimates, and the level of statistical significance remains robust. These findings provide further evidence that the current concentration of talent in government departments in China significantly dampens firm-level innovation within local jurisdictions.
5.4. Robustness Check
Control for the personal characteristics of the mayor. Considering the personal characteristics of political leaders, such as educational background (Besley et al.,2011; Yao and Zhang, 2015), age and tenure, have impact on regional economic development. I further control the mayor's educational background, which is categorized into five levels: high school and below, associate degree, bachelor's degree, master's degree, and doctoral degree. In regression, I take the high school and below group as the reference. I also control for the mayor's age and gender characteristics, as well as their tenure in office[10].Table 6 reports the estimation results: columns (1)-(2) present the results from the two-way fixed effects model, while columns (3)-(4) display the corresponding instrumental variable estimates.
Compared to the baseline regression, the magnitude and significance of the core explanatory variables remain robust. It also indicates that the mayor's educational background may have a positive impact on firm innovation within the jurisdiction, with the impact of a master's degree being the largest and most significant (although this effect is not significant when using patent applications as the dependent variable). Although, the personal characteristics of local leaders, especially their educational background, may have some influence on firm innovation in their jurisdictions, this does not change the conclusion that the concentration of talent in government departments tends to inhibit firm innovation.
Other robustness check. Although identifying the enterprise as the first applicant reflects its primary contribution to technological innovation, approximately 14% of patents in the sample involve multiple applicants. As a robustness check, I relax the restriction on first-applicant status and instead count all patents in which the enterprise is listed as a participant (Table 7, Panel A). Columns (1) and (2) report the estimated effects of government talent concentration on the number of patents applied for and the likelihood of participation in patent applications over the next three years, based on the two-way fixed effects model. Columns (3) and (4) present the corresponding IV estimates. The magnitude and significance of the coefficient for the concentration of talent in government departments are almost identical to those in the baseline regression.
Additional robustness checks are presented as follows: first, relaxing the definition of talent to include those with an associate degree or higher education (Panel B); second, substituting educational qualifications with average years of education and redefine talent concentration as the ratio of the average education years of government employees to that of the non-agricultural workforce (Panel C); third, excluding firms located in municipalities from the sample (Panel D). Across all specifications, the results remain consistent with the baseline findings. Coefficients are statistically significant at the 1% level in Panels B and C, and at the 5% level in Panel D. These results further confirm the negative impact of talent concentration in government departments on enterprise innovation within the jurisdiction.
5.5. Heterogeneity Analysis
Heterogeneity of patent types. I begin by examining the effects of government department talent concentration on different types of patent applications. Invention patents, characterized by higher application thresholds, stringent review standards, and long protection period, are generally viewed as reflecting higher levels of technological sophistication. Table 8 Panel A, Columns (1)-(2) and Columns (3)-(4) report the effects of government talent concentration on the number of invention and utility model patent applications filed by firms over the next three years, based on fixed effects (FE) and instrumental variable (IV) estimations, respectively.
The results show that the coefficients for invention patents is not significant under both FE and IV estimations, while the coefficients for utility model patents are significant at the 1% level. However, in Panel B, where whether a patent application was filed within the next three years is used as the dependent variable, the coefficients for both types of patents are negative and significant at the 1% level. This may be due to greater variation in invention patent activity across firms and the higher technical complexity of invention patents, which makes the innovation process more multifaceted and susceptible to various factors. Overall, talent concentration in government departments seems to inhibit more utility model patent applications rather than invention patents.
Heterogeneity in Enterprise ownership and Enterprise Size. Existing studies consistently find substantial heterogeneity in innovation behavior across firms of different ownership types and sizes—a pattern also evident in our sample. In our sample, state-owned enterprises (SOEs), which account for 5.5% of the total, are responsible for approximately 12% of patent applications. Table 9 Panel A presents heterogeneity in the effect of government talent concentration on innovation between SOEs and non-SOEs. In Column (1), the coefficient for SOEs is positive but statistically insignificant. In contrast, Column (2) shows a significantly negative coefficient for non-SOEs. These findings remain robust under instrumental variable estimation. Overall, talent concentration in government departments does not appear to hinder innovation among SOEs and may even be beneficial. The observed negative effect is predominantly driven by non-SOEs.
Additionally, large enterprises—although accounting for less than 20% of the sample—are responsible for approximately 74% of total patent applications. I further explore the heterogeneous effects of government talent concentration on large enterprises versus small and medium-sized enterprises (SMEs) [11](Table 9 Panel B). In Columns (5) and (7), the coefficients for large enterprises are negative but statistically insignificant. By contrast, Columns (6) and (8) show that for SMEs, the coefficients are significantly negative at the 1% level under both fixed effects and IV estimations. These results indicate that excessive talent concentration in government departments significantly inhibits innovation among SMEs, with the negative impact being more pronounced for smaller firms.
6. Mechanism Analysis
How does the concentration of talent in government departments impact the innovation output of enterprises in China? This section explores the underlying mechanisms. First, I investigate whether the talent concentrating in government departments reduce the high-skilled workers needed for corporate innovation. Second, I assess how government talent concentration affects government capabilities. Specifically, I consider two aspects: (1) the grabbing hand-whether enhanced tax collection capacity increases firms' tax burdens, thereby constraining R&D investment; and (2) the helping hand, whether a government with more concentrated talent contributes to corporate innovation by improving public goods provision.
GDTC and investment in research personnel of firms. Innovation relies heavily on the investment in human capital. However, in the short term, the talent pool within a city is relatively inelastic. When government departments in a city concentrate a larger share of talent, enterprises face the challenges of insufficient R&D personnel and a decline in the average quality of R&D personnel. Due to the lack of firm-level data on R&D personnel, I use census data to estimate the employment scale and quality of enterprise technical personnel at the city level. Enterprise employees are defined as non-agricultural workers outside the public sector [[12]], and technical R&D personnel are identified as those engaged in professional and technical occupations. The scale of enterprise R&D talent is measured by the share of technical R&D personnel employed in enterprises relative to the total technical workforce in the city. The quality of enterprise R&D talent is proxied by the proportion of enterprise R&D personnel holding a bachelor's degree or above.
As shown in column (1) of Table 10, the coefficient of government talent concentration on the employment scale of enterprise R&D personnel is –0.002 and statistically insignificant. However, column (2) reveals that the coefficient on the quality of enterprise R&D personnel is –0.004 and statistically significant at the 1% level. This suggests a trade-off in talent allocation: when government departments absorb a disproportionate share of talent, firms experience a decline in the average quality of their R&D workforce, which in turn suppresses innovation output.
Moreover, insufficient investment in R&D talent may lead to lower R&D efficiency. In column (3), I include R&D expenditure, measured as a binary variable indicating whether a firm reports any spending on new product or technology development. Due to extensive missing data in 2015, the analysis is restricted to 2005 and 2010. The interaction term between government talent concentration and R&D expenditure is negative but insignificant. This result provides indicative evidence that excessive talent concentration in government departments may lower the quality of R&D personnel in firms, potentially reducing R&D efficiency and ultimately leading to lower innovation output.
GDTC, Grabbing Hand of the Government and Firm's R&D expenditure. As the government attracts more talent, its capacity may also be strengthened. I further examine the relationship between talent concentration and government capacity, beginning with the government's most fundamental function—taxation capacity(Xu, 2018)—which also has a significant impact on firms' productive and innovation activities(Chen et al.2021; Fang et al.,2023).
Among various taxes, corporate income tax is one of the most important levies imposed on industrial enterprises in China. Unlike value-added tax (VAT), income tax offers greater scope for tax avoidance and evasion, as firms can underreport profits to shrink the tax base. Consequently, effective income tax collection depends more heavily on the enforcement capacity of local tax authorities (Fan and Tian, 2016). Following Fan and Tian (2013), I measure government tax collection capacity using the effective tax rate (ETR) of industrial enterprises, defined as income tax payable divided by pre-tax profit.
Columns (1) and (2) of Table 11 report the regression results of government talent concentration on tax capacity. The findings indicate that higher talent concentration in government departments is associated with stronger tax enforcement. A heavier tax burden—acting as a government's grabbing hand—may crowd out firms' R&D investment. Columns (3) and (4) of Table 11 examine the relationship between government talent concentration and firms' R&D investment. The results show that the higher the concentration of talent in government departments, the lower the likelihood of firms investing in R&D. Overall, the underlying transmission mechanism is as follows: greater talent concentration enhances the government's tax enforcement capacity, which increases firms' effective tax rates and consequently suppresses their R&D investment.
In addition to tax collection, the government's grabbing hand may also manifest through rent-seeking by officials (Chen, 2022). Moreover, Murphy et al. (1993) and Li and Yin (2014) argue that the returns to rent-seeking increase with the rent-seeker's ability. Based on this, I hypothesize that a higher concentration of talent in government departments may lead to more extensive rent-seeking activities.
I define the sum of externally paid business entertainment and travel expenses as a proxy for rent, and use the ratio of rent to operating revenue to measure the scale of government rent-seeking activities. This information is available from the 2010 NTSD. Given the use of cross-sectional data, I additionally control for industry characteristics and provincial fixed effects. The regression results in Columns (5) and (6) of Table 11 indicate that higher talent concentration in government departments does not lead to larger-scale rent-seeking activities. Therefore, the reduction in firms' R&D investment is not attributable to government rent-seeking activities.
GDTC and Helping Hand of the Government. However, compared to the government's grabbing hand, enterprises are more eager to benefit from its helping hand—namely, the provision of public goods that support innovation. Does a higher concentration of talent in government departments also strengthen this helping hand? I begin by examining infrastructure investment at the city level, using the ratio of fixed asset investment to GDP as a proxy for public infrastructure provision. The results presented in Column (1) of Table 12 show that government talent concentration is significantly positively associated with fixed asset investment at the 5% level. This suggests that cities with a higher concentration of talent in government departments tend to have greater public infrastructure investment.
Column (2) examines public scientific research investment by using the share of R&D expenditure in public fiscal spending as the dependent variable. The results reveal a significant negative correlation at the 10% level, suggesting that a higher concentration of government talent at the city level does not correspond with increased support for scientific research. On the contrary, public R&D investment appears insufficient in such settings. Columns (3) to (5) examine the provision of public goods using indicators such as sewage treatment rate, hospital beds per capita, and the number of primary and secondary school teachers per 10,000 residents—capturing aspects of environmental protection, healthcare, and education, respectively. With the exception of the sewage treatment rate, which shows a positive but modest effect, other coefficients are negative and statistically insignificant. These findings suggest that a higher concentration of talent in government departments does not translate into greater provision of public goods. In short, the government's helping hand has not strengthened in tandem with its grabbing hand.
Overall, government departments with higher talent concentration tend to allocate more fiscal resources to infrastructure investment while reducing spending on public research. This trade-off may offset the potential benefits of infrastructure on innovation. Moreover, government departments do not demonstrate superior performance in delivering public goods such as environmental protection, healthcare, and education. These findings suggest that the expected positive effect of government talent concentration on innovation—via improved public goods provision—has not been realized, which helps explain the absence of the theoretically predicted inverted U-shaped relationship in the baseline regressions.
7. Conclusions
This study investigates the impact of government talent concentration on corporate innovation using firm-level panel data from China. The results reveal that higher talent concentration in government departments significantly inhibits corporate innovation. Specifically, a one standard deviation increase in city-level government talent concentration is associated with a 3.1% reduction in the average number of patent applications filed by industrial firms over the subsequent three years. This result remains robust when using patent application status as an alternative dependent variable and after controlling for the personal characteristics and tenure of mayors. The negative effect of government talent concentration on corporate innovation is observed for both invention and utility model patents, with a more pronounced impact on utility model patents. Heterogeneity analysis by firm type and size reveals that this negative impact is primarily driven by non-state-owned enterprises and small to medium-sized enterprises.
To further explore the mechanism behind this negative impact, I find that, on one hand, the talent concentration in government departments crowds out the talent needed for corporate R&D, leading to lower quality of R&D personnel and reduced R&D efficiency. On the other hand, a government with more concentrated talent has stronger tax collection capabilities, which increases the real tax burden on companies, thereby squeezing out corporate R&D investments. The insufficient investment in both qualified R&D personnel and R&D expenditure hinders corporate innovation. Meanwhile, a higher concentration of talent in government departments does not translate into stronger support for corporate innovation. While it is associated with increased fixed asset investment, it coincides with a reduction in public research funding. Additionally, there is no significant improvement in public services such as environmental protection, healthcare, or education. These findings suggest that the government has not effectively exercised its supportive role in fostering innovation.
As China seeks to overcome the middle-income trap and pursue sustainable economic growth, fostering innovation has become increasingly critical. Beyond strengthening industrial policy support for firms, this study underscores following policy implications. First, it is vital to balance talent allocation between the public and private sectors to ensure sufficient investment in corporate R&D personnel. Second, the substantial human capital within the public sector should be fully utilized and converted into higher-quality public services. Moreover, while enhancing the government's legitimate tax enforcement capacity, innovation-targeted tax incentives should be implemented to reduce the financial burden on enterprises and stimulate R&D investment. In developing countries, particularly in transitional economies, the concentration of national talent within government departments is a common phenomenon. China's experience also offers valuable insights for these countries.
Figure A1.
Government departments talent concentration(GDTC)across cities in 2005, 2010, and 2015.
References
- Acemoglu, D., García-Jimeno, C., & Robinson, J. A. (2015). State capacity and economic development: A network approach. American economic review, 105(8), 2364-2409. [CrossRef]
- Agrawal, A., Galasso, A., & Oettl, A. (2017). Roads and innovation. Review of Economics and Statistics, 99(3), 417-434.
- Albrecht, J., Robayo-Abril, M. & Vroman, S. (2019). Public-sector employment in an equilibrium search and matching model. The Economic Journal, 129(617): 35-61.
- Ashraf, N., Bandiera, O., Davenport, E. & Lee, S.S. (2020). Losing prosociality in the quest for talent? Sorting, selection, and productivity in the delivery of public services. American Economic Review, 110(5), pp.1355-1394.
- Baumol, W. J. (1990). Entrepreneurship: Productive, unproductive, and destructive. Journal of Political Economy, 98(5), 893-921.
- Besley, T., Montalvo, J.G. & Reynal-Querol, M. (2011). Do educated leaders matter? The Economic Journal, 121(554), pp.F205-227.
- Brandt, L., Van Biesebroeck, J. & Zhang, Y. (2012). Creative accounting or creative destruction? Firm-level productivity growth in Chinese manufacturing. Journal of Development Economics, 97(2), pp.339-351.
- Cavalcanti, T. & Santos, M. (2021). (Mis) allocation effects of an overpaid public sector. Journal of the European Economic Association, 19(2), pp.953-999.
- Chen, B., Wang, H., & Wang, X. (2024). Innovation Like China: Evidence from Chinese Local Officials' Promotions. China Economic Review, 86, 102203.
- Chen, Z., Liu, Z., Suárez Serrato, J. C., & Xu, D. Y. (2021). Notching R&D investment with corporate income tax cuts in China. American Economic Review, 111(7), 2065-2100. [CrossRef]
- Chen Y. (2022). Misallocation of Talent and Innovation: evidence from China. Applied Economics, 54(14): 1598-1624.
- Dahis, R., Schiavon, L., & Scot, T. (2023). Selecting top bureaucrats: Admission exams and performance in Brazil. Review of Economics and Statistics, 1–47.
- Fan, Z.Y. & Tian, B.B. (2013). Tax Competition, Tax Enforcement and Tax Avoidance. Economic Research Journal, 48(09), pp.99-111.
- Fan, Z.Y. & Tian, B.B. (2016). Collusion for Evasion: Evidence from the Rotation of NTBs' Directors in China. China Economic Quarterly, 15(04), pp.1303-1328.
- Fang, H., Dang, D., Fu, N., & Hu, W. Q. (2023). Enterprise income tax and corporate innovation: Evidence from China. Applied Economics, 55(44), 5230-5249.
- Gennaioli, N., La Porta, R., Lopez-de-Silanes, F., & Shleifer, A. (2013). Human capital and regional development. The Quarterly journal of economics, 128(1), 105-164.
- Geromichalos, A. & Kospentaris, I. (2022). The unintended consequences of meritocratic government hiring. European Economic Review, 144, p.104093. [CrossRef]
- Gomes P. (2018). Heterogeneity and the public sector wage policy. International Economic Review, 2018, 59(3): 1469-1489.
- He, G. & Wang, S. (2017). Do college graduates serving as village officials help rural China? American Economic Journal: Applied Economics, 9(4), pp.186-215.
- Hsieh, C. T., Hurst, E., Jones, C. I., & Klenow, P. J. (2019). The allocation of talent and us economic growth. Econometrica, 87(5), 1439-1474. [CrossRef]
- Hu, A.G., Zhang, P. and Zhao, L., 2017. China as number one? Evidence from China's most recent patenting surge. Journal of Development Economics, 124, pp.107-119.
- Jiang, J. (2018). Making bureaucracy work: Patronage networks, performance incentives, and economic development in China. American Journal of Political Science, 62(4), pp.982-999.
- Li, S.G. and Yin, H. (2017). Government-Enterprise Talent Allocation and Economic Growth: An Empirical Study Based on China's City Data. Economic Research Journal, 52(04):78-91.
- Li, S.G. and Yin, H. (2014). The Social Cost of Talent Misallocation Caused by Rent-Seeking. Economic Research Journal, 49(07), pp.56-66.
- McGuirk, H., Lenihan, H., & Hart, M. (2015). Measuring the impact of innovative human capital on small firms' propensity to innovate. Research policy, 44(4), 965-976.
- Moreira, D., & Pérez, S. (2024). Civil service exams and organizational performance: Evidence from the Pendleton Act. American Economic Journal: Applied Economics, 16(3), 250–291. [CrossRef]
- Moretti, E. (2021). The effect of high-tech clusters on the productivity of top inventors. American Economic Review, 111(10), 3328-3375.
- Murphy, K.M., Shleifer, A. and Vishny, R.W. (1991). The allocation of talent: Implications for growth. The Quarterly Journal of Economics, 106(2), pp.503-530.
- Murphy K M, Shleifer A, Vishny R W. (1993). Why is rent-seeking so costly to growth? The American Economic Review, 83(2): 409-414.
- Pan, S.Y., Zhu, D.D. and Xu, K. (2021). Talent Allocation, Scientific Research, and China's Economic Growth. China Economic Quarterly, 21(02), pp.427-444.
- Romer, P. M. (1990). Endogenous technological change. Journal of political Economy, 98(5, Part 2), S71-S102.
- Shao, Y.H., Zhang, C.Y., Liu, Y.N., and Liu, X.H. (2018). Social Stratification Structure and Innovation-Driven Economic Growth. Economic Research Journal, 53(05), pp.42-55.
- Squicciarini, M. P., & Voigtländer, N. (2015). Human capital and industrialization: Evidence from the age of enlightenment. The Quarterly Journal of Economics, 130(4), 1825-1883.
- Sun, X., Li, H., & Ghosal, V. (2020). Firm-level human capital and innovation: Evidence from China. China Economic Review, 59, 101388.
- Xu, G. (2018). The costs of patronage: Evidence from the British empire. American Economic Review, 108(11), pp.3170-3198.
- Xu, H. and Adhvaryu, A. (2024). The human capital effects of access to elite jobs. American Economic Journal: Applied Economics, 16(3), pp.516-548. [CrossRef]
- Yao, Y. and Zhang, M. (2015). Subnational leaders and economic growth: Evidence from Chinese cities. Journal of Economic Growth, 20, pp.405-436.
- Yang, M., Zheng, S., & Zhou, L. (2022). Broadband internet and enterprise innovation. China Economic Review, 74, 101802.
- Zhang, H., & Guo, R. (2025). How does the spatial agglomeration of human capital affect strategic innovation in China? Journal of Asian Economics, 96, 101868. [CrossRef]
| 1 | The employed population is defined as workers aged 16-64 who were in a working state during the previous week.. |
| 2 | Government employees (or civil servants) are defined as those working in the sectors of public administration, social security, and public management organizations, whose occupations include managers of enterprises and institutions, professional and technical personnel, and clerical staff. Industry and occupation classifications across different survey years are adjusted to the 2015 standards (industry classification code according to GB/T 4754-2011, occupation classification code according to GB/T 6565-2015). |
| 3 | Agricultural employees are defined as those engaged in industries such as agriculture, forestry, animal husbandry, and fisheries, with occupations related to production in agriculture, forestry, animal husbandry, fisheries, and water conservancy, and whose household registration is classified as agricultural; non-agricultural workers are those engaged in occupations other than agricultural employment. |
| 4 | There are two considerations for matching the industrial enterprise samples from two databases: firstly, a single database cannot fully cover the time span from 2005 to 2015, and the two databases complement each other in terms of time coverage; secondly, the 2010 industrial enterprise data lacks sufficient variable information for the empirical analysis required by this study, and the quality of post-2009 CIED data is significantly problematic, while the NTSD data provides more information, including financial status, R&D expenditures, and tax payments. |
| 5 | I cleaned the data following these steps: (1) deleting samples with missing values or outliers for variables such as total assets, number of employees, and total profit; (2) deleting samples with fewer than 8 employees; (3) deleting samples located in different cities between 2005 and 2015; and (4) deleting samples with missing values for core explanatory variables and control variables. |
| 6 | Since this study examines corporate innovation until 2019, to avoid the issue of sample enterprises exiting after 2015 causing data incomparability across different years, I matched the industrial registration information of sample enterprises through Qichacha to check the operating status, and keep the sample of firms that were continuously operating from 2005 to 2019. |
| 7 | The data primarily comes from the CEIC Database, with a few missing values supplemented from the China City Statistical Yearbook. |
| 8 | Calculated based on data from the subsample of the 1% Population Sampling Survey of 2005, the 2010 Population Census, and the 1% Population Sampling Survey of 2015. |
| 9 | The data is sourced from the official website of the Ministry of Science and Technology of China. |
| 10 | The data on the personal characteristics of mayors comes from is sourced from the CPED database, which conducted by Jiang J. "Making Bureaucracy Work: Patronage Networks, Performance Incentives, and Economic Development in China," published in American Journal of Political Science, 2018, 62(4): 982-999. |
| 11 | I classify firms by total assets, with firms having total assets of 400 million yuan or more considered large enterprises, and those with total assets less than 400 million yuan classified as small and medium-sized enterprises (SMEs). |
| 12 | The public sector, as defined by industry, includes government departments, education, and healthcare industries. |
Figure 1.
Patent Application of Sample Industrial Enterprises from 2005 to 2019.
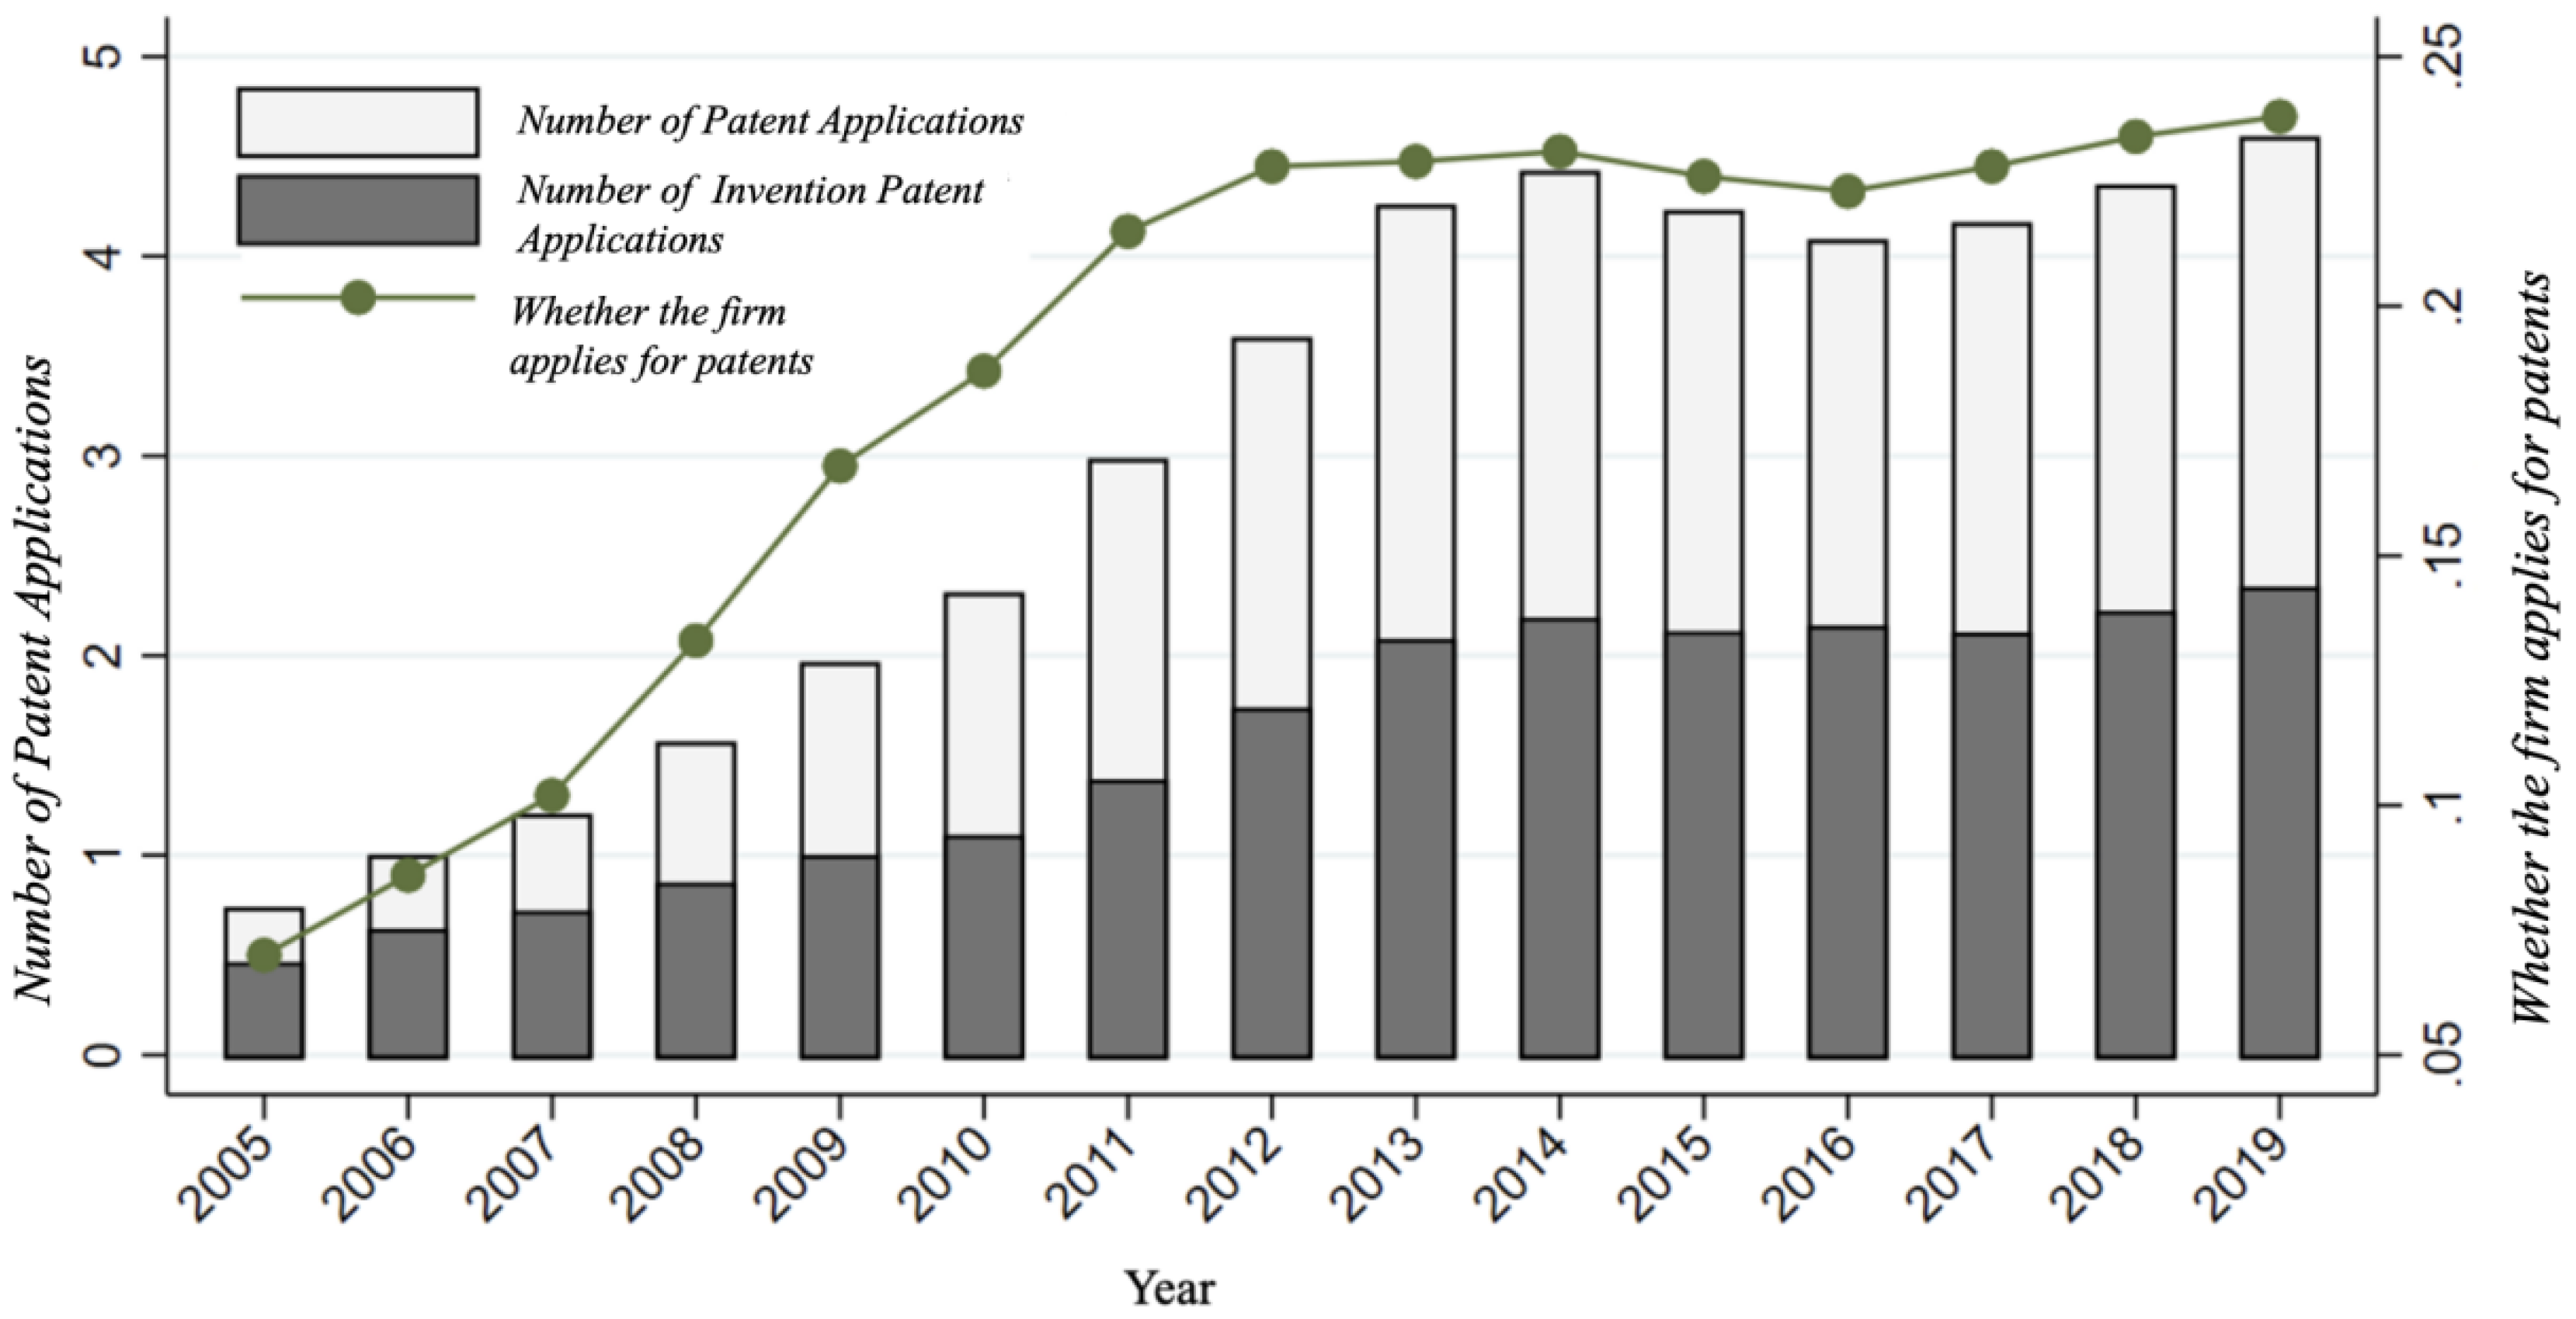
Table 1.
Descriptive Statistics of City and Firm Characteristics Variables.
| Variables | Definition | Obs | Mean | SD | Min | Max |
| Panel A. City-level variables | ||||||
| GDTC | Government departments talent concentration | 819 | 5.072 | 2.211 | 1.009 | 17.267 |
| per_gdp | GDP per capita (Yuan) | 819 | 10.073 | 0.811 | 7.612 | 12.239 |
| pop | Permanent population (in ten thousands) | 819 | 5.879 | 0.676 | 3.303 | 8.029 |
| ind2_gdp | Output value of the secondary industry /GDP | 819 | 0.458 | 0.105 | 0.151 | 0.859 |
| ind3_gdp | Output value of the tertiary industry /GDP | 819 | 0.382 | 0.090 | 0.111 | 0.854 |
| inno_city | Innovative pilot city(dummy) | 819 | 0.096 | 0.295 | 0 | 1 |
| pub_pop | Official-to-civilian ratio | 819 | 0.014 | 0.006 | 0.004 | 0.052 |
| uni_ratio | proportion of employees with a bachelor's degree or higher among non-agricultural employment | 819 | 0.041 | 0.036 | 0.001 | 0.311 |
| nonfar_em | Proportion of non-agricultural employment | 819 | 0.578 | 0.204 | 0.111 | 0.999 |
| Panel B. Firm-level variables | ||||||
| asset | Total assets(million) | 76,380 | 565.304 | 6022.920 | 0.116 | 1150000 |
| com_em | Number of employees | 76,380 | 579.130 | 2888.475 | 8 | 513195 |
| age | Firm age | 76,380 | 12.199 | 7.123 | 0 | 68 |
| oa | Total profit / Total assets | 76,380 | 0.052 | 0.120 | -0.984 | 1.000 |
| debt_ratio | Total debt / Total assets | 76,380 | 0.606 | 5.198 | 0.000 | 1433.441 |
| soe | State-Owned Enterprise(dummy) | 76,380 | 0.055 | 0.228 | 0 | 1 |
| exporter | Exporting enterprise(dummy) | 76,380 | 0.555 | 0.497 | 0 | 1 |
Table 2.
Descriptive Statistics of Patent Applications for Industrial Enterprises.
| Variables | Obs | Mean | SD | Min | Max |
| Panel A. Number of Patent Applications | |||||
| Number of patent applications in the next year (t+1) | 76,380 | 3.154 | 94.107 | 0 | 21,019 |
| Number of patent applications in the next two years (t+2) | 76,380 | 6.698 | 186.374 | 0 | 39,983 |
| Number of patent applications in the next three years (t+3) | 76,380 | 10.679 | 285.429 | 0 | 54,891 |
| Number of patent applications in the next four years (t+4) | 76,380 | 14.922 | 395.320 | 0 | 68,477 |
| Panel B. Whether the Firm Applies for Patents | |||||
| Whether the firm applies for patents in the next year (t+1) | 76,380 | 0.181 | 0.385 | 0 | 1 |
| Whether the firm applies for patents in the next year (t+2) | 76,380 | 0.248 | 0.432 | 0 | 1 |
| Whether the firm applies for patents in the next year (t+3) | 76,380 | 0.296 | 0.457 | 0 | 1 |
| Whether the firm applies for patents in the next year (t+4) | 76,380 | 0.337 | 0.473 | 0 | 1 |
Table 3.
GDTC and Industrial Enterprises' Patent Applications within the Following 3 Years.
| Panel A. Number of Patent Applications within the Following 3 Years | ||||
| (1) | (2) | (3) | (4) | |
| GDTC | -0.016*** | -0.153*** | -0.014*** | -0.016*** |
| (0.004) | (0.004) | (0.004) | (0.006) | |
| GDTC_2 | 0.002 | |||
| (0.001) | ||||
| R-Square | 0.707 | 0.716 | 0.719 | 0.719 |
| Panel B. Whether the Firm applies for Patents within the Following 3 Years | ||||
| (5) | (6) | (7) | (8) | |
| GDTC | -0.007*** | -0.007*** | -0.007*** | -0.002 |
| (0.002) | (0.002) | (0.001) | (0.004) | |
| GDTC_2 | -0.0003 | |||
| (0.0002) | ||||
| City-level control variables | YES | YES | YES | YES |
| Firm-level control variables | NO | YES | YES | YES |
| Industry trends | NO | NO | YES | YES |
| Firm FE | YES | YES | YES | YES |
| Year FE | YES | YES | YES | YES |
| R-Square | 0.648 | 0.653 | 0.655 | 0.655 |
| N | 76380 | 76380 | 76380 | 76380 |
| Notes: Control variables include city-level control variables and firm-level control variables; Standard errors clustered are clustered at the city-industry level; *, *, *** denote significance at the 10%, 5%, and 1% levels, respectively. | ||||
Table 4.
GDTC and Industrial Enterprises' Patent Applications Within the Following n Years and in the nth Year.
Table 4.
GDTC and Industrial Enterprises' Patent Applications Within the Following n Years and in the nth Year.
| Patent Applications Within the Following n Years | Patent Applications in the nth Year | ||||||||
| T+1 | T+2 | T+3 | T+4 | T+1 | T+2 | T+3 | T+4 | ||
| (1) | (2) | (3) | (4) | (5) | (6) | (7) | (8) | ||
| Panel A. Number of Patent Applications | |||||||||
| GDTC | -0.014*** | -0.024*** | -0.035*** | -0.035*** | -0.014*** | -0.013*** | -0.019*** | -0.007** | |
| (0.003) | (0.004) | (0.005) | (0.006) | (0.003) | (0.004) | (0.004) | (0.004) | ||
| R-Square | 0.653 | 0.691 | 0.719 | 0.743 | 0.653 | 0.648 | 0.657 | 0.668 | |
| Panel B. Whether the Firm Applies for Patents | |||||||||
| GDTC | -0.009*** | -0.012*** | -0.014*** | -0.012*** | -0.009*** | -0.007*** | -0.009*** | -0.003* | |
| (0.002) | (0.002) | (0.002) | (0.002) | (0.002) | (0.002) | (0.002) | (0.002) | ||
| R-Square | 0.601 | 0.633 | 0.655 | 0.671 | 0.601 | 0.597 | 0.605 | 0.616 | |
| Controls | YES | YES | YES | YES | YES | YES | YES | YES | |
| Firm FE | YES | YES | YES | YES | YES | YES | YES | YES | |
| Year FE | YES | YES | YES | YES | YES | YES | YES | YES | |
| Industry trends | YES | YES | YES | YES | YES | YES | YES | YES | |
| N | 76380 | 76380 | 76380 | 76380 | 76380 | 76380 | 76380 | 76380 | |
| Notes: Control variables include city-level control variables and firm-level control variables; Standard errors clustered are clustered at the city-industry level; *, *, *** denote significance at the 10%, 5%, and 1% levels, respectively. | |||||||||
Table 6.
Robustness check — Control for the Personal Characteristics of the Mayor.
| FE Estimation | IV Estimation | ||||
| (1) | (2) | (3) | (4) | ||
| Number of Patent Applications within the Following 3 Years | Whether the Firm Applies for Patents within the Following 3 Years | Number of Patent Applications within the Following 3 Years | Whether the Firm Applies for Patents within the Following 3 Years | ||
| GDTC | -0.016*** | -0.007*** | -0.044*** | -0.020*** | |
| (0.004) | (0.002) | (0.015) | (0.005) | ||
| mayor*associate degree | -0.001 | -0.003 | -0.031 | -0.017 | |
| (0.030) | (0.013) | (0.035) | (0.014) | ||
| mayor*bachelor's degree | 0.023 | -0.006 | 0.017 | -0.008 | |
| (0.018) | (0.008) | (0.020) | (0.008) | ||
| mayor*master's degree | 0.044** | 0.004 | 0.057*** | 0.010 | |
| (0.017) | (0.007) | (0.019) | (0.008) | ||
| mayor*doctoral degree | 0.020 | -0.001 | 0.031 | 0.005 | |
| (0.020) | (0.008) | (0.021) | (0.008) | ||
| mayor's age | 0.001 | -0.0002 | 0.002 | -0.0001 | |
| (0.002) | (0.001) | (0.002) | (0.0006) | ||
| mayor's gender(male=1) | 0.024 | 0.016* | 0.006 | 0.007 | |
| (0.023) | (0.009) | (0.025) | (0.010) | ||
| mayor's tenure | 0.003 | 0.002 | 0.005 | 0.002 | |
| (0.003) | (0.001) | (0.003) | (0.001) | ||
| Control variables | YES | YES | YES | YES | |
| Firm FE | YES | YES | YES | YES | |
| Year FE | YES | YES | YES | YES | |
| Industry trends | YES | YES | YES | YES | |
| KP F-statistic | - | - | 156.777 | 156.777 | |
| R-Square | 0.722 | 0.659 | - | - | |
| N | 74322 | 74322 | 74274 | 74274 | |
Notes: Control variables include city-level control variables and firm-level control variables; Standard errors clustered are clustered at the city-industry level; *, *, *** denote significance at the 10%, 5%, and 1% levels, respectively.
Table 7.
Robustness Check.
| FE Estimation | IV Estimation | ||||
| (1) | (2) | (3) | (4) | ||
| Number of Patent Applications within the Following 3 Years | Whether the firm applies for patents within the Following 3 Years | Number of Patent Applications within the Following 3 Years | Whether the firm applies for patents within the Following 3 Years | ||
| Panel A. Participating in patent applications | |||||
| GDTC | -0.039*** | -0.007*** | -0.039*** | -0.032*** | |
| (0.014) | (0.001) | (0.018) | (0.007) | ||
| KP F-statistic | - | - | 156.777 | 156.777 | |
| N | 76380 | 76380 | 76338 | 76338 | |
| Panel B. Talents with associate degree or higher | |||||
| GDTC | -0.025*** | -0.011*** | -0.048*** | -0.022*** | |
| (0.005) | (0.002) | (0.016) | (0.006) | ||
| KP F-statistic | - | - | 63.974 | 63.974 | |
| N | 76380 | 76380 | 76338 | 76338 | |
| Panel C. Recalculating GDTC by average years of education | |||||
| GDTC | -0.447*** | -0.198*** | -1.109*** | -0.569*** | |
| (0.110) | (0.042) | (0.452) | (0.170) | ||
| KP F-statistic | - | - | 83.998 | 83.998 | |
| N | 76380 | 76380 | 76338 | 76338 | |
| Panel D. Excluding the sample of enterprises located in municipalities | |||||
| GDTC | -0.014*** | -0.009*** | -0.041** | -0.018*** | |
| (0.004) | (0.002) | (0.018) | (0.007) | ||
| KP F-statistic | - | - | 77.015 | 77.015 | |
| N | 62973 | 62973 | 62931 | 62931 | |
| Control variables | YES | YES | YES | YES | |
| Firm FE | YES | YES | YES | YES | |
| Year FE | YES | YES | YES | YES | |
| Industry trends | YES | YES | YES | YES | |
Notes: Control variables include city-level control variables and firm-level control variables; Standard errors clustered are clustered at the city-industry level; *, *, *** denote significance at the 10%, 5%, and 1% levels, respectively.
Table 8.
Heterogeneity of Patent Types.
| FE Estimation | IV Estimation | |||||
| (1) | (2) | (3) | (4) | |||
| Invention Patent | Utility Model Patent | Invention Patent | Utility Model Patent | |||
| Panel A. Number of Patent Applications Within the Next 3 Years | ||||||
| GDTC | -0.003 | -0.145*** | -0.014 | -0.033*** | ||
| (0.003) | (0.003) | (0.010) | (0.012) | |||
| Panel B. Whether patents are applied for Within the Next 3 Years | ||||||
| GDTC | -0.004*** | -0.006*** | -0.022*** | -0.017*** | ||
| (0.001) | (0.001) | (0.007) | (0.005) | |||
| Control variables | YES | YES | YES | YES | ||
| Firm FE | YES | YES | YES | YES | ||
| Year FE | YES | YES | YES | YES | ||
| Industry trends | YES | YES | YES | YES | ||
| KP F-statistic | 109.262 | 109.262 | ||||
| N | 76380 | 76380 | 76338 | 76338 | ||
Notes: Control variables include city-level control variables and firm-level control variables; Standard errors clustered are clustered at the city-industry level; *, *, *** denote significance at the 10%, 5%, and 1% levels, respectively.
Table 9.
Heterogeneity in Enterprise Ownership and Enterprise Size.
| Number of Patent Applications within the Following 3 Years | Whether the Firm Applies for patents within the Following 3 Years | ||||
| Panel A. Enterprise ownership | |||||
| (1) | (2) | (3) | (4) | ||
| Invention Patent | Utility Model Patent | Invention Patent | Utility Model Patent | ||
| GDTC | -0.002 | -0.016*** | -0.002 | -0.016*** | |
| (0.003) | (0.003) | (0.003) | (0.003) | ||
| GDTC*SOE | 0.004 | 0.019* | 0.004 | 0.019* | |
| (0.008) | (0.010) | (0.008) | (0.010) | ||
| Panel B. Enterprise Size | |||||
| (5) | (6) | (7) | (8) | ||
| Invention Patent | Utility Model Patent | Invention Patent | Utility Model Patent | ||
| GDTC | -0.002 | -0.016*** | -0.004*** | -0.007*** | |
| (0.003) | (0.003) | (0.001) | (0.003) | ||
| GDTC*large | -0.002 | 0.019*** | 0.005** | 0.011*** | |
| (0.005) | (0.007) | (0.003) | (0.003) | ||
| Control variables | YES | YES | YES | YES | |
| Firm FE | YES | YES | YES | YES | |
| Year FE | YES | YES | YES | YES | |
| Industry trends | YES | YES | YES | YES | |
| N | 76380 | 76380 | 76380 | 76380 | |
Notes: Control variables include city-level control variables and firm-level control variables; Standard errors clustered are clustered at the city-industry level; *, *, *** denote significance at the 10%, 5%, and 1% levels, respectively.
Table 10.
GDTC and Firms' R&D Talent Investment and R&D Efficiency.
| Scale of R&D personnel | Quality of R&D personnel | R&D Efficiency | |
| (1) | (2) | (3) | |
| GDTC | -0.002 | -0.004*** | -0.008 |
| (0.002) | (0.001) | (0.005) | |
| GDTC *R&D | -0.004 | ||
| (0.006) | |||
| R&D | 0.189*** | ||
| (0.039) | |||
| City-level control variables | - | - | YES |
| Firm-level control variables | YES | YES | YES |
| City FE | YES | YES | - |
| Firm FE | - | - | YES |
| Year FE | YES | YES | YES |
| Industry trends | YES | YES | YES |
| KP F-statistic | - | - | |
| N | 819 | 819 | 43760 |
Notes: Columns (1) and (2) use city-level panel data for 2005, 2010, and 2015 and standard errors are clustered at the city level; Columns (3) and (4) use firm-level panel data for 2005 and 2010 and standard errors are clustered at the city-industry level. *, *, *** denote significance at the 10%, 5%, and 1% levels, respectively.
Table 11.
GDTC, Grabbing Hand of the Government and Firm's R&D expenditure.
| Tax collection capacity | R&D expenditure | Rent-seeking | ||||
| (1) | (2) | (3) | (4) | (5) | (6) | |
| FE | IV | FE | IV | FE | IV | |
| GDTC | 0.004*** | 0.015*** | -0.004** | -0.018** | -0.009 | 0.020 |
| (0.001) | (0.003) | (0.001) | (0.007) | (0.007) | (0.028) | |
| Control variables | YES | YES | YES | YES | YES | YES |
| Firm FE | YES | YES | YES | YES | - | - |
| Year FE | YES | YES | YES | YES | - | - |
| Industry trends | YES | YES | YES | YES | - | - |
| Province FE | - | - | - | -0.018** | YES | YES |
| Industry FE | - | - | - | (0.007) | YES | YES |
| KP F-statistic | 113.611 | 153.66 | 134.565 | |||
| N | 75001 | 74960 | 50894 | 50892 | 24920 | 24548 |
Notes: Control variables include city-level control variables and firm-level control variables; Columns (1) and (2) use firm-level panel data from 2005 and 2010. Columns (3) and (4) use firm-level panel data from 2005, 2010, and 2015. Columns (5) and (6) use firm-level cross-sectional data from 2010 and additionally control for Province FE and Industry FE; Standard errors clustered at the city-industry level; *, *, *** denote significance at the 10%, 5%, and 1% levels, respectively.
Table 12.
GDTC and Public Services.
| Fixed Asset Investment | Public R&D expenditure | Environmental protection | Healthcare | Education | |
| (1) | (2) | (3) | (4) | (5) | |
| GDTC | 0.011** | -0.0001* | 0.390 | -0.232 | -0.317 |
| (0.05) | (0.00003) | (0.968) | (0.246) | (0.422) | |
| City-level control variables | YES | YES | YES | YES | YES |
| City FE | YES | YES | YES | YES | YES |
| Year FE | YES | YES | YES | YES | YES |
| N | 828 | 828 | 671 | 746 | 749 |
Notes: Standard errors clustered are clustered at the city level; *, *, *** denote significance at the 10%, 5%, and 1% levels, respectively.
Disclaimer/Publisher’s Note: The statements, opinions and data contained in all publications are solely those of the individual author(s) and contributor(s) and not of MDPI and/or the editor(s). MDPI and/or the editor(s) disclaim responsibility for any injury to people or property resulting from any ideas, methods, instructions or products referred to in the content. |
© 2025 by the authors. Licensee MDPI, Basel, Switzerland. This article is an open access article distributed under the terms and conditions of the Creative Commons Attribution (CC BY) license (http://creativecommons.org/licenses/by/4.0/).
Copyright: This open access article is published under a Creative Commons CC BY 4.0 license, which permit the free download, distribution, and reuse, provided that the author and preprint are cited in any reuse.


