
Submitted:
15 July 2025
Posted:
16 July 2025
You are already at the latest version
Abstract
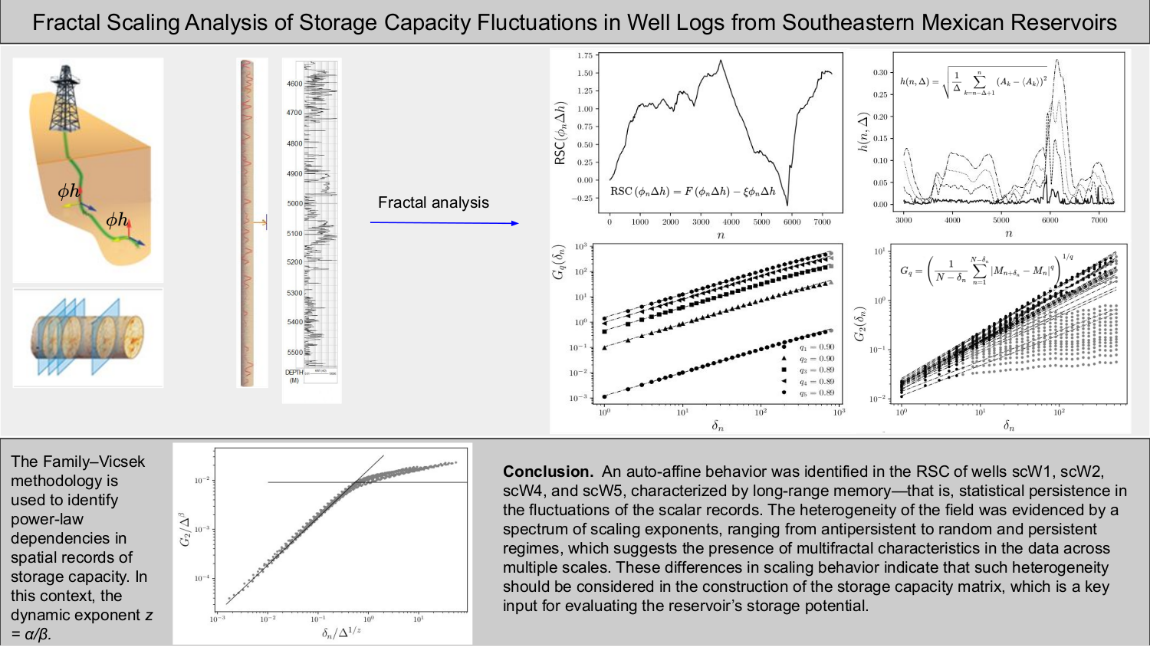
This study focuses on a hydrocarbon reservoir located in southeastern Mexico. The analysis uses well log data derived from petrophysical evaluations of storage capacity. The structural complexity of the reservoir and observed heterogeneity in Cretaceous units motivate a fractal-based characterization of spatial fluctuations. The objective is to assess the fractal scaling of storage capacity fluctuations using the Family–Vicsek dynamic framework. Critical exponents α (roughness), β (growth), and z (dynamic) are obtained through structure function metrics. Data collapse techniques and local Hurst exponent distributions are used to explore long-range memory and spatial heterogeneity across wells. This study aims to classify storage capacity fluctuation records based on Euclidean or fractal geometries. This analysis allows a novel characterization of storage trends in the reservoir. The analysis reveals persistent scaling behavior, indicating long-range correlations in the storage capacity fluctuations. Multiscale patterns and variations in local Hurst exponents highlight the presence of multifractality and regional heterogeneity. Specifically, the spatial distribution of local Hurst exponents obtained in this study enables the inference of statistical properties in synthetic wells, providing key input for the structural and functional characterization of the reservoir’s geological model. This approach aims to identify preferential subsurface flow pathways for hydrocarbons, gas.
Keywords:
Hurst exponent
; fluctuation function
; torage capacity
; heterogeneity
1. Introduction
The heterogeneity of petroleum reservoirs poses a significant challenge for their accurate characterization.
Variations in the petrophysical properties of reservoir rocks affect both storage capacity and fluid flow behavior, directly influencing hydrocarbon production performance within the reservoir [1,2,3,4]. In this context, the storage capacity in porous media associated with rock formations (oil or gas reservoirs) constitutes a key parameter to be determined. In the petroleum industry, the estimation and characterization of storage capacity, represented as , is fundamental for the development of reservoir characterization models, with the aim of optimizing and maximizing hydrocarbon production [5,6,7].
The characterization of heterogeneities through petrophysical properties such as porosity or storage capacity (where h denotes the thickness of the porous medium) has been widely investigated. These studies have been developed within both the Euclidean and fractal geometry frameworks, in response to the complex topology of porous networks.
Classical Euclidean models assume that the geometric forms of the porous medium are smooth, continuous, and differentiable functions. Examples of such approaches, which consider various pore configurations, can be found in [8,9,10,11,12]. In contrast, fractal models address this complexity by considering non-smooth curves—often continuous but non-differentiable in the Euclidean sense. This perspective has led to various research paths, among which the use of fractional calculus tools—such as fractional integro-differential equations—and fractal statistical analysis stands out, especially for identifying power-law behaviors with fractional exponents [13,15,16,17,19,20,21].
Nevertheless, within Euclidean-based characterization approaches, several relevant investigations have been conducted, such as the analysis of transient pressure tests. For example, in the model proposed by Flamenco et al. [22], storage ratios at different scales (0.0001, 0.01, 0.1, and 0.5) are used to generate pressure curves. These curves reflect transient pressure and production responses, which are influenced by the flow dynamics of the fluid within media of either Euclidean or fractal topology, as discussed in [16,27,28,29], when considering various pore structures and distributions.
On the other hand, in the laboratory-based experimental study conducted by Balankin et al. [29], two reservoirs were compared: one with a Euclidean porous structure and the other with fractal characteristics. The results indicate a greater loss of mechanical energy in the fluid flowing through the Euclidean reservoir compared to the fractal one, suggesting greater flow efficiency in fractal porous media.
In the context of real reservoir systems, local petrophysical measurements and interpretations from core and well data are commonly used to infer the predominant type of medium in the formation. By applying either Euclidean or fractal theoretical models, the goal is to describe the general properties of the formation [30,31,32,33]. Several studies based on scalar well logs have demonstrated that some formations exhibit fractal structures at multiple levels, such as core textures, pore distributions, fractures, stratigraphy, seismic faults, and flow capacities. These behaviors follow scaling laws and are governed by fractal dimensions [38,39,40,41,43].
Within this framework, the present study investigates whether scalar records obtained from the petrophysical interpretation and measurement of storage capacity—acquired from wells located in southeastern Mexico—exhibit fractal characteristics. Such characterization would allow the identification of zones with higher flow capacity, based on the fractal properties of the logs, in line with previous studies [29,43].
This work proposes a Euclidean and fractal classification derived from a statistical analysis of storage capacity records. A fractal statistical analysis of storage capacity records, focusing on identifying scaling trends in the fluctuations as a function of the observation window width , using the theoretical framework of the Family–Vicsek dynamic scaling approach. Furthermore, this study investigates whether a complete information sequence can be characterized by a family of Hurst exponents associated with different sampling intervals, there by revealing heterogeneity in terms of short- and long-range correlations.
The structure of this paper is as follows: Section 2.1 outlines the study area, specifically the location of the wells from which the storage capacity logs were obtained. Section 2.2 presents the method based on the Family–Vicsek dynamic scaling theory, applying its mathematical formulation to the scalar records in order to analyze their fluctuations. Section 3 discusses and interprets the obtained results. Section 4 presents limitations and scope. Finally, Section 5 presents the main conclusions of the study.
2. Materials and Methods
2.1. Study Area
A hydrocarbon reservoir located in southeastern Mexico serves as the primary source of data used in this study for analyzing storage capacity records. This information, previously interpreted, calibrated, and evaluated, was employed to determine local storage capacities associated with several wells.
Specifically, five data series relating a petrophysical property to depth were analyzed. The storage capacity logs correspond to five wells located in the northern portion of southeastern Mexico. For confidentiality reasons, the following notation is used to refer to each well: scW1, scW2, scW3, scW4, and scW5, respectively.
The heterogeneity of the study area is illustrated through the description and observation of general features from both the region and core samples. The analysis focuses on four Cretaceous units: Breccia, Upper, Middle, and Lower Cretaceous.
Regarding the Breccia unit, data from core samples reveal marked heterogeneity associated with sedimentary variations, which suggests possible diagenetic changes both vertically and laterally. The observed facies correspond to dolomitized floatstone and rudstone, with varying degrees of fracturing and dissolution, resulting in porosity of variable size.
The degree of fracturing in the Breccia unit ranges from scarce to abundant and is commonly associated with good residual porosity and hydrocarbon saturation. Some core samples display significant vertical variability, with column sections where flow capacity is not uniformly distributed—i.e., interbedded intervals with lower porosity and permeability are identified. Matrix porosity associated with the generation of secondary intercrystalline porosity due to dolomitization is limited, implying a minor contribution to the effective flow of the rock. The porous medium presents dissolution cavities and moldic porosity connected through multidirectional fractures, which also exhibit good residual porosity and hydrocarbon impregnation.
In the KS and KM units, cryptocrystalline to mesocrystalline dolomite is observed, often clay-rich and/or enriched in organic matter, with the presence of stylolites. These units exhibit poor intercrystalline porosity and little evidence of significant dissolution; however, in some fractured zones, appreciable residual porosity is preserved. Additionally, abundant dissolution is reported, generating vugs between 1 and 2 cm in diameter, some of which are impregnated with hydrocarbons (see Figure 1(a)).
Other cores display microcrystalline dolomite with a dark gray base, attributable to clay and/or organic matter content, becoming cleaner toward the top. This dolomite exhibits low intercrystalline porosity, although centimeter-scale vugs are distributed throughout the core and are typically saturated with residual oil. At the top, a dolomitized breccia is present with small clasts, dissolution cavities, and partially open fractures impregnated with hydrocarbons.
In the Lower Cretaceous unit (KI), micro to mesocrystalline dolomite is identified, ranging in color from dark gray to black and possibly rich in organic matter. In some cases, this unit includes interbedded intraformational dolomitized conglomerates with light-colored clasts embedded in a dark matrix. Intercrystalline porosity is generally poor, although some sections exhibit abundant fracturing—partially cemented—along with residual porosity and oil saturation (see Figure 1(b)).
2.2. Methodology
The Family–Vicsek methodology is used to model phenomena associated with interface growth and has been widely applied to the analysis of time series in economic, biological, physical, and geological systems, among others [23,24,25,26]. The main goal of this methodology is to identify power-law dependencies in the temporal and spatial fluctuations observed in time series.
The metric used to capture this dependency is known as the q-th order structure function, . This function allows for the analysis of the scaling behavior of the q-th statistical moment (in particular, the roughness or standard deviation for ) as a function of the interface height with respect to the system size L.
In the specific case of spatial records of storage capacity, two scaling exponents are estimated to reveal the self-similar properties in the vertical and horizontal directions. These exponents are analogous to the parameters and in the Family–Vicsek theory, known respectively as the roughness exponent (or Hurst exponent) and the growth exponent. Additionally, a third exponent, the dynamic exponent , is defined to assess the correlation between both directions.
The application of the structure function to records associated with storage capacity fluctuations can reveal a generic scaling behavior invariant with respect to spatial variables, provided there is correlation between them. In such cases, the behavior is expected to follow Equation (1) [34,35,36]:
The function is referred to as the generalized q-th order moment function. More specifically, it is defined by Equation (2):
Here, N denotes the length of the series, and represents the observation window width, that is, the distance between pairs of values and within the fluctuation function constructed for this analysis (see Figure 2).
Furthermore, when the interface width reaches saturation, the dynamic exponent z is used to determine the characteristic time as a function of the system size L, following the relation: .
This study considers scalar records of storage capacity expressed as , in order to analyze the scaling behavior of the fluctuation function. This function will hereafter be referred to as the relative storage capacity (RSC). The RSC (see Figure 2) is constructed by accumulating the storage capacities along the record, i.e.,
This cumulative function is then fitted using a first-degree polynomial , and the RSC is defined as the difference between both terms, expressed mathematically by Equation (3):
This is an example of a quote.
3. Empirical Results and Discussion
Results for Well scW1
The application of the structure function (Equation (2)) to the fluctuation function RSC (see Figure 2(b)) for well scW1 exhibits scaling behavior in the vertical direction along the y-axis, where for . This indicates that follows a power-law behavior across three orders of magnitude, revealing autocorrelation in the RSC with respect to depth (y) in the sampled records. Furthermore, this correlation is of long-range type, as for all values of q analyzed. Therefore, the RSC fluctuations are classified as self-affine [38].
The exponents obtained, as well as those listed in Table 1, are of the same order as those reported by Yu et al. [15] for groundwater level fluctuations. On the other hand Dashian et al. [17] reports scaling or Hurst exponents ranging from to for well log data in large-scale porous media. The latter employed techniques such as spectral density , multifractal random walk (MFRW), and multifractal detrended fluctuation analysis (MF-DFA), considering records from various oil and gas fields.
Likewise, Hernández-Martinez et al. [33] demonstrated that porosity logs can be modeled through self-affine distributions characterized by two scaling exponents associated with the behavior of the fluctuation function, applied to complete well log sequences. Additionally, they present a spatial distribution of scaling exponents with respect to a reference facies pattern; however, such depth-dependent facies information is not always available. Therefore, Figure 6 provides an alternative representation of the Hurst exponent distribution, highlighting the structural heterogeneity of the medium as observed in formations in northeastern Mexico (Chicontepec), using the DFA technique. This supports the hypothesis of class universality within fractal theory. In contrast Ferreira et al. [44] reported cases characterized by short-range memory processes with Hurst exponents ranging from to , further emphasizing the complexity and heterogeneity of petroleum reservoirs in terms of pore distribution topology.
Thus, it is concluded that the system’s heterogeneity should be incorporated into the characterization of the rock formation, regardless of the metric used for estimation. That is, a single exponent is not sufficient to describe the heterogeneity of porosity logs or, by analogy, storage capacity logs. A multiscale approach or an alternative description, such as that proposed below through the calculation of Hurst exponents from a physical and monofractal perspective, is required (see Figure 6).
Horizontal scaling (along the x-axis, parallel to the y-axis) is analyzed by constructing standard deviation series (see Figure 2(d)) using the following expression:
Here, represents the sampling window width, analogous to a temporal variable, and describes the fluctuations of a moving interface in the x–y plane. This treatment accounts for spatial correlations along the x-direction, following the approach proposed by Balankin et al. [23]. By applying the structure function (Equation (2)) to these newly constructed profiles, the growth exponent is obtained.
It is worth noting that the profiles used in this analysis differ from those suggested by Hewet [37], who proposed the use of fractional Gaussian noise (FGN) to model porosity logs perpendicular to stratification. However, the current results do not contradict those observations, as the differences arise from the construction method of the profiles via Equation (4).
Finally, the dynamic exponent z is determined by plotting versus , where (see Figure 3(c)). For well scW1, the result is . The x–y correlation between the and exponents is established through a data collapse analysis (Figure 3(d)) using the coordinates and window .
Unlike studies such as that of Dashian et al. [18], which explicitly conduct cross-correlation analysis between porosity log series using techniques like MF-DXA and logs such as DT, RHOB, NPHI, and GR, the present analysis does not apply such techniques, although multifractal patterns are identified that support their inclusion in future work.
Results for Well scW2
Similar to well scW1, well scW2 exhibits a fractal correlation with an exponent for (see Figure 4(a)), indicating self-affinity of the RSC with respect to depth y. Regarding scaling parallel to the y-axis, i.e., along the x-direction, a value of is obtained (Figure 4(b)), suggesting long-range memory in both directions.
Results for Well scW3
Well scW3 is characterized by the exponents , , and (see Figure 5). However, as seen in Figure 5(a), no fractal scaling behavior is observed for the RSC in the vertical (y) direction, nor in the horizontal parallel (x) direction, as indicated by Figure 5(b). Similarly, the estimation of the z exponent is inconclusive, as evidenced by the absence of data collapse in Figure 5(d).
Therefore, although typically fractal parameters can be estimated, they do not adequately describe the behavior of the well log data and may be more appropriately interpreted from a Euclidean perspective, given the topological complexity of the porous structure.
Summary of Exponents and Data Collapse
The estimated exponents , , and z for each analyzed well, along with the presence or absence of data collapse, are summarized in Table 1.
Classification of Observed Cases
Based on the application of the fractal analysis methodology to the storage capacity log series from wells scW1 to scW5, three types of behavior were identified:
- Case 1: Autocorrelation is present in both directions (y and x), with strong – correlation and a well-defined data collapse (e.g., well scW1).
- Case 2: Fractal behavior is observed in both directions, but with – correlation and less defined data collapse (e.g., well scW2).
- Case 3: No fractal correlation is present in either direction, and no data collapse is observed (e.g., wells scW3 and scW5). In such cases, a Euclidean analysis may be more suitable than a fractal approach.
In at least three of the presented cases, the wells exhibit characteristics that can be modeled using the self-affine fractal approach. However, it is worth noting that the literature also reports the presence of multifractality in various studies on porosity logs, using different sampling and analysis techniques [17,45,46].
The results obtained in this study do not contradict such findings. As shown in Figure 6, the existence of a family of local Hurst exponents provides a better characterization of the log series depending on the analysis size L. This figure highlights the heterogeneous behavior of the series, showing how Hurst exponents vary across different intervals. Additionally, short-range memory processes are identified (see Figure 5b–d), as described by Ferreira et al. [44].
These short-term memory processes may go unnoticed if only a single global Hurst exponent is estimated, which would lead to a limited representation of the spatial heterogeneity in the porosity or storage capacity matrix.
4. Limitations and Scope
- The correlation between the scaling exponents and is not presented quantitatively through explicit power-law relationships, as has been developed in previous studies [18].
- The correlation between the scaling results of storage capacity fluctuations and Cretaceous stratigraphic units is not included due to confidentiality constraints in data management. Similarly, the relationship between storage capacity and well stratigraphy is not addressed. However, such correlation could be readily established by a specialist with access to both variables and data from a different geological formation.
- The petrophysical heterogeneity of the reservoir, as observed through petrographic analysis, could be associated with the spatial heterogeneity observed in the distribution of Hurst exponents.
- The local heterogeneity illustrated in Figure 6 from individual well records could be integrated into the modeling of a global storage capacity and/or porosity matrix for a petroleum reservoir using an appropriate interpolation method, that is, a connection between the static and dynamic reservoir models could be evaluated.
5. Conclusions
The Family–Vicsek methodology was applied to scalar log profiles of storage capacity from five wells located in an oil field in southeastern Mexico. Correlations were established in the perpendicular direction corresponding to depth-y, and in the horizontal direction along the x-axis. – correlation was identified through information collapse analysis. The Euclidean and fractal classification is evidenced by the three distinct patterns identified in the well log records of storage capacity .
An auto-affine behavior was observed in the RSC of wells scW1, scW2, scW4, and scW5, characterized by long-range memory; that is, statistical persistence in the fluctuations associated with the scalar records. The field’s heterogeneity was evidenced by a spectrum of scaling exponents ranging from antipersistent to random and persistent behaviors, suggesting multifractal features in the series of records analyzed at different scales.
Two types of statistical correlation were identified using Hurst exponents derived from the power-law relationship between the structure function and the observation window widths , considering : statistical persistence () and antipersistence (). Wells characterized by indicate statistically persistent behavior, implying smoother growth fronts, i.e., lower variation in the magnitude of records. Conversely, wells with Hurst exponents indicate antipersistent behavior, associated with more heterogeneous growth fronts and greater variation in the recorded values.
The heterogeneity described through the different scaling exponents across the case studies suggests that such information should be taken into account in the construction of the storage capacity matrix, which serves as a key input for assessing the storage potential of the reservoir.
In addition to confirming the relevance of fractal and auto-affine models in the interpretation of geophysical records, the results underscore the importance of multiscale approaches to capture the complex heterogeneity inherent in reservoir systems. The observed multifractal traits and cross-scale correlations support the hypothesis that the spatial variability in storage capacity cannot be accurately characterized by a single global exponent. Instead, a local or segmented treatment using Hurst exponent distributions provides a richer and more precise understanding of the spatial structure.
Furthermore, the methodology presented offers a physically grounded alternative for integrating petrophysical heterogeneity into reservoir modeling workflows. This is particularly useful in the absence of complete stratigraphic or lithological data, allowing the identification of internal organizational patterns solely from the statistical properties of the available records. As such, the proposed approach complements traditional deterministic techniques and opens new possibilities for the integration of fractal geometry and stochastic modeling in reservoir characterization and simulation.
While this study has identified qualitative evidence of fractal characteristics in some of the analyzed wells—helping to establish more consistent indicators of flow capacity—this represents an initial approximation. A subsequent stage should include a more rigorous quantitative validation using formal statistical tools such as spectral analysis, goodness-of-fit tests, or long-range correlation functions. These tools would serve to reinforce the fractal hypothesis and facilitate its application within predictive flow models for porous media.
Author Contributions
Conceptualization, S.M-G. and E.I.G-O.; methodology, S.M-G. and E.I.G-O.; software, R.C-V.; formal analysis, S.M-G. and E.I.G-O.; investigation, L.D.C-D; writing—original draft preparation, S.M-G.; writing—review and editing, E.I.G-O. and H.D.S-Ch. All authors have read and agreed to the published version of the manuscript.
Funding
This research received no external funding.
Institutional Review Board Statement
Not applicable.
Informed Consent Statement
Not applicable.
Data Availability Statement
The raw data supporting the conclusions of this article will be made available by the authors on request.
Acknowledgments
The authors gratefully acknowledge the data and support provided for this analysis, particularly from the Applied Research in Earth Science group, led by Armando García Jaramillo, and from the teams specializing in geology, petrophysics, and petroleum production.
Conflicts of Interest
The authors declare no conflicts of interest.
References
- Fan, X., Wang, G., Li, Y., Dai, Q., Linghu, S., Duan, C., Zhang, C. & Zhang, F. Pore structure evaluation of tight reservoirs in the mixed siliciclastic-carbonate sediments using fractal analysis of NMR experiments and logs. Marine And Petroleum Geology 2019, 109, 484–493.
- Mishra, P., Vesselinov, V. & Neuman, S. Radial flow to a partially penetrating well with storage in an anisotropic confined aquifer. Journal Of Hydrology 2012, 448, 255–259.
- Lee, B. & Lee, S. Effects of specific surface area and porosity on cube counting fractal dimension, lacunarity, configurational entropy, and permeability of model porous networks: Random packing simulations and NMR micro-imaging study. Journal Of Hydrology 2013, 496, 122–141.
- Acharya, M., Kabir, M., Al-Ajmi, S., Dashti, Q., Al-Anzi, E., Kho, D., Daraus, C. & Chakravorty, S. Flow Capacity Evaluation in a Complex Carbonate Reservoir: Key to Understand Reservoir Productivity and Stimulation Effectiveness. Proceedings - SPE Annual Technical Conference And Exhibition. 1 pp. 267-272 (2012,10). [CrossRef]
- Qiao, J., Zeng, J., Jiang, S., Ma, Y., Feng, S., Xie, H., Wang, Y. & Hu, H. Role of pore structure in the percolation and storage capacities of deeply buried sandstone reservoirs: A case study of the Junggar Basin, China. Marine And Petroleum Geology 2020, 113, 104129.
- Qiao, J., Zeng, J., Jiang, S., Zhang, Y., Feng, S., Feng, X., Hu, H., Qiao, J., Zeng, J., Jiang, S., Zhang, Y., Feng, S., Feng, X. & Hu, H. Insights into the pore structure and implications for fluid flow capacity of tight gas sandstone: A case study in the upper paleozoic of the Ordos Basin. MarPG 2020, 118, 104439. Available online: https://ui.adsabs.harvard.edu/abs/2020MarPG.11804439Q/abstract.
- Wang, J., Wang, J., Xu, S., Wu, R., Lv, J., Li, Z., Li, C., Zhang, J., Zhao, L., Xie, J. & Zhang, J. A novel mode for “three zones” collaborative reconstruction of underground gas storage and its application to large, low-permeability lithologic gas reservoirs. Energy 2022, 253, 124148.
- Warren, J. & Root, P. The Behavior of Naturally Fractured Reservoirs. Society Of Petroleum Engineers Journal 1963, 3, 245–255. [CrossRef]
- Abadassah, D. & Ershaghi, I. Triple-Porosity Systems for Representing Naturally Fractured Reservoirs. SPE Formation Evaluation 1986, 1, 113–127. [CrossRef]
- Yarmohammadi, S., Kadkhodaie, A. & Hosseinzadeh, S. An integrated approach for heterogeneity analysis of carbonate reservoirs by using image log based porosity distributions, NMR T2 curves, velocity deviation log and petrographic studies: A case study from the South Pars gas field, Persian Gulf Basin. Journal Of Petroleum Science And Engineering 2020, 192, 107283. Available online: https://www.sciencedirect.com/science/article/pii/S0920410520303624?via%253Dihub.
- Fitch, P. Heterogeneity in the Petrophysical Properties of Carbonate Reservoirs.. (University of Leicester,2011,1).
- Chen, S., Gong, Z., Li, X., Wang, H., Wang, Y. & Zhang, Y. Pore structure and heterogeneity of shale gas reservoirs and its effect on gas storage capacity in the Qiongzhusi Formation. Geoscience Frontiers 2021, 12, 101244. Available online: https://www.sciencedirect.com/science/article/pii/S1674987121001080?via%253Dihub.
- Xiao, Z., Ding, W., Hao, S., Taleghani, A., Wang, X., Zhou, X., Sun, Y., Liu, J. & Gu, Y. Quantitative analysis of tight sandstone reservoir heterogeneity based on rescaled range analysis and empirical mode decomposition: A case study of the Chang 7 reservoir in the Dingbian oilfield. Journal Of Petroleum Science And Engineering 2019, 182, 106326. Available online: https://www.sciencedirect.com/science/article/pii/S0920410519307478.
- Huang, W., Lu, S., Hersi, O., Wang, M., Deng, S. & Lu, R. Reservoir spaces in tight sandstones: Classification, fractal characters, and heterogeneity. Journal Of Natural Gas Science And Engineering 2017, 46, 80–92. Available online: https://www.sciencedirect.com/science/article/abs/pii/S1875510017302822?via%253Dihub.
- Yu, X., Ghasemizadeh, R., Padilla, I., Kaeli, D. & Alshawabkeh, A. Patterns of temporal scaling of groundwater level fluctuation. Journal Of Hydrology 2016, 536, 485–495. Available online: https://www.sciencedirect.com/science/article/abs/pii/S0022169416301238?via%253Dihub.
- Balankin, A., Valdivia, J., Marquez, J., Susarrey, O. & Solorio-Avila, M. Anomalous diffusion of fluid momentum and Darcy-like law for laminar flow in media with fractal porosity. Physics Letters A 2016, 380, 2767–2773.
- Dashtian, H., Jafari, G., Sahimi, M. & Masihi, M. Scaling, multifractality, and long-range correlations in well log data of large-scale porous media. Physica A: Statistical Mechanics And Its Applications 2011, 390, 2096–2111.
- Dashtian, H., Jafari, G., Lai, Z., Masihi, M. & Sahimi, M. Analysis of Cross Correlations Between Well Logs of Hydrocarbon Reservoirs. Transport In Porous Media 2011, 90, 445–464.
- Balankin, A. & Elizarraraz, B. Map of fluid flow in fractal porous medium into fractal continuum flow. Physical Review E - Statistical, Nonlinear, And Soft Matter Physics. 85, 056314 (2012,5). [CrossRef]
- Chang, J. & Yortsos, Y. Pressure-Transient Analysis of Fractal Reservoirs. SPE Formation Evaluation 1990, 5, 31–38. [CrossRef]
- Park, H. , Choe, J. & Kang, J. Pressure Behavior of Transport in Fractal Porous Media Using a Fractional Calculus Approach. Energy Sources 2000, 22, 881–890. [Google Scholar]
- Flamenco-López, F. & Camacho-Velázquez, R. Determination of Fractal Parameters of Fracture Networks Using Pressure-Transient Data. SPE Reservoir Evaluation & Engineering 2003, 6, 39–47. [Google Scholar] [CrossRef]
- Balankin, A., Matamoros, D., Ortiz, J., Ortiz, M., León, E. & Ochoa, D. Scaling dynamics of seismic activity fluctuations. Europhysics Letters 2009, 85, 39001. [CrossRef]
- Ezaier, Y. , Hader, A., Latif, A., Amallah, L., Achik, I. & Boughaleb, Y. Morphological properties of the interfaces growth of composite membranes. Materials Today: Proceedings 2022, 66, 238–243. [Google Scholar]
- Fujimoto, K. , Hamazaki, R. & Kawaguchi, Y. Family-Vicsek Scaling of Roughness Growth in a Strongly Interacting Bose Gas. Physical Review Letters 2020, 124, 210604. [Google Scholar] [CrossRef] [PubMed]
- Ouadfeul, S. & Aliouane, L. Multifractal Analysis Revisited by the Continuous Wavelet Transform Applied in Lithofacies Segmentation from Well-Logs Data. International Journal Of Applied Physics And Mathematics 2011, 10–18. [Google Scholar]
- D., B., T.M, W., A., D. & M., P. A New Set Of Type Curves Simplifies Well Test Analysis. (1983,5), https://kb.oges.info/library/145765/A-New-Set-Of-Type-Curves-Simplifies-Well-Test-Anal.
- Acuna, J. , Ershaghi, I. & Yortsos, Y. Practical Application of Fractal Pressure-Transient Analysis in Naturally Fractured Reservoirs. SPE Formation Evaluation 1995, 10, 173–179. [Google Scholar] [CrossRef]
- Balankin, A. , Morales-Ruiz, L., Matías-Gutierres, S., Susarrey-Huerta, O., Samayoa-Ochoa, D. & Patiño-Ortiz, J. Comparative study of gravity-driven discharge from reservoirs with translationally invariant and fractal pore networks. Journal Of Hydrology 2018, 565, 467–473. [Google Scholar]
- Rios, V. , Santos, L. & Schiozer, D. Upscaling Technique for Highly Heterogeneous Reservoirs Based on Flow and Storage Capacity and the Lorenz Coefficient. SPE Journal 1999, 25, 1981–1999. [Google Scholar] [CrossRef]
- Lozada-Zumaeta, M. , Arizabalo, R., Ronquillo-Jarillo, G., Coconi-Morales, E., Rivera-Recillas, D. & Castrejón-Vácio, F. Distribution of petrophysical properties for sandy-clayey reservoirs by fractal interpolation. Nonlin. Processes Geophys, 2012. [Google Scholar]
- Hernandez-Martinez, E., Perez-Muñoz, T., Velasco-Hernandez, J., Altamira-Areyan, A. & Velasquillo-Martinez, L. Facies Recognition Using Multifractal Hurst Analysis: Applications to Well-Log Data. Mathematical Geosciences. 45, 471-486 (2013,5). [CrossRef]
- Hernandez-Martinez, E., Velasco-Hernandez, J., Perez-Muñoz, T. & Alvarez-Ramirez, J. A DFA approach in well-logs for the identification of facies associations. Physica A: Statistical Mechanics And Its Applications 2013, 392, 6015–6024.
- Barabási, A. & Stanley, H. Fractal Concepts in Surface Growth. Fractal Concepts In Surface Growth. (1995,4), https://www.cambridge.org/core/product/identifier/9780511599798/type/book.
- Balankin, A. Dynamic scaling approach to study time series fluctuations. Physical Review. E, Statistical, Nonlinear, And Soft Matter Physics 2007, 76. Available online: https://pubmed.ncbi.nlm.nih.gov/18233731/. [CrossRef] [PubMed]
- Meakin, P. The growth of rough surfaces and interfaces. Physics Reports 1993, 235, 189–289. [Google Scholar] [CrossRef]
- Hewett, T. Fractal Distributions of Reservoir Heterogeneity and their Influence on Fluid Transport. Society Of Petroleum Engineers Of AIME, (Paper) SPE. (1986,10). [CrossRef]
- Bunde, A. & Havin, S. Fractals in Science. Fractals In Science. (1994). [CrossRef]
- Jestczemski, F. & Sernetz, M. Multifractal approach to inhomogeneous fractals. Physica A: Statistical Mechanics And Its Applications 1996, 223, 275–282.
- Hardy, H. & Beier, R. Fractals in Reservoir Engineering. (WORLD SCIENTIFIC,1994), https://www.worldscientific.com/doi/abs/10.1142/2574.
- Barton, C. & Pointe, P. Fractals in the Earth Sciences. Fractals In The Earth Sciences. pp. XVIII-265 (1995). [CrossRef]
- Family, F. & Vicsek, T. Scaling of the active zone in the Eden process on percolation networks and the ballistic deposition model. Journal Of Physics A: Mathematical And General 1985, 18, L75. [CrossRef]
- Gutierres, S. , Garcia, E., Chávez, H. & Villafuerte, R. Scaling the fluctuation of the flow capacity of core logs in a formation in southeastern Mexico. Revista Mexicana De Física 2025, 71, 030602. Available online: https://rmf.smf.mx/ojs/index.php/rmf/article/view/7436.
- Ferreira, R., Vieira, V., Gleria, I. & Lyra, M. Correlation and complexity analysis of well logs via Lyapunov, Hurst, Lempel–Ziv and neural network algorithms. In Physica A: Statistical Mechanics And Its Applications; 2009; Volume 388, pp. 747–754. Available online: https://www.sciencedirect.com/science/article/abs/pii/S0378437108009060.
- Subhakar, D. & Chandrasekhar, E. Reservoir characterization using multifractal detrended fluctuation analysis of geophysical well-log data. Physica A: Statistical Mechanics And Its Applications 2016, 445, 57–65. Available online: https://www.sciencedirect.com/science/article/abs/pii/S0378437115009620?via%253Dihub.
- Chen, X. , Yao, G., Cai, J., Huang, Y. & Yuan, X. Fractal and multifractal analysis of different hydraulic flow units based on micro-CT images. Journal Of Natural Gas Science And Engineering 2017, 48, 145–156. [Google Scholar]
Figure 1.
(a) ks, (b) kI.

Figure 2.
Well scW1: (a) Cumulative flow capacity curve (solid line), linear fit (dashed line) with sampling interval along the y-direction (depth); (b) Relative Storage Capacity (RSC); (c) double-log power-law relationship of the structure function for as a function of observation window width ; (d) interface growth dynamics along the x-direction.
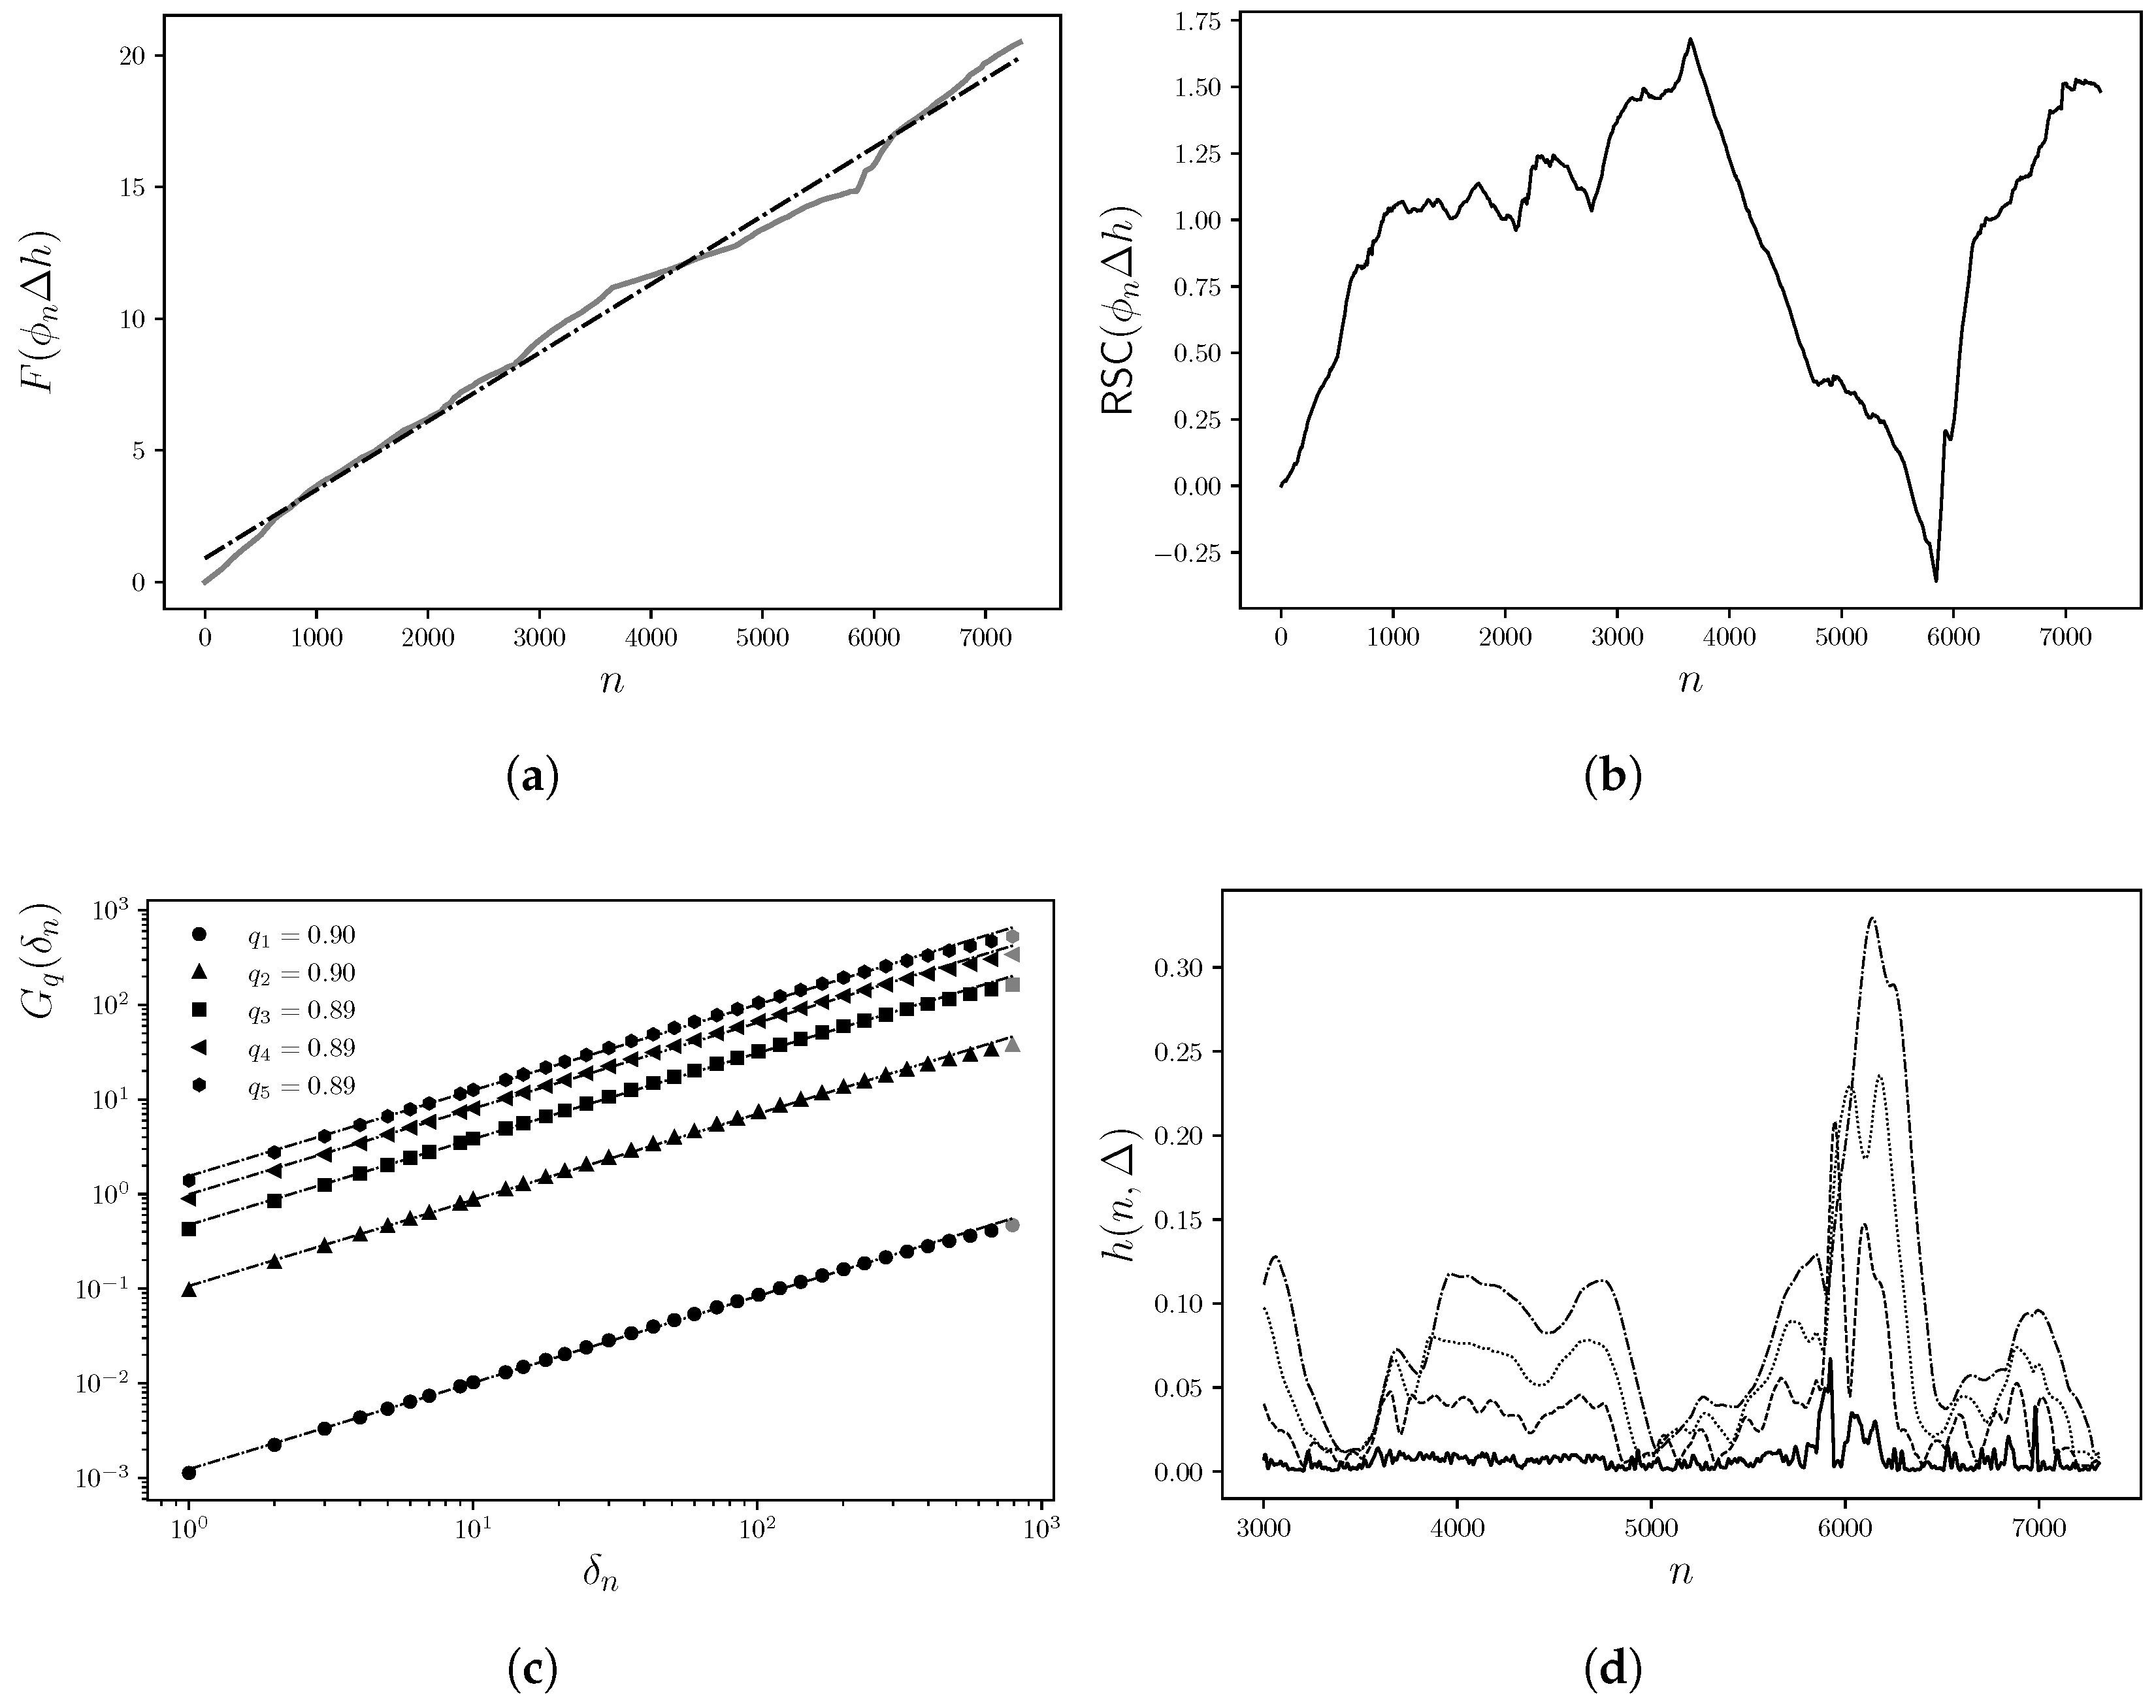
Figure 3.
Well scW1: (a) Double logarithmic power-law relationship of the structure function for by with respect to the observation window width. (b) Growth exponent characterizing the dynamics of interface growth in the x-direction, perpendicular to the depth sampling interval (y-axis). (c) Dynamic exponent z; (d) data collapse analysis.
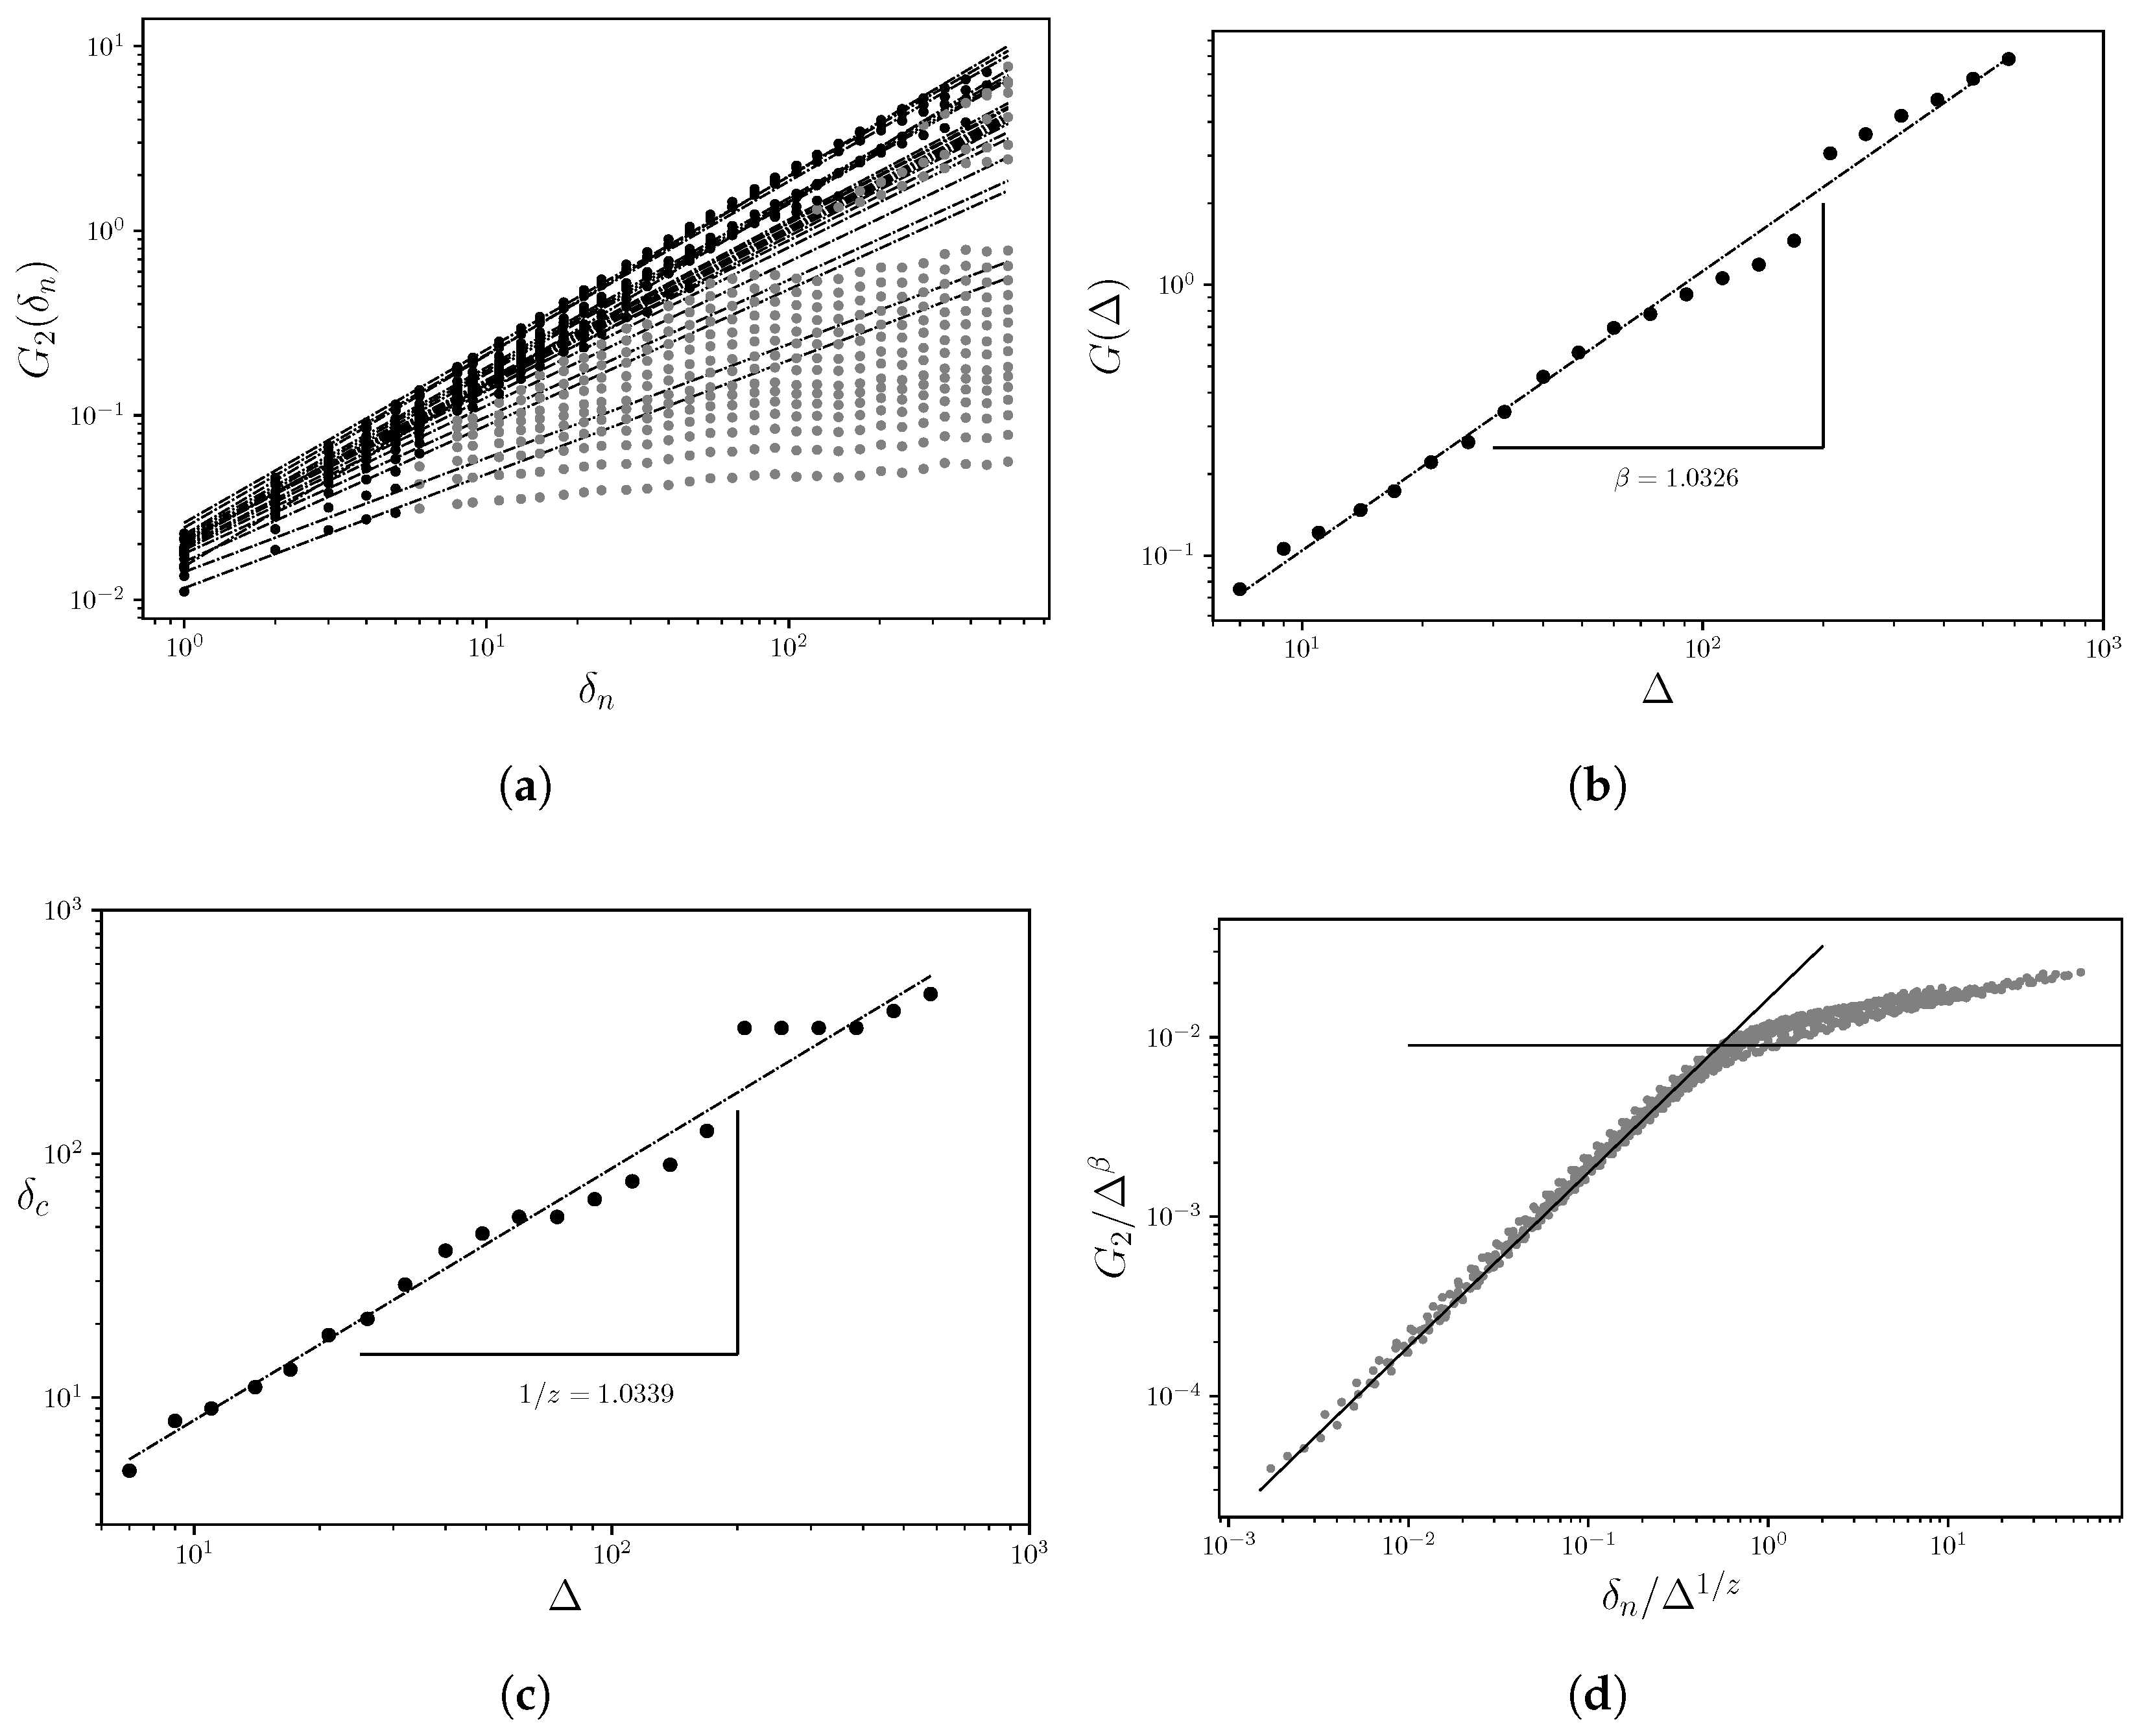
Figure 4.
Well scW2: (a) Double logarithmic power-law relationship of the structure function for as a function of the observation window width, indicating long-range correlations in the fluctuations associated with storage capacity logs. (b) Growth exponent characterizing the interface growth dynamics in the x-direction, perpendicular to the depth sampling interval (y-axis). (c) Dynamic exponent z; (d) data collapse.
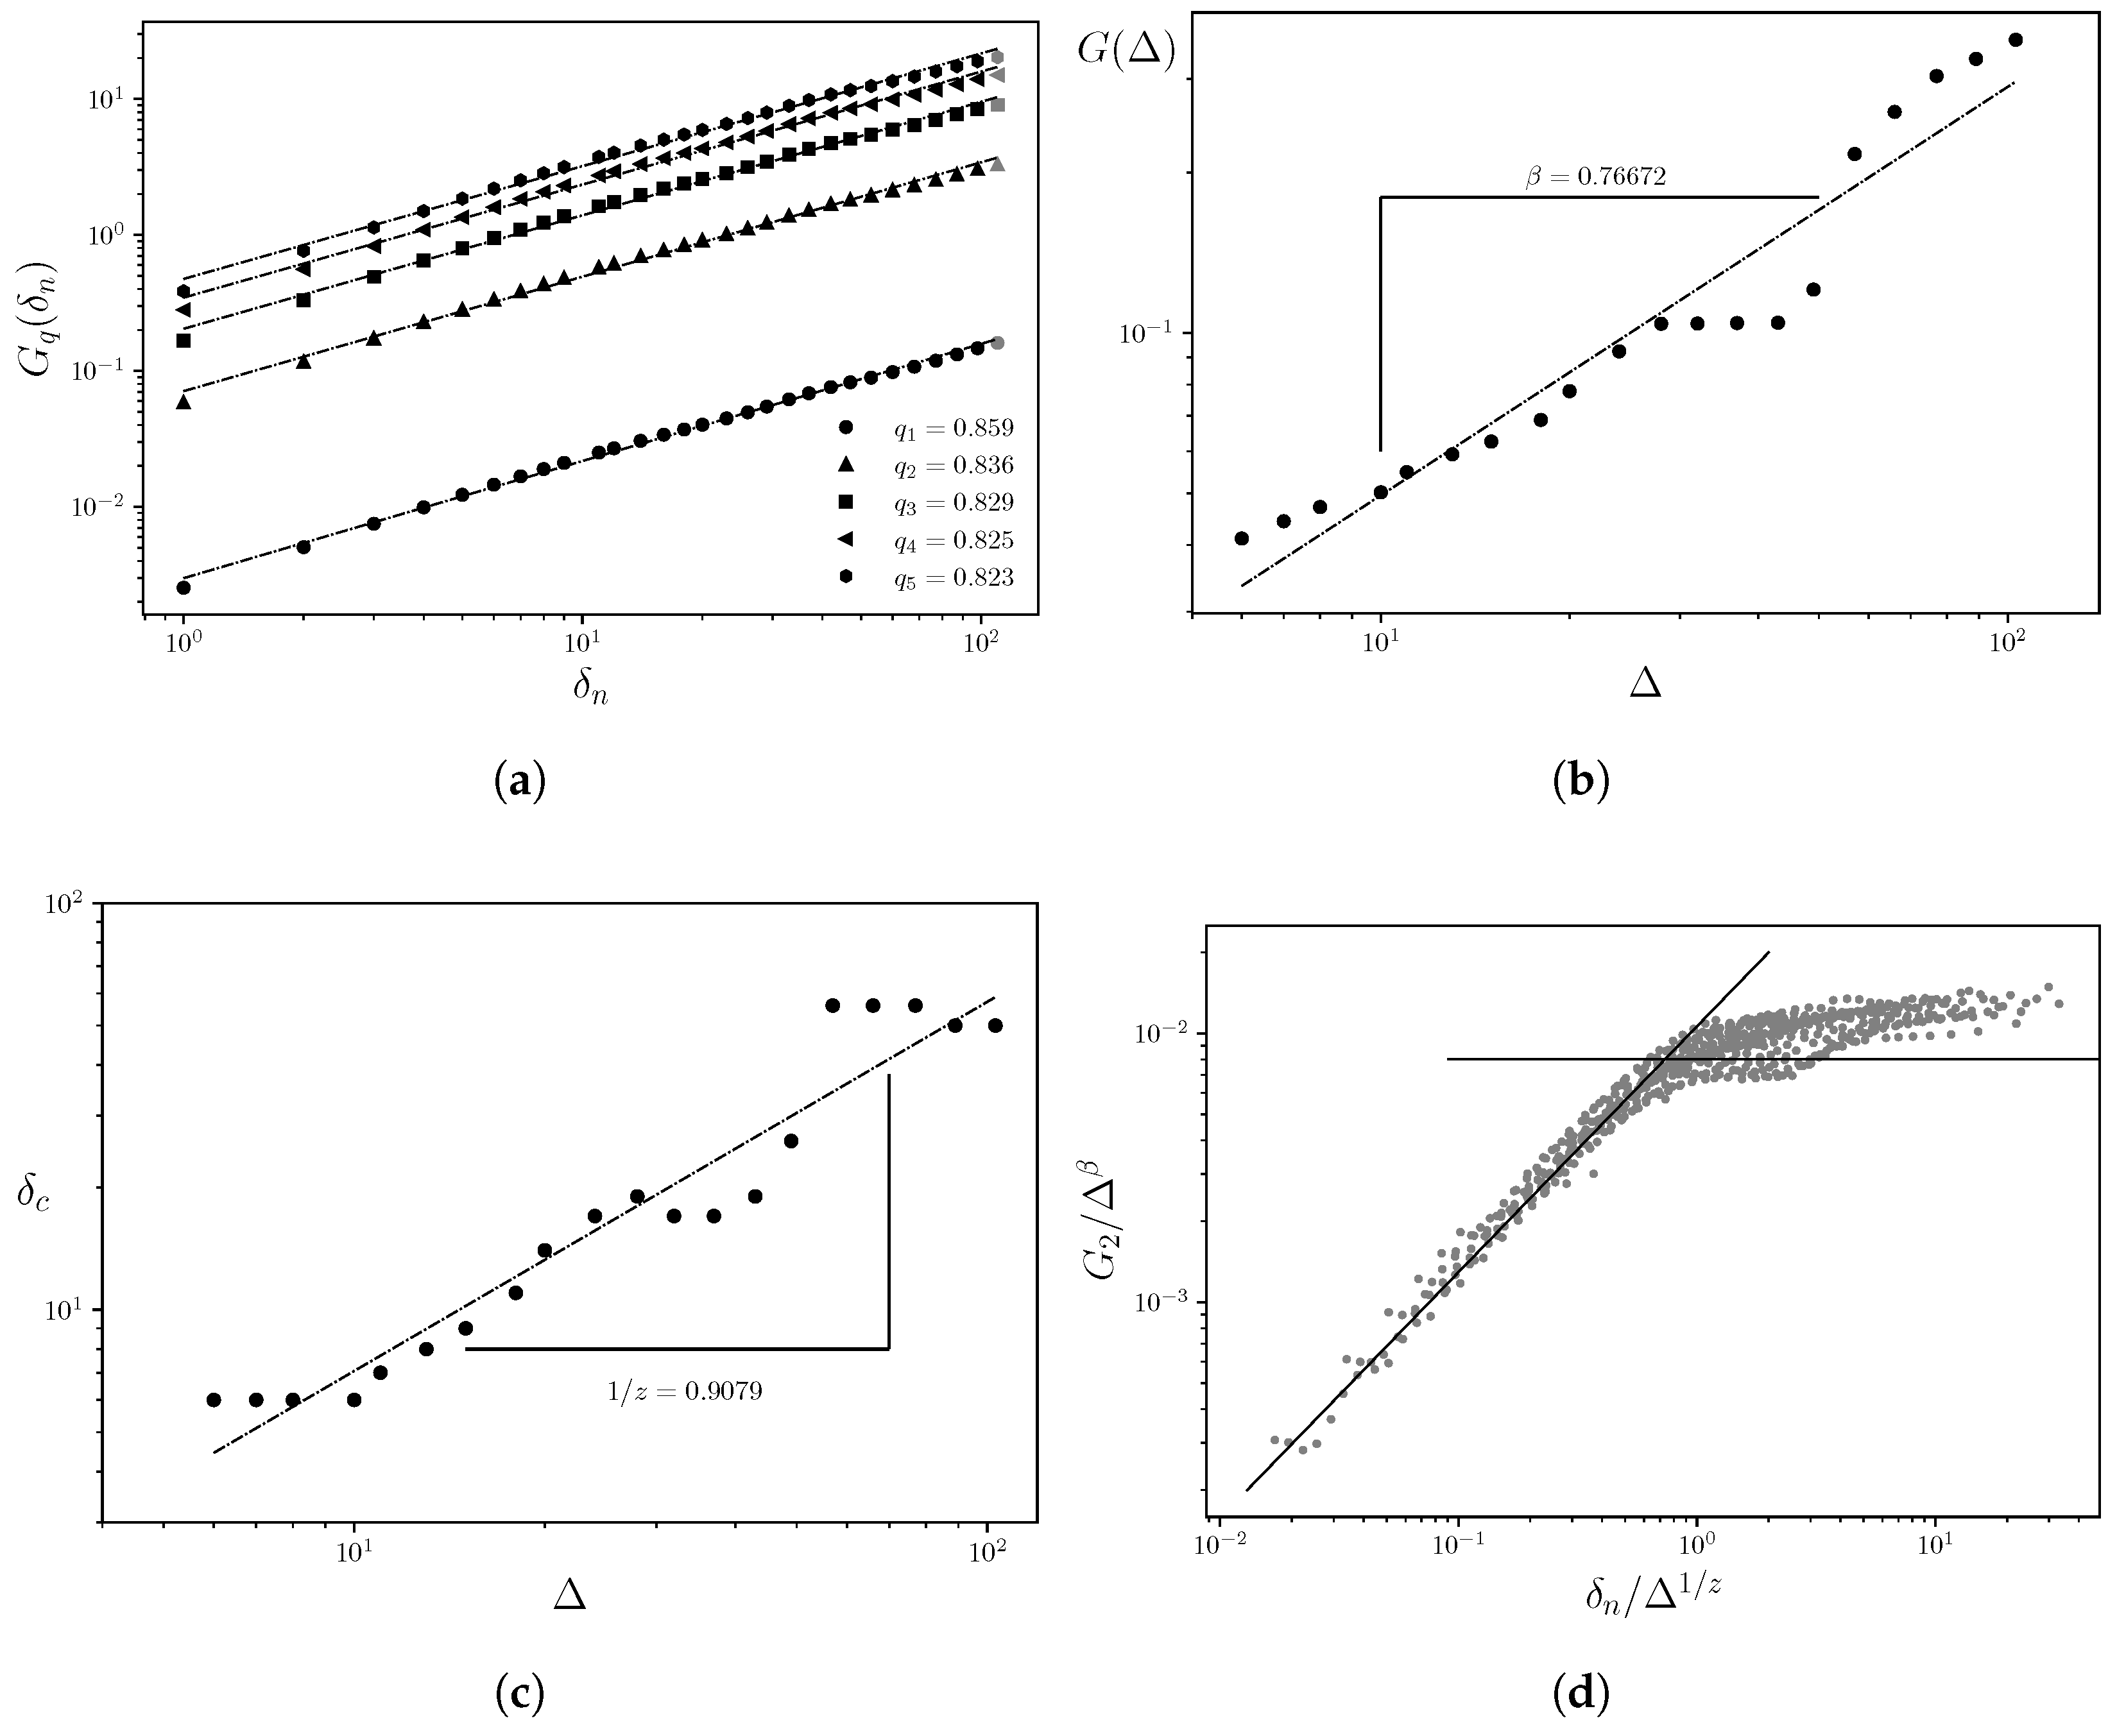
Figure 5.
(a) Double logarithmic power-law relationship of the structure function for as a function of the observation window width, indicating long-range correlations in the fluctuations associated with storage capacity logs. (b) Growth exponent characterizing the interface growth dynamics in the x-direction, perpendicular to the depth sampling interval (y-axis). (c) Dynamic exponent z; (d) data collapse.
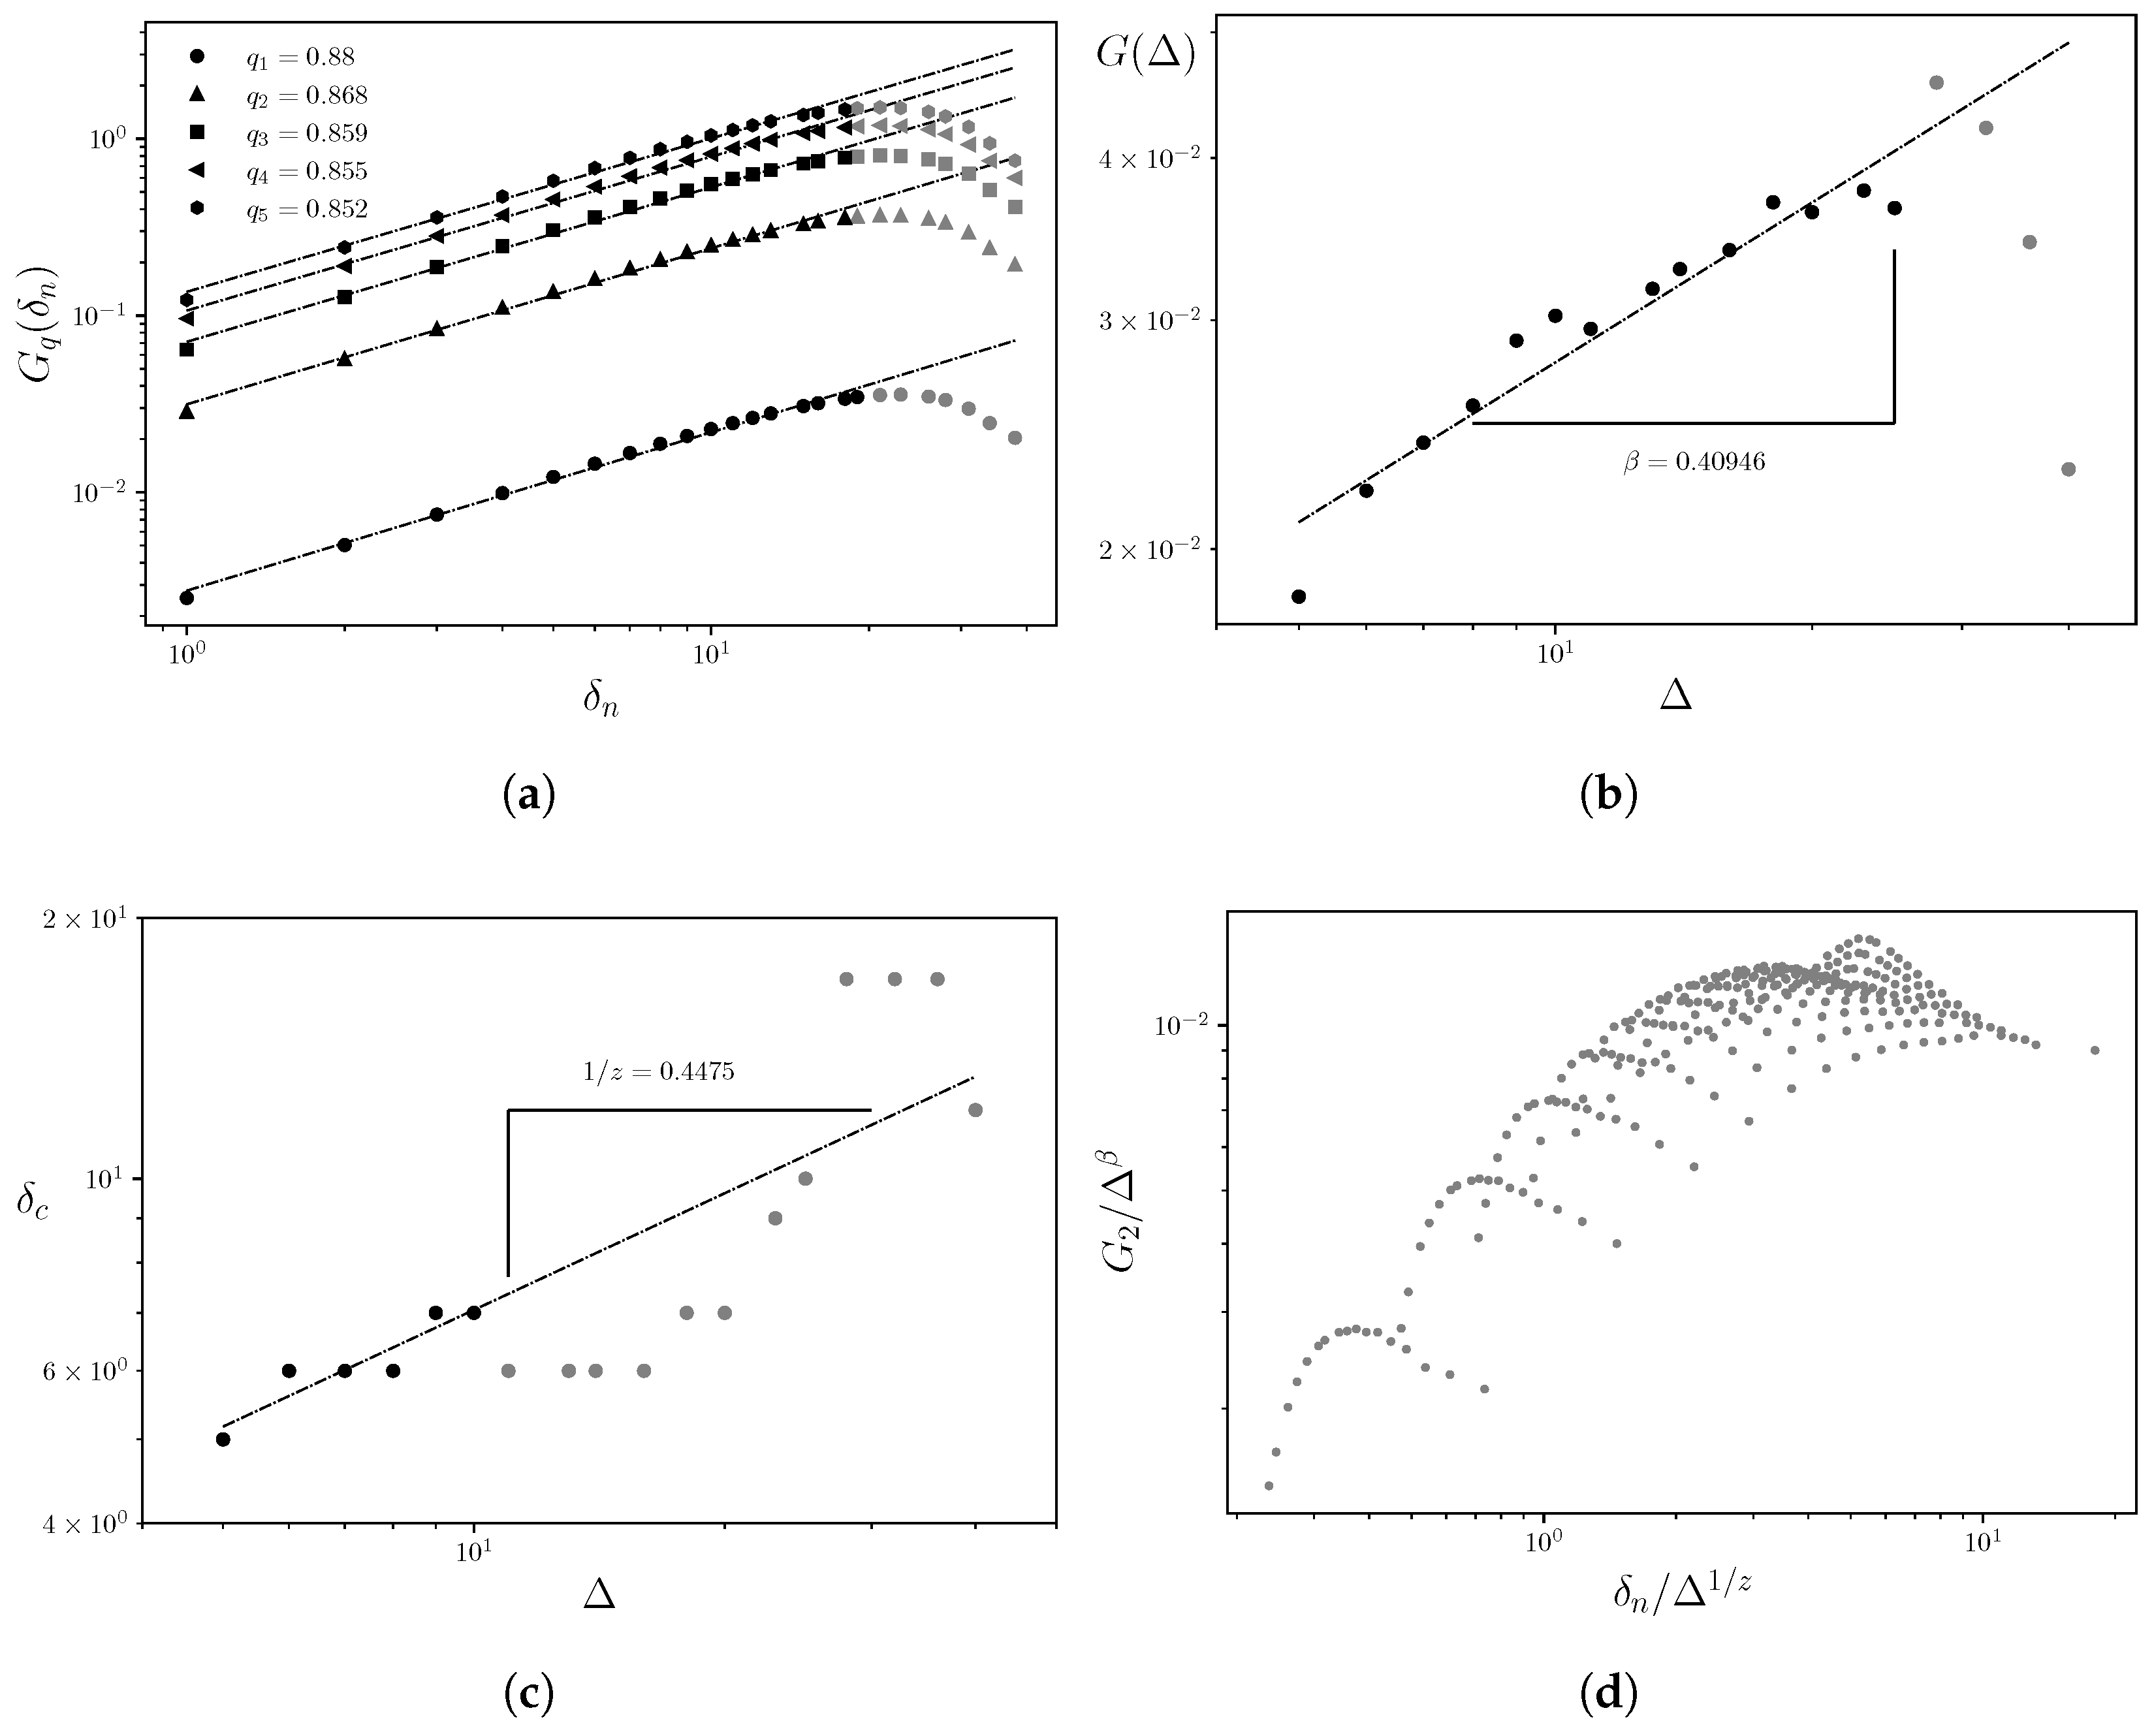
Figure 6.
Hurst Exponent Distributions for Different Sampling Intervals.
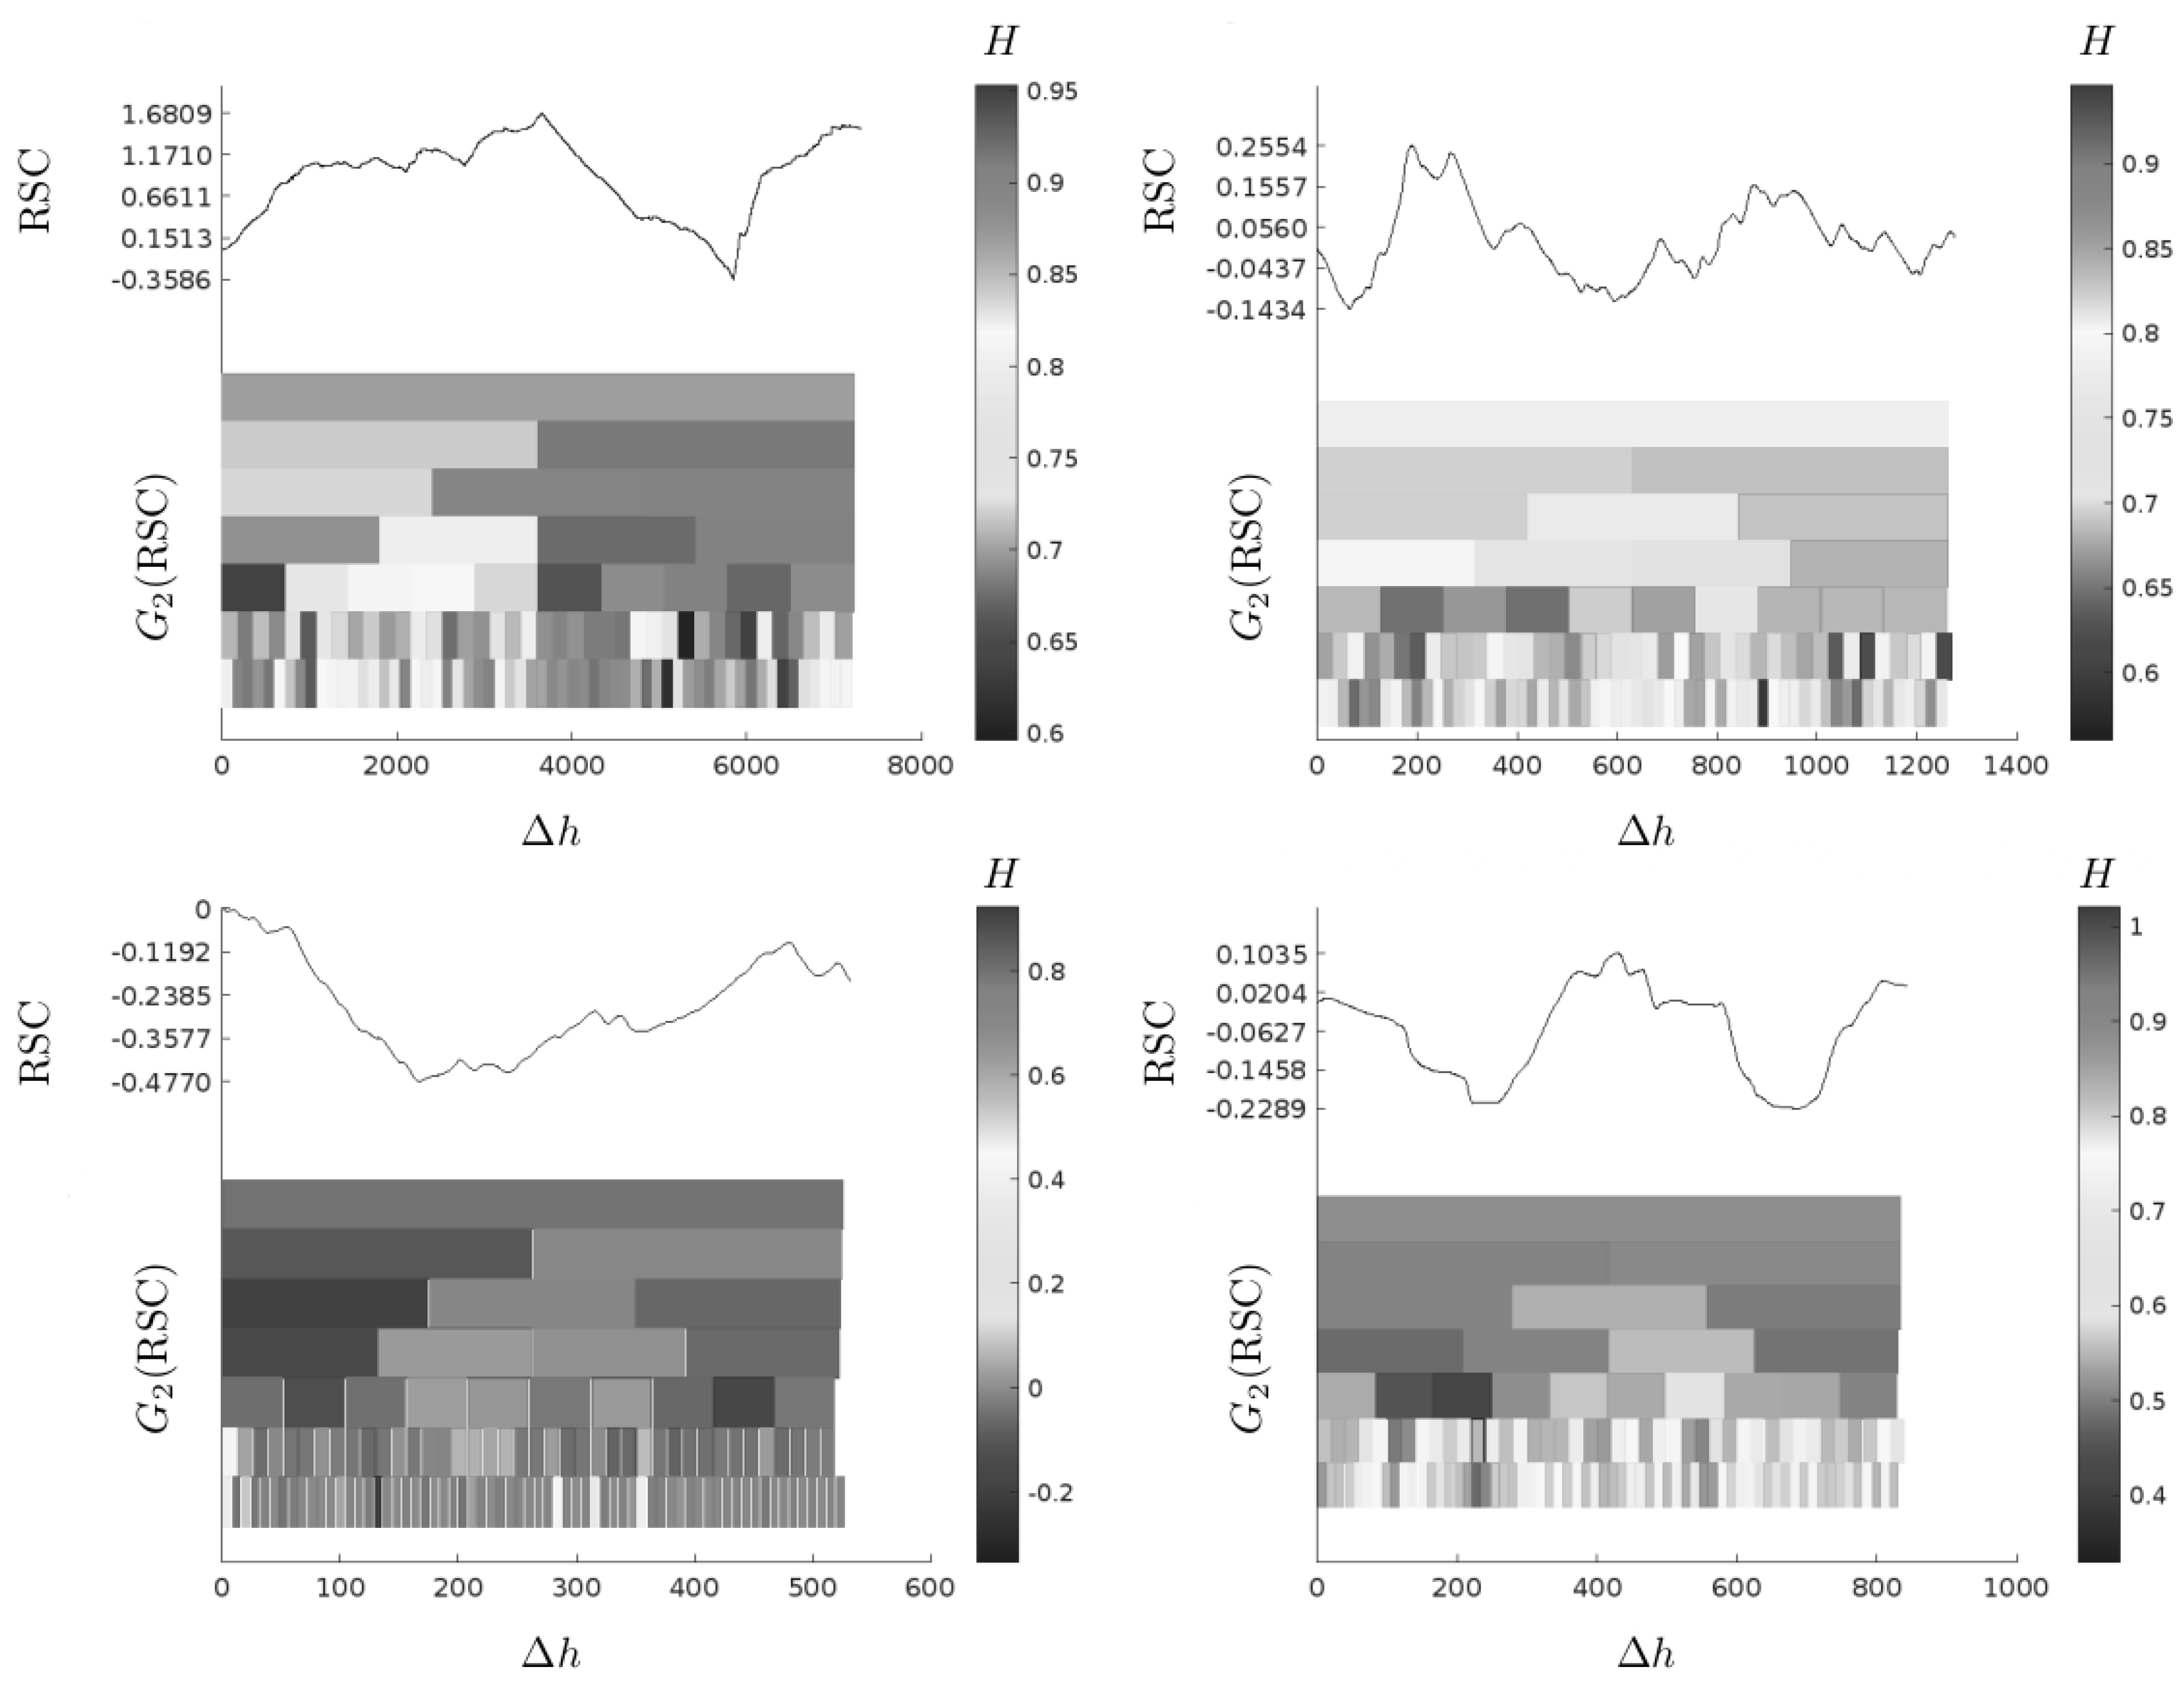

Table 1.
Scaling exponents and data collapse results for each analyzed well.
| Well | z | Collapse | ||
|---|---|---|---|---|
| scW1 | 0.90 | 1.03 | 0.92 | Yes |
| scW2 | 0.83 | 0.76 | 1.11 | Yes |
| scW3 | 0.86 | 0.40 | 2.23 | No |
| scW4 | 0.99 | 0.81 | 1.38 | Yes |
| scW5 | 0.97 | 0.71 | 2.70 | No |
Disclaimer/Publisher’s Note: The statements, opinions and data contained in all publications are solely those of the individual author(s) and contributor(s) and not of MDPI and/or the editor(s). MDPI and/or the editor(s) disclaim responsibility for any injury to people or property resulting from any ideas, methods, instructions or products referred to in the content. |
© 2025 by the authors. Licensee MDPI, Basel, Switzerland. This article is an open access article distributed under the terms and conditions of the Creative Commons Attribution (CC BY) license (http://creativecommons.org/licenses/by/4.0/).
Copyright: This open access article is published under a Creative Commons CC BY 4.0 license, which permit the free download, distribution, and reuse, provided that the author and preprint are cited in any reuse.


