
Submitted:
16 July 2025
Posted:
16 July 2025
You are already at the latest version
Abstract
In the manufacture of single-crystal blades for aero-engines, the problem of eutectic aggregation on the upper surface of the blades has long been restricting the casting performance improvement. To investigate this phenomenon, this paper employs a simplified blade-like shape casting and focuses a 3rd generation nickel-based single-crystal superalloy as the research material. A systematic analysis is conducted to elucidate the distribution of γ/γ' eutectic during solidification. Experimental results show distinct spatial variations in γ/γ' eutectic distribution. Pronounced eutectic aggregation is observed on the upper surface of the blade but with sparse eutectic dispersion on the lower regions of the casting. Relatively uniform eutectic distribution dominates the mid-section of the specimen. To unravel the underlying mechanisms, this paper utilized a multiphase volume-averaged solidification model, developed in prior work, to numerically simulate the γ/γ' eutectic evolution during directional solidification. This computational framework enabled a comprehensive quantitative analysis of spatial and temporal variations in the eutectic volume fraction along the solidification direction. The integration of experimental and modeling approaches provides critical insights into the interplay between thermal gradients, alloy composition, and microstructural heterogeneity.
Keywords:
nickel-based superalloys
; single crystal
; γ/γ' eutectic structure
; distribution patterns
; simulation
1. Introduction
Nickel-based superalloys serve as indispensable materials for critical high-temperature components, including aero-engine turbine blades and industrial gas turbine hot-section assemblies, operating reliably in extreme thermal environments (650-1000°C) due to their exceptional mechanical stability, superior oxidation resistance, and remarkable hot-corrosion durability [1,2,3]. While single-crystal components are predominantly manufactured using Bridgman directional solidification technology, the strategic alloying with refractory elements such as rhenium (Re) in advanced-generation superalloys exacerbates microsegregation phenomena. This compositional design inadvertently promotes excessive γ/γ′ eutectic phase formation within interdendritic domains during solidification[4,5]. Characterized by elevated volume fractions (typically 8–15%) and coarse morphological features, these eutectic structures exhibit limited solubility during standard solution heat treatment cycles, resulting in persistent eutectic retention at localized regions[6,7]. Such microstructural heterogeneities not only compromise the crystallographic continuity essential for single-crystal integrity but also serve as preferential sites for crack nucleation, thereby severely degrading creep resistance and fatigue performance under thermomechanical loading conditions. These microstructural imperfections have consequently emerged as a critical technological barrier impeding the widespread implementation of next-generation single-crystal superalloys in demanding aerospace applications.
The morphology, spatial distribution, and volume fraction of γ/γ’ eutectic in relation to solidification conditions have been systematically elucidated in multiple studies [8,9,10,11,12,13]. Brewster et al.[8] investigated the formation mechanism of surface eutectic layers in the directional solidification of the typical nickel-based superalloy CMSX-10N. They proposed that lateral solidification shrinkage induces interdendritic melt backflow as a volume compensation driving force, transporting solute-enriched low-melting-point liquid phases to near-surface regions and ultimately forming continuous surface eutectic layers. Cao et al.[9,10]further demonstrated through comparative experiments that mold-alloy interface interactions play a negligible role in surface eutectic formation. Instead, the phenomenon originates from the extrusion of residual liquid phases between dendritic skeletons to free surfaces under contraction stresses during the final solidification stage. Notably, Ma et al.[11,12] challenged conventional understanding of lateral eutectic enrichment in their study of third-generation single-crystal superalloy blades and test bars. While no directional migration of γ/γ’ eutectic toward surfaces was observed in the transverse direction (perpendicular to the solidification direction), a pronounced gradient distribution emerged along the axial direction (solidification direction): the volume fraction of eutectic reached 12–15% in the upper regions of castings but decreased to 3–5% in lower regions, revealing the profound regulatory effects of solidification pathways on solute redistribution.
Building upon previous research, this study systematically investigates the distribution patterns of γ/γ’ eutectic structures in a plate casting of a 3rd generation nickel-based single-crystal superalloy. Experimental characterization reveals significant spatial heterogeneity in eutectic distribution across different regions: distinct eutectic aggregation occurs in the upper section of the casting, sparse distribution in the lower section, and relatively uniform dispersion in the intermediate region. To elucidate the underlying mechanisms governing these distribution characteristics, an integrated experimental and computational approach was employed. A series of designed experiments enabled systematic microstructural characterization of γ/γ’ eutectic distribution. Concurrently, numerical simulations coupling temperature fields calculated using ProCAST software with a previously developed multiphase volume-averaged solidification model[13,14] were implemented to predict eutectic evolution during directional solidification. Furthermore, this work quantitatively analyzes the influence of thermally driven liquid flow (induced by solutal buoyancy and solidification structural changes) on eutectic distribution and investigates variations in γ/γ’ eutectic volume fraction along the solidification direction. These combined approaches provide theoretical insights into the formation mechanisms governing heterogeneous eutectic distribution in advanced single-crystal superalloys.
2. Experimental Design and Methods
2.1. Experimental Design
To systematically investigate the distribution characteristics of γ/γ’ eutectic content along the solidification direction in single-crystal castings, three different cross-section thickness plate castings with distinct geometric parameters were designed. The castings feature a rectangular base configuration (analogous to the aerofoil section of turbine blades) with a 30 mm central width and 5 mm uniform thickness. Symmetrical protruding platform structures (mimicking blade platforms or shrouds) were integrated on both sides to replicate the solidification characteristics of critical blade features. All platforms maintain a constant protrusion width of 15 mm, while their heights vary progressively at 5 mm, 10 mm, and 15 mm, establishing geometrically progressive solidification conditions. Figure 1 details the dimensional specifications of the three casting configurations.
2.2. Experimental Methods
The chemical composition of the investigated nickel-based single-crystal superalloy is listed in Table 1. Alumina-based ceramic shells were employed for mold preparation, with each shell accommodating 10 plate castings of varying dimensions to ensure experimental efficiency and data consistency. Directional solidification was conducted using a Bridgman furnace with precise thermal control.
The thermal zoning configuration of the Bridgman furnace and spatial arrangement of the mold assembly are detailed in Figure 2(a). To achieve precise directional solidification control, critical process parameters were optimized as follows: the holding temperature in the heating zone is maintained at 1520± 5°C, the holding temperature in the cooling zone is controlled at 80 ± 2°C, the height of the heat insulation baffle is fixed at 30 mm, and the withdrawal rate of the mold assembly is set at 3 mm/min.
After the casting is completed, the plate casting is subjected to macroscopic etching to check whether a complete single crystal structure is formed in the casting. The three types of single crystal plate castings with different platform heights are shown in Figure 2 (b). For the castings that meet the single crystal requirements, dissection treatment is carried out, and detection methods such as a metallographic microscope and an electron probe are used to systematically study the as-cast structure characteristics and obtain the distribution data of the γ/γ’ eutectic.
To systematically characterize the as-cast microstructural features, wire electrical discharge machining (WEDM) was employed to extract metallographic specimens from three geometrically distinct plate castings following a predetermined sampling protocol. Figure 3 schematically details the standardized sampling locations across all casting configurations, ensuring positional consistency for comparative analysis. The metallographic specimens of the cut samples were meticulously ground, polished and etched. Finally, the metallographic structure images were obtained. The metallographic structures of the samples were photographed using a metallographic microscope. The metallographic images were processed and analyzed with the help of the Image-Pro Plus image processing and analysis software to calculate the fraction of the γ/γ’ eutectic.
3. Experimental Results and Analysis
3.1. Experimental Results
3.1.1. Comparison of Eutectic Distribution on the Top and Bottom Surfaces of the platform
Figure 4 displays the as-cast microstructure of the bottom and top surfaces of the 10mm platform. The brown dendritic structure corresponds to the γ matrix phase, while the white precipitates are the γ/γ’ eutectic. A significant difference in dendritic morphology is observed between the top and bottom surfaces. This discrepancy arises because the bottom surface of the platform experiences substantial undercooling when the plate enters the cooling zone for solidification, leading to rapid lateral growth of dendrites in this region. Specifically, Figure 4(a) reveals that the bottom surface is predominantly composed of γ phase with a low volume fraction of γ/γ’ eutectic. These eutectic structures are fine in size and uniformly distributed. In contrast, Figure 4(b) demonstrates a pronounced enrichment of γ/γ’ eutectic on the top surface, which exhibit notably larger size compared to those on the bottom surface.
3.1.2. Distribution of γ/γ’ Eutectic Along the Height Direction of platforms
Figure 5 presents the as-cast microstructures along the solidification direction for three different height platforms (5mm, 10mm, and 15mm). To systematically reveal the evolution of γ/γ’ eutectic along the solidification direction, this study conducted an in-depth analysis of the metallographic images of these plates. To investigate the evolution of γ/γ’ eutectic along the solidification direction, the metallographic images of these three bosses were analyzed in detail. Each sample was divided into equal segments at 1mm intervals along the height direction. The method described in Section 2.2 was applied to process the metallographic images of each 1mm segment and quantify the γ/γ’ eutectic content.
Figure 6, Figure 7 and Figure 8 illustrate the variation trends of γ/γ’ eutectic content in the as-cast microstructure along the solidification direction at the sampling positions of the 5mm, 10mm, and 15mm plates, respectively. Specifically: Figure 6 corresponds to the 5mm height plate, Figure 7 to the 10mm height plate, and Figure 8 to the 15mm height plate. The curves in these figures graphically demonstrate the evolution of eutectic content during solidification at different plate heights, based on quantitative data. These results provide critical insights for subsequent analysis.
To systematically investigate the eutectic distribution characteristics along the height direction of the casting, this study employed 10mm height plate castings as research objects. A transverse sectioning method was adopted to extract serial specimens perpendicular to the solidification direction, with quantitative metallographic analysis performed to determine the average γ/γ’ eutectic content at each height plane. As shown in Figure 9, the experimental data clearly reveal the nonlinear evolution of γ/γ’ eutectic content with solidification height.
3.1.3. Eutectic Distribution at Corner Regions of the 10mm Boss-Plate Junction
Figure 10 displays metallographic images of solidification microstructural features at corner regions of the 10mm boss-plate interface. As shown in Figure 10 (a), three designated sampling points were selected within the geometric transition zones of the plates, with their corresponding low-magnification metallographic microstructures presented in Figure 10(b)-(d). Systematic analysis of these images reveals that the γ/γ’ eutectic content in the corners is significantly reduced compared to adjacent regions. This phenomenon reflects the distinct thermal flow distribution and solute transport behavior during solidification in the corners, offering critical insights into how complex geometric configurations govern eutectic structure distribution.
3.2. Analysis of Experimental Results
3.2.1. Interpretation of γ/γ’ Eutectic Distribution Patterns
Figure 11 illustrates the distribution characteristics of γ/γ’ eutectic content in the as-cast microstructure along the solidification direction for three differently sized plates (5mm, 10mm, and 15mm). The results show that all specimens exhibit significant gradient variations in eutectic content as solidification progresses.
For the 5mm plate, the γ/γ’ eutectic fraction at the bottom (6.51%) is significantly lower than that at the top (19.83%), with the top content being 3.05 times that of the bottom. This difference reflects a terminal enrichment phenomenon at the final solidification stage. For the 10mm height plate, the eutectic contents at the bottom and top are measured as 6.22% and 20.88%, respectively, maintaining a consistent trend with the 5mm specimen. Notably, in the 15mm height plate, the bottom eutectic content drops to 4.74%, while the top remains as high as 20.50%, demonstrating an even steeper gradient. This distribution pattern may arise from the synergistic effects of dynamic solute redistribution at the solidification front and thermal gradients.
Figure 12 further verifies the regularity of γ/γ’ eutectic formation and distribution during solidification by comparing variation curves across different sampling positions. A stable transition zone in eutectic content is observed in the mid-regions of all castings. Specifically: the average γ/γ’ eutectic fraction in the central region of the 5mm boss is 11.76%. Corresponding values for the 10mm and 15mm bosses are 10.60% and 10.29%, respectively. For the 10mm boss-plate casting, the central region exhibits an average eutectic fraction of 11.52% along its full height.
3.2.2. Mechanism Discussion of γ/γ’ Eutectic Distribution Patterns
The findings above reveal the directional solidification characteristics of γ/γ’ eutectic in castings. The results demonstrate that the top regions of the each plate along the solidification direction exhibit significantly higher average size and volume fraction of γ/γ’ eutectic structures compared to the bottom regions, while the mid-regions display relatively uniform distributions. The spatiotemporal distribution of γ/γ’ eutectic structures is fundamentally a macroscopic manifestation of the dynamic equilibrium between solidification parameters (cooling rate, thermal gradients) and solute transport (diffusion, convection). Notably, in thick-section castings, prolonged melt persistence enhances long-range solute migration, leading to anomalous eutectic depletion at the bottom. This insight holds critical implications for optimizing directional solidification processes.
In the downward withdrawal directional solidification process (Figure 2(a)), the superalloy melt undergoes a counter-gravity solidification from bottom to top. In multicomponent alloy systems:High-density elements (e.g., Re, W) preferentially segregate to dendritic core regions.
Low-density elements (e.g., Al, Ti) accumulate in the interdendritic liquid phase.Buoyancy effects due to density differences drive the continuous upward migration of Al/Ti-enriched light liquid phases, which ultimately solidify at the upper surface of the casting. This results in a significantly increased γ/γ’ eutectic volume fraction in top regions and solute depletion-induced reduction in bottom regions, directly impacting microstructural homogeneity. Remarkably, the uniform eutectic distribution in the central region likely arises from a dynamic balance among solute diffusion rates, melt convection intensity, and solidification rates. In this equilibrium state, the upward flux of Al/Ti aligns spatially with the advancing solidification front, establishing a stable solute distribution field that promotes eutectic uniformity.
For corner regions of the boss, the metallographic images in Figure 10 highlight unique eutectic distribution characteristics. Quantitative analysis shows that the γ/γ’ eutectic volume fraction in corners (5.0 ± 1.0%) is drastically lower than in adjacent plate regions (11.0 ± 1.0%). This discrepancy stems from geometric abruptness, which disrupts local heat flow, increases cooling rates, and alters eutectic nucleation/growth kinetics. Additionally, alloy composition fluctuations and post-solidification heat treatment may further influence final microstructural morphology.
To elucidate the intrinsic physical mechanisms governing γ/γ’ eutectic distribution, this study will integrate numerical simulations to develop a multiphysics-coupled model incorporating temperature, solute, and flow fields. By simulating the spatiotemporal evolution of key parameters during directional solidification, the model will provide theoretical explaination and in-depth analysis of eutectic formation mechanisms.
4. Numerical Simulation of γ/γ’ Eutectic Evolution
4.1. Multiphysics-Coupled Modeling and Numerical Solution Strategy
4.1.1. Computational Model
Based on the physical essence of Bridgman directional solidification, a 3D transient multiphysics-coupled model was developed to analyze the synergistic evolution of temperature and solute fields in a 10mm boss-plate casting (Figure 13(a)), as an example. To balance computational accuracy and efficiency, simulations were conducted using a 1/10th-scale geometric model.
Figure 13(b) details the dimensions of the 10mm height plate casting. To systematically investigate geometric effects on solidification behavior, particularly at abrupt cross-sectional transitions, three platforms were designated as H1, H2, H3 (horizontal) and S1, S2, S3 (side), each featuring 15.0mm protrusions. This design simplifies the complexity of turbine blade geometries while retaining critical morphological features. The casting’s heating side adjoins the furnace wall, while the opposite side is defined as the shadow region.
4.1.2. Numerical Solution Strategy
Based on the fundamental principles of solidification theory, heat transfer, and mass transport, this study establishes a multiphysics-coupled mathematical model for the directional solidification process of castings. The model framework integrates energy conservation equations, Navier-Stokes equations, and solute diffusion equations, incorporating energy conservation constraints and solute partitioning boundary conditions at the solid-liquid interface to achieve precise mathematical characterization of dynamic solidification front evolution. During model development, the validated multiphase volume-averaged solidification model previously established[13,14] was adopted, with detailed theoretical foundations and numerical methodologies referenced therein.
The solution strategy employs a hybrid numerical framework independently developed by the research team[13,14], featuring three groundbreaking innovations:
(1) Multi-software collaborative architecture: a deep coupling system between ProCAST (temperature field solver) and ANSYS Fluent (flow-solute field analyzer) forms a cross-platform computational network covering multiphysical interactions.
(2) Precise latent heat treatment: an enhanced phase transition model based on the equivalent heat capacity method dynamically adjusts thermophysical parameters to accurately capture latent heat effects during solidification.
(3) Dynamic boundary mapping: an adaptive interpolation algorithm enables real-time transfer of temperature-flow boundary conditions, effectively addressing moving boundary coupling challenges.
The framework systematically investigates the influence mechanisms of convection and solidification shrinkage flow on the solute transport process by establishing a melt flow-solidification phase transformation interaction model, thereby revealing the regulatory laws of flow fields on solute segregation behavior and eutectic structure evolution.
4.2. Discussion and Analysis of Computational Results
4.2.1. Eutectic Distribution Characteristics in the Casting
Figure 14 presents the numerical simulation results of the eutectic phase (feut) distribution on the central cross-section of the casting. Figure 14(a) captures the morphology of the solidification front at time of 2092 s, while Figure 14(b) fully illustrates the spatial distribution pattern of the eutectic phase in the central cross-section after complete solidification. The numerical simulation results distinctly demonstrate the following features: a eutectic-rich layer with a thickness of approximately 1.5 mm is formed in the upper regions of the platform structures. With increasing casting height, enhanced eutectic accumulation occurs at elevated platform positions, suggesting a direct correlation between local solidification kinetics and eutectic phase formation.
present experimental-simulation comparative results of γ/γ’ eutectic distribution at different sampling locations within the 10mm plate. Figure 15 focuses on the directional distribution of eutectic phases at characteristic positions of the plate during solidification. Experimental measurements and simulation results exhibit strong quantitative agreement in the gradient trends of eutectic volume fraction. Figure 16 extends the analytical scope to the full height dimension of the specimen. Through systematic experimental-simulation comparisons, it is demonstrated that the numerical model can accurately reconstruct the three-dimensional spatial distribution characteristics of γ/γ’ eutectic in the casting, with prediction results showing excellent agreement with experimental measurements.Notably, the simulations not only successfully predict the spatial correspondence between eutectic-rich layers and depletion zones but also precisely capture characteristic concentration fluctuations in regions of geometric abruptness .
4.2.2. Eutectic Distribution Mechanism in the Plate Region of the Casting
During the solidification process of the casting, liquid flow is primarily driven by thermosolutal buoyancy. In the unsolidified molten metal, where solute concentration remains relatively uniform, convective flow is dominated by thermal buoyancy. However, within the mushy zone near the solidification front, solute segregation occurs during phase transformation. The interdendritic liquid enriched with elements such as Al and Ti (due to their lower density) tends to rise upward, triggering solute-driven convection. This convective flow promotes the accumulation of solute-rich liquid at the upper surfaces, ultimately forming a significant volume of γ/γ’ eutectic phases upon solidification.
The computational results of the solidification progress and solute convection phenomena in the boss S2 side casting are shown in Figure 17. When the solidification front advances to boss S2, the sequential solidification process is illustrated in Figure 17(a)-(c). Prior to the arrival of the solidification front at S2, although the melt in S2 was sufficiently undercooled, the actual solidification process did not initiate immediately. Instead, it commenced only when the solidification front reached the bottom of the boss. During solidification, when the solidification front encounters geometric variations such as boss S2, significant changes occur in heat transfer and solute diffusion behaviors within the melt. At the bottom of boss S2, due to the higher undercooling of the melt, solute diffusion rates may accelerate relatively, thereby reducing the inhibitory effect of the solute boundary layer on dendritic growth. Figure 19 further presents detailed metallographic images of dendritic growth at the bottom and sidewalls of boss S2. The images clearly reveal that as dendrites progressively develop into the S2 region, their secondary dendritic arms rapidly extend toward the left side.
During the initial stage of solidification front advancement into the S2 region, as shown in Figure 17(d), the solute convection phenomenon within boss S2 is primarily driven by thermal buoyancy effects induced by temperature gradients. As the casting solidification progresses, the enrichment of solute elements such as Al and Ti in interdendritic regions triggers localized density inversion, which drives upward solute flow within S2. In the magnified view of Figure 17(d), several short-lived plumes form near the solidification front. Solute-enriched liquid is transported upward along these plumes and accumulates at the top of the platform. With continued temperature decrease, the solute-rich liquid at the platform top solidifies into a eutectic layer.
4.2.3. Analysis of γ/γ’ Eutectic Distribution Patterns in Corner Regions
Figure 18 presents a comparative analysis of simulated eutectic distribution and metallographic experimental results at the corner of boss H1. As shown in Figure 18(a), the simulated eutectic content in the geometric transition zone of boss H1 is significantly lower than that in adjacent regions. Corresponding low-magnification metallographic micrographs (Figure 18(b)) visually characterize the microstructural features of this area. Systematic comparison between the simulation contour plots and metallographic images revealed a marked reduction in γ/γ’ eutectic content at the boss corner compared to neighboring zones. The simulation results exhibited strong agreement with experimental observations, validating the numerical model’s capability to accurately characterize eutectic distribution features under complex geometric configurations.
Figure19 presents the simulation results of solute convection during solidification front advancement to the corner region of boss H2. As shown in Figure 19(a), the interdendritic liquid concentration exhibits a gradient increase with mushy zone depth, contrasting with the convection pattern in the bulk liquid above. Within the mushy zone, significant downward feeding flow forms due to alloy solidification shrinkage effects. Figure 19(b) demonstrates that solute-rich interdendritic liquid is drawn to location A by this feeding flow, continuously increasing local liquid concentration and promoting eutectic structure growth. Conversely, at location B, the outflow of solute-enriched liquid and subsequent replenishment by near-initial-concentration (c0) liquid from above creates a solute-depleted zone. Furthermore, cross-sectional shrinkage effects above the platform exacerbate negative segregation in corner regions.
5. Conclusions
This study designed three different sizes of plate castings and conducted experimental investigations on the distribution patterns of γ/γ’ eutectic in single crystal plate castings of a novel 3rd generation nickel-based superalloy. The experimental results revealed significant eutectic aggregation in the upper regions of all three castings, while relatively fewer eutectic were observed in the lower sections. Additionally, the γ/γ’ eutectic in the central regions of the castings exhibited a more uniform distribution.
To better understand the solidification process, the solidification progression of a 10 mm boss plate was numerically simulated using a coupled approach integrating the commercial software ProCAST and ANSYS Fluent. Based on the simulation results, the distribution characteristics of eutectic structures were analyzed. The effects of liquid flow induced by thermosolutal buoyancy and solidification structure evolution on eutectic distribution were theoretically investigated, with particular emphasis on the variation of γ/γ’ eutectic volume fraction along the solidification direction.
Through numerical simulations, this study systematically examined how liquid flow driven by thermosolutal buoyancy and structural changes during solidification influences the distribution of γ/γ’ eutectic structures. The current simulation results demonstrated that thermosolutal buoyancy-driven convection transports solute-enriched liquid upward, providing critical theoretical insights for optimizing casting processes.
By comparatively analyzing the evolution of temperature fields, solute concentration fields, and flow fields under different solidification conditions, this research elucidated the synergistic effects of these factors on the formation and distribution of γ/γ’ eutectic structures. The results indicated that the temperature gradient gradually decreases during solidification, while the solute concentration gradient becomes increasingly complex due to solute redistribution. This intricate interaction between concentration and temperature gradients induces diverse liquid flow patterns, ultimately affecting the final morphology and distribution of eutectic structures.
To visualize these mechanisms, the study employed visualization techniques to superimpose simulated temperature, concentration, and flow fields. This approach clearly revealed how solute-rich liquid, driven by thermosolutal buoyancy, migrates upward along specific pathways to form eutectic aggregation in upper casting regions. Conversely, weaker fluid flow in lower regions resulted in sparser and more scattered eutectic distributions.
In summary, this research combines experimental and simulation methods to investigate the distribution patterns and influencing factors of γ/γ’ eutectic structures in single-crystal plate castings of a third-generation nickel-based superalloy. The findings not only provide crucial theoretical support for understanding solidification processes in superalloy castings but also offer valuable references for optimizing casting processes and improving product quality.
Author Contributions
X.L.: conceptualization, methodology, software, data curation, investigation, visualization, writing—original draft preparation; A.L.: investigation, data curation; H.Z.: methodology, formal analysis; D.M.: writing—review & editing, supervision; M.S.: writing—review & editing, supervision; M.W.:writing—review & editing, supervision; J.G.: methodology, investigation, writing—review & editing, funding acquisition, supervision, project administration. All authors have read and agreed to the published version of the manuscript.
Funding
This work was supported by the Key-Area Research and Development Program of GuangDong Province, China (Nos.2019B010935001).
Institutional Review Board Statement
Not applicable.
Informed Consent Statement
Not applicable.
Data Availability Statement
The original contributions presented in the study are included in the article, further inquiries can be directed to the corresponding authors.
Conflicts of Interest
The authors declare no conflicts of interest.
References
- Zhang, J.; Wang, L.; Xie, G.; Wang, D.; Shen, J.; Lu, Y.Z.; Huang, Y.Q.; Li, Y.W. Recent advances in Ni-based single crystal superalloys. Acta Metall Sin 2023, 59, 1109–1124. [Google Scholar] [CrossRef]
- Ma, D.X. New developments in single crystal solidification technology for superalloy blades. Acta Metall Sin 2015, 51, 1179–1190. [Google Scholar]
- Liu, L. Progress in precision casting technology for superalloys. Foundry 2012, 61, 1273–1285. [Google Scholar] [CrossRef]
- Fuchs, G.E. Solution heat treatment response of a third generation single crystal Ni-base superalloy. Materials Science and Engineering A 2001, 52–60. [Google Scholar] [CrossRef]
- Seo, S.M.; Jeong, H.W.; Ahn, Y.K.; Yun, D.W.; Lee, J.H.; Yoo, Y.S. . A comparative study of quantitative microsegregation analyses performed during the solidification of the Ni-base superalloy CMSX-10. Materials Characterization 2014, 43–55. [CrossRef]
- Seo, S.M.; Lee, J.H.; Yoo, Y.S.; Jo, C.Y.; Miyahara, H.; Ogi, K. A Comparative Study of the γ/γ′ Eutectic Evolution During the Solidification of Ni-Base Superalloys. Metallurgical and Materials Transactions A 2011, 3150–3159. [Google Scholar] [CrossRef]
- Ai, C.; Li, Q.; Chen, X.; Guo, M.; Huang, T.W.; Liu, L. Research progress on γ/γ′ elemental partitioning behavior in Ni-based single crystal superalloys. Chin J Nonferrous Met 2022, 32, 3694–3705. [Google Scholar]
- Brewster, G.; Dong, H.B.; Green, N.R.; D’Souza, N. Surface Segregation during Directional Solidification of Ni-Base Superalloys. Metallurgical and Materials Transactions B 2008, 87–93. [Google Scholar] [CrossRef]
- Cao, L.; Yao, L.; Zhou, Y.Z; Jin, T.; Sun, X.F. Formation of the Surface Eutectic of a Ni-based Single Crystal Superalloy. Journal of Materials Science & Technology 2017, 347–351. [CrossRef]
- Cao, L.; Zhou, Y.Z.; Jin, T.; Sun, X.F. Effects of Re on surface eutectic formation for Ni-base single crystal superalloys during directional solidification. Journal of Materials Science & Technology 2017, 1308–1313. [CrossRef]
- Ma, D.X.; Zhao, Y.X.; Xu, W.T.; Pi, L.B.; Li, Z.X. Surface effects on eutectic distribution in single crystal superalloy castings. Acta Metall Sin 2021, 57, 1539–1548. [Google Scholar]
- Ma, D.X.; Zhao, Y.X.; Wei, J.H; Pi, L.B. Analysis of eutectic upward aggregation phenomenon in single crystal superalloy blade castings. Foundry 2021, 70, 1302–1306. [Google Scholar] [CrossRef]
- Zhang, H.J.; Liu, X.S.; Ma, D.X.; Ludwig, A.; Kharicha, A.; Wu, M.H. Potential eutectic accumulation in single crystal turbine blade due to geometry effect: a numerical study. IOP Conference Series: Materials Science and Engineering,Volume 1274, 6th International Conference on Advances in Solidification Processes (ICASP-6) 19/06/2022 - 24/06/2022 Le Bischenberg, France.
- Zhang, H.J.; Liu, X.S.; Ma, D.X.; Song, M.; Ludwig, A.; Kharicha, A.; Wu, M.H. Digital twin for directional solidification of a single-crystal turbine blade. Acta Materialia 2023, 244, 118579. [Google Scholar] [CrossRef]
Figure 1.
Geometrically graded plate castings with different platform features: (a) 5mm-height boss configuration, (b) 10mm-height boss configuration, (c) 15mm-height boss configuration, (d) Cross-sectional thickness comparison,(e)Representative of the single-crystal blade.
Figure 1.
Geometrically graded plate castings with different platform features: (a) 5mm-height boss configuration, (b) 10mm-height boss configuration, (c) 15mm-height boss configuration, (d) Cross-sectional thickness comparison,(e)Representative of the single-crystal blade.
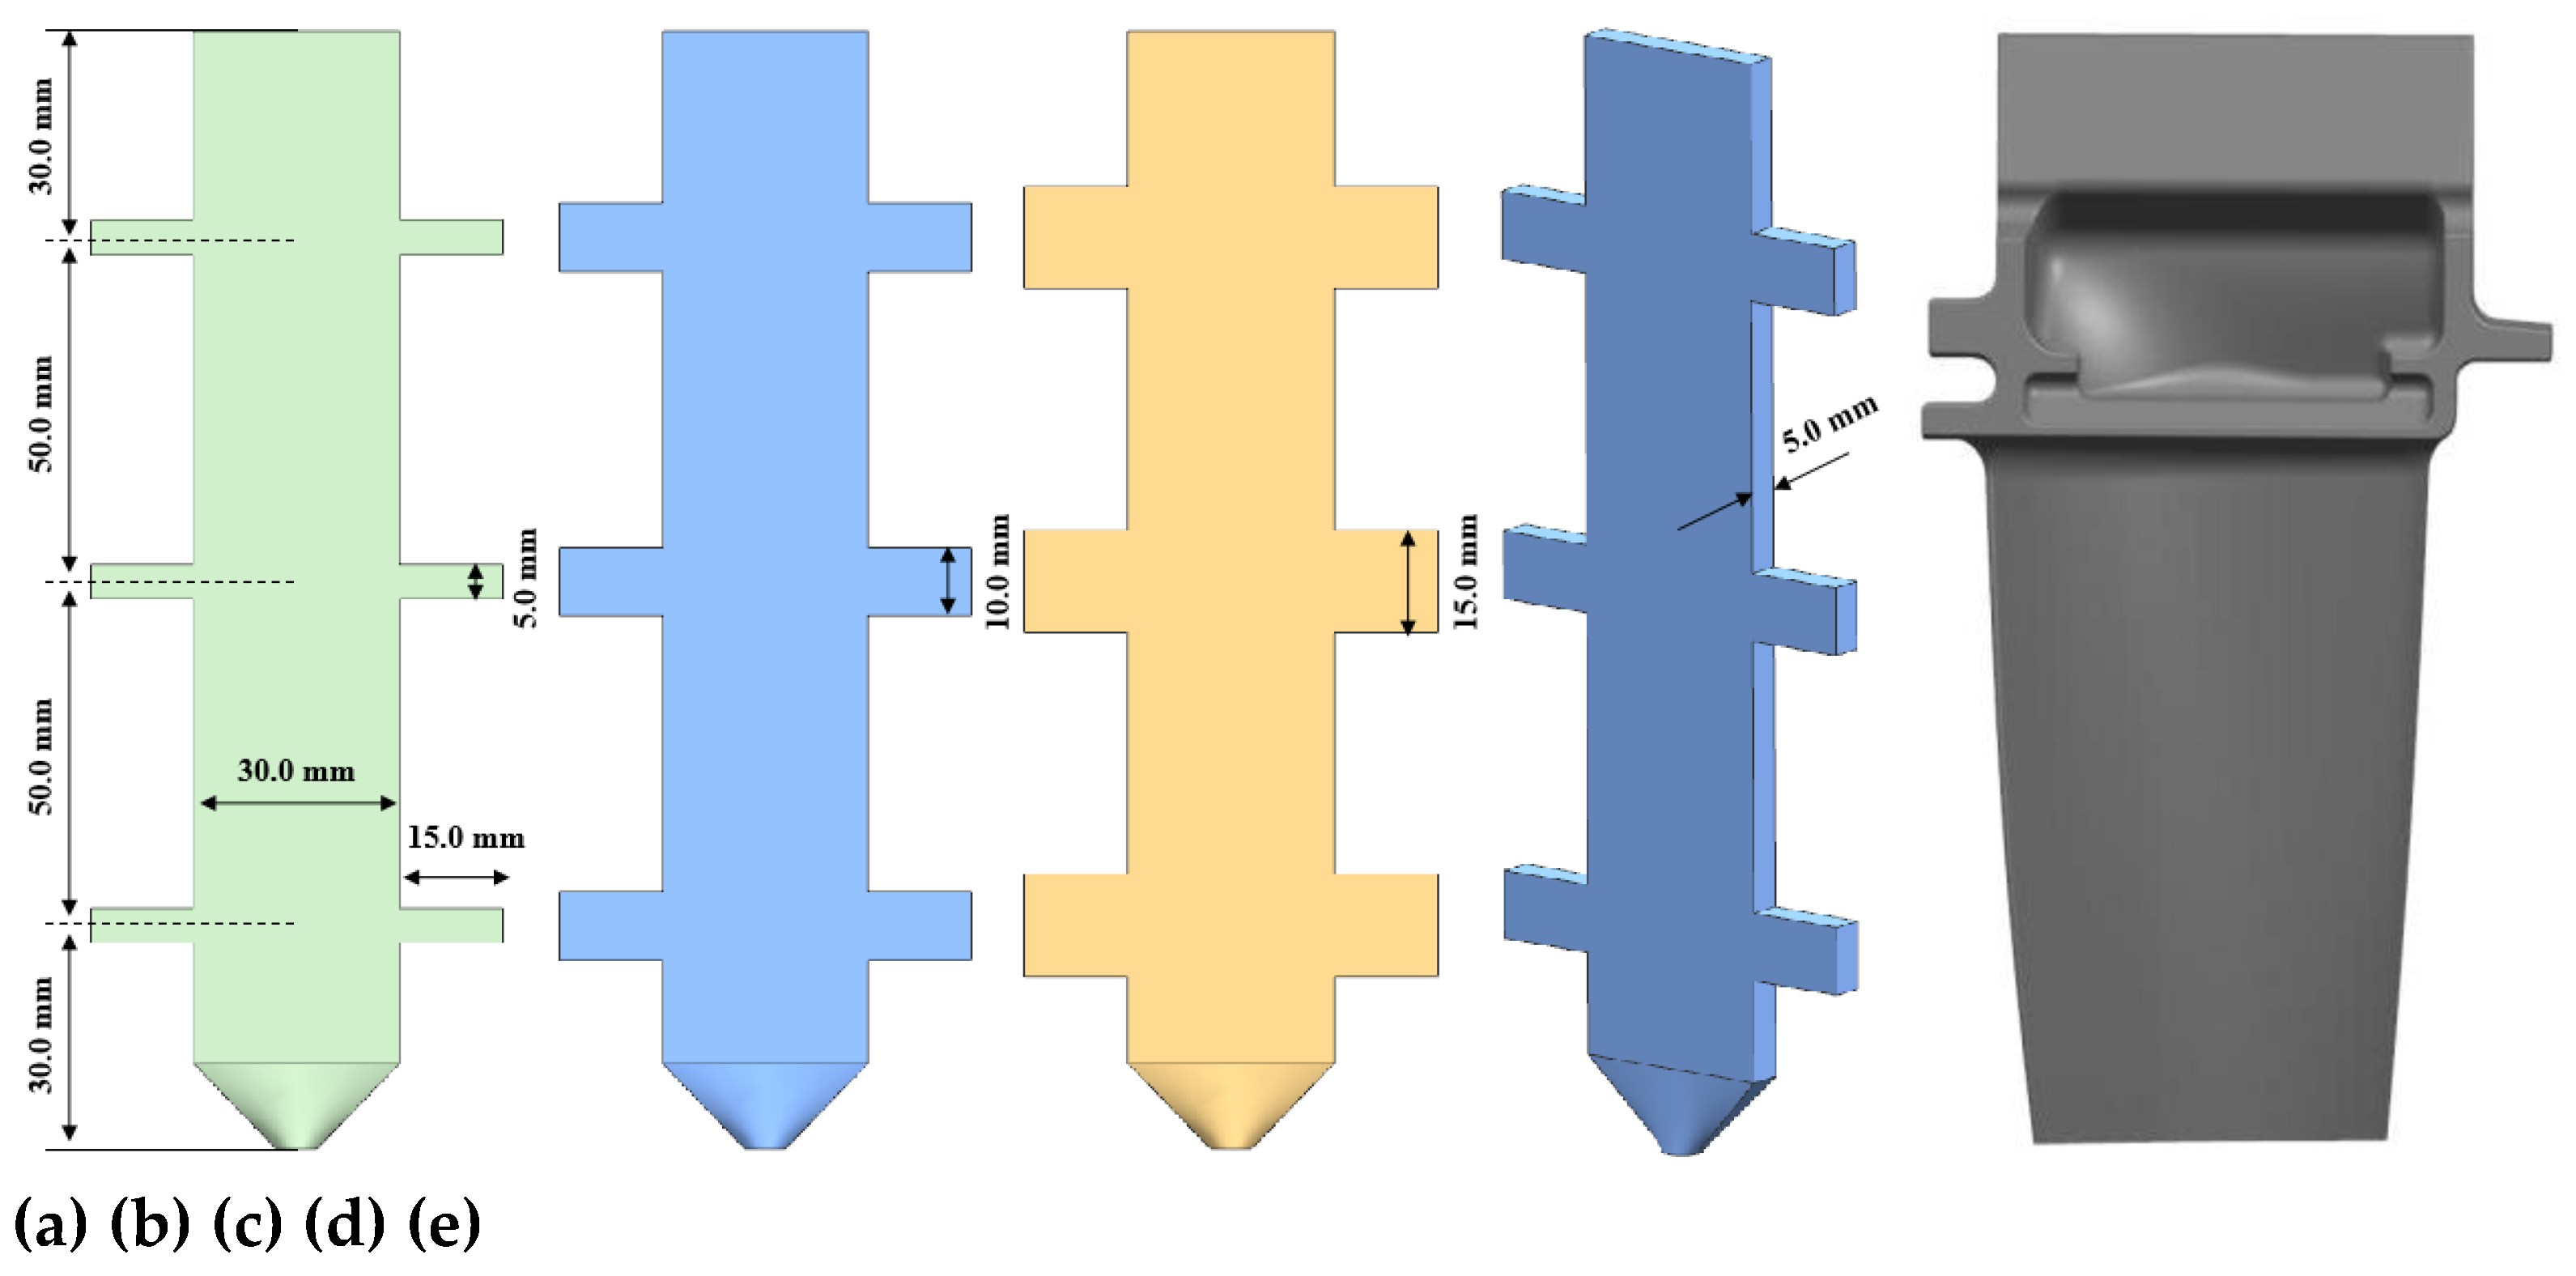
Figure 2.
Bridgman furnace thermal zoning and as-cast specimens: (a) Casting configuration; (b) Three geometrically graded single-crystal plates.
Figure 2.
Bridgman furnace thermal zoning and as-cast specimens: (a) Casting configuration; (b) Three geometrically graded single-crystal plates.
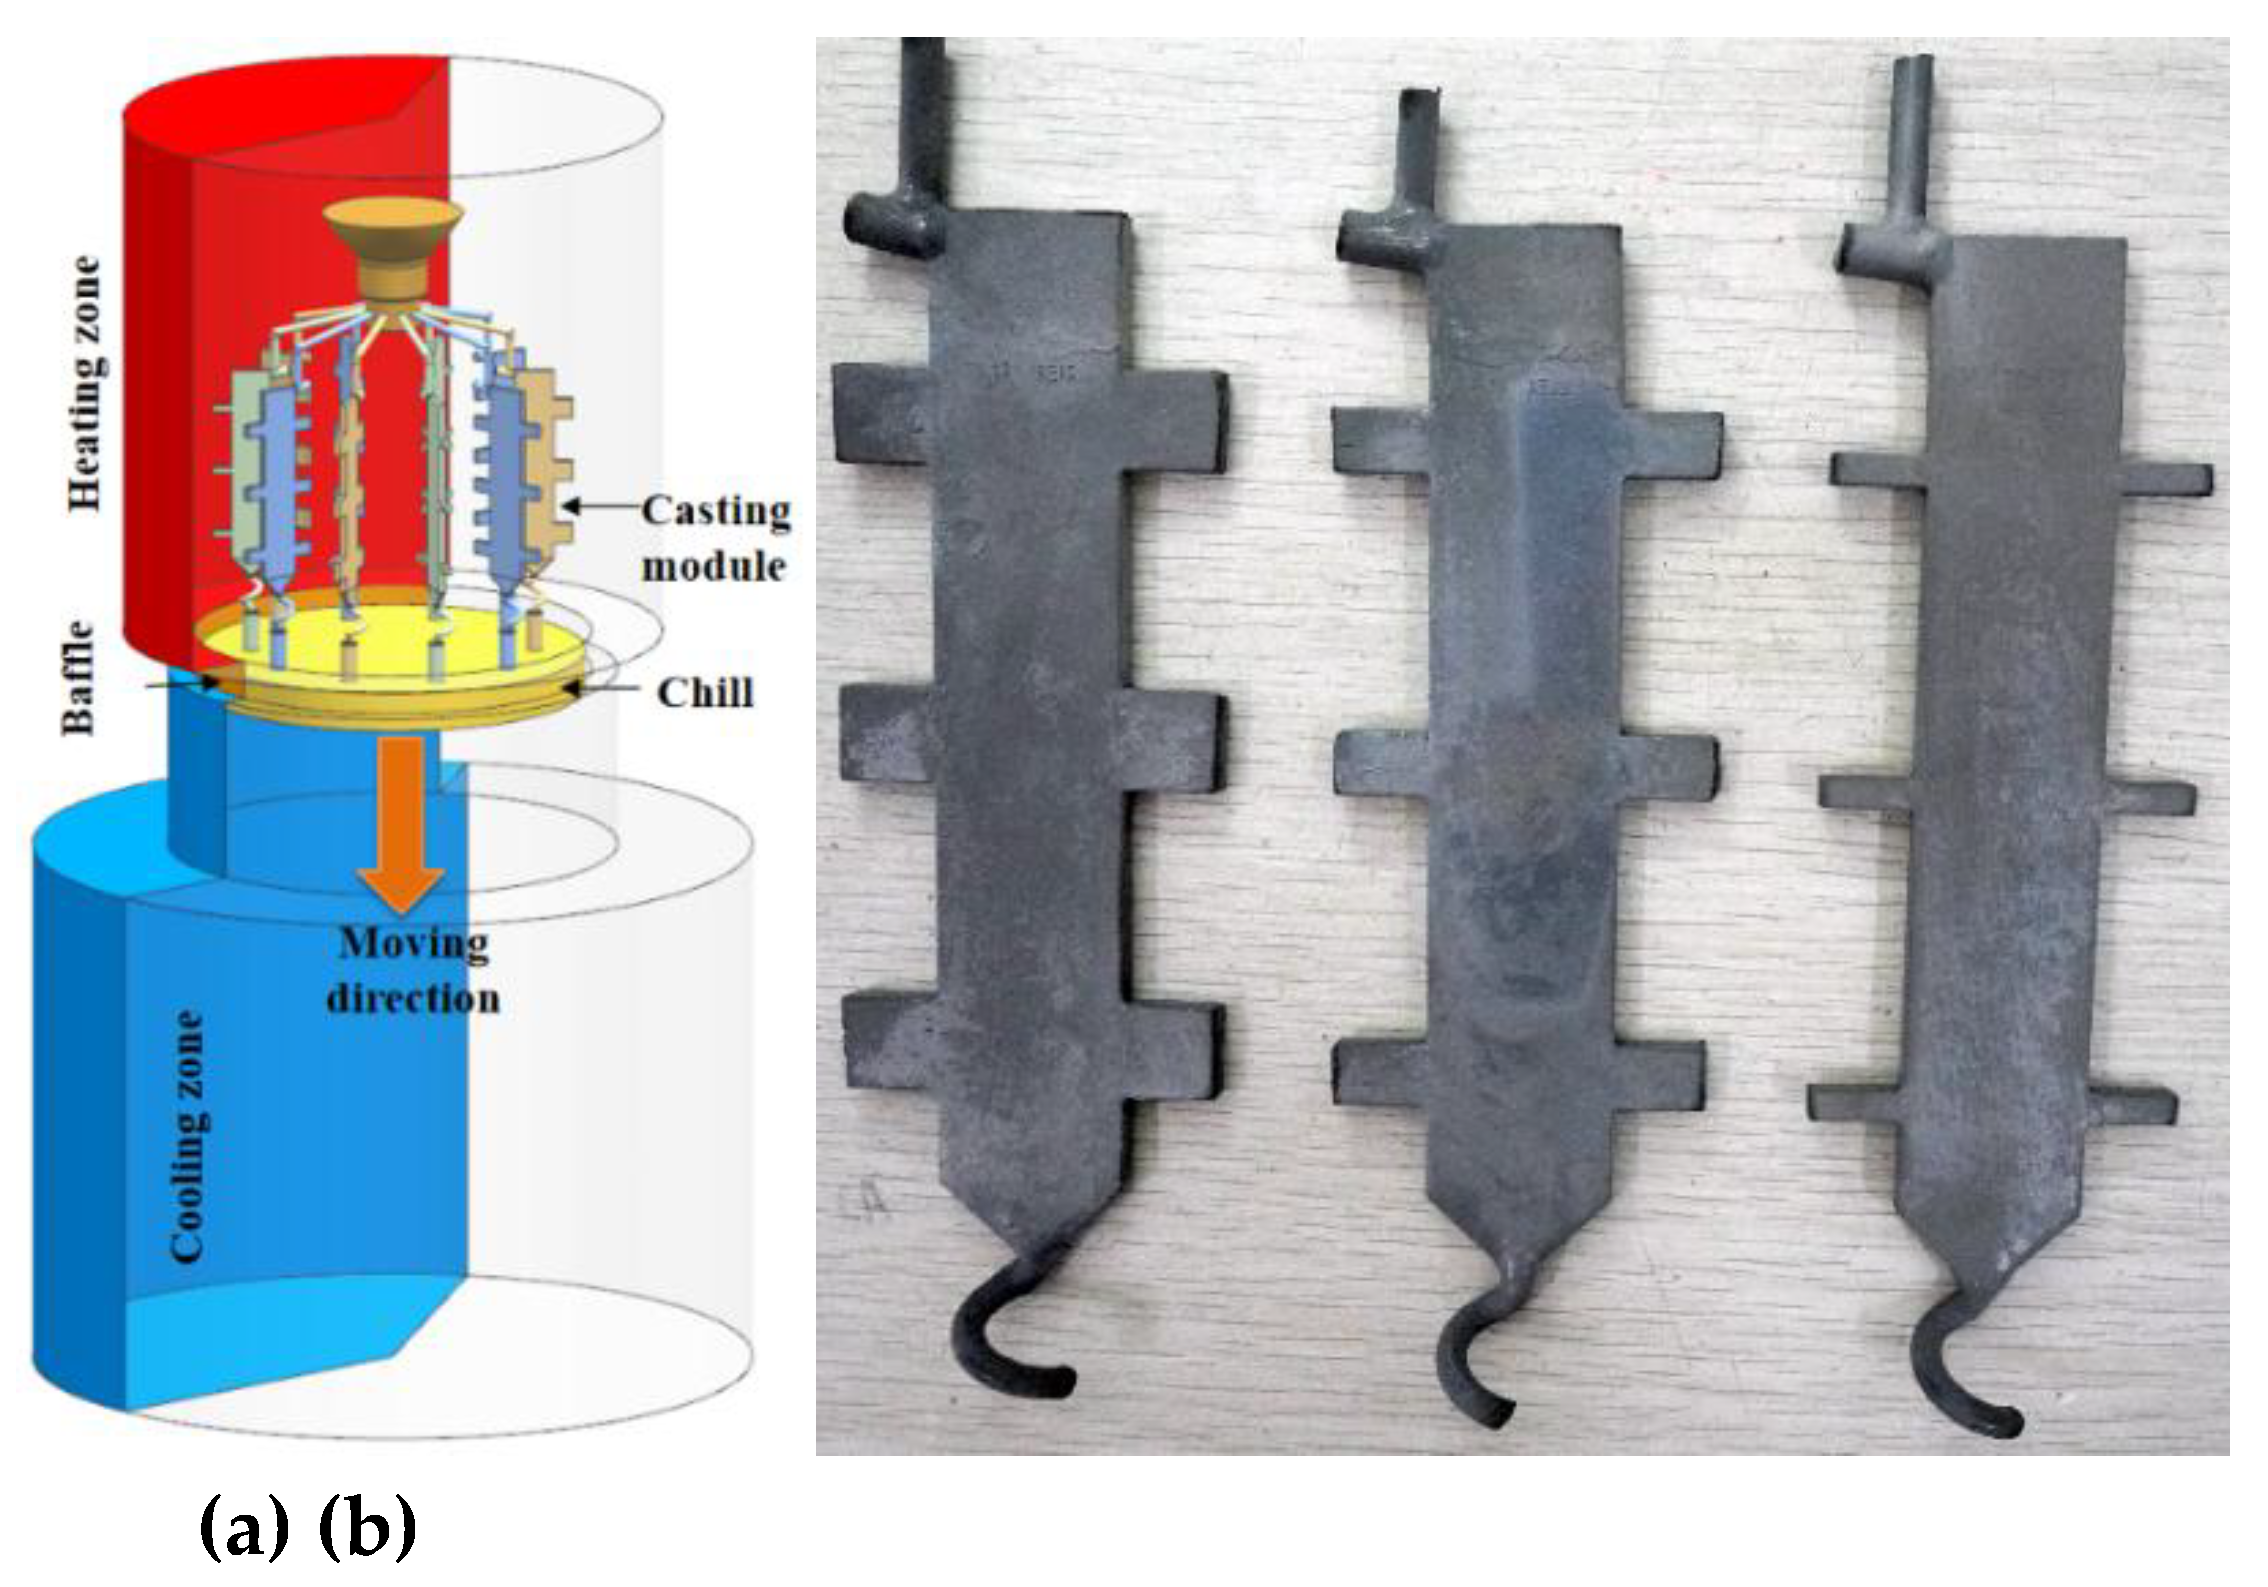
Figure 3.
Specimen sampling protocol: (a) Schematic sampling locations, (b) Mid-span cross-section extraction, (c) Prepared metallographic samples.
Figure 3.
Specimen sampling protocol: (a) Schematic sampling locations, (b) Mid-span cross-section extraction, (c) Prepared metallographic samples.

Figure 4.
Specimen sampling protocol: (a) Schematic sampling locations, (b) Mid-span cross-section extraction, (c) Prepared metallographic samples.
Figure 4.
Specimen sampling protocol: (a) Schematic sampling locations, (b) Mid-span cross-section extraction, (c) Prepared metallographic samples.
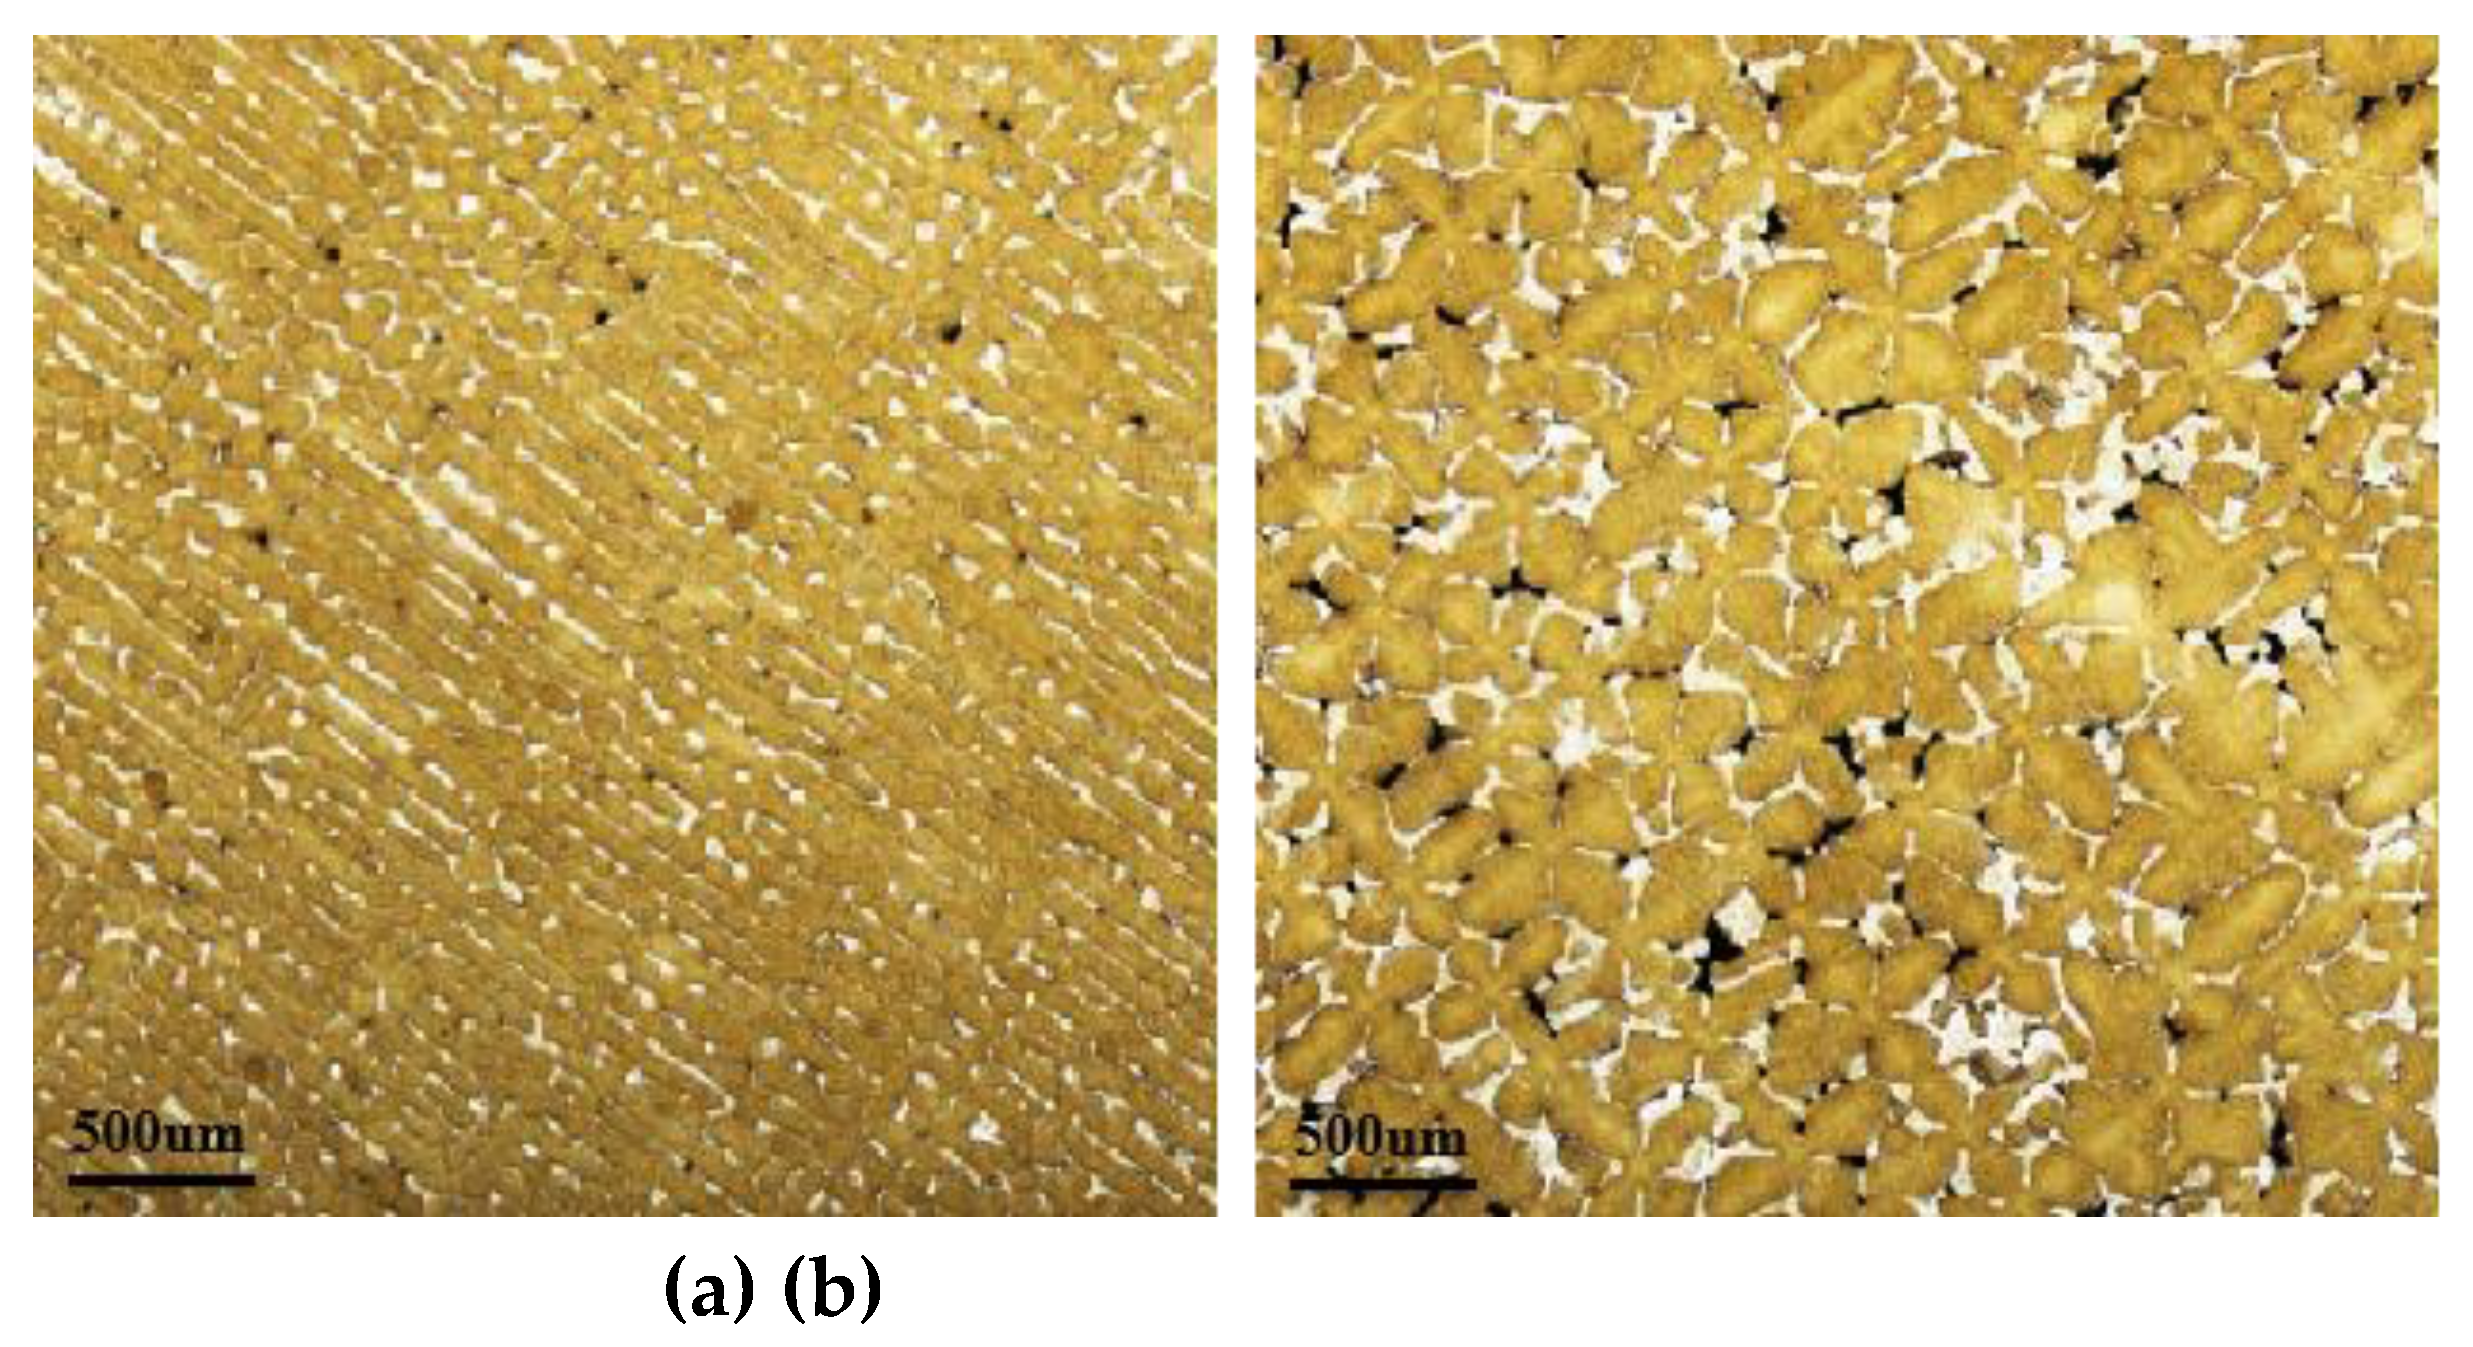
Figure 5.
Metallographic images of as-cast microstructure along the solidification direction at sampling positions of three differently sized platforms:(a) 5mm, (b) 10mm, (c) 15mm.
Figure 5.
Metallographic images of as-cast microstructure along the solidification direction at sampling positions of three differently sized platforms:(a) 5mm, (b) 10mm, (c) 15mm.
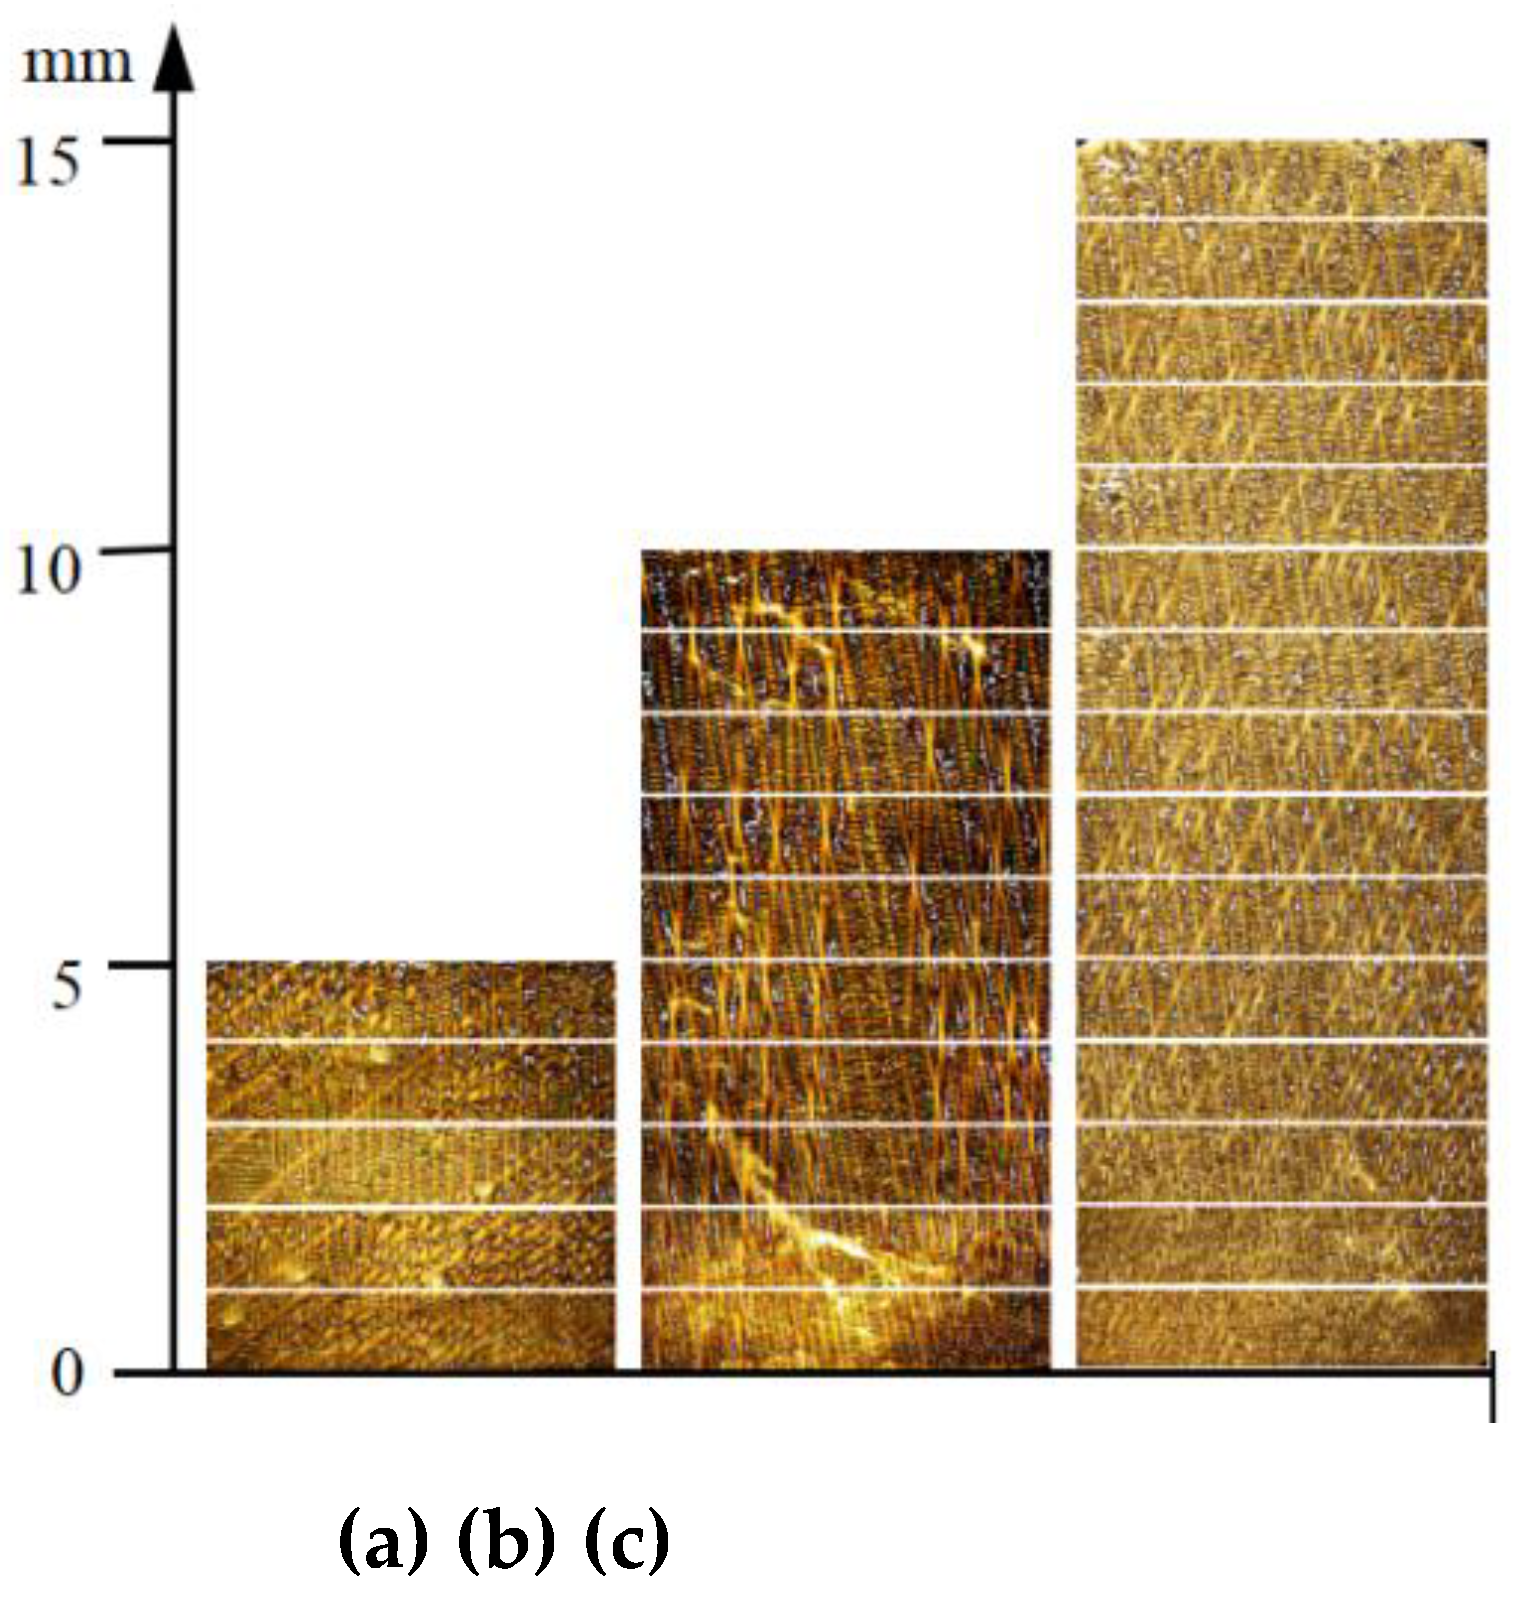
Figure 6.
γ/γ’ eutectic content along the solidification direction of the 5mm height plate.
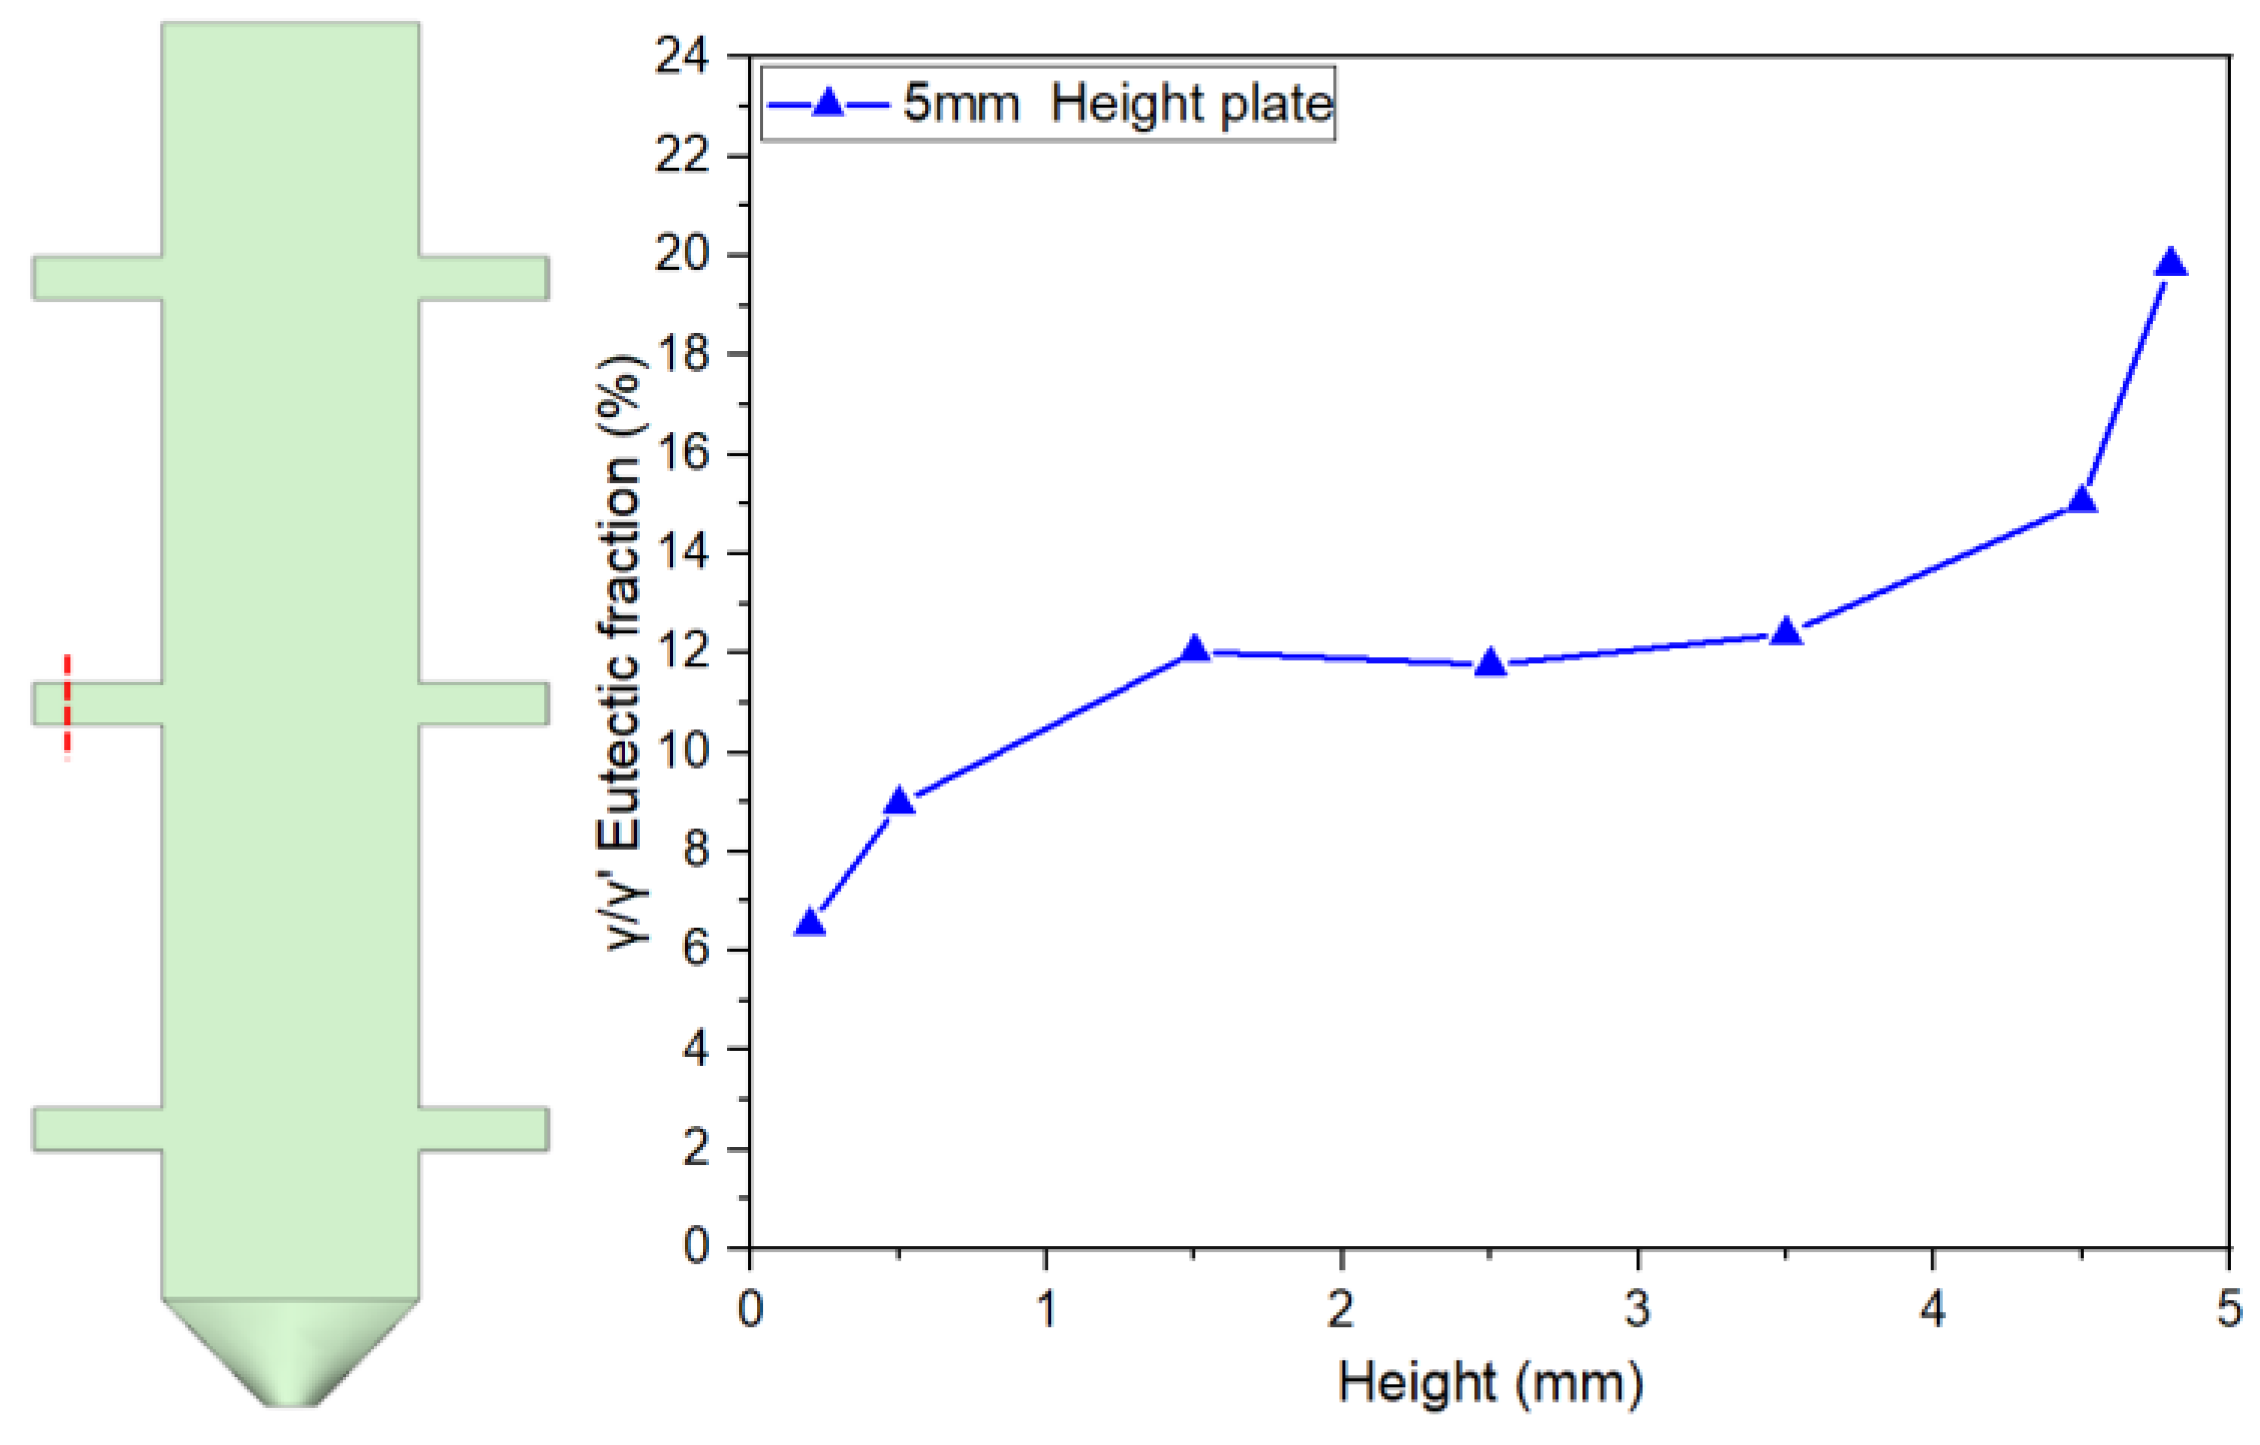
Figure 7.
γ/γ’ eutectic content along the solidification direction of the 10mm height plate.
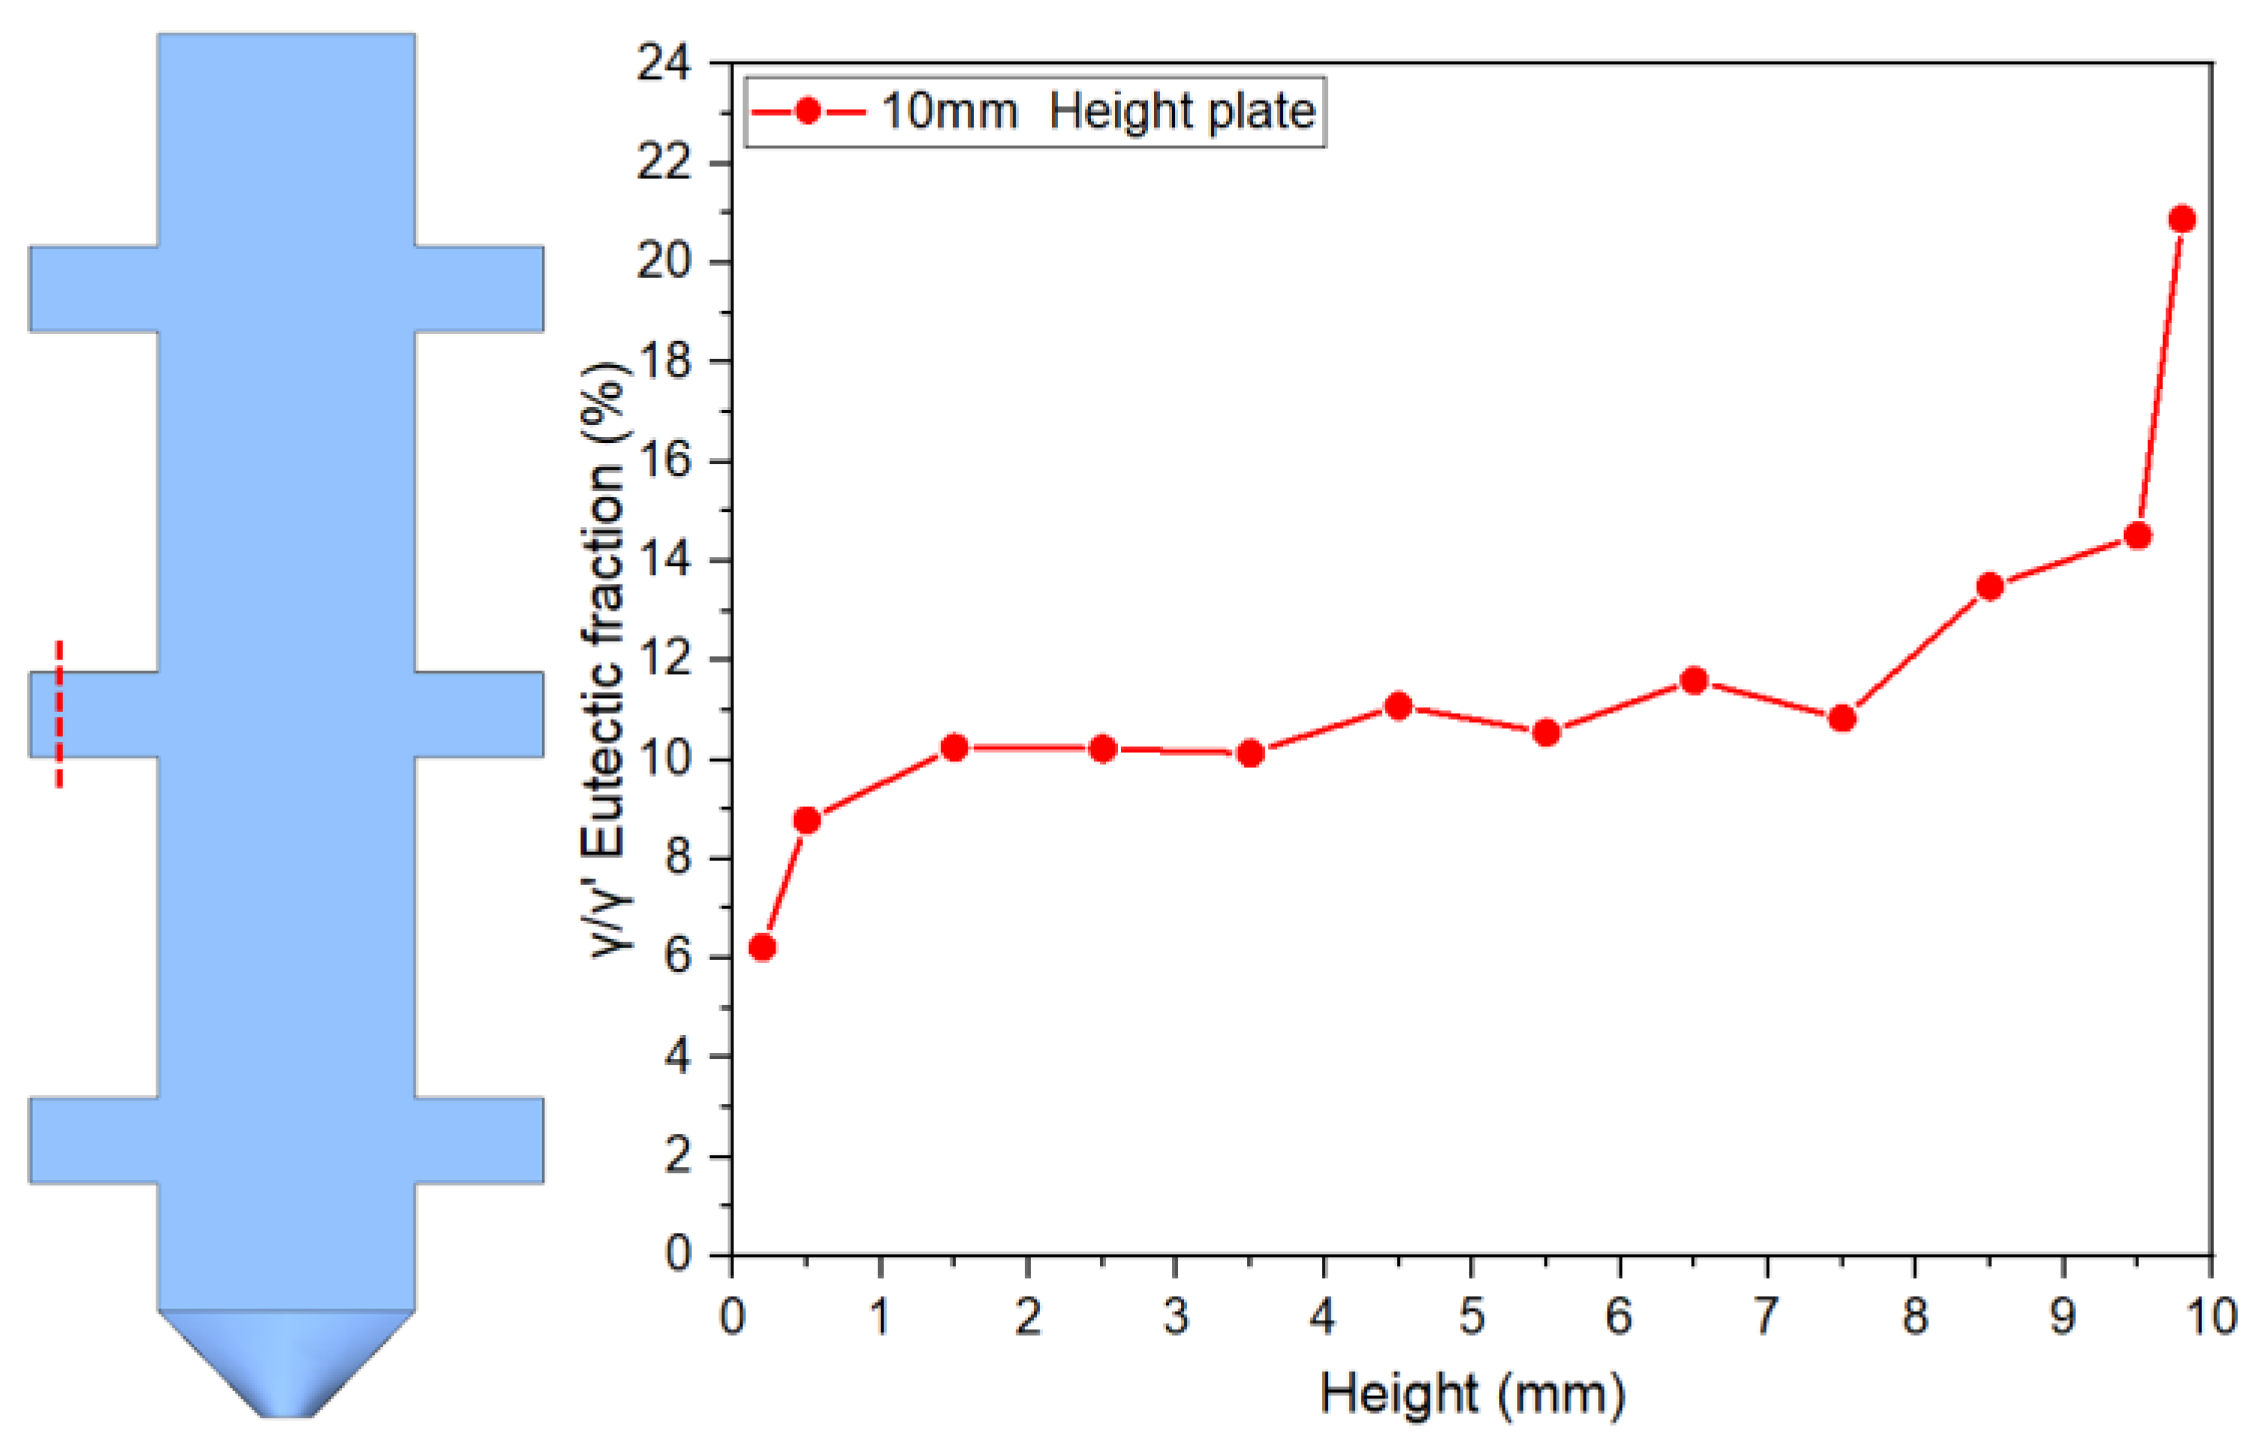
Figure 8.
γ/γ’ eutectic content along the solidification direction of the 15mm height plate.
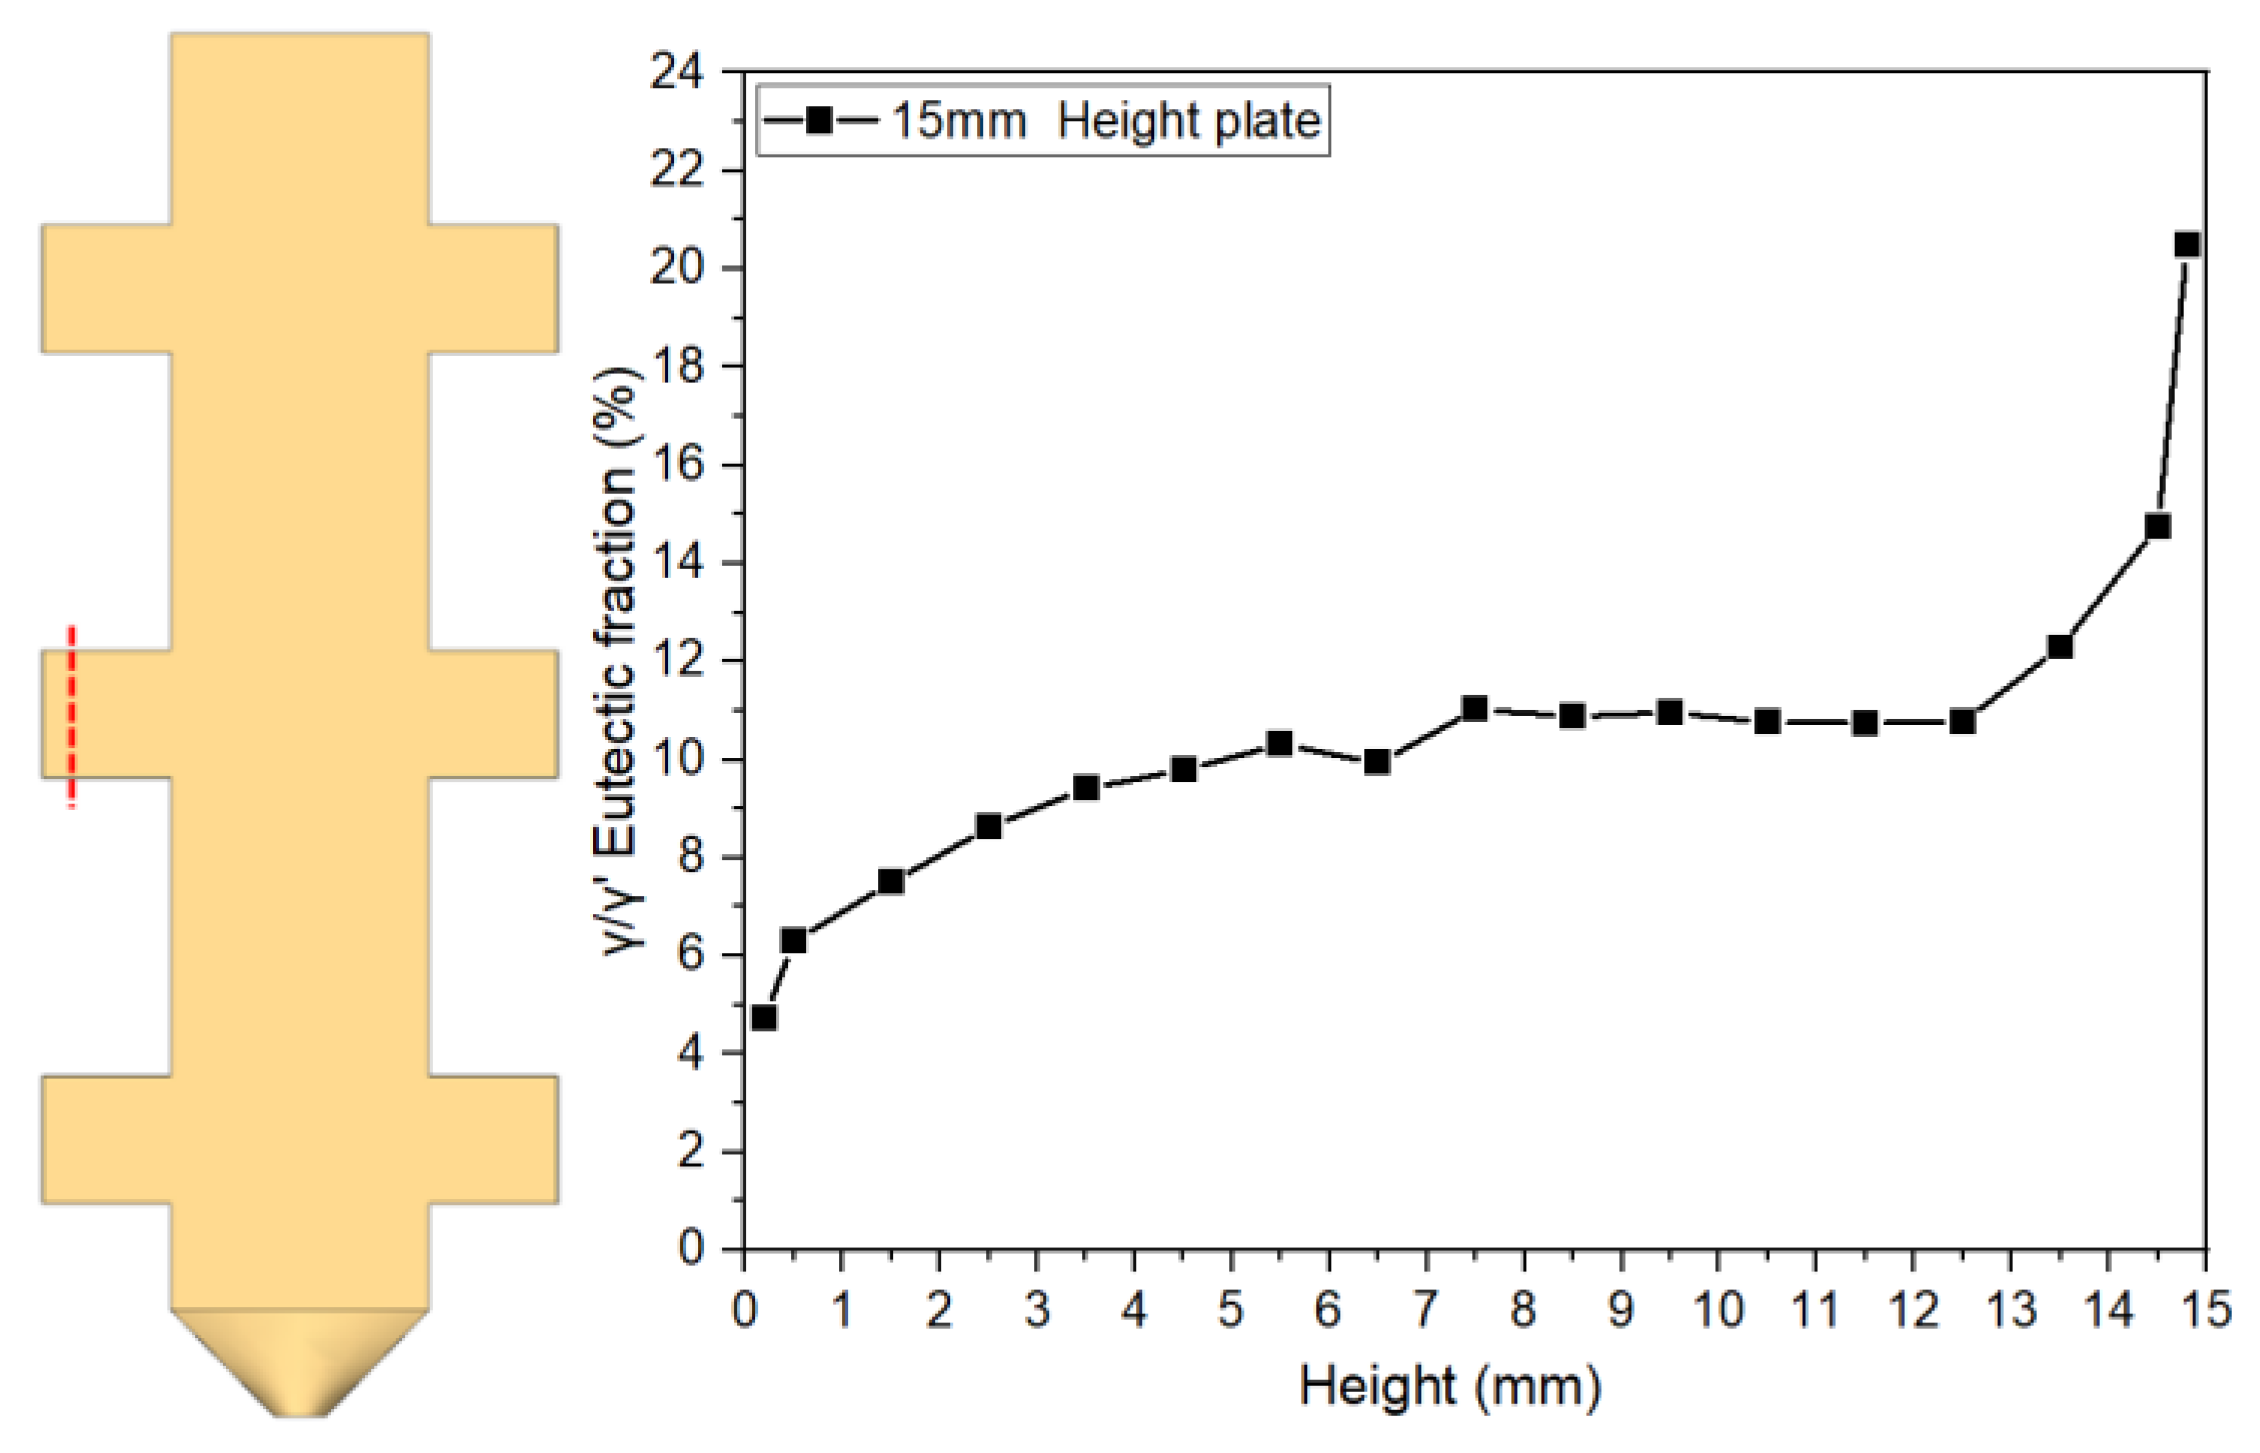
Figure 9.
γ/γ’ eutectic content along the solidification direction at the transverse section sampling position of the 10mm height plate.
Figure 9.
γ/γ’ eutectic content along the solidification direction at the transverse section sampling position of the 10mm height plate.
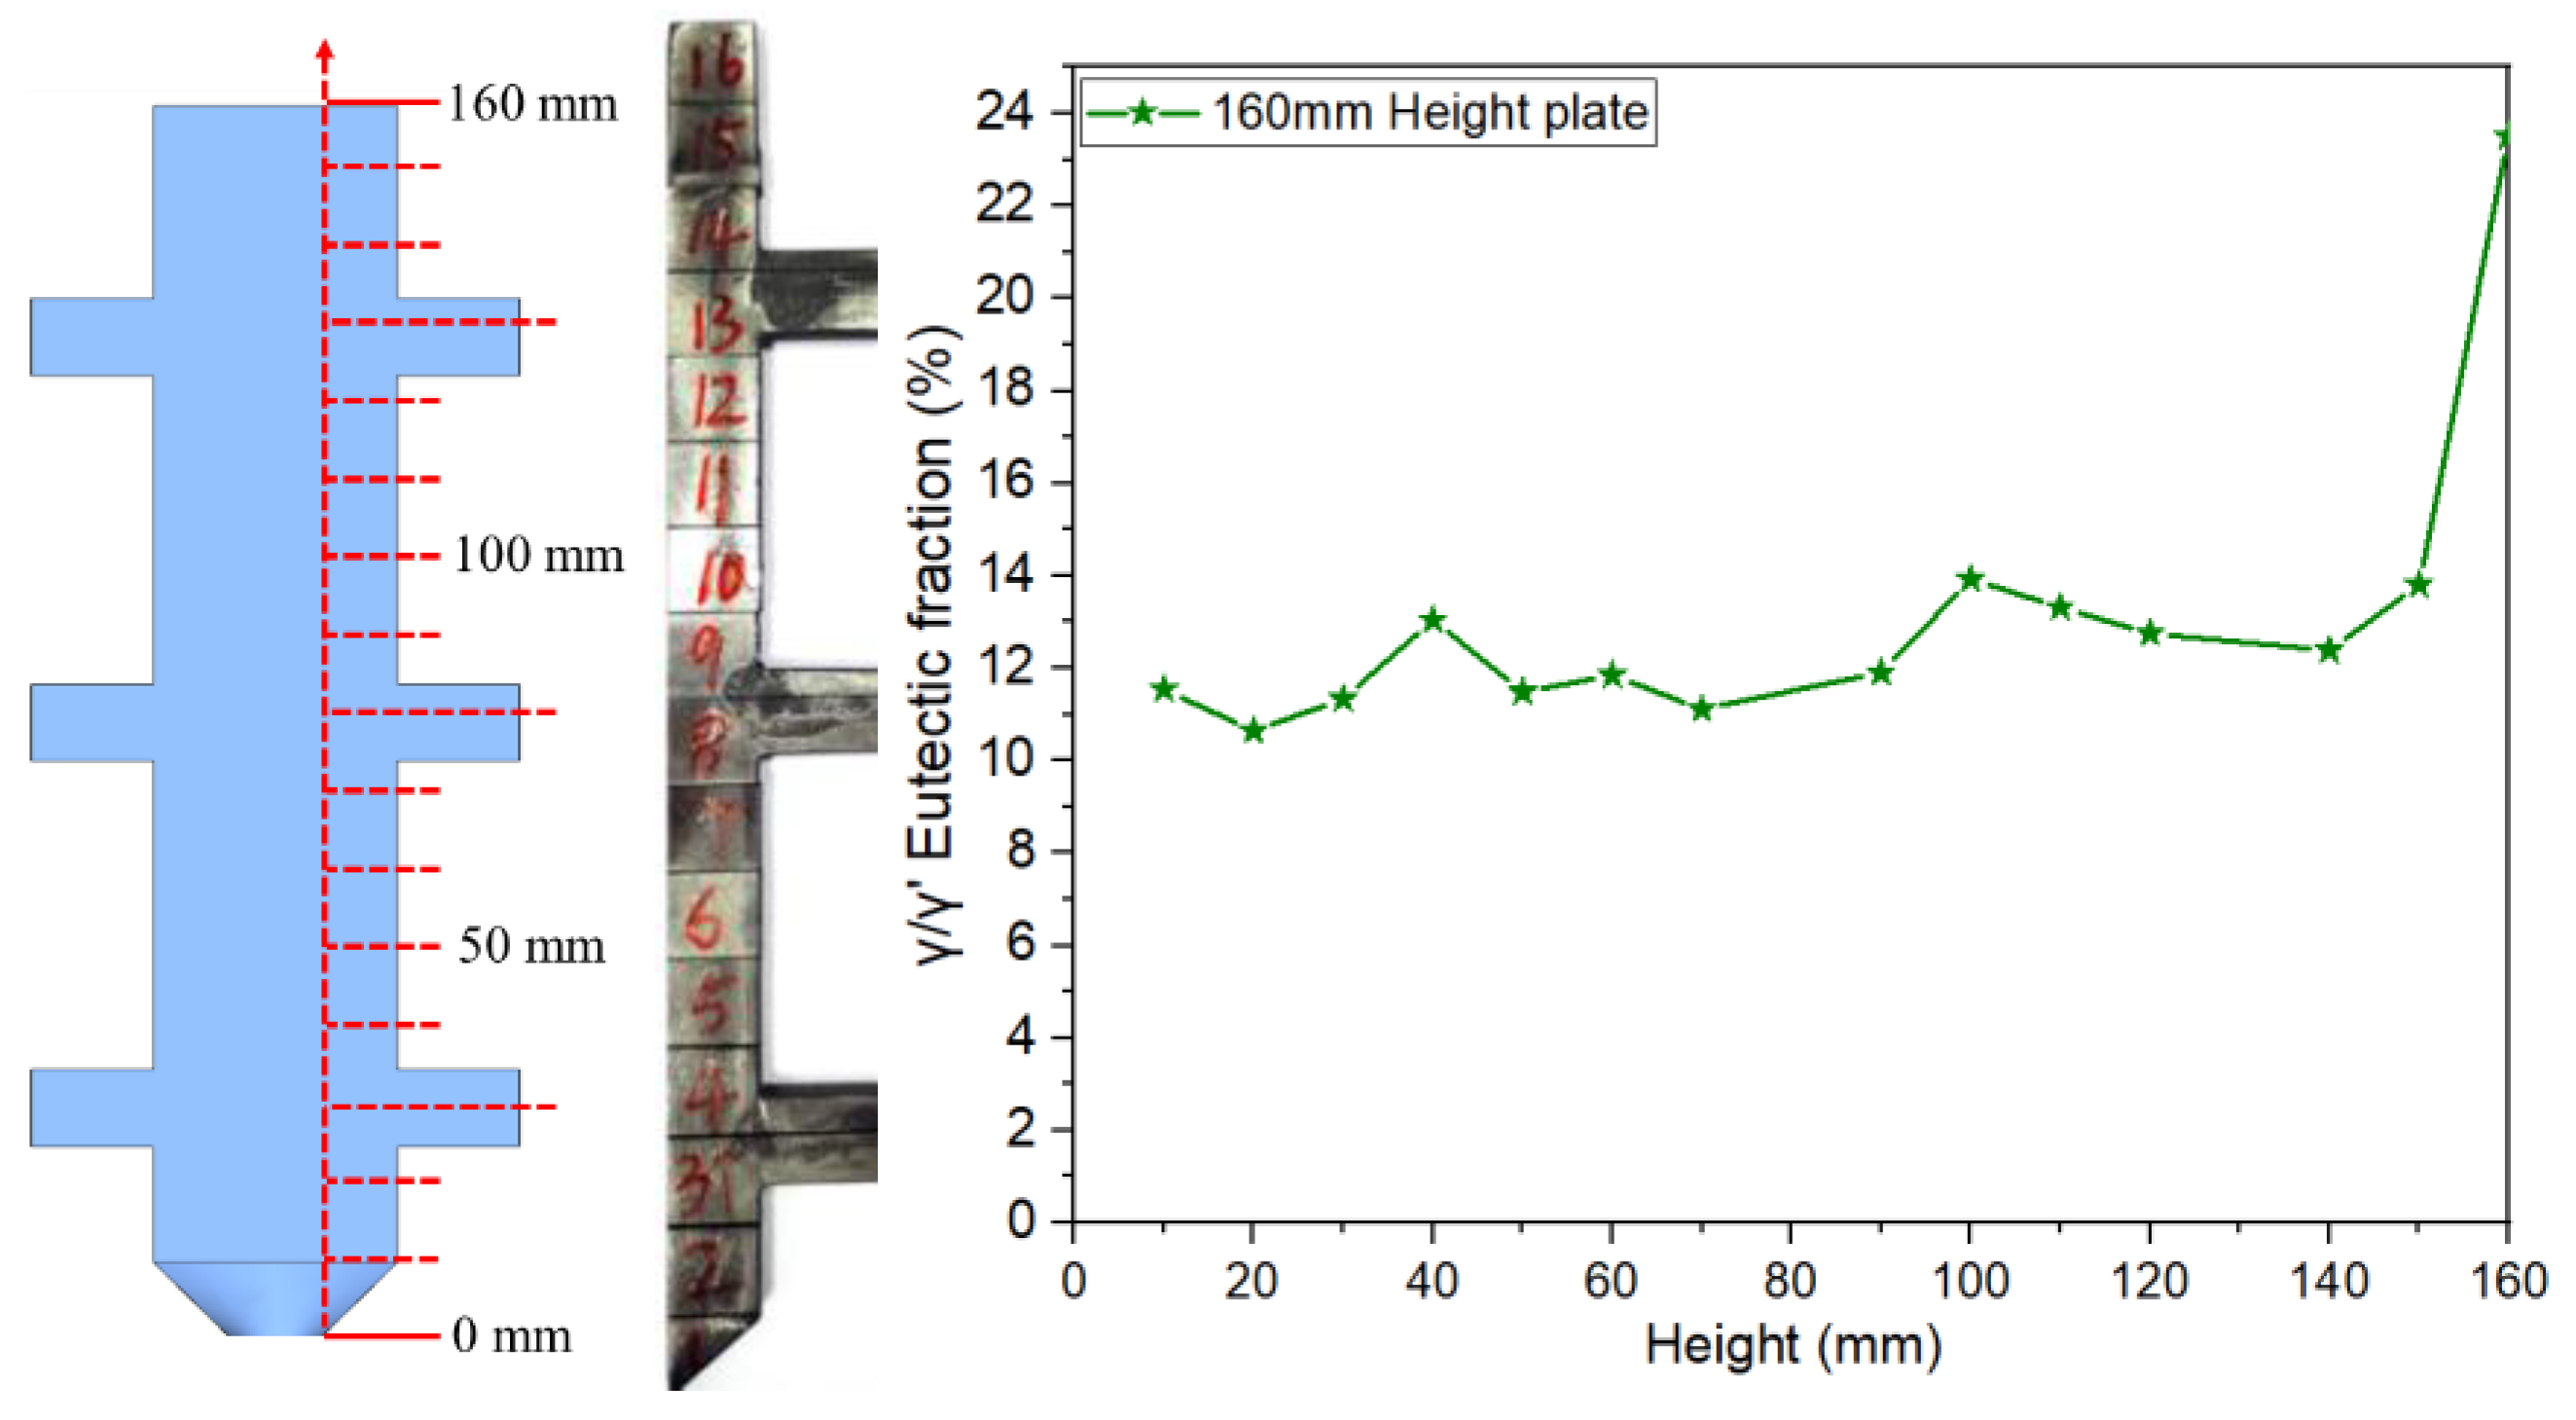
Figure 10.
Metallographic images of sampling positions at three corners of the 10mm height plate junction:(a) Metallographic sampling positions, (b) Metallographic image of Area A, (c) Metallographic image of Area B, (d )Metallographic image of Area C.
Figure 10.
Metallographic images of sampling positions at three corners of the 10mm height plate junction:(a) Metallographic sampling positions, (b) Metallographic image of Area A, (c) Metallographic image of Area B, (d )Metallographic image of Area C.
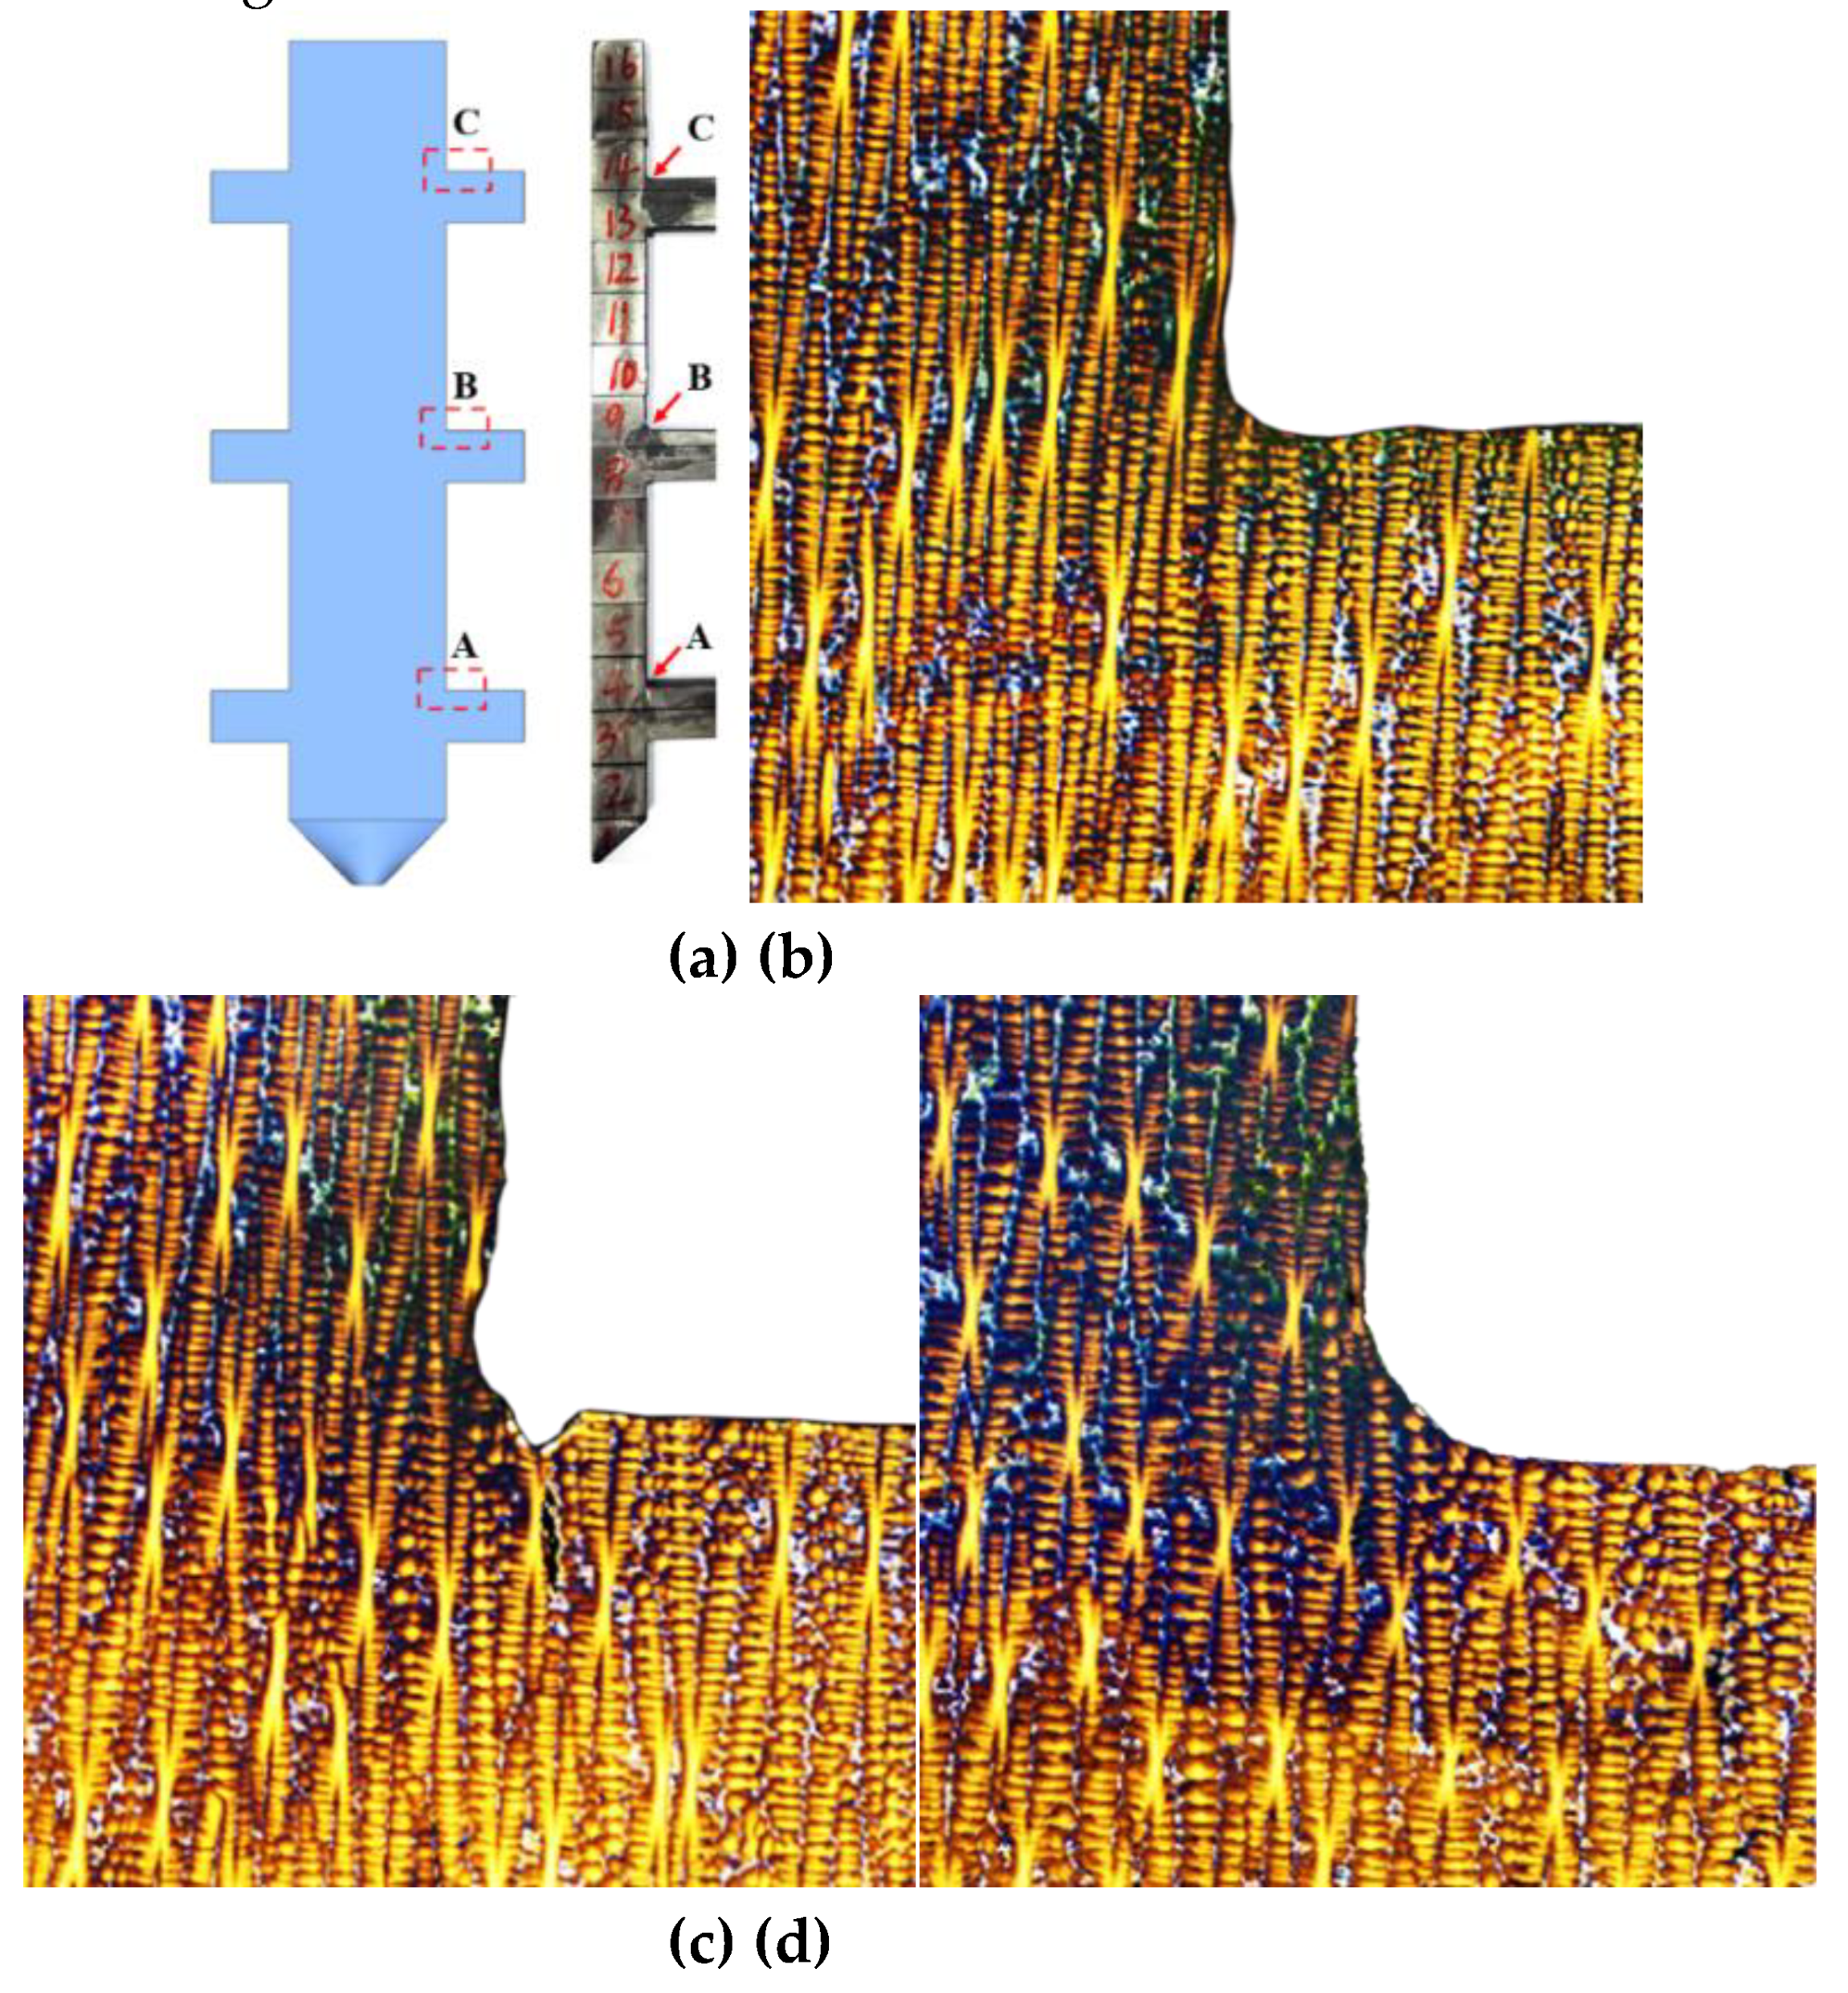
Figure 11.
Comparison of γ/γ’ eutectic content variation curves in the as-cast microstructure along the solidification direction at sampling positions of three differently sized platforms.
Figure 11.
Comparison of γ/γ’ eutectic content variation curves in the as-cast microstructure along the solidification direction at sampling positions of three differently sized platforms.
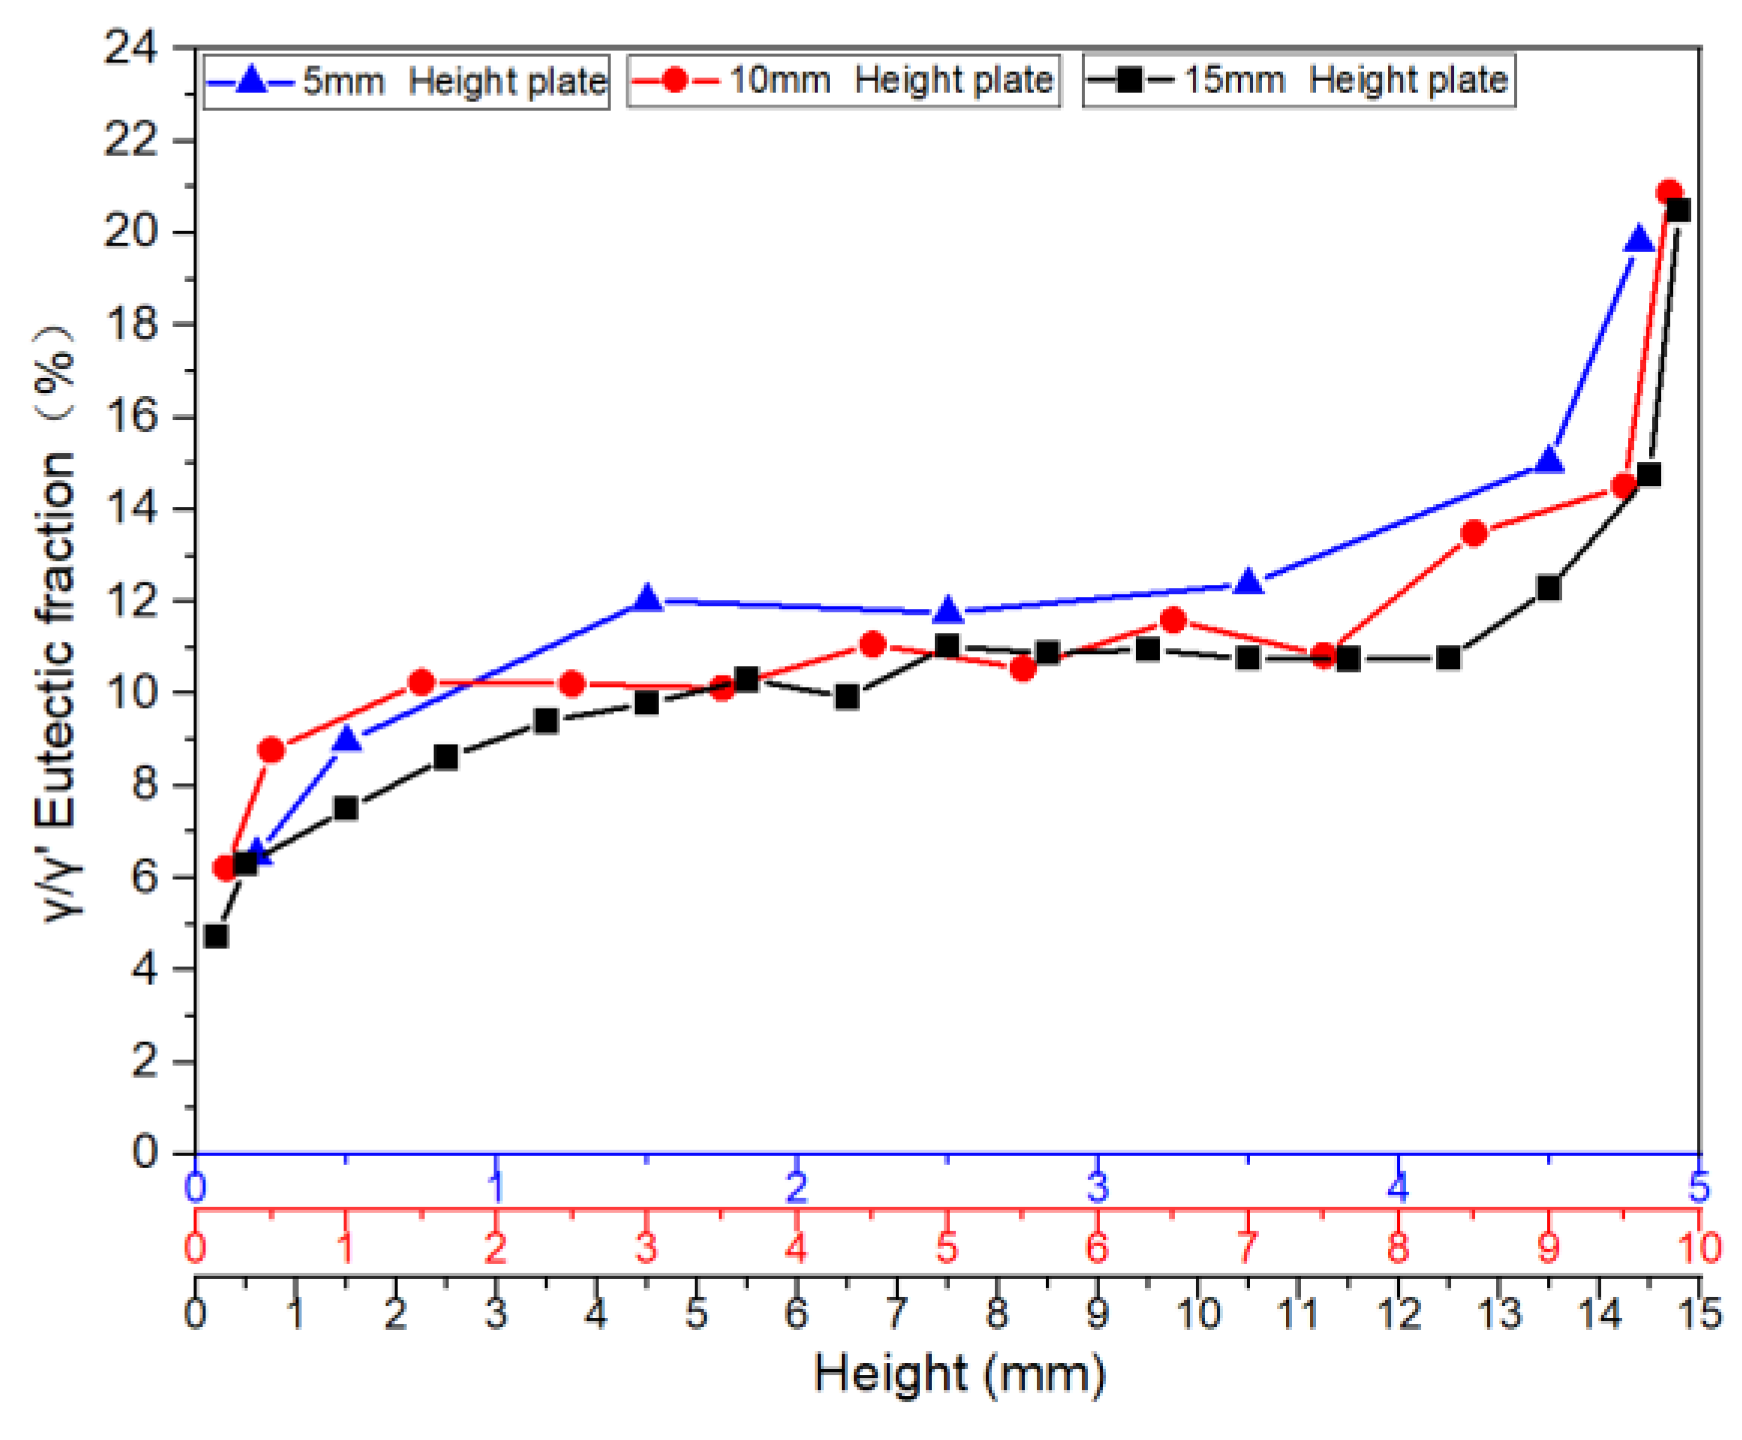
Figure 12.
Comparison of γ/γ’ eutectic content variation curves in the as-cast microstructure along the solidification direction for different sampling positions.
Figure 12.
Comparison of γ/γ’ eutectic content variation curves in the as-cast microstructure along the solidification direction for different sampling positions.
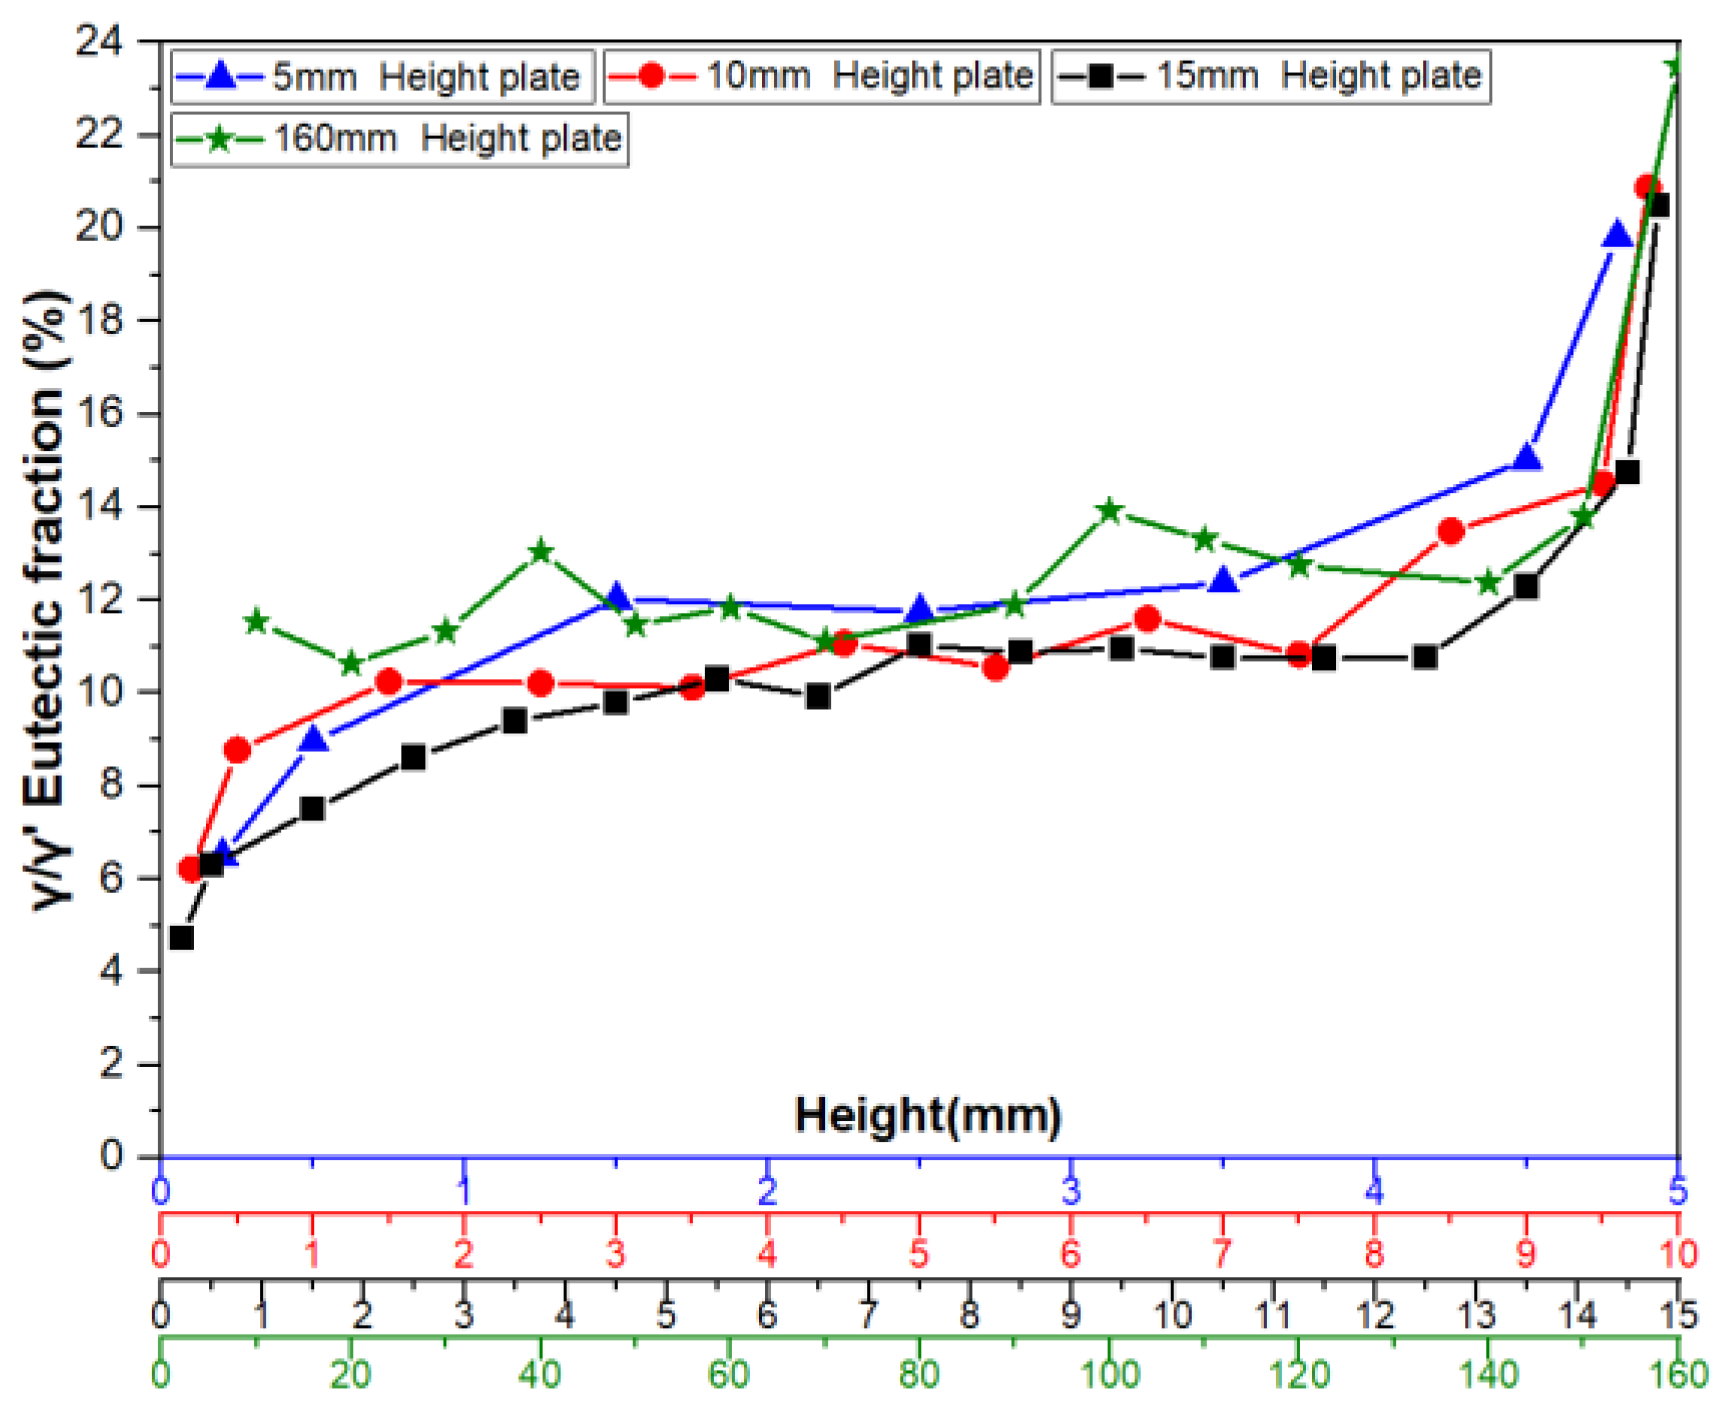
Figure 13.
Temperature field simulation model:(a) Schematic of the module layout in the Bridgman furnace; (b) Dimensional details of the casting model.
Figure 13.
Temperature field simulation model:(a) Schematic of the module layout in the Bridgman furnace; (b) Dimensional details of the casting model.
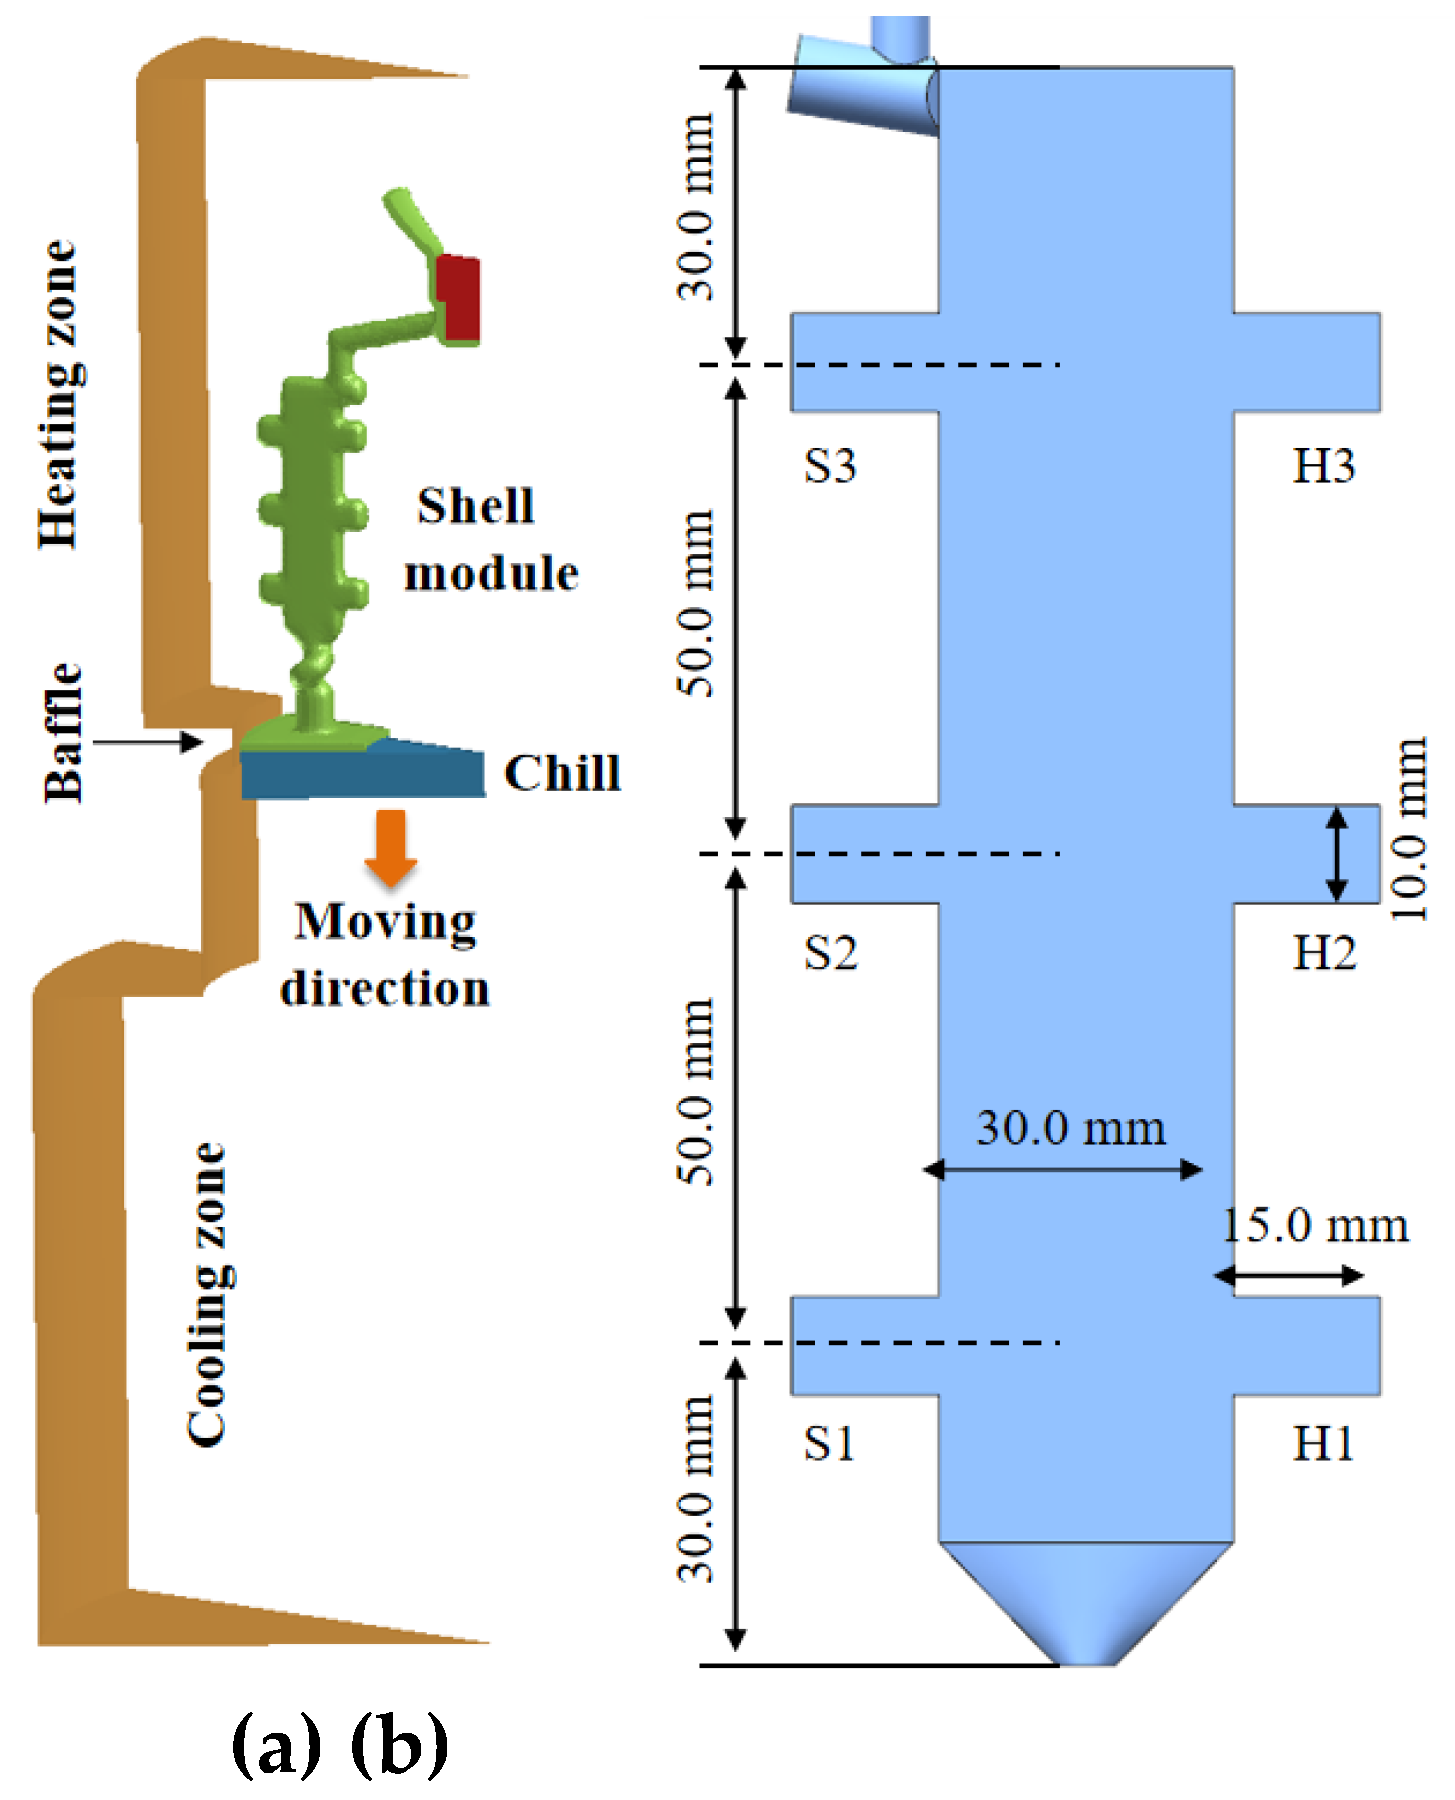
Figure 14.
Calculated eutectic distribution in the casting:(a) Morphology of the solidification front at time = 2092 s;(b) Spatial distribution of the eutectic phase in the central cross-section after full solidification.
Figure 14.
Calculated eutectic distribution in the casting:(a) Morphology of the solidification front at time = 2092 s;(b) Spatial distribution of the eutectic phase in the central cross-section after full solidification.
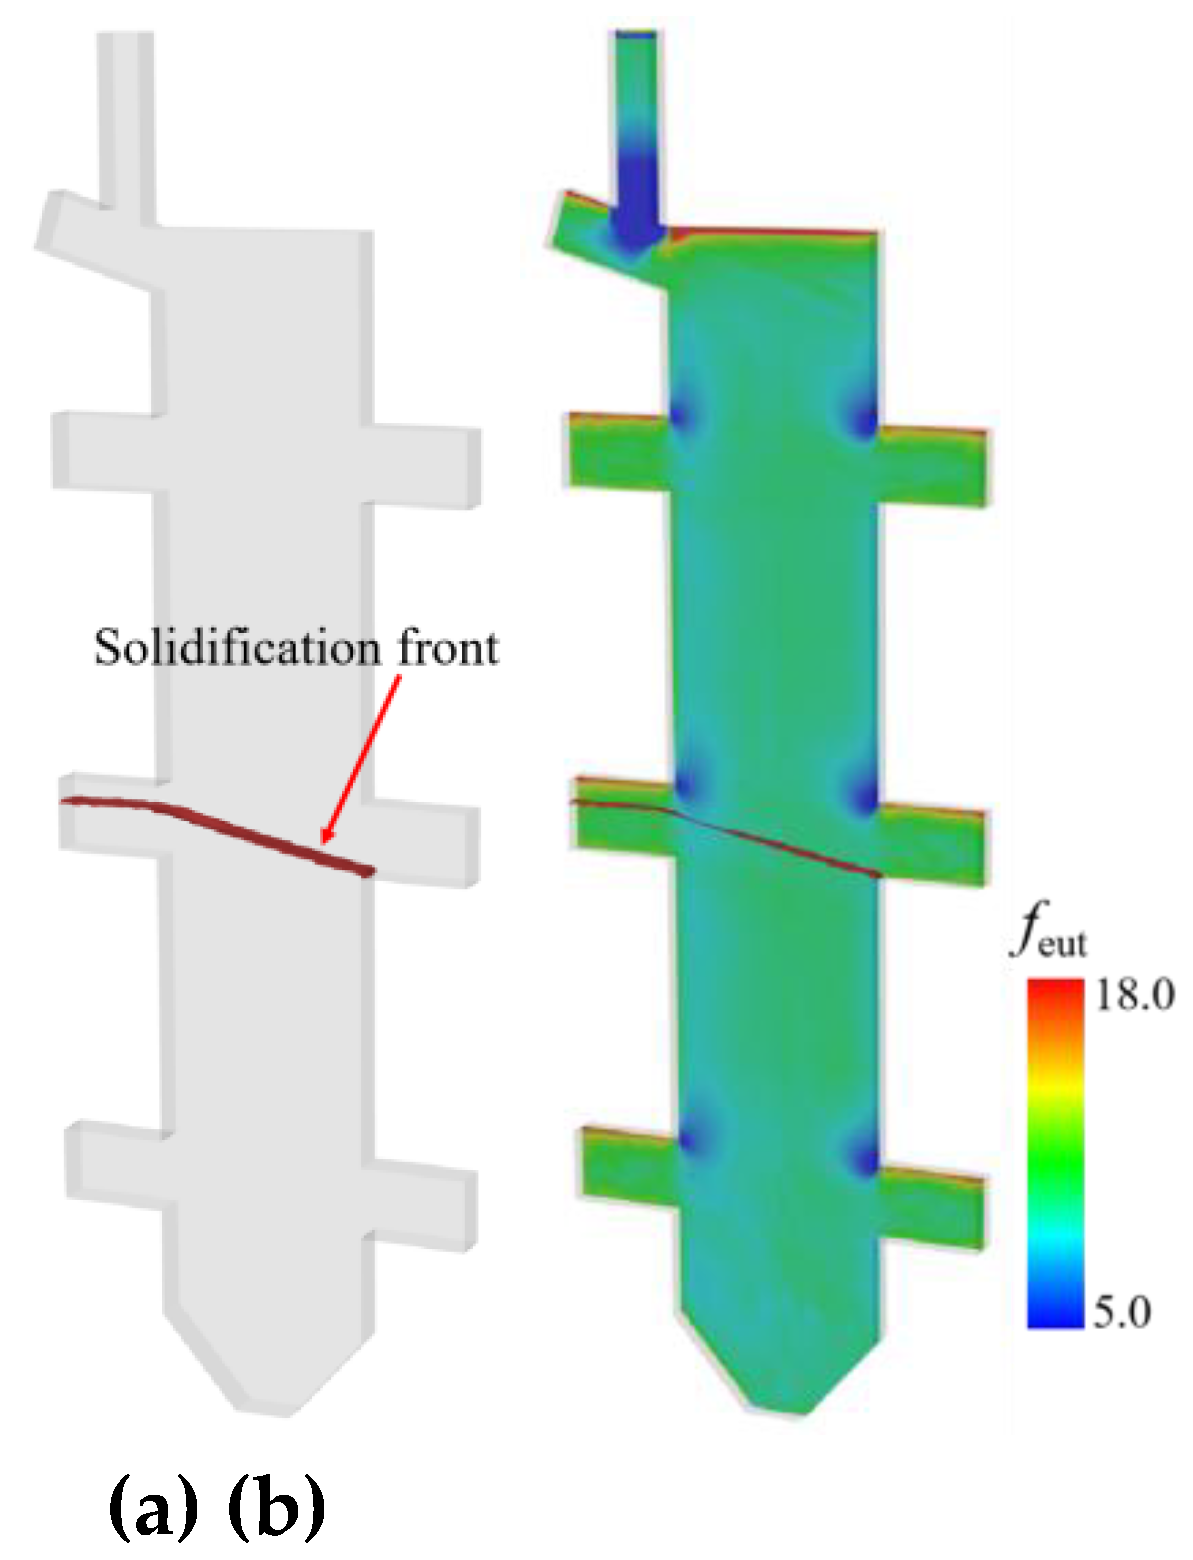
Figure 15.
Comparison of experimental and simulated γ/γ’ eutectic content variation curves along the solidification direction at sampling locations in the 10mm height plate casting.
Figure 15.
Comparison of experimental and simulated γ/γ’ eutectic content variation curves along the solidification direction at sampling locations in the 10mm height plate casting.
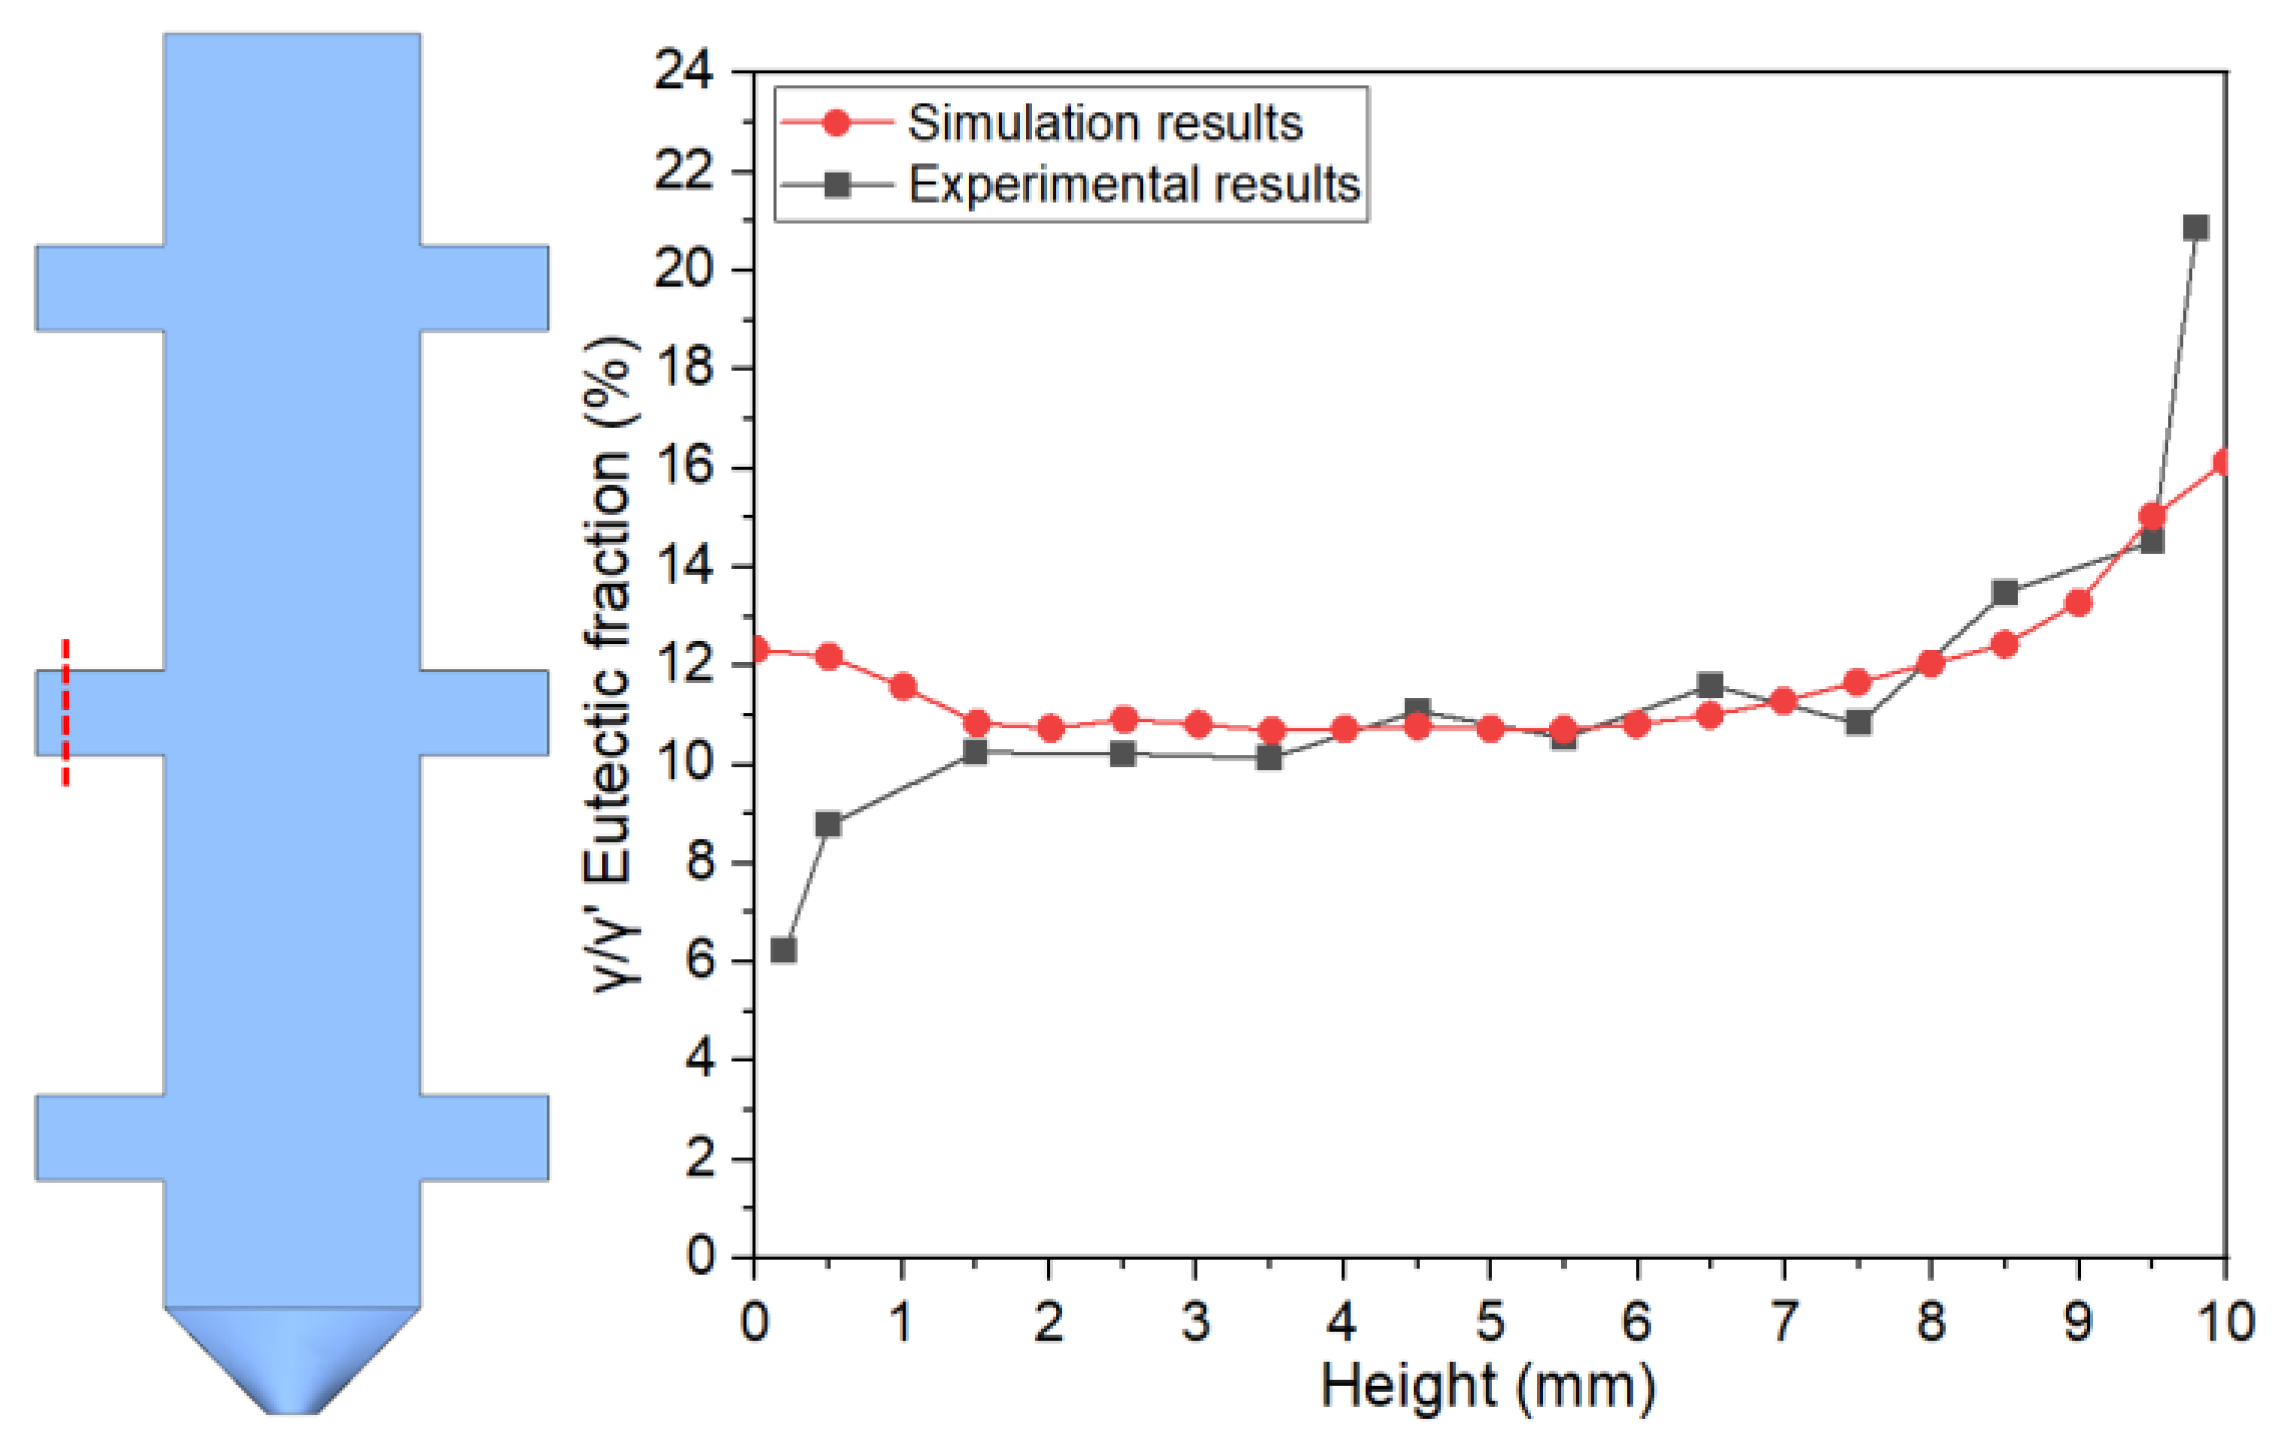
Figure 16.
Comparison of experimental and simulated γ/γ’ eutectic content variation along the solidification direction for full-height transverse and longitudinal sampling in the 10mm height plate casting.
Figure 16.
Comparison of experimental and simulated γ/γ’ eutectic content variation along the solidification direction for full-height transverse and longitudinal sampling in the 10mm height plate casting.
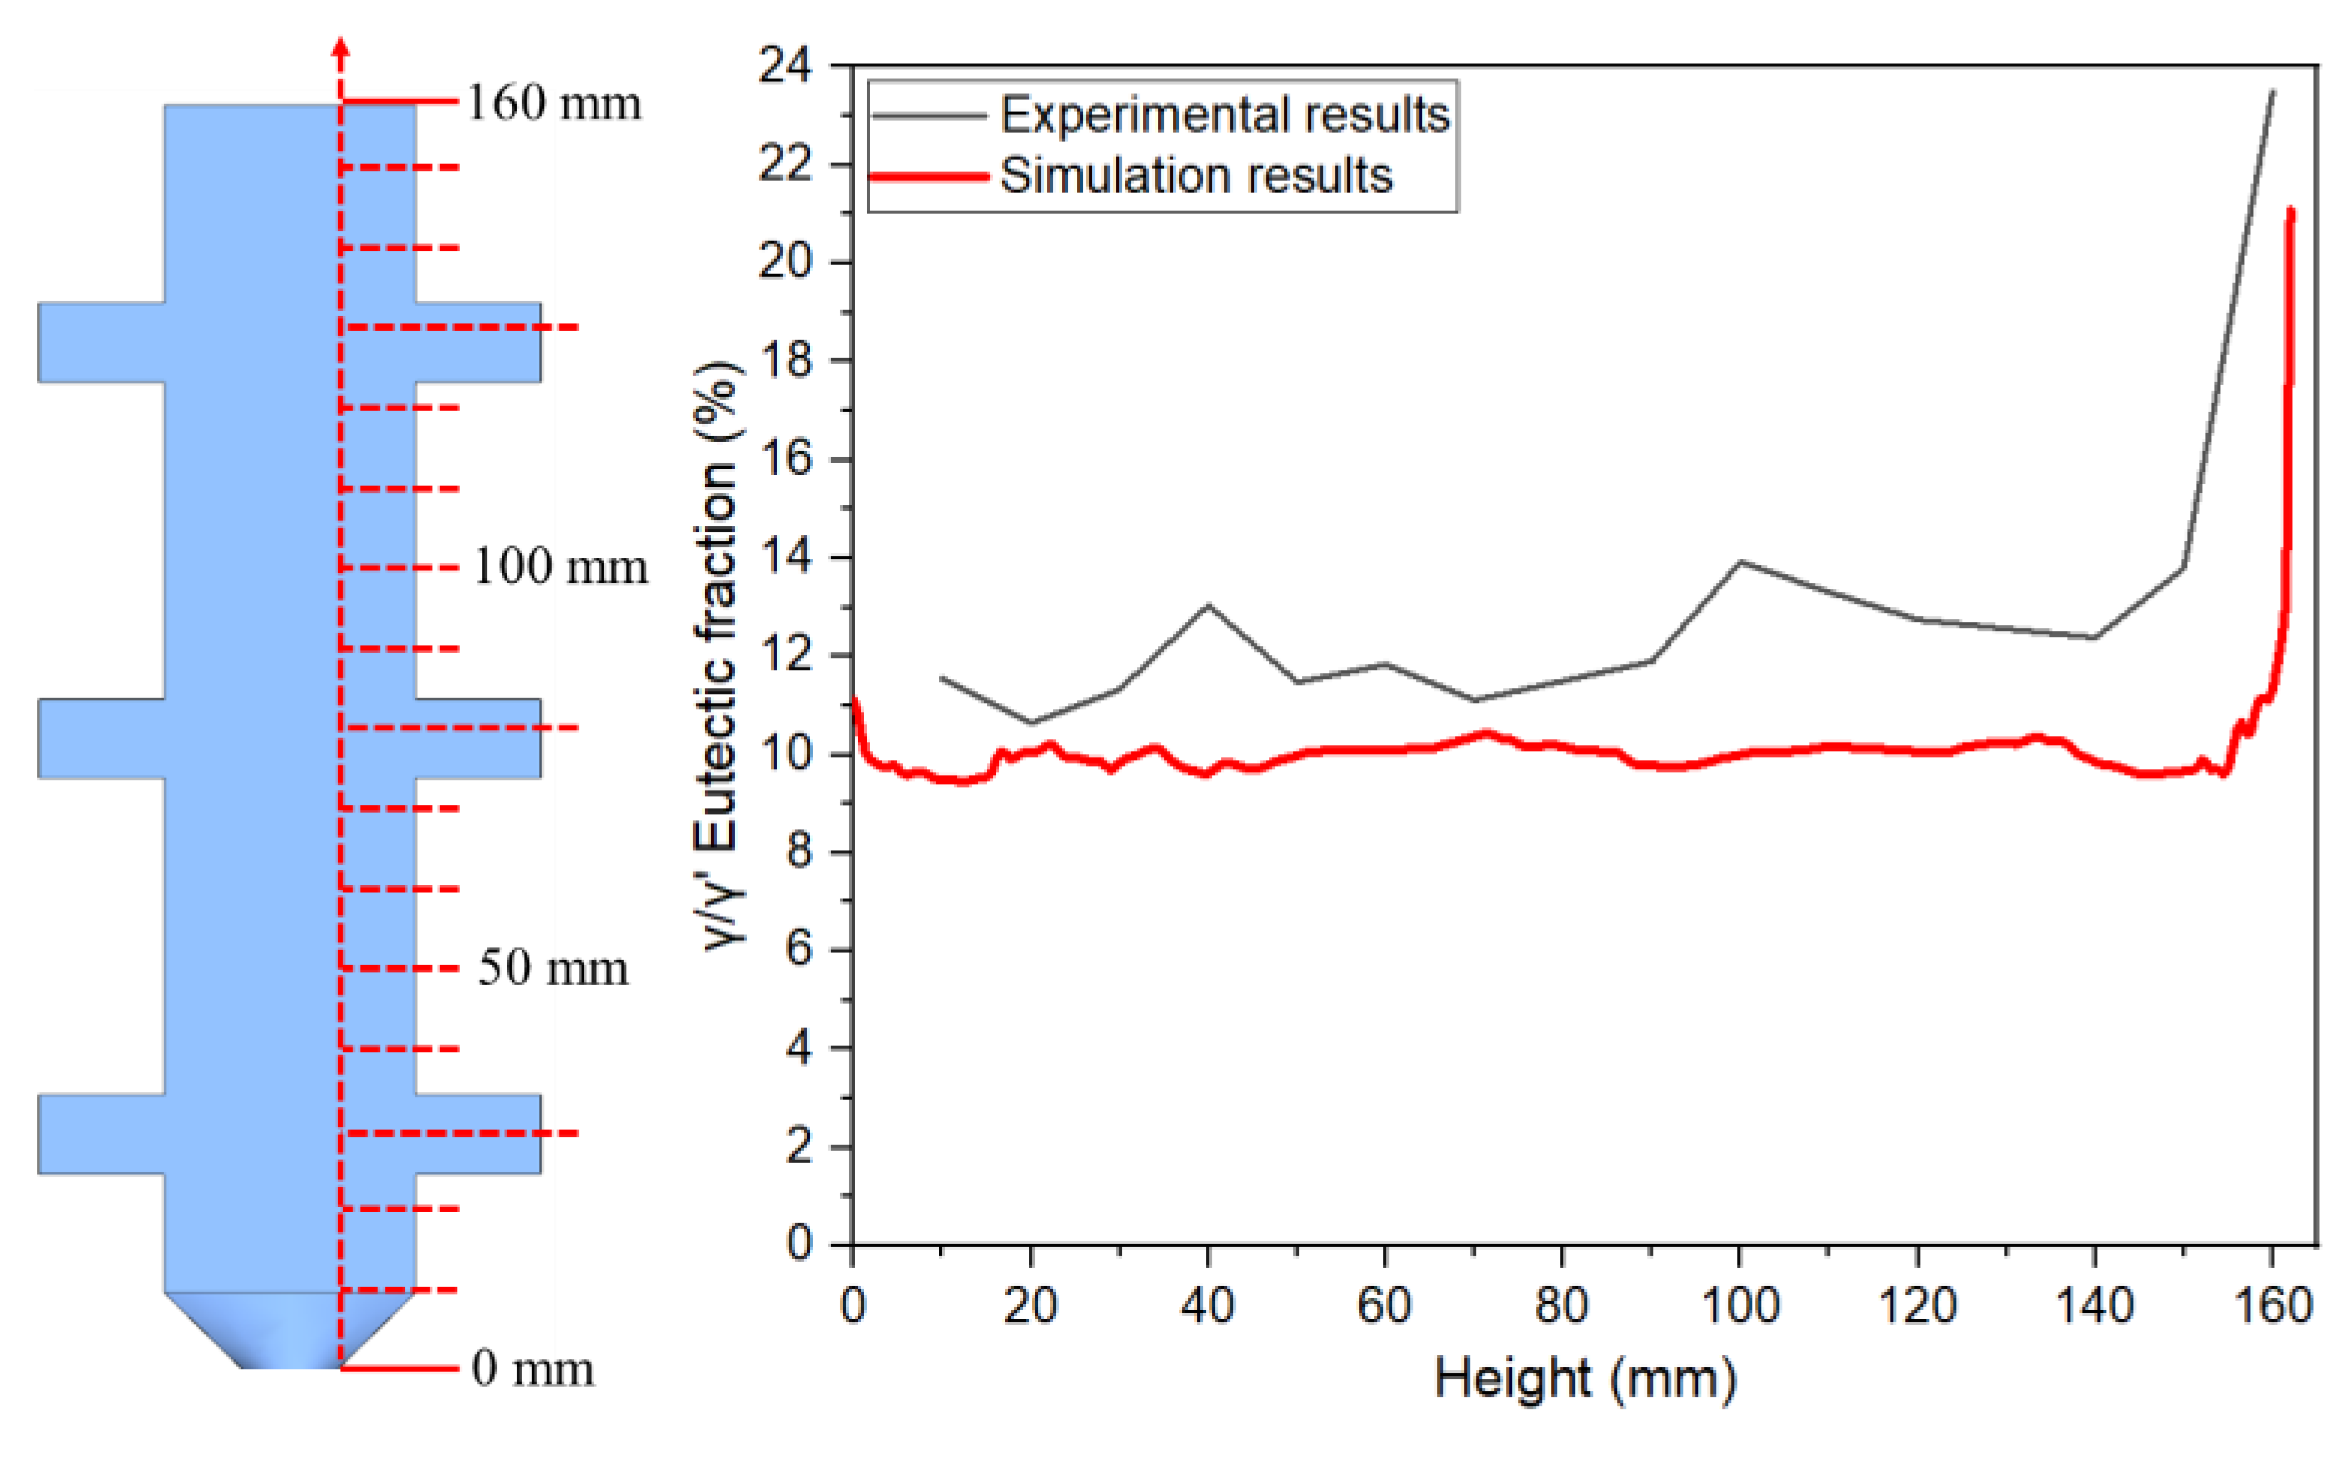
Figure 17.
Computational results of solidification progression and solute convection phenomena on the S2 side of the 10mm height plate:(a) solidification front morphology at t=2045 s; (b) solidification front morphology at t=2060 s; (c) solidification front morphology at t=2107 s; (d) Solute convection phenomena within boss S2 at t=2060 s
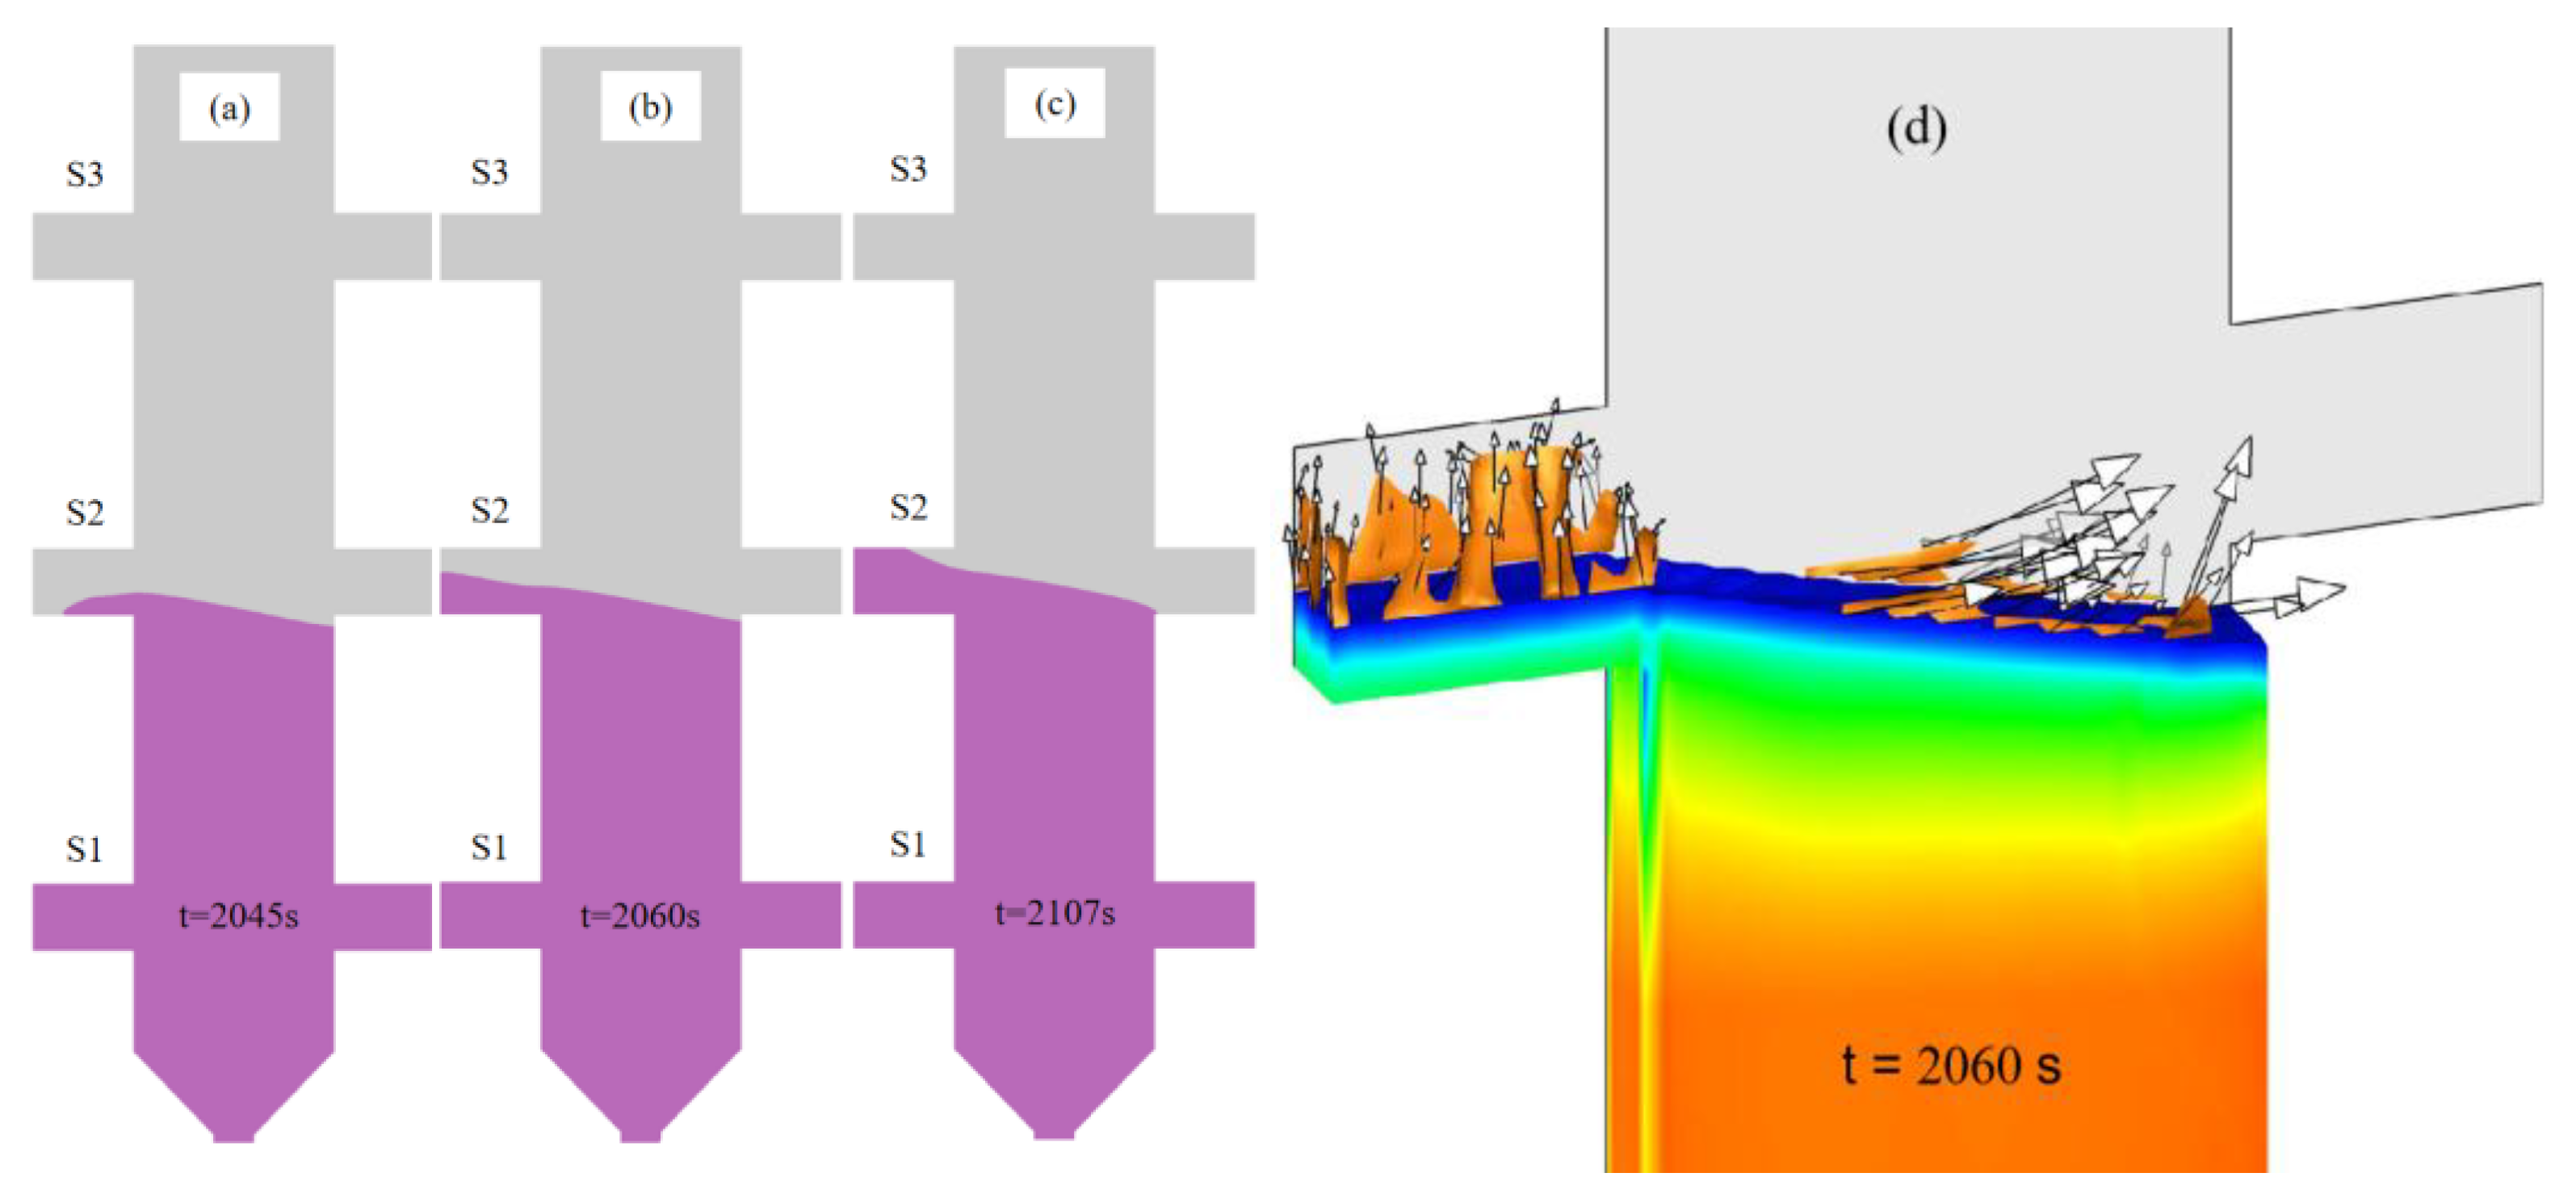
Figure 18.
Comparison of simulated eutectic distribution and metallographic micrographs at the corner region of boss H1:(a) simulated eutectic content distribution in region H1; (b) metallographic image of area H1
Figure 18.
Comparison of simulated eutectic distribution and metallographic micrographs at the corner region of boss H1:(a) simulated eutectic content distribution in region H1; (b) metallographic image of area H1
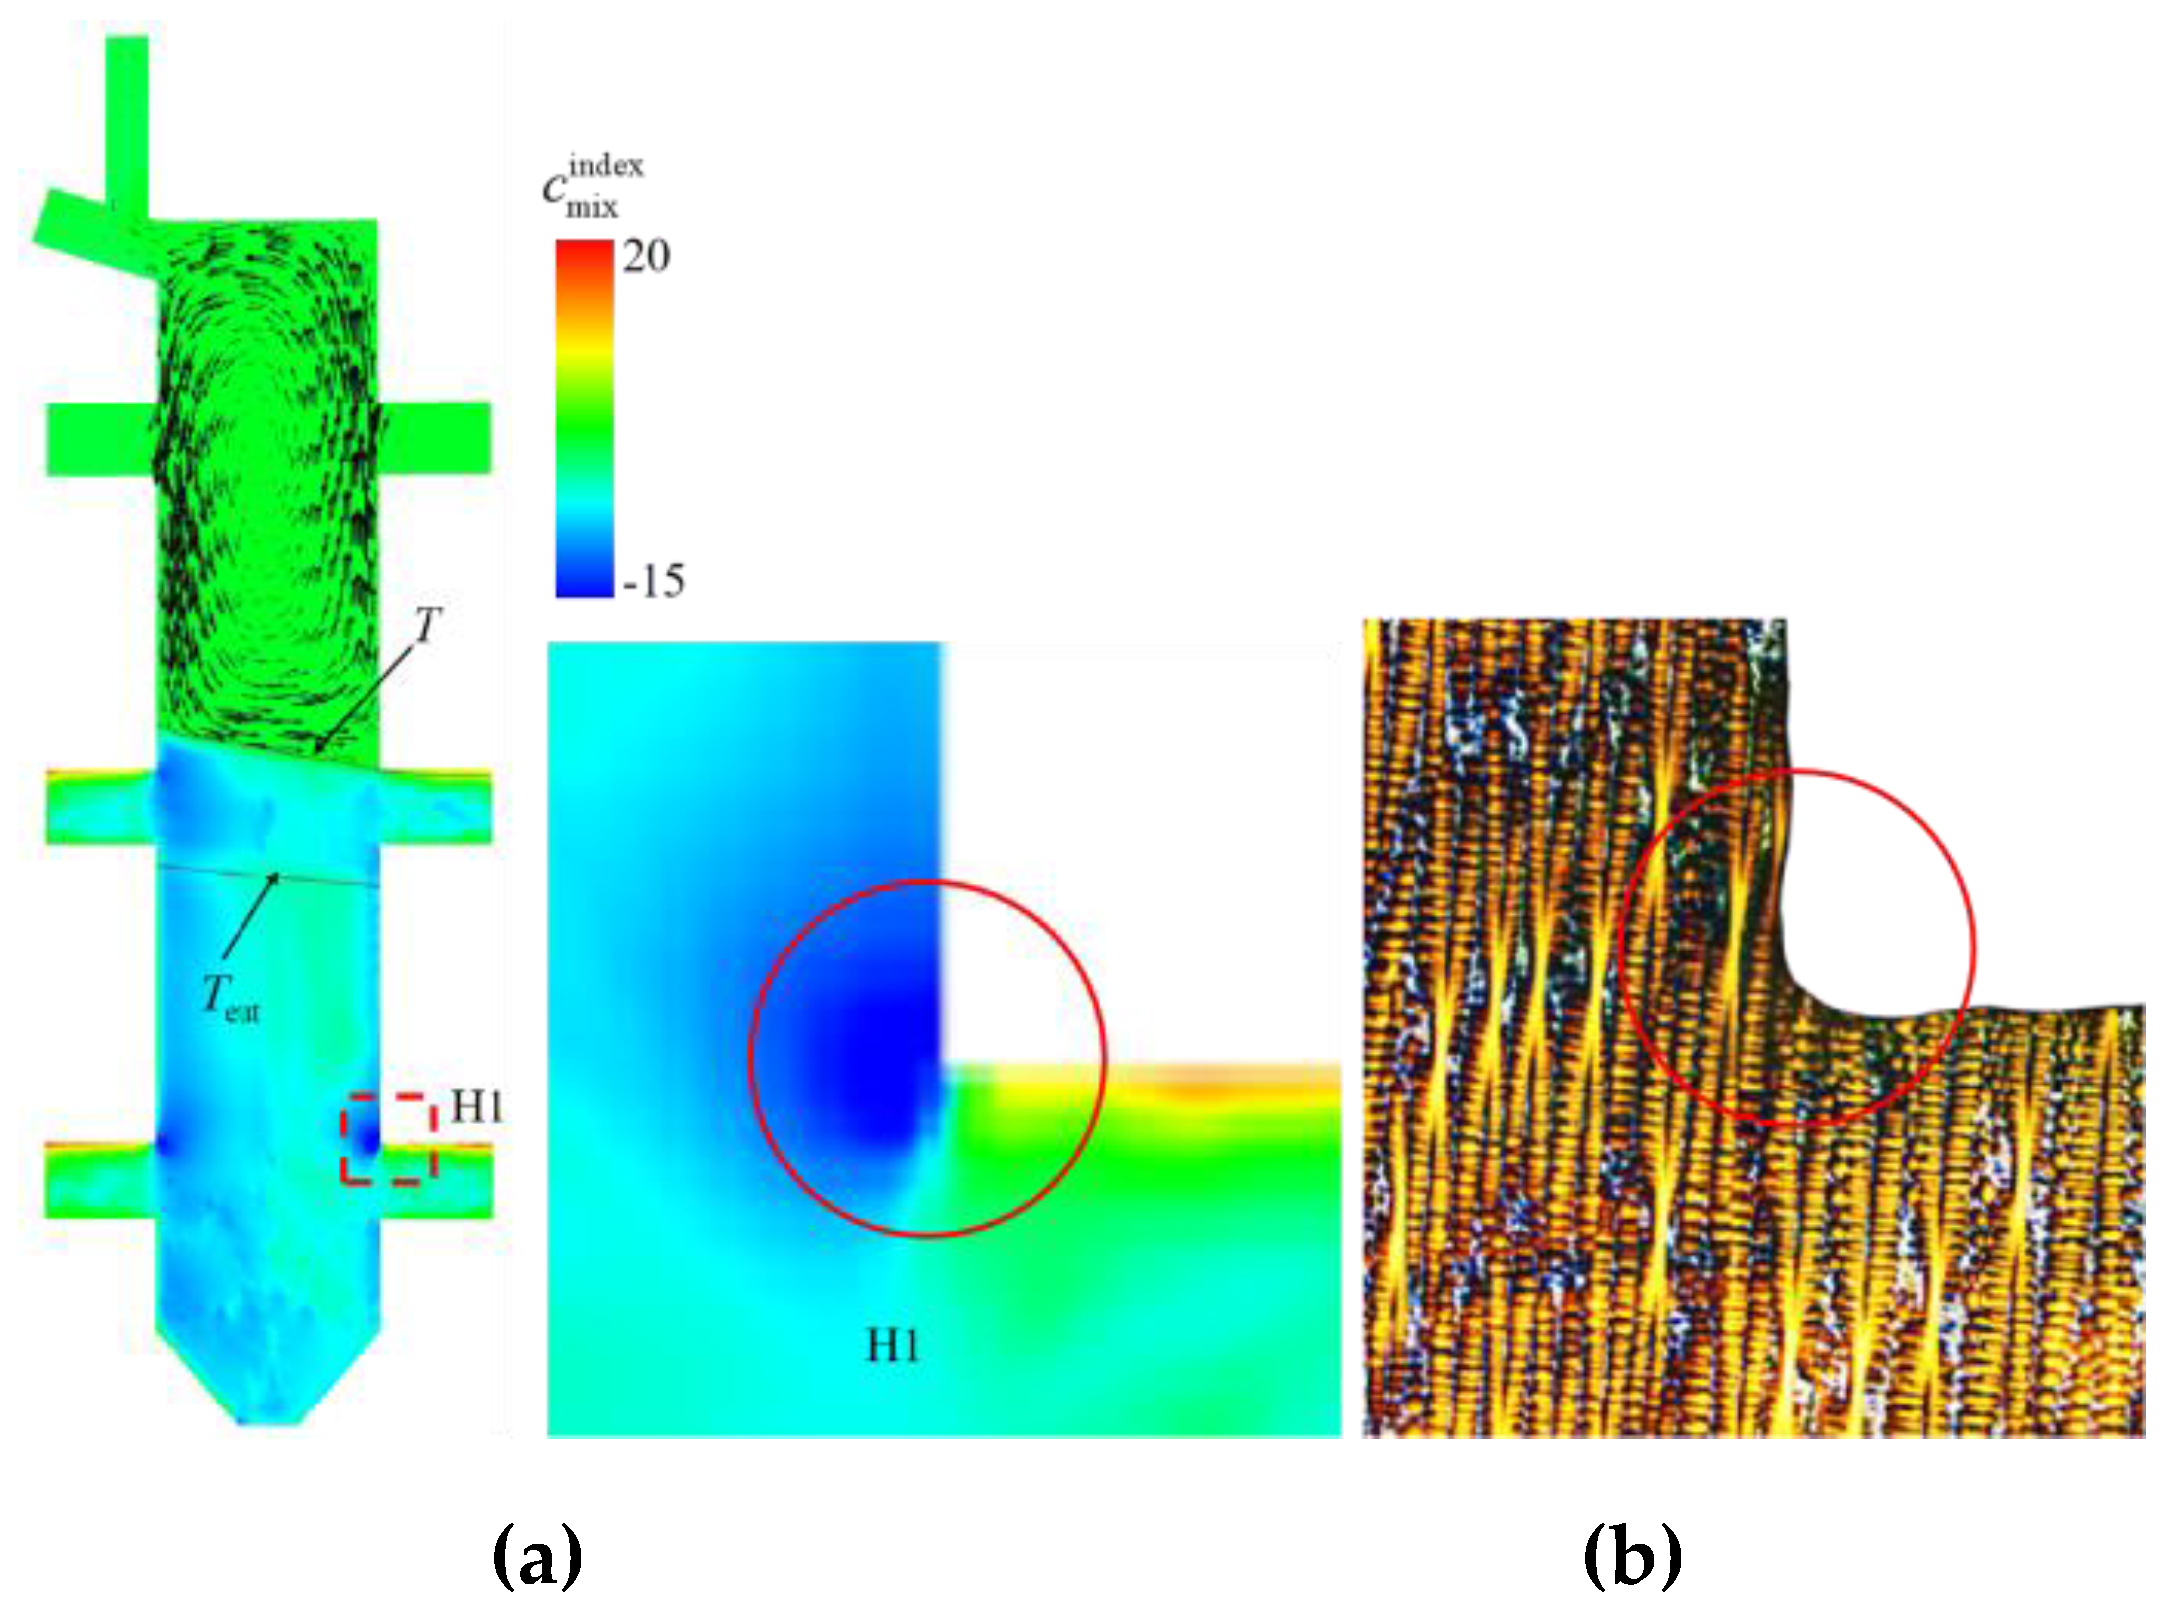
Figure 19.
Simulation results of solute convection during solidification front advancement to the corner region of boss H2: (a) Solute concentration distribution; (b) Solute convection pattern in Region H2.
Figure 19.
Simulation results of solute convection during solidification front advancement to the corner region of boss H2: (a) Solute concentration distribution; (b) Solute convection pattern in Region H2.
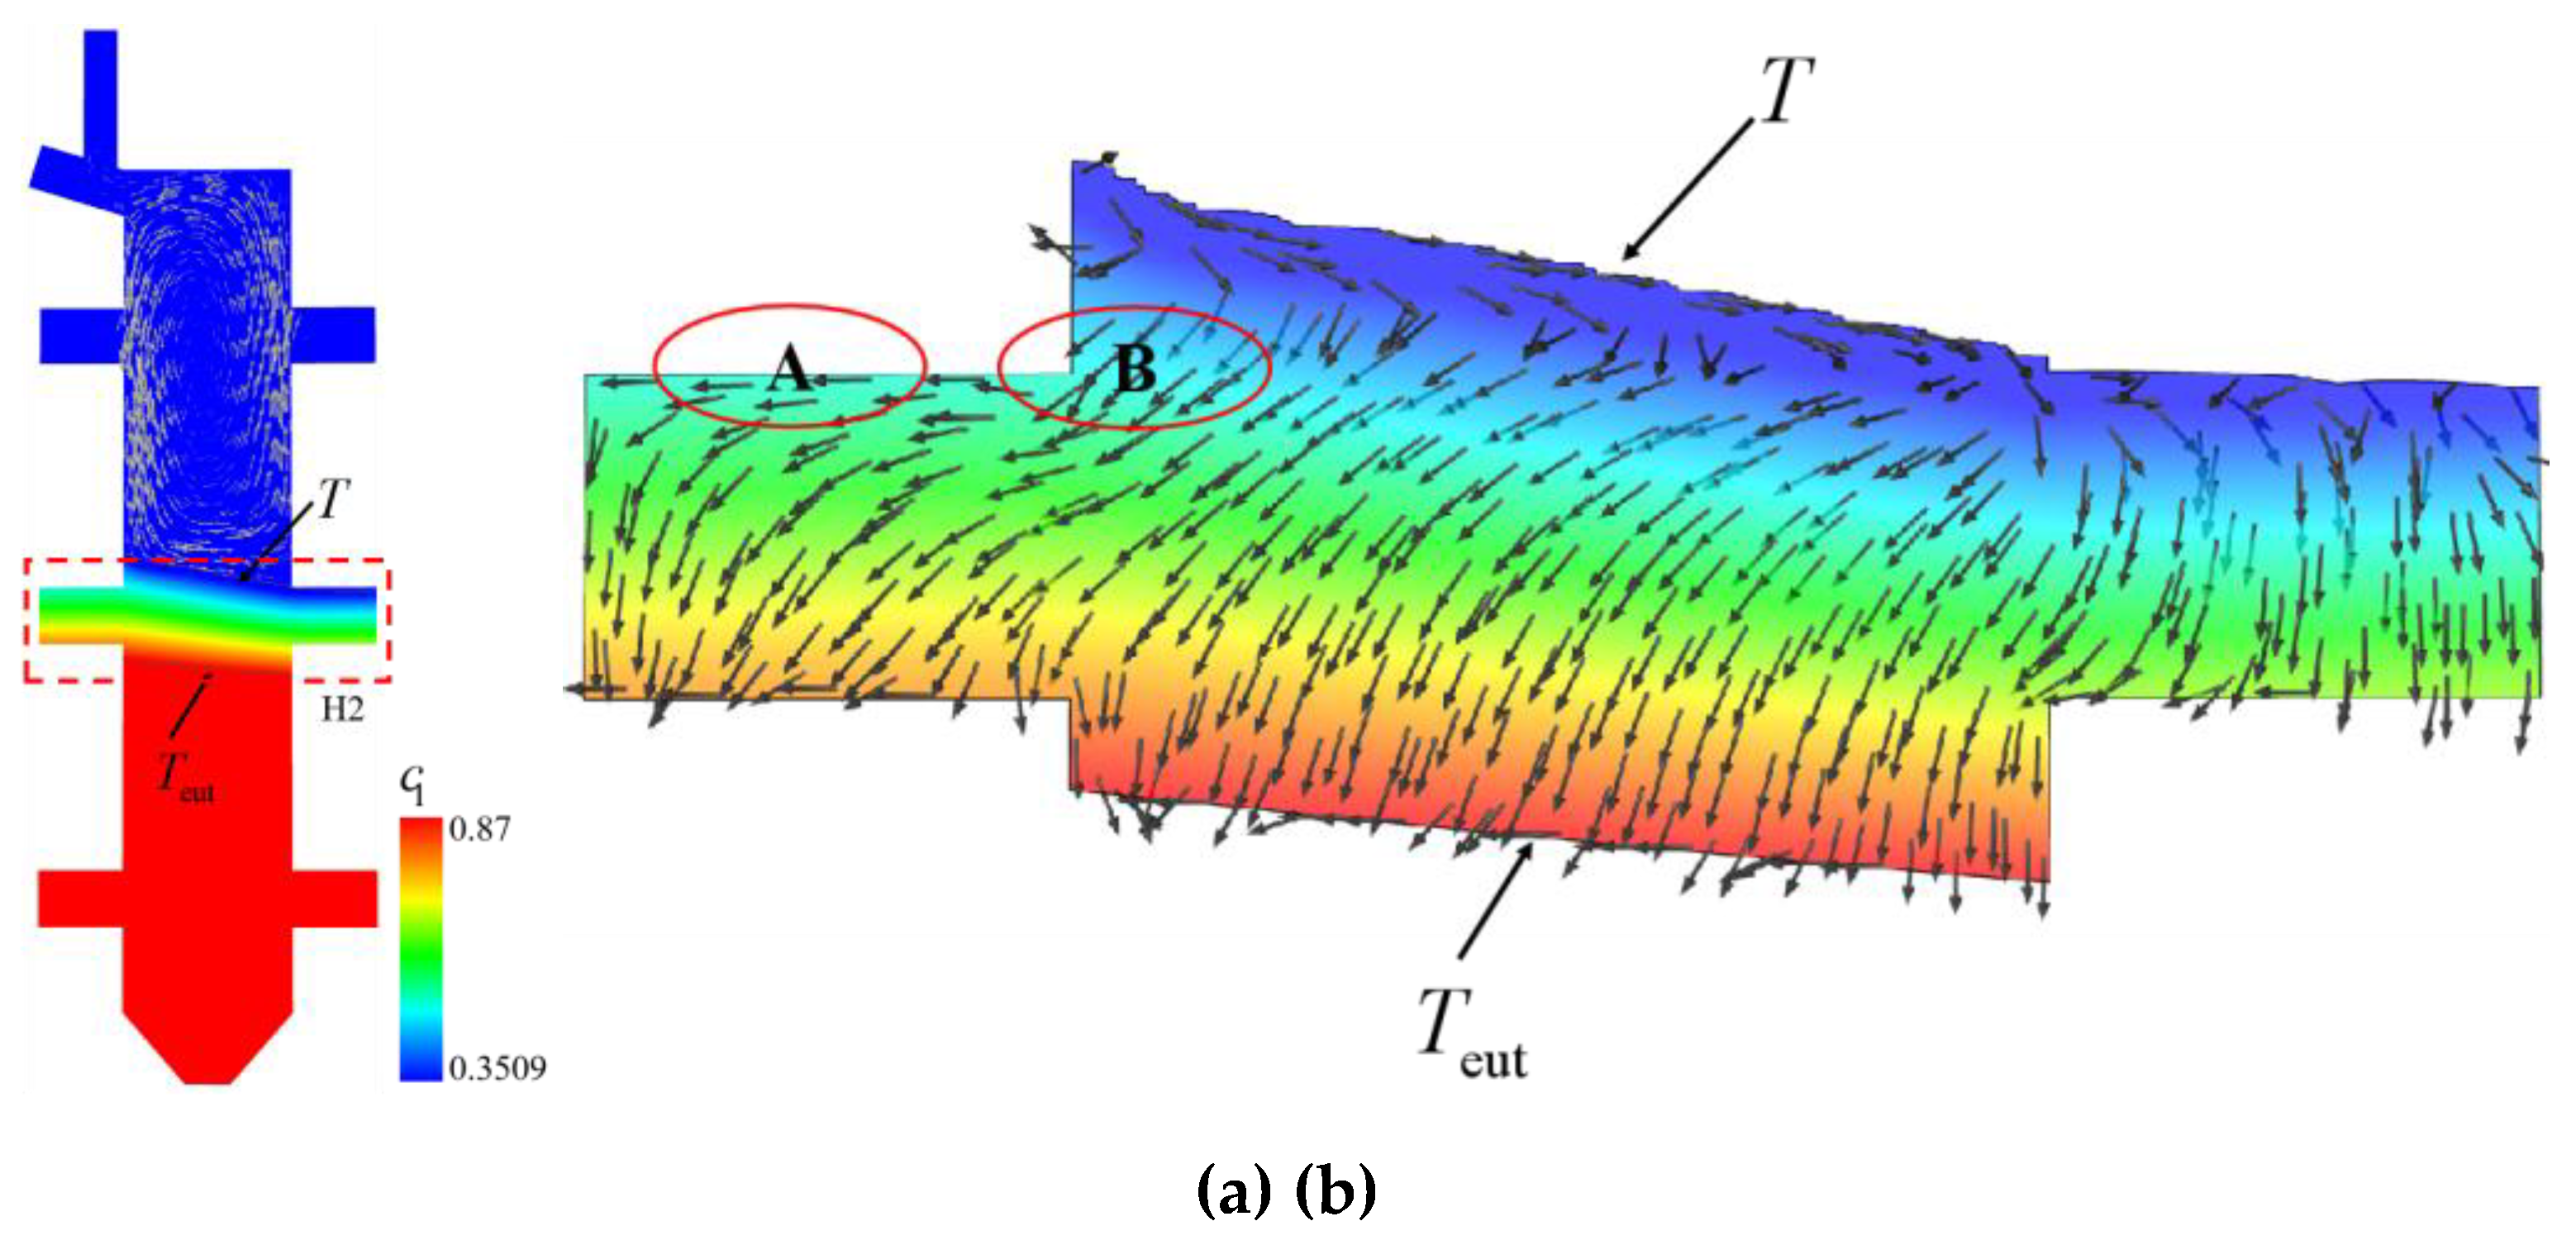

Table 1.
Chemical composition of the investigated superalloy (wt.%).
| Element | Al | Co | Cr | Fe | Hf | Mo | Nb | Re | Ta | Ti | W | Ni |
| Content | 5.69 | 5.97 | 3.39 | 0.21 | 0.03 | 0.41 | 0.10 | 4.89 | 8.07 | 0.15 | 6.52 | Base |
Disclaimer/Publisher’s Note: The statements, opinions and data contained in all publications are solely those of the individual author(s) and contributor(s) and not of MDPI and/or the editor(s). MDPI and/or the editor(s) disclaim responsibility for any injury to people or property resulting from any ideas, methods, instructions or products referred to in the content. |
© 2025 by the authors. Licensee MDPI, Basel, Switzerland. This article is an open access article distributed under the terms and conditions of the Creative Commons Attribution (CC BY) license (http://creativecommons.org/licenses/by/4.0/).
Copyright: This open access article is published under a Creative Commons CC BY 4.0 license, which permit the free download, distribution, and reuse, provided that the author and preprint are cited in any reuse.


