
Submitted:
15 July 2025
Posted:
16 July 2025
You are already at the latest version
Abstract
Wetting and drying cycles (WDC) are one phenomenon that affects soil pore architecture. This study analyzed changes in the pore architecture of subtropical soil under no-tillage (NT), conventional tillage (CT), and forest (F) after WDC application. Three-dimensional X-ray microtomography images of soil aggregate samples (2-4 mm) subjected to 0 and 12 WDC were analyzed. The results showed that WDC did not affect (p>0.05) the imaged porosity, number of pores, fractal dimension, tortuosity, and pore connectivity for the dif-ferent soil management types. To analyze the permeability and hydraulic conductivity of the soil pore system, the most voluminous pore (MVP) was examined. No differences were observed in the imaged porosity, fraction of aggregate occupied by the MVP, connectivity, tortuosity, hydraulic radius, permeability, and hydraulic conductivity between 0 and 12 WDC for the MVP. Comparing soil management types after 12 WDCs, for example, F samples became more porous than CT and NT samples. In contrast, the pore system of NT samples became less complex and more tortuous than CT and F samples. Although the porous architecture, at the intra-aggregate pore scale, proved structurally stable some in-sightful trends suggest that CT may be associated with a less efficient transport of fluids and physical quality.
Keywords:
soil analysis
; X-ray microtomography
; pore architecture
; permeability
; hydraulic conductivity
; synchrotron tomography
1. Introduction
Different management strategies can lead to significant changes in soil hydraulic and structural properties [1]. Particularly, the choice of appropriate land-use system plays a crucial role in the productivity and sustainability of agricultural systems. Among the available options, three land-use systems widely used worldwide are sustainable forest (F), conventional tillage (CT), and no-tillage (NT) [2,3]. Sustainable forest is a management practice based on maintaining a dense and diverse forest cover whose vegetation protects the soil from erosion, retains water and nutrients, and promotes soil biodiversity [4]. Studies such as [5] highlight the benefits of forests in soil conservation, restoration of degraded areas, and climate change mitigation. However, for economic purposes, its results are long term. Conventional tillage is characterized by use of chemicals, such as fertilizers, and soil disturbance caused by plowing and harrowing [6]. Although widely used in conventional agriculture, this practice can sometimes lead to problems such as soil compaction, erosion, loss of biodiversity, and degradation of natural resources [7]. However, CT many times can be employed for mechanical weed control, reducing the use of herbicides. Another important management is NT, characterized by producing minimum disturbance in the soil structure and by maintaining the plant residues in the topsoil layer. The NT is considered a sustainable agriculture practice, showing important impact on soil conservation due to better water infiltration rate, plant available water, and a decrease in surface runoff [8]. However, inadequacies such as lack of crop rotation, lack of intercropping, among others, can cause an imbalance in the population of arthropods and pathogenic microorganisms, a high incidence of pests and diseases, and lead to the intensive use of insecticides and fungicides. Therefore, the selection of appropriate land-use system depends on the field characteristics, the objectives of the farmer, and the environmental conditions.
Several processes can affect soil structure, such as the influence of wetting and drying cycles (WDC). These cycles are common in soils and play a fundamental role in soil dynamics and the functioning of terrestrial ecosystems [9]. Wetting and drying cycles refer to the alternation between periods of increased soil moisture due to water input from rainfall, irrigation, or capillary rise, and periods of drying due to water loss from evaporation and plant transpiration [10]. Water enters the soil and fills the pores during wetting, often altering its structure. This process can lead to changes in plant water and nutrient availability, soil biological activity, organic matter distribution, and soil physical properties [11,12]. On the other hand, during drying, water loss can lead to soil shrinkage depending on its mineralogical composition, which affects its porosity, permeability, and resistance to root penetration [13]. Elucidating the effects of WDC on soil structure allows the development of conservation strategies to optimize irrigation and select crops better adapted to these cycles, which is essential for soil management in different agricultural systems [14]. Thus, studies on the effects of WDC on soil structure can provide valuable insights for understanding soil-plant-water interactions and their contribution to the sustainability of agricultural systems [15].
In addition, analyzing physical properties is fundamental to understanding the processes in the soil pore system. The study of properties such as porosity, fractal dimension, pore number, connectivity, tortuosity, and permeability can provide important information about the structural quality of the soil [16,17,18]. Porosity refers to the ratio between the total volume of a given soil sample and the volume of its pores, and it is directly affected by changes in soil structure [19]. The fractal dimension is used to characterize the complexity or irregularity of an object. Measuring the fractal dimension of any system or porous medium is crucial as it indicates its level of heterogeneity [18]. Connectivity is related to the continuity of pores in the soil, which influences the ability of the soil to allow water infiltration, the distribution of nutrients, and the movement of gases [20]. Tortuosity measures the irregularity and sinuosity of pores, affecting water infiltration and redistribution across the soil profile [21]. Permeability refers to the ability of soil to transmit water and gases, which is primarily influenced by soil porosity and tortuosity of pores [22]. Thus, analyzing how soil management practices affect soil morphological and topological properties can provide information for selecting the best soil management strategy, conserving natural resources, and optimizing agricultural productivity.
In this sense, a technique often used to study the above-mentioned physical, morphological, and topological properties is X-ray computed tomography (XCT) [23,24,25]. XCT allows non-destructive analysis of the internal structure of materials, which is ideal for studying porous systems such as soil. The technique allows the acquisition of high-quality images with different resolutions, permitting the study of inter-aggregate and intra-aggregate porosity. Intra-aggregate pores mainly consist of micropores which are fundamental for water retention in soil [26]. These pores act by retaining water that, depending on the scale, is readily available to plants. Intra-aggregate pores regulate multiple micro-scale soil processes essential to the biochemical interactions that indirectly influence soil macrostructure. Such pores are indispensable to soil structure's physical stability due to the micro-scale chemical, physical, and biological interactions. External processes, such as wetting and drying cycles, can also affect the biochemical and microbial activities occurring at the micro-scale that indirectly form soil aggregates and, consequently, the pore space within the aggregates [27]. In addition, differences in soil management can impact intra-aggregate pores, potentially influencing processes such as water retention, microorganism movement, and soil solution conduction [28,29]. Few studies examine how wetting and drying cycles under different management practices affect soil structure at the intra-aggregate pore scale [11,12,30]. Therefore, comprehending the function of these pore types in soil processes is crucial for enhancing our comprehension of water retention and movement on the scale of small soil aggregates.
A series of studies have been addressing the effects of contrasting tillage systems on properties of soil pores, considering the same soil areas in Brazil, in different scales of analysis [28,31,32]. The first study investigated these effects specifically on intra-aggregate pores, where synchrotron-based X-ray computed tomography was used to achieve the high spatial resolution needed [28]. The present study, in turn, takes a step further by investigating how the same soil under contrasting soil management are affected by WDC at the scale of intra-aggregate pores. Thus, this study will test the following hypotheses: 1) The morphological and hydraulic properties of intra-aggregates pores in subtropical soil are resilient to changes due to WDC, and 2) that different soil management can influence the effect of WDC on soil structure.
2. Materials and Methods
2.1. Soil Sampling
Undisturbed samples were collected in 2018 from the topsoil layer (0-10 cm) of a Rhodic Hapludox [33] located in experimental sites (-25.16, -50.15) close to Ponta Grossa, Brazil. The soil has a clay texture composed of 58% clay, 29% silt, and 13% sand [26]. For this study, the soil was submitted to three long-term contrasting soil managements, no-tillage (NT), conventional tillage (CT), and forest (F). Samples were collected in the crop row to avoid possible compacted regions due to agricultural traffic [34]. More information on experimental sites and soil preparation can be found in [32].
The soil sampling was carried out before soil preparation for new crop production and near its field capacity to avoid damage to soil structure due to sampling [35]. Part of the collected samples were subjected to 12 WDC and others were not (0 WDC). Samples that did not go through WDC were analyzed in [28] and are used in the present study as a reference to evaluate the effects of WDCs on the architecture of soil intra-aggregate pores. Samples not subjected to WDC were collected in monoliths [28], while those subjected to 12 WDC were collected in volumetric rings, necessary to perform WDC by capillary rise as described in Section 2.2. Following sampling, the samples destined to the 12 WDC had the soil excess outside the volumetric rings trimmed off. This procedure was made to ensure a soil volume similar to the internal volume of the cylinder.
2.2. Wetting-Drying Cycles and Sample Preparation
Following sample preparation, five samples of each soil management were subjected to WDC. A permeable cloth was fixed with rubber rings to the base of the samples to allow water permeability but retain soil particles. In the wetting (W) procedure, samples were saturated by capillary rise. This procedure was carried out slowly by adding around 0.5 cm of water, every two hours, to a tray containing the samples until reaching a water level at half of the samples height. After 24 hours, another 0.5 cm of water was added to around 80 to 90% cylinder height. The saturation procedure lasted approximately 48 h. The drying (D) procedure was made with the samples placed in a suction table (EijKelkamp – model 08.01 SandBox) under a pressure head (h) of 6 kPa. This pressure head means diameter up to c. 50 μm (Young-Laplace equation) from the samples are drained [26]. This pore size was chosen because it represents the size that separates the storage pores from the transmission ones [36]. Soil samples were kept in the suction table for approximately 3 to 5 days when the water ceased to flow out of them (thermodynamic hydraulic equilibrium). Following the equilibrium, then samples were subjected again to a new wetting.
By the end of the 12 WDC, the samples were oven dried for around two weeks at 40ºC. Next, they were carefully extracted from the volumetric rings, disaggregated, and passed through sieves with mesh sizes between 2 and 4 mm, as performed for samples under 0 WDC [28]. One small aggregate (size of c. 3 mm) was selected from each soil sample under the contrasting soil managements, taking into account both 0 and 12 WDC. Thus, thirty samples were scanned by computed tomography (5 aggregates × 2 levels of WDC × 3 soil managements).
2.3. Synchrotron-Based X-Ray Computed Tomography: Image Acquisition and Segmentation
Each soil aggregate was scanned using synchrotron X-ray computed tomography at the Brazilian Synchrotron Light Source Facility (LNLS/CNPEM) using the IMX Beamline (Campinas, Brazil). A set of 16-bit images (raw type) with a maximum array of 2048 × 2048 × 2048 voxels was acquired. Thus, each image had a volume of 3.36 × 3.36 × 3.36 mm3 with a voxel side length of 1.64 μm. The image segmentation was based on machine learning combined with traditional local segmentation. The steps utilizing machine learning were carried out through the software Annotat3D, which was developed by the LNLS/CNPEM team [37]. Details of image acquisition and segmentation can be found in [28,38].
2.4. Morphological Analysis
The image-based porosity (P) was calculated as the ratio between the volume of pores (Vp) and total sample volume (Vt) (Eq. 1). The Volume Fraction module (Avizo software) was employed to determine the volume of pores (Vp) and solids, which together gives the total volume of the aggregate (Vt) in the segmented images.
, (1)
The number of pores divide by volume (NP/V), defined as the total number of unconnected pores, and the volume of isolated pores, were obtained using the Label Analysis module (Avizo software). The module Fractal Dimension (Avizo software) was employed to characterize the porous system of the aggregates based on its complexity. This module provides numbers between 2 and 3, with numbers close to 2 representing two-dimensional surfaces [18]. For a 3D image, the fractal dimension is an effective indicator to measure and compare the irregularity of a surface. In the case of porous system segmented images, this surface can be understood as the pore walls. The less regular the surface (which characterizes a more complex porous system), the higher the fractal dimension [18].
The pore connectivity (Euler Number, EN) and global tortuosity (τ) were determined by applying the modules Euler 3D and Centroid Path Tortuosity (Avizo software) on the entire pore system of each aggregate. Concerning tortuosity, a rectilinear pore has a value of 1, while tortuous pores are characterized by values larger than 1 [28]. The Euler number indicates how connected a pore is to other pores: the smaller (more negative) the Euler number, the greater the connectivity [39].
The permeability (k) was evaluated following the image-based parametrization of the Kozeny-Carman equation (IBP-KC) (Eq. 2), described in detail in [28,38]. For that, each sample's most voluminous pore (MVP) was selected using the Avizo software function Sieve Analysis (Figure 1).
, (2)
where PMVP is the porosity of a sub volume of the aggregate (Figure 1), which includes the MVP, that is, the ratio between the volume of the MVP (VMVP) and the sub volume of the aggregate that contains the MVP (Vsb). R is the hydraulic radius (μm), β is a dimension-less shape factor that depends on the geometry of the porous space and τMVP is the tortuosity of the MVP.
The R factor was obtained from the ratio between the volume of the MVP (VMVP) and its internal surface area (AMVP) [38], which were determined using the Label Analysis function in Avizo. As the cross-sections obtained were irregular, the β-factor was taken as 2.5, considering a value of two for flow through a small capillary tube and three for flow over an infinite flat plate [40]. The τMVP was determined via the Centerline Tree function in the Avizo software by means of the skeletonization technique. The tube parameters (slope and zeroVal) were set to 5 and 4, respectively, and the number of parts (segments) was set to 70, following the same methodology used in [28,38]. This method delivers a skeleton representing the 3D pore structure and computes the tortuosity and radius for each segment of the skeleton. Therefore, the tortuosity of each segment was obtained by the ratio between the sinuous length between the ends of the segment (Le), and the length of a straight line connecting the ends of that segment (L). The mean tortuosity of all segments (τMVP) was applied in Eq. 2 to estimate k for each aggregate. The criterion of convergence between the radius R and an alternative mean hydraulic radius R', proposed by [28], was adopted to identify outliers, i.e., samples for which the IBP-KC method was not suitable; where R’ is computed as the ratio between each segment’s volume and superficial area (2π×r × Le, r representing the mean segment radius).
In turn, the saturated hydraulic conductivity (K) was obtained based on the permeability data [41] according to Eq. 3:
, (3)
where ρ, g, and μ are the water density (0.998 g cm-³), the acceleration of gravity (978.7 cm s-²), and the water dynamic viscosity (1.005 × 10-² g cm-¹ s-¹) respectively.
The fraction of the aggregate occupied by the MVP (FAMVP) was determined as the ratio between VMVP and Vt. The Euler Number was also evaluated for the MVP. The variability among samples from different soil managements and WDC were analyzed by distributions of segment radius and tortuosity. The statistical analysis was applied using the software Past3 (PAleontological Statistics), the differences among the soil managements were evaluated using a one-way ANOVA (p ≤ 0.05), and to differences between WDCs were employed the test t. Figure 2 shows a schematic diagram of the procedures performed in this study.
3. Results and Discussion
The results presented in this study aim to compare the effect of WDC on the morphological and hydraulic properties of aggregates a subtropical soil. Although we applied statistical analysis between soil managements, the focus of the study was not to compare pore architecture between soil managements. A comparison between these different soil managements has already been studied in detail by [28]. How-ever, we chose to apply statistics between uses before and after WDC to verify the effect of WDC on soil structure between uses, especially after 12 WDC. In this sense, we only observed specific differences for some of the properties analyzed, as shown next.
3.1. Morphological Analyzes Considering All Pores in Each Aggregate
The imaged porosity did not present significant differences among soil manage-ments before the WDC application (Figure 3a), which is mainly associated with the high P variability for the samples under F. However, 12 WDC significantly decreased P by c. 31% (CT) and c. 28% (NT) compared to F (p≤0.05), while no differences were found between CT and NT. The average values of imaged porosity showed the same trend before and after WDC among soil managements (F>CT>NT). Interestingly, the variability in P among samples was reduced after continuous wetting and drying in all soil managements. When the effect of WDC is analyzed for each soil management, only minor variations were observed (p>0.05). Although the samples under F decreased P by c. 46%, the high variability in porosity by imaging, especially for the 0 WDC samples, influenced the results. In the case of the samples under CT, the decrease in P was c. 22%, whereas, for the samples under NT, it was only c. 4%.
Other authors have observed that WDCs often favor soil aggregation by altering P, especially in clayey soils [42,43]. The action of capillary forces inside the pores in the aggregates has also been a factor in altering soil structure after WDC [44]. In our study, although there were no significant differences from each factor alone (soil management type and number of WDC), interesting associated effects were identified, i.e., F samples under continuous WDC become more porous than CT and NT samples under the same conditions. The higher P for the area under F is mainly associated with decomposing organic matter and the action of tree roots, which also explains the greater P variability for 0 WDC [28,45]. The soil under NT showed greater resilience in terms of P variability with WDC, which would be expected due to the lack of soil disturbance and the maintenance of vegetation cover and crop residues on the soil surface, which increases aggregate stability [8,46]. Regarding CT, [47] found lower stability in soil aggregates of varying sizes under this soil management when compared to soils with higher organic matter content, such as NT and F, which is responsible for increasing cohesion between particles. Therefore, even slow hydration during WDC could significantly reduce soil porosity. Our results show, however, that the CT samples were resistant to P changes due to WDC, which was somewhat unexpected.
The 3D porous system images can be qualitatively assessed in Figure 4, where white regions are attributed to the absence of pores, that is, a higher appearance of white regions through the blue pore structure represents less porous samples. Although samples F0-4 and F0-5 were responsible for the high deviation found in the P results, qualitatively only F0-4 presented a noticeable difference when compared to other samples from F and CT (for 0 and 12 WDC). Samples under NT visually looked less porous compared to CT and F, both for 0 and 12 WDC, which agrees with the quantitative results. Regarding the effects of WDC, qualitative analysis proves difficult, since the samples are quite similar between same soil managements.
The NP/V followed the same pattern of P for samples not submitted to WDC (Figure 3b). This finding indicates a close relation between P and NP/V for the different soil managements investigated for 0 WDC. Only minor variations (p>0.05) were observed in NP/V for both 0 and 12 WDC when the contrasting soil managements were compared. The trend observed for NP/V under 0 WDC was F>CT>NT, with NP/V having decreased by c. 6% (CT) and c. 25% (NT) compared to F. After 12 WDC, NP/V having decreased by c. 17% (CT) and c. 29% (NT) compared to F. The analysis of the WDC effect for each of the contrasting soil management shows that none presented significant differences (p≤0.05). Samples under F and NT increased by c. 7%, and 1% respectively, whereas samples under CT decreased by c. 6%. For F, the increase in NP/V, is an indication of the presence of smaller and more isolated pores after the action of the WDC [11]. In the case of the CT the decrease in P was accompanied by a decrease in NP/V. For NT, the aggregates showed practically the same NP/V values after the WDC, showing that NP/V, like P, is not very sensitive to changes after 12 WDC in this pore size range (R between 0.5 and 25 µm). Other authors have demonstrated that WDC can cause changes in the number of isolated pores, but generally, when larger pores are analyzed [48,49]. Thus, our results show that at the intra-aggregate pore scale, NP/V is not influenced by WDC in each soil management neither between soil managements associated with WDC.
The FD has been an essential property in verifying the complexity and heterogeneity of porous systems [18,50]. The FD values found in our study are consistent with the scientific literature for 3D analysis of soil pores [51,52,53]. Overall, we observed that FD followed a similar trend to P for 0 and 12 WDC (F>CT>NT), indicating that at this scale of analysis, both properties seem to be interrelated, as observed by other authors [23,52,54] The higher FD values for the area under F are associated with the complex network of roots, wormholes, and less anthropogenic interference, which promotes a more complex and heterogeneous pore structure [18,45].
The FD did not present significant differences (p>0.05) among soil managements when samples were not submitted to WDC (Figure 3c). Samples under CT and NT presented FD values c. 2% and c. 6% smaller than F considering 0 WDC (p>0.05 in both cases). For 12 WDC, the differences were c. 1% (CT) and c. 5% (NT) (p≤0.05 in the latter). When the effect of WDC for each of the soil managements is analyzed, only minor variations were observed for the samples submitted to continuous wetting and drying cycles (p>0.05). This finding means that the application of WDC alone does not influence the complexity of the soil pore system from each soil management, at the scale of intra-aggregate pores. However, associated effects were identified, i.e., the pore system of NT samples under continuous WDC become less complex than CT and F samples under the same conditions. Compared to F, the rationale may be that NT has less natural heterogeneity than F, possibly having less modifications/ramifications in the fluid path at the intra-aggregate scale. Compared to CT, NT undergoes less disturbance, i.e., the aggregate breakdown during soil tillage in CT may be associated with a higher complexity of the pore system, particularly confirmed by the significant difference between these two soil managements after 12 WDC [50].
Samples from 0 WDC did not exhibit differences (p>0.05) in pore τ for the different soil managements (Figure 3d). This finding is mainly related to the high variability of τ under F, similar to the result of P. On the other hand, the 12 WDC application affected τ when the contrasting soil managements were analyzed. For instance, significant differences were noticed between F and NT and between CT and NT (p≤0.05). For samples under 0 WDC, CT and NT presented c. 2% and c. 35% larger values of τ compared to F (p>0.05 in both cases). For 12 WDC, these differences were even more considerable, being c. 17% (CT) and c. 51% (NT) compared to F (p≤0.05 in the latter). The reduced variability caused by WDC, i.e., lower deviations among samples under 12 WDC, certainly contributed to revealing significant differences. When the effect of WDC on pore τ is analyzed for each of the soil managements, only minor variations were observed (p>0.05) (Figure 3d). With the WDC application, the pore tortuosity decreased by c. 2% for samples under F, while for samples under CT and NT, it increased by c. 13% and c. 10%, respectively. Therefore, although there were no significant differences from each factor alone (soil management and number of WDC), associated effects were observed, i.e., the pore system of samples from NT under continuous WDC become more tortuous than CT and F samples under the same conditions.
Interestingly, there seem to be an opposite correlation between FD (F>CT>NT) and τ (F<CT<NT), for both 0 and 12 WDC, i.e, more tortuous pores seem to be associated with a lower complexity. Few studies compare FD and τ, which do not present a linear relationship. When compared, P and FD follow the same trend; that is, FD increases with the increase in P [55]. On the other hand, P and τ show an inverse trend; that is, when P increases, τ decreases [56,57]. Although the inverse trend between FD and τ found in our study is counterintuitive, it is worth mentioning that a more complex structure (larger FD) means greater filling of a given space by this structure [58]. In addition, highly complex tortuous branches can form this structure. However, our tortuosity calculation considers the center of mass of the image; therefore, even a structure formed by tortuous pores could present lower tortuosity when considering the structure in general (i.e., the center of mass). It is important to mention that the fractal dimension calculated by box counting only considers the structure as a whole. In this sense, the FD values calculated by this method may not be the most suitable for verifying complexities in parts of the analyzed structure. Tools such as multifractal analysis could provide more interesting results related to properties such as tortuosity.
Moreover, the more similar τ results for the aggregates under F with 0 and 12 WDC indicates a higher resilience to changes in tortuosity of pores in the soil management with more complex porous system, given its higher FD (Figure 3c). Regarding CT, the τ results differed from others found in the literature, in which the tortuosity was greater for CT than in soils with a greater amount of organic matter [59]. For NT, the typically higher organic content may favor changes in the volume of aggregates due to coalescence affecting the smallest pores [60], which may favor an increase in tortuosity. It is also worth emphasizing that the τ values found in our study (Figure 3d), for intra-aggregate pores, are higher than those found in previous studies of the same soil areas when samples contain inter-aggregate pores [31,32]. It should be noted though that this is not a fair comparison as the referenced studies analyzed tortuosity with different methods. [28] on the other hand, applying the same method used here for intra-aggregate pores of another studied soil. These authors found values varying in a similar range as that from our results in Figure 3d.
The EN was not significantly affected by contrasting soil managements for both 0 and 12 WDC, and neither by WDC for each of the contrasting soil management (p>0.05) (Figure 3e). Again, the large variability in EN values, especially for samples from F with 0 WDC, may explain the lack of significant difference between soil managements. Among samples not submitted to WDC, although no significant differences were observed, the lowest average EN (higher connectivity) was found for F, followed by CT (c. 26%) and NT (c. 31%). On the other hand, the 12 WDC application made samples under NT present the lowest EN (highest connectivity), followed by F (c. 6%) and CT (c. 17%). This is the only parameter addressed so far in this study not presenting the same trend between 0 and 12 WDC for each soil management. The 12 WDC increased EN (decreased connectivity) for samples under F (c. 54%) and CT (c. 33%), while kept EN stable for NT (c. 1% increase). During wetting and drying, water can carry loose particles or sub-unit aggregates from the process of soil breakdown or homogenization and lead to pore clogging, which can explain the increase in EN (decrease in connectivity) for CT between 0 and 12 WDC. This shows that the absence of tillage, the maintenance of vegetation cover, the organic matter content at the soil surface, and the plant root system under continuous wetting and drying cycles in NT tend to promote a similar intra-aggregate connectivity compared to F, and slightly more connected intra-aggregate pore structure compared to CT, thus favoring the water infiltration and nutrient transport [24,61]. Ultimately, contrary to what would be expected according to [11,52] the 12 WDC in our study did not favor new connections between pores that would reflect in an increase in EN for all the soil managements.
3.2. Permeability and Hydraulic Conductivity Considering the Most Voluminous Pore (MVP) in Each Aggregate
The WDC did not influence significantly the PMVP between soil managements for both 0 WDC and 12 WDC (p>0.05). As discussed in [28], the PMVP (Figure 5a) followed the same trend as the aggregate porosity, considering the different soil managements under 0 WDC, F>CT>NT (Figure 3a). On the other hand, when the samples were subjected to 12 WDC, there was a higher PMVP value for NT compared to CT (p>0.05). When comparing the cycles between the same soil managements, no significant differences were found (p>0.05), although there was a reduction in PMVP of c. 57% in F and c. 50% in CT and an increase of c. 10% in NT. Interestingly, according to [28,62], the clay content among the contrasting soil managements in the present study varied in a narrow interval (53–61 %), following the sequence: CT>F>NT. Therefore, we hypothesize that CT and F were more prone to the transport of finer material (clay particles) during soil wetting and drying, leading to a reduction in PMVP due to pore clogging at the intra-aggregate pore scale [17].
Regarding FAMVP (Figure 5b), for the 0 WDC samples, NT significantly differed from F and CT (p≤0.05) [28]. For 12 WDC samples, though, no significant differences were found concerning FAMVP between soil managements, that it, this parameter became more similar among soil managements after 12 WDC. The cycles did not affect FAMVP within the same soil management (p>0.05). This result supports the hypothesis of the porous system's resilience at the intra-agregate scale, particularly the MVP. A significant variation in FAMVP would indicate a change in the MVP's size relative to the aggregate. Notably, the MVP is the dominant pore for water conduction within the aggregate [28]. However, similar to PMVP, there was a downward trend in FAMVP when cycles were applied for F and CT of c. 33% and c. 40%, respectively, and an increase for NT of c. 33%.
The Euler number of the MVP (ENMVP) showed no significant differences between cycles and soil managements (p>0.05), but followed the sequence NT>CT>F for both 0 WDC and 12 WDC, where the higher the ENMVP, the lower the MVP connectivity (Figure 5c). Although not significant, the cycles provided an increase of ENMVP of c. 84% and c. 35% (decrease of connectivity) in F and CT, respectively, and a decrease of c. 68% (increase of connectivity) in NT, reproducing the same pattern observed for EN considering all pores (Figure 3e). A direct relation between porosity (both P and PMVP) and pore connectivity was observed, i.e., the decrease in P and PMVP when comparing 0 and 12 WDC was followed by a reduction of pore connectivity (increase of EN and ENMVP) for F and CT; and vice versa for NT (Figures 3a,e and 5a,c). This finding indicates that, at this level of analysis, the pore connectivity is tied to changes in porosity, in accordance to [25,28,63] It is note-worthy that MVP may stem from the joining of several other smaller pores [64], which can be reduced when the aggregate is subjected to wetting and drying cycles, resulting in more isolated and less connected pores [49]. As noticed in our study, [65] corroborate that WDC can curtail the fraction of conduction pores affecting the pore connectivity and tortuosity.
For the determination of permeability, we considered the tortuosity of the MVP (τMVP) computed based on a local analysis using the skeletonization procedure (Eq. 2). This decision followed the same rationale adopted in [28], to enable a fair comparison considering the effects of WDC on samples from different soil managements. The local analysis-based τMVP (L-τMVP), depicted in Figure 5d in solid colors, followed the trend CT>F>NT for 0 and 12 WDC. Samples under NT showed a significant difference relative to CT (p≤0.05) only for 0 WDC, previously discussed in [28]. For 12 WDC, no significant differences were found concerning the L-τMVP between soil managements, that is, similarly to FAMVP, this parameter became more similar among soil managements after 12 WDC. With the application of the cycles, the L-τMVP was reduced (p>0.05) in F and CT by only c. 3% and c. 4%, respectively, and slightly increased by c. 2% for NT.
To complement this comparison, we also present in Figure 5d (hatched data) the tortuosity of the MVP computed based on the global analysis using the centroid path tortuosity algorithm (G-τMVP), equivalent to that used to compute τ values in Figure 3d for all aggregate pores. As expected, G-τMVP and L-τMVP (Figure 5d) vary in a similar trend, but differ from the trend observed for τ (Figure 3d). That is, while NT had the highest τ values, CT had the highest L-τMVP and G-τMVP values. Therefore, when analyzing the most voluminous pore of each aggregate, which is the pore that dominates the fluid flow at this scale, we found that CT has a more tortuous pore system, and this is a crucial information to assess permeability and hydraulic conductivity.
Concerning the effects of WDC, one could say from the tortuosity analyses that F is more resilient to changes of both τ and L-τMVP or G-τMVP, since the overlap in deviations is more clearly defined for F than for CT and NT (Figure 5d). Particularly, G-τMVP is significantly higher for CT compared to F and NT under 12 WDC. Note that the range of variation for τ and G-τMVP is similar (c. 2 to c. 9) and higher than L-τMVP (<2). This illustrates the importance of comparing image-based parameters considering the same methods [66]. We take a step further to say that in future works, one could choose between using L-τMVP and G-τMVP to calculate the permeability based on Eq. 2, with the benefit that the latter is simpler to compute. However, we consider that the L-τMVP is a more detailed approach for considering the local variations of the tortuosity.
The hydraulic radius of the MVP (R) showed no significant differences (p>0.05) between soil managements and WDC (Figure 5e). The trends observed for 0 and 12 WDC were F>NT>CT. The range of R assessed for all soil managements falls within the classification of storage pores (i.e., R between 0.5 and 25 µm) [36], as corroborated by the frequency distribution of the mean segment radius of the most voluminous pore (MVP). Storage pores hold water against gravity, so as to not drain readily, and contribute to supplying water to plants [67,68]. At the intra-aggregate scale, although no significant differences were observed, CT presented smaller R, and therefore pores that hold water more strongly at the considered scale than the other soil managements. When analyzing the effect of the cycles within the same soil management, only minor differences (p>0.05) were observed between the R values. There were increases of c. 7% and c. 11% for the samples under F and NT, respectively, from 0 to 12 WDC, while it remained stable for CT. It should be mentioned that the criterion to identify outlier samples [28] indicated that only the samples (F12-R4) e (NT12-R5) should be disregarded in the analysis of k and K, due to the more prominent divergence between R and R’ (Figure 6).
The k of the MVP (Figure 5f) showed a pattern similar to R and PMVP and opposite to τMVP, i.e., with F>NT>CT, as we expected based on Eq. 2. Here it should be emphasized that, if the global analysis of tortuosity (τ) considering all pores of each aggregate from Figure 3d was used, the permeability analysis would be biased. To our knowledge, an image-based procedure to evaluate the permeability without focusing on the dominant pore is currently unavailable, and therefore, care should be taken to avoid misinterpretation of the data. Computational fluid dynamics simulations can be used to that purpose, but even so, it will select a continuous path through the sample imaged volume, which is the dominant pore anyways [69]. The K of the MVP (Figure 5g) followed the same pattern as k since these two properties are directly related as showed in Eq. 3. A significant difference in K (p≤0.05) only occurred between soil management CT relative to F, considering 0 WDC [28]. Interestingly, K follows a similar trend to the connectivity of MVP, i.e., an increase in ENMVP (decrease of connectivity) is associated with a decrease in K between 0 and 12 WDC, for F and CT, and vice versa for NT, corroborating the findings of [63].
Although no significant differences were found when the effects of the WDC within the same soil management were analyzed (p>0.05), there was an interesting tendency for K to decrease for F (c. 14%) and CT (c. 50%) and increase for NT (c. 42%). Similar tendencies for conventional and conservation tillage systems were observed by [70] throughout c. eight years. In the same study, for the conventional tillage, the decrease in K was accompanied by a reduction in the internal soil strength and cohesion, which are associated with the homogenization of the pore system in CT during soil breakdown. On the other hand, for the conservation tillage, the increase in K was accompanied by an increase in soil strength and cohesion [70]. Although the pore system in NT is less disturbed than in CT over the years, it also goes through particle rearrangement. [70] provided evidence to support the hypothesis that “the particle rearrangement leads to an increased hydraulic conductivity and air permeability provided that conservation tillage systems have been applied over several years employing light agricultural machinery not to exceed the soil precompression stress (strength).” This author further discussed that, in the conservation tillage site, the external forces applied by agricultural machines are smaller than the maximum internal soil strength and indirectly enhance the mobility and accessibility of particle surfaces. Moreover, [70] pointed out that the reorientation of soil particles by menisci forces is more pronounced in conservation tillage. In line with these findings, [71] concluded that if soils are repeatedly wetted and dried, the translocation of clay particles/colloids and their repeated rearrangement inside aggregates by menisci forces result in stronger and less dense aggregates, with improved pore continuity and increased water and air permeability. These observations are in agreement with our data. Note that in CT, the soil breakdown increases the chances of releasing subunit aggregates in addition to elementary particles, possibly resulting in pore clogging and consequent reduction in K.
For a more detailed assessment of the variability of the soil pore system at the scale of the aggregates studied, pore size distributions were analyzed concerning the mean segment radius (Figure 7) and segment tortuosity (Figure 8) determined by the skeletonization analysis of the MVP. In the case of samples from F with 0 WDC, the most substantial variability for the mean segment radius between samples was found up to c. 40 μm. The application of 12 WDC tended to reduce the variability between samples from F, but it occurred until c. 50 μm (Figure 7a,b). For the samples under CT (Figure 7c,d) and NT (Figure 7e,f), minor variability was observed between the samples, which mostly occurred for the mean segment radius up to c. 40 μm, for both 0 and 12 WDC. Therefore, although intra-aggregate pores are in general typically resilient to changes [28] our results show that samples from F seem to be the least resilient to modifications in the MVP radii caused by the application of WDC. This result is interesting because earlier in the text we discussed how F was the more resilient soil management, among those studied here, to changes in τ and τMVP due to WDC (Figure 3d and 5d). Integrating these observations, intra-aggregate pores of F samples tend to be more resilient to changes of tortuosity (from both global and local analyses) and, contrastingly, more prone to changes in radii of the MVP (from a local analysis) than CT and NT due to application of WDC. In addition, we also discussed earlier that our results seem to show that FD and τ are oppositely related. Therefore, one could also say that intra-aggregate pores of F samples tend to be more complex and less tortuous (based on global analyses) than CT and NT. Interestingly, the frequency curve of average segment radius is more steep in CT than F and NT, in both 0 and 12 WDC, showing the prevalence of smaller pore segments in CT (Figure 7), which is in accordance with the smaller hydraulic radius found for CT in both 0 and 12 WDC (Figure 5e).
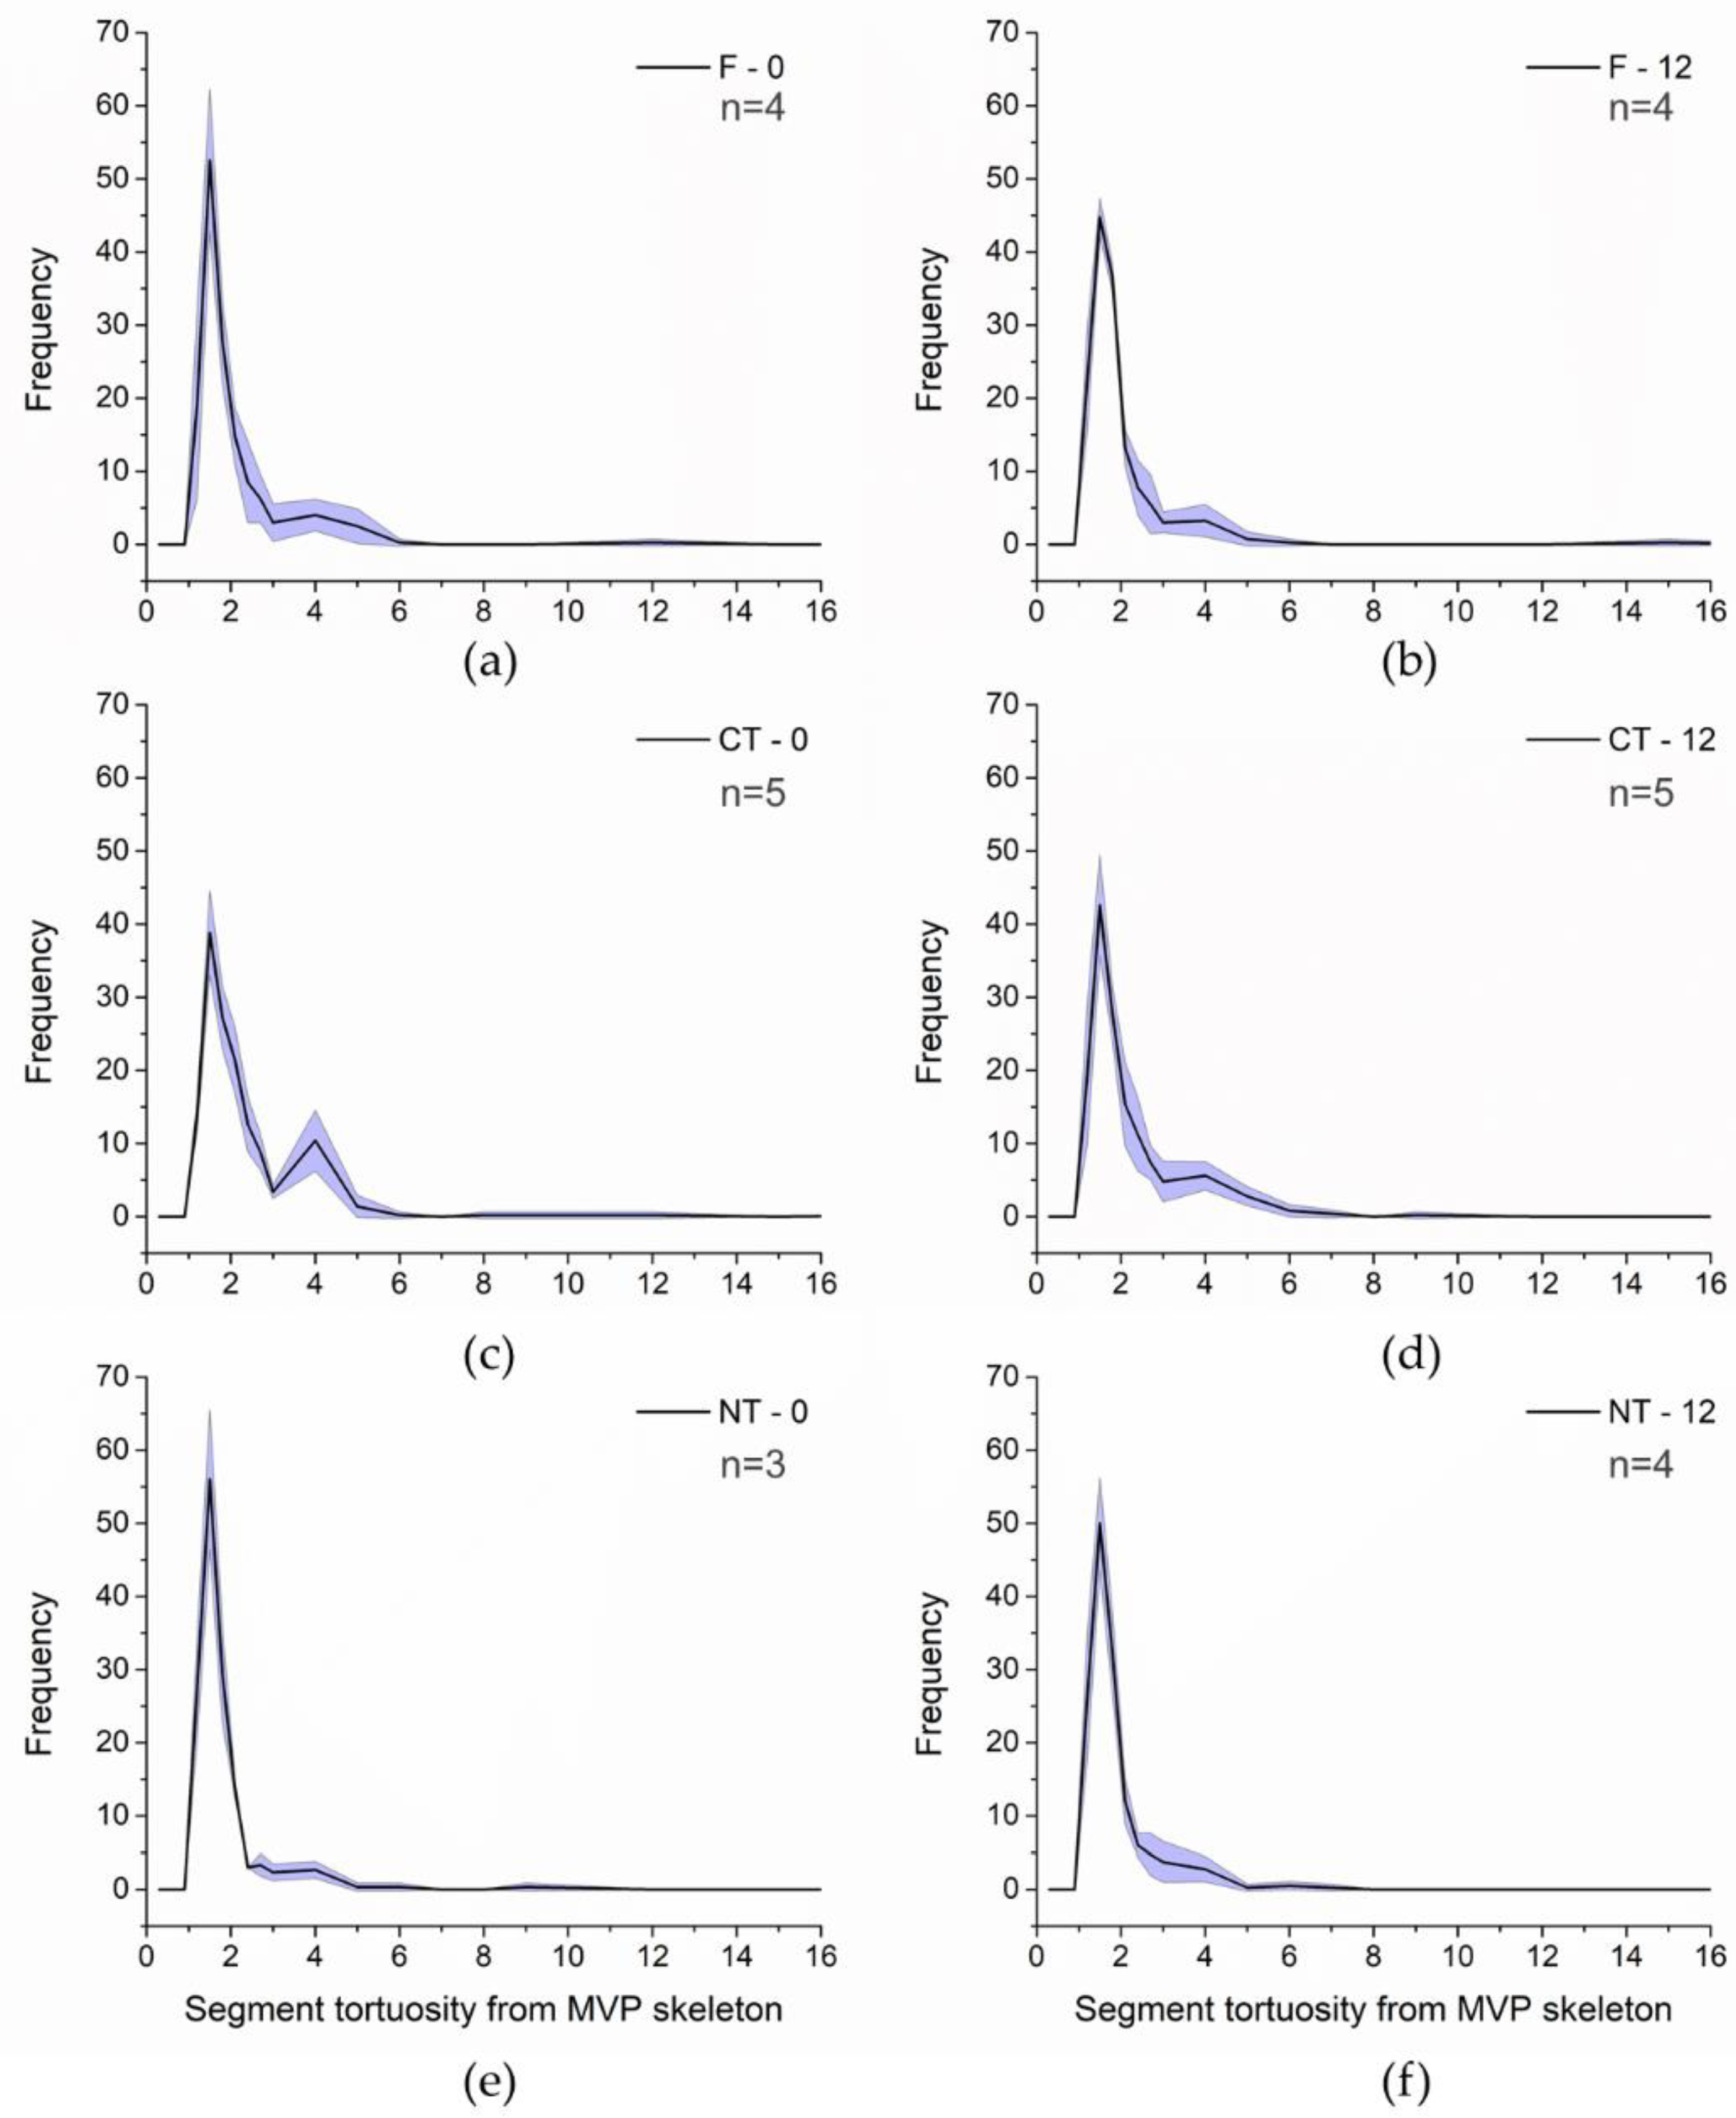
Regarding the frequency distribution for τ of MVP skeleton segments (Figure 8), overall small variability between samples with a slight tendency for a bimodal distribution was found for F under 0 and 12 WDC (Figure 8a,b). For both 0 and 12 WDC, the most common value of τ was c. 2, and it should be recalled that the mean values from these distributions are those presented in Figure 5d (data shown in solid colors). In the case of the samples under CT (Figure 8c,d), the bimodality of τ distribution was more evident among the samples, especially for the 0 WDC [28]. The most frequent value for the first peak was close to 2, while for the second peak it was close to 4. For CT, a more substantial variability between samples was observed close to the second peak, although with a lower frequency with respect to the first peak. The fact that the MVP shows two or more peaks for τ (per skeleton segment) indicates that the MVP in aggregates from this soil management has more tortuous segments, as reflected in the τMVP (Figure 5d). In the case of the samples under NT (Figure 8e,f), the bimodal character in the distribution of τ was the least pronounced among soil managements. The distributions for these samples were more similar to those under F (Figure 8a,b). As observed for the F samples, the most common value of τ for NT was around 2. The broader distribution of τ values for the samples under CT (Figure 8c,d) indicates that the porous system of the MVP tends to hinder the flow of solutes [72]. This result agrees with the lower K values (Figure 5g) observed for CT [28]. In another study, [73] also found lower conductivities in more tortuous porous media, in accordance with our results. According to these authors, the decrease in connections between pores tends to increase τ, directly influencing K. This influence be-tween connectivity and K for the MVP of intra-aggregate pores was also observed in our studies, as previously reported.
4. Conclusions
This study complements our previous one [28] by showing that, besides being resilient to changes in pore structure due to soil management types, the pore system of 2-4 mm soil aggregates is also resilient to changes due to wetting and drying cycles (WDC). Several properties were investigated at the intra-aggregate scale, and none presented significant differences between 0 and 12 WDC for each soil management type, among them: imaged porosity, number of pores, fractal dimension, tortuosity (both global for all pores and local for MVP), connectivity, fraction of the aggregate occupied by the MVP, hydraulic radius, permeability, and hydraulic conductivity. However, some interesting associated effects were found, i.e., comparing soil management types after 12 WDCs. For instance, under 12 WDC, F samples became more porous than CT and NT samples; the pore system of NT samples became less complex (FD) and more tortuous (from a global analysis considering all pores) than CT and F samples. On the other hand, some parameters that had presented significant differences between soil managements under 0 WDC became not significant under 12 WDC, for instance, the fraction of the aggregate occupied by the MVP, the tortuosity of the MVP (local analysis), permeability, and hydraulic conductivity. Although not significant, some observations point to the importance of future studies considering the effects of soil management types and WDC on the soil intra-aggregate pore structure. For instance, the continuous application of WDC in NT tends to promote similar intra-aggregate pore connectivity compared to F and slightly more connected intra-aggregate pore structure compared to CT; CT presented a smaller hydraulic radius, which holds water more strongly at the considered scale, as well as smaller permeability and hydraulic conductivity. More particularly, although also not significant, permeability and hydraulic conductivity decreased c. 50% in CT and increased c. 42% in NT due to the 12 WDC application, which, according to the literature, may be associated with differences in soil strength. The range of hydraulic radius found in our study was in the storage pore classification, but distributions of the mean segment radius from the MVP skeletonization showed radius varying up to 50 µm, including a few radius sizes classified as transmission pores. In this context, samples from F were the least resilient to modifications in the MVP radii caused by the application of WDC, and the distribution curves from CT show the prevalence of smaller pores. Moreover, a broader distribution of segment tortuosity from the MVP skeleton was found for CT. Therefore, our result suggests that CT soil management type is associated with a less efficient transport of fluids and the physical quality of the soil. However, we recognize that further investigation should be conducted, remarkably increasing the number of samples and different soil types to investigate the effect of WDC.
Author Contributions
EA: Conceptualization, Data curation; Formal Analysis, Investigation, Methodology, Project administration, Software, Visualization, Writing – original draft, Writing – review & editing; TRF: Conceptualization, Data curation; Investigation; Methodology, Resources, Software, Supervision, Validation, Visualization, Writing – original draft, Writing – review & editing JVG: Investigation, Methodology, Visualization, Writing – original draft; LFP: Conceptualization, Funding acquisition, Investigation, Methodology, Project administration, Resources, Supervision, Writing – original draft, Writing – review & editing.
Funding
This research was partially funded by “Conselho Nacional de Desenvolvimento Científico e Tecnológico” (CNPq) (Grants 303950/2023-4 and 404058/2021-3) and “Coordenação de Aperfeiçoamento de Pessoal de Nível Superior” (Capes) (Grant Code 001).
Institutional Review Board Statement
Not applicable.
Data Availability Statement
All data are available upon reasonable request to andradeeverton789@gmail.com.
Acknowledgments
This research used facilities of the Brazilian Synchrotron Light Laboratory (LNLS), part of the Brazilian Center for Research in Energy and Materials (CNPEM), a private non-profit organization under the supervision of the Brazilian Ministry for Science, Technology, and Innovations (MCTI). The IMX beamline staff is acknowledged for the assistance during the experiments [proposal numbers: 20180217 (IMX beamline); 20230012 (HPC-TEPUI)]. EA, JVG, and LFP would like to acknowledge the financial support provided by the Coordination for the Improvement of Higher Education Personnel (Capes) for the research grant (Code 001), the Brazilian National Nuclear Energy Commission (CNEN) for the MS research grant (Grant 000223.0011675/2021), and the Brazilian National Council for Scientific and Technological Development (CNPq) through the Grants 304925/2019-5 and 404058/2021-3.
Conflicts of Interest
The authors declare no conflict of interest.
Abbreviations
The following abbreviations are used in this manuscript:
F Forest
NT No-tillage
CT Conventional tillage
WDC Wetting and drying cycles
XCT X-ray computed tomography
P Image-based porosity
Vp Volume of pores
Vt Total sample volume
NP/V Number of pores divided by volume
FD Fractal dimension
k Permeability
K Hydraulic conductivity
EN Euler number
β Shape factor
τ Tortuosity
AMVP Surface area
IBP-KC Parametrization of the Kozeny-Carman equation
MVP Most voluminous pore of a soil aggregate
VMVP Volume of most voluminous pore
Vsb Subvolume of the aggregate containing the MVP
PMVP Porosity of a sub volume of the aggregate due to the MVP
R Hydraulic radius
R’ Alternative mean hydraulic radius
ENMVP Euler Number of the most voluminous pore
L-τMVP Tortuosity of the MVP determined by skeletonization methods
G-τMVP Tortuosity of the MVP determined by centroid path methods
Le Length of the sinuous segment
L Length of the straight segment
ρ Water density
g Acceleration of gravity
μ Water dynamic viscosity
τMVP Tortuosity of the MVP
FAMVP Fraction of the aggregate occupied by the MVP
References
- Lampurlanés, J.; Cantero-Martínez, C. Hydraulic conductivity, residue cover and soil surface roughness under different tillage systems in semiarid conditions. Soil and Tillage Research. 2006, 85, 13–26. [Google Scholar] [CrossRef]
- Kumar, V.; Saharawat, Y.; Gathala, M.; Jat, M.; Singh, S.; Chaudhary, N. Effect of different tillage and seeding methods on energy use efficiency and productivity of wheat in the Indo-Gangetic Plains. Field Crops Research. 2013, 142, 1–8. [Google Scholar] [CrossRef]
- Colombo, F.; Macdonald, C.; Jeffries, T.; Powell, J.; Singh, B. Impact of forest management practices on soil bacterial diversity and consequences for soil processes. Soil Biol. Biochem. 2015, 94, 200–210. [Google Scholar] [CrossRef]
- Galindo, V.; Giraldo, C.; Lavelle, P.; Armbrecht, I.; Fonte, S.J. Land use conversion to agriculture impacts biodiversity, erosion control, and key soil properties in an Andean watershed. Ecosphere. 2022, 13, 3979. [Google Scholar] [CrossRef]
- Klooster, D.; Masera, O. Community forest management in Mexico: carbon mitigation and biodiversity conservation through rural development. Global environmental change. 2000, 10, 259–272. [Google Scholar] [CrossRef]
- Houshyar, E.; Grundmann, P. Environmental impacts of energy use in wheat tillage systems: A comparative life cycle assessment (LCA) study in Iran. Energy. 2017, 122, 11–24. [Google Scholar] [CrossRef]
- Lal, R. Restoring soil quality to mitigate soil degradation. Sustainability. 2015, 7, 5875–5895. [Google Scholar] [CrossRef]
- Galdos, M. V.; Pires, L. F.; Cooper, H. V.; Calonego, J. C.; Rosolem, C. A.; Mooney, S. J. Assessing the long-term effects of zero-tillage on the macroporosity of Brazilian soils using X-ray Computed Tomogra-phy. Geoderma. 2019, 337, 1126–1135. [Google Scholar] [CrossRef] [PubMed]
- Morillas, L.; Portillo-estrada, M.; Gallardo, A. Wetting and drying events determine soil N pools in two Mediterranean ecosystems. Applied Soil Ecology. 2013, 72, 161–170. [Google Scholar] [CrossRef]
- Shekhar, S.; Mailapalli, D.; Raghuwanshi, N.; Das, B. Hydrus-1D model for simulating water flow through paddy soils under alternate wetting and drying irrigation practice. Paddy and Water Environment. 2019, 18, 73–85. [Google Scholar] [CrossRef]
- Ma, R.; Cai, C.; Li, Z.; Wang, J.; Xiao, T.; Peng, G.; Yang, W. Evaluation of soil aggregate microstructure and stability under wetting and drying cycles in two Ultisols using synchrotron-based X-ray micro-computed tomography. Soil and Tillage Research. 2015, 149, 1–11. [Google Scholar] [CrossRef]
- Diel, J.; Vogel, H.; Schlüter, S. Impact of wetting and drying cycles on soil structure dynamics. Geoderma 2019, 345, 63–71. [Google Scholar] [CrossRef]
- Fang, H.; Zhou, H.; Norton, G.J.; Price, A.H.; Raffan, A.C.; Mooney, S.J.; Peng, X.; Hallett, P.D. Interaction between contrasting rice genotypes and soil physical conditions induced by hydraulic stresses typical of alternate wetting and drying irrigation of soil. Plant and soil. 2018, 430, 233–243. [Google Scholar] [CrossRef] [PubMed]
- Carrijo, D.R.; Akbar, N.; Reis, A.F.B.; Li, C.; Gaudin, A.C.M.; Parikh, S.J.; Linquist, B.A. Impacts of variable soil drying in alternate wetting and drying rice systems on yields, grain arsenic concentration and soil moisture dynamics. Field Crops Res. 2018, 222, 101–110. [Google Scholar] [CrossRef]
- Price, A.H.; Norton, G.J.; Salt, D.E.; Ebenhoeh, O.; Meharg, A.A.; Meharg, C.; Davies, W.J. Alternate wetting and drying irrigation for rice in Bangladesh: Is it sustainable and has plant breeding something to offer? Food and Energy Security. 2013, 2, 120–129. [Google Scholar] [CrossRef]
- Reddi, L.; Ming, X.; Hajra, M.; Lee, I. Permeability reduction of soil filters due to physical clogging. Journal of geotechnical and geoenvironmental engineering, 2000, 126, 236–246. [Google Scholar] [CrossRef]
- Tseng, C. L.; Alves, M. C.; Crestana, S. Quantifying physical and structural soil properties using X-ray microtomography. Geoderma. 2018, 318, 78–87. [Google Scholar] [CrossRef]
- Soto-Gomez, D.; Perez-Rodriguez, P.; Juiz, L. V.; Paradelo, M.; Lopez-Periago, J. E. 3D multifractal characterization of computed tomography images of soils under different tillage management: Linking multifractal parameters to physical properties. Geoderma. 2020, 363, 114129. [Google Scholar] [CrossRef]
- Piccoli, I.; Camarotto, C.; Lazzaro, B.; Furlan, L.; Morari, F. Conservation agriculture had a poor impact on the soil porosity of Veneto low-lying plain silty soils after a 5-year transition period. Land Degradation & Development. 2017, 28, 2039–2050. [Google Scholar] [CrossRef]
- Carson, J.K.; Gonzalez-Quiñones, V.; Murphy, D.V.; Hinz, C.; Shaw, J.A.; Gleeson, D.B. Low pore connectivity increases bacterial diversity in soil. Appl. Environ. Microbiol. 2010, 76, 3936–3942. [Google Scholar] [CrossRef] [PubMed]
- Ghanbarian, B.; Hunt, A.G.; Ewing, R.P.; Sahimi, M. Tortuosity in porous media: a critical review. Soil science society of America journal. 2013, 77, 1461–1477. [Google Scholar] [CrossRef]
- Lu, S.F.; Han, Z.J.; Xu, L.; Lan, T.G.; Wei, X.; Zhao, T.Y. On measuring methods and influencing factors of air permeability of soils: An overview and a preliminary database. Geoderma. 2023, 435, 116509. [Google Scholar] [CrossRef]
- Dal Ferro, N.; Charrier, P.; Morari, F. Dual-scale micro-CT assessment of soil structure in a long-term fertilization experiment. Geoderma 2013, 204, 84–93. [Google Scholar] [CrossRef]
- Kravchenko, A. N.; Negassa, W. C.; Guber, A. K.; Rivers, M. L. Protection of soil carbon within macro-aggregates depends on intra-aggregate pore characteristics. Scientific Reports. 2015, 5(1), 16261. [Google Scholar] [CrossRef] [PubMed]
- Jarvis, N. J.; Larsbo, M.; Koestel, J. Connectivity and percolation of structural pore networks in a cultivated silt loam soil quantified by X-ray tomography. Geoderma. 2017, 287, 71–79. [Google Scholar] [CrossRef]
- Hillel, D. Introduction to environmental soil physic. Elsevier Science, San Diego, California, 2003. [CrossRef]
- Yudina, A.; Kuzyakov, Y. Dual nature of soil structure: The unity of aggregates and pores. Geoderma. 2023, 434, 116478. [Google Scholar] [CrossRef]
- Ferreira, T. R.; Archilha, N. L.; Cássaro, F. A.M.; Pires, L.F. How can pore characteristics of soil aggregates from contrasting tillage systems affect their intrinsic permeability and hydraulic conductivity? Soil & Tillage Research. 2023, 230, 105704. [Google Scholar] [CrossRef]
- Wang, W.; Kravchenko, A. N.; Smucker, A. J. M.; Liang, W.; Rivers, M. L. Intra-aggregate pore characteristics: X-ray computed microtomography analysis. Soil Science Society of America Journal. 2012, 76(4), 1159–1171. [Google Scholar] [CrossRef]
- Tang, C. S.; Cheng, Q.; Gong, X.; Shi, B.; Inyang, H. I. Investigation on microstructure evolution of clayey soils: A review focusing on wetting/drying process. Journal of Rock Mechanics and Geotechnical Engineering. 2023, 15(1), 269–284. [Google Scholar] [CrossRef]
- Borges, J.A.; Pires, L.F.; Cassaro, F.A.; Auler, A.C.; Rosa, J.A.; Heck, R.J.; Roque, W.L. X-ray computed tomography for assessing the effect of tillage systems on topsoil morphological attributes. Soil Tillage Res. 2019, 189, 25–35. [Google Scholar] [CrossRef]
- Pires, L. F.; Ferreira, T. R.; Cássaro, F. A.; Cooper, H. V.; Mooney, S. J. A comparison of the differences in soil structure under long-term conservation agriculture relative to a secondary forest. Agriculture. 2022, 12(11), 1783. [Google Scholar] [CrossRef]
- Soil Survey Staff. Simplified Guide to Soil Taxonomy. 2013, USDA-Natural Resources Conservation Service, National Soil Survey Center, Lincoln, USA. Conservation Service, National Soil Survey Center, Lincoln, USA.
- Shaheb, M.R.; Venkatesh, R.; Shearer, S.A. A review on the effect of soil compaction and its management for sustainable crop production. J. Biosyst. Eng. 2021, 46, 417–439. [Google Scholar] [CrossRef]
- Provenzano, G.; Rallo, G.; Ghazouani, H. Assessing field and laboratory calibration protocols for the diviner 2000 probe in a range of soils with different textures. J. Irrig. Drain. Eng. 2016, 142, 04015040. [Google Scholar] [CrossRef]
- Greenland, D.J. Soil damage by intensive arable cultivation: temporary or permanent? Philosophical Transactions of the Royal Society of London. Biological Sciences. 1977, 281(980), 193–208. [Google Scholar] [CrossRef]
- Spina, T. V.; Vasconcelos, G.J.Q.; Goncalves, H.M.; Libel, G.C.; Pedrini, H.; Carvalho, T.J.; Archilha, N.L. Towards Real Time Segmentation of Large-Scale 4D Micro/Nanotomography Images in the Sirius Synchrotron Light Source. Microsc. Microanal. 2018, 24, 92–93. [Google Scholar] [CrossRef]
- Ferreira, T.R.; Archilha, N.L.; Pires, L.F. An analysis of three XCT-based methods to determine the intrinsic permeability of soil aggregates. Journal of Hydrology. 612, 128024. [CrossRef]
- Lehmann, P.; Wyss, P.; Flisch, A.; Lehmann, E.; Vontobel, P.; Krafczyk, M.; Kaestner, A.; Beckmann, F.; Gygi, A.; Fluhler, H. Tomographical imaging and mathematical description of porous media used for the prediction of fluid distribution. Vadose Zo. 2006, J. 5, 80–97. [Google Scholar] [CrossRef]
- Brooks, R.H.; Corey, A.T. Properties of porous media affecting fluid flow. J. Irrig. Drain. Div. 1966, 92, 61–88. [Google Scholar] [CrossRef]
- Zhang, Y.; Schaap, M.G. Estimation of saturated hydraulic conductivity with pedotransfer functions: A review. J. Hydrol. 2019, 575, 1011–1030. [Google Scholar] [CrossRef]
- Regelink, I. C.; Stoof, C. R.; Rousseva, S.; Weng, L.; Lair, G. J.; Kram, P.; Nikolaidis, N.P.; Kercheva, M.; Banwart, S.; Comans, R. N. Linkages between aggregate formation, porosity and soil chemical properties. Geoderma. 2015, 247, 24–37. [Google Scholar] [CrossRef]
- Fernández-Ugalde, O.; Barré, P.; Hubert, F.; Virto, I.; Girardin, C.; Ferrage, E.; Chenu, C. Clay mineralogy differs qualitatively in aggregate-size classes: clay-mineral-based evidence for aggregate hierarchy in temperate soils. European journal of soil science. 2013, 64(4), 410–422. [Google Scholar] [CrossRef]
- Schlüter, S.; Leuther, F.; Vogler, S.; Vogel, H. J. X-ray microtomography analysis of soil structure deformation caused by centrifugation. Solid Earth. 2016, 7(1), 129–140. [Google Scholar] [CrossRef]
- Spaccini, R.; Zena, A.; Igwe, C. A.; Mbagwu, J. S. C.; Piccolo, A. Car-bohydrates in water-stable aggregates and particle size fractions of forested and cultivated soils in two contrasting tropical ecosystems. Biogeochemistry, 2001, 53, 1–22. [Google Scholar] [CrossRef]
- Su, Z.; Zhang, J.; Wu, W.; Cai, D.; Lv, J.; Jiang, G.; Huang, J.; Gao, J.J.; Hartmann, R.; Gabriels, D. Effects of conservation tillage practices on winter wheat water-use efficiency and crop yield on the Loess Plateau, China. Agricultural Water Management. 2007, 87(3), 307–314. [Google Scholar] [CrossRef]
- Park, E.J.; Smucker, A.J.M. Saturated Hydraulic Conductivity and Porosity within Macroaggregates Modified by Tillage. Soil Science Society of America. 2005, 69, 38–45. [Google Scholar] [CrossRef]
- Guo, X. M.; Guo, N.; Liu, L. Effects of Wetting-Drying Cycles on the CT-Measured Macropore Characteristics under Farmland in Northern China. 2023, Eurasian Soil Science, 1-9. [CrossRef]
- Wen, T.; Chen, X.; Shao, L. Effect of multiple wetting and drying cycles on the macropore structure of granite residual soil. Journal of Hydrology. 2022, 614, 128583. [Google Scholar] [CrossRef]
- de Oliveira, J.A.; Cássaro, F.A.; Posadas, A.N.; Pires, L.F. Soil pore network complexity changes induced by wetting and drying cycles—a study using X-ray microtomography and 3D multifractal analyses. Int. J. Environ. Res. Public Health 2022, 19. [Google Scholar] [CrossRef] [PubMed]
- Gaspareto, J. V.; Oliveira, J. A. D.; Andrade, E.; Pires, L. F. Representative Elementary Volume as a Function of Land Uses and Soil Processes Based on 3D Pore System Analysis. Agriculture. 2013, 13(3), 736. [Google Scholar] [CrossRef]
- Zhang, S. J.; Tang, Q.; Bao, Y. H.; He, X. B.; Tian, F. X.; Lü, F. Y.; Wang, M.F.; Anjum, R. Effects of seasonal water-level fluctuation on soil pore structure in the Three Gorges Reservoir, China. Journal of Mountain Science. 2018, 15(10), 2192–2206. [Google Scholar] [CrossRef]
- Muñoz, F. J.; San Jose Martinez, F.; Caniego, F. J. Fractal parameters of pore space from CT images of soils under contrasting management practices. Fractals. 2014, 22(03), 1440011. [Google Scholar] [CrossRef]
- Ferreira, T. R.; Pires, L. F.; Wildenschild, D.; Brinatti, A. M.; Borges, J. A.; Auler, A. C.; dos Reis, A. M. Lime application effects on soil aggregate properties: Use of the mean weight diameter and synchrotron-based X-ray μCT techniques. Geoderma. 2019, 338, 585–596. [Google Scholar] [CrossRef]
- Lee, B. H.; Lee, S. K. Effects of specific surface area and porosity on cube counting fractal dimension, lacunarity, configurational entropy, and permeability of model porous networks: Random packing simulations and NMR micro-imaging study, Journal of Hydrology. 2013, 496, 122–141. [CrossRef]
- Zhang, Y.; Yang, Z.; Wang, F.; Zhang, X. Comparison of soil tortuosity calculated by different methods. Geoderma. 2021, 402, 115358. [Google Scholar] [CrossRef]
- Matyka, M.; Koza, Z. How to Calculate Tortuosity Easily? AIP Conf. Proc. 2012, 1453, 17–22. [Google Scholar] [CrossRef]
- Duhour, A.; Costa, C.; Momoa, F.; Falco, L.; Malacalza, L. Response of eart worm communities to soil disturbance: Fractal dimension of soil and species’ rank-abundance curves. Applied Soil Ecology. 2009, 43, 83–88. [Google Scholar] [CrossRef]
- Peth, S.; Horn, R.; Beckmann, F.; Donath, T.; Fischer, J.; Smucker, A. J.M. Three-Dimensional Quantification of Intra-Aggregate Pore-Space Features using Synchrotron-Radiation-Based Microtomography. Soil Science Society of America Journal. 2008, 72(4), 897–907. [Google Scholar] [CrossRef]
- Leij, F. J.; Ghezzehei, T. A.; Or, D. Modeling the dynamics of the soil pore-size distribution. Soil and Tillage Research. 2002, 64(1-2), 61-78. [CrossRef]
- Udawatta, R. P.; Anderson, S. H.; Gantzer, C. J.; Garrett, H. E. Agroforestry and grass buffer influence on macropore characteristics: a computed tomography analysis. Soil Science Society of America Journal. 2006, 70(5), 1763–1773. [Google Scholar] [CrossRef]
- Pires, L. F.; Roque, W. L.; Rosa, J. A.; Mooney, S. J. 3D analysis of the soil porous architecture under long term contrasting management systems by X-ray computed tomography. Soil and Tillage Research. 2019, 191, 197–206. [Google Scholar] [CrossRef]
- An, R.; Kong, L.; Zhang, X.; Li, C. Effects of dry-wet cycles on three-dimensional pore structure and permeability characteristics of granite residual soil using X-ray micro computed tomography. J. Rock Mech. Geotech. Eng. 2022, 14, 851–860. [Google Scholar] [CrossRef]
- Zhang, L.; Qi, S.; Ma, L.; Guo, S.; Li, Z. , Li, G., Yang, J.; Zou, Y.; Tonglu Li, T.; Hou, X. Three-dimensional pore characterization of intact loess and compacted loess with micron scale computed tomography and mercury intrusion porosimetry. Scientific Reports. 2020, 10(1), 8511. [Google Scholar] [CrossRef] [PubMed]
- Messing, I.; Jarvis, N. J. Temporal variation in the hydraulic conductivity of a tilled clay soil as measured by tension infiltrometers. Journal of Soil Science. 1993, 44(1), 11–24. [Google Scholar] [CrossRef]
- Holzer, L.; Marmet, P.; Fingerle, M.; Wiegmann, A.; Neumann, M.; Schmidt, V. Tortuosity and Microstructure Effects in Porous Media: Classical Theories, Empirical Data and Modern Methods. Springer. 2023, 333, 198. [Google Scholar] [CrossRef]
- Pagliai, M.; Vignozzi, N.; Pellegrini, S. Soil structure and the effect of management practices. Soil and Tillage Research. 2004, 79, 131–143. [Google Scholar] [CrossRef]
- Lal, R.; Shukla, M.K. Principles of soil physics. 2004. CRC Press. [CrossRef]
- Gerke, K. M. ; Marina V Karsanina. Pore-scale modelling of flow and transport phenomena in soils, 2023. [Google Scholar] [CrossRef]
- Horn, R. Time dependence of soil mechanical properties and pore functions for arable soils. Soil Science Society of America journal. 2004, 68(4), 1131–1137. [Google Scholar] [CrossRef]
- Horn, R.; Dexter, A.R. Dynamics of soil aggregation in an irrigated desert loess. Soil & tillage research. [CrossRef]
- Vogel, H. J. Morphological determination of pore connectivity as a function of pore size using serial sections. European Journal of Soil Science. 1997, 48(3), 365–377. [Google Scholar] [CrossRef]
- Gharedaghloo, B.; Price, J. S.; Rezanezhad, F.; Quinton, W. L. Evaluating the hydraulic and transport properties of peat soil using pore network modeling and X-ray micro computed tomography. Journal of Hydrology. 2018, 561, 494–508. [Google Scholar] [CrossRef]
Figure 1.
Illustration of the process of selecting a sub volume of an aggregate containing the most voluminous pore (MVP). (a) Aggregate and MVP, (b) sub volume of the aggregate containing the MVP, and (c) MVP.
Figure 1.
Illustration of the process of selecting a sub volume of an aggregate containing the most voluminous pore (MVP). (a) Aggregate and MVP, (b) sub volume of the aggregate containing the MVP, and (c) MVP.
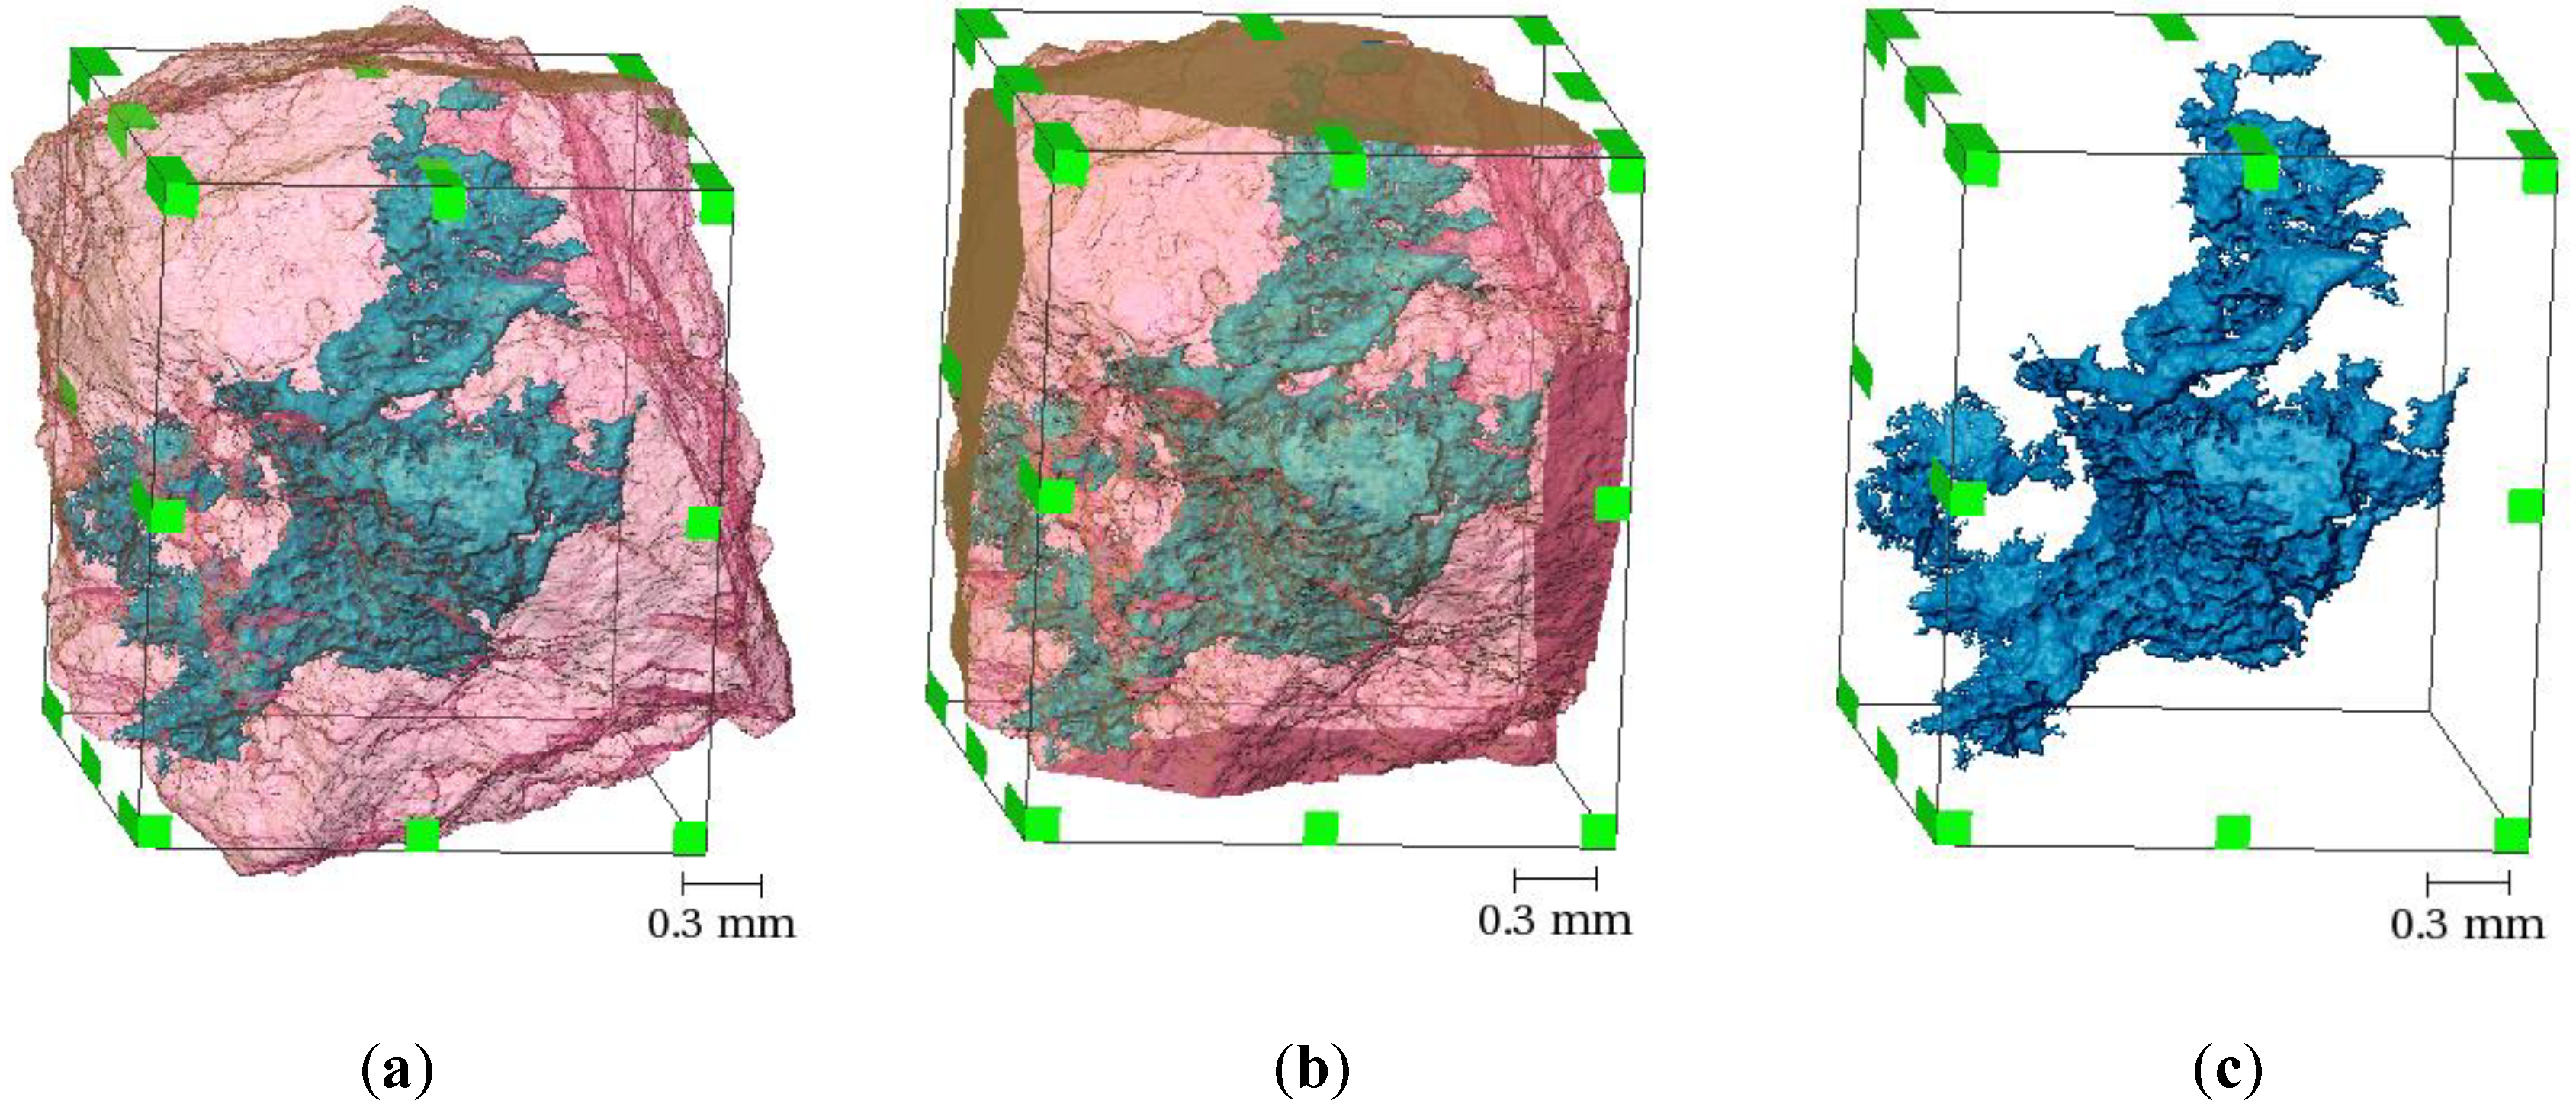
Figure 2.
Diagram of the procedures adopted for the analyses.

Figure 3.
Changes in: (a) image porosity (P), (b) number of pores divided by volume (NP/V), (c) fractal dimension (FD), (d) pore tortuosity (τ), and (e) Euler Number (EN) for the samples subjected to 0 and 12 wetting and drying cycles (WDC). τ and EN are global analyses, i.e., consider all pores of each aggregate. The different soil managements investigated were secondary forest (F), conventional tillage (CT), and no-tillage (NT). Different mean values represented by Latin letters with an asterisk and without an asterisk indicate significant differences (p≤0.05) between the soil managements for the samples under 0 and 12 WDC, respectively. Mean values represented by different Greek letters indicate significant differences (p≤0.05) between 0 and 12 WDC within the same soil management. Data of P and EN for the 0 WDC under F, CT, and NT were addressed in [28] and are used here for reference purposes.
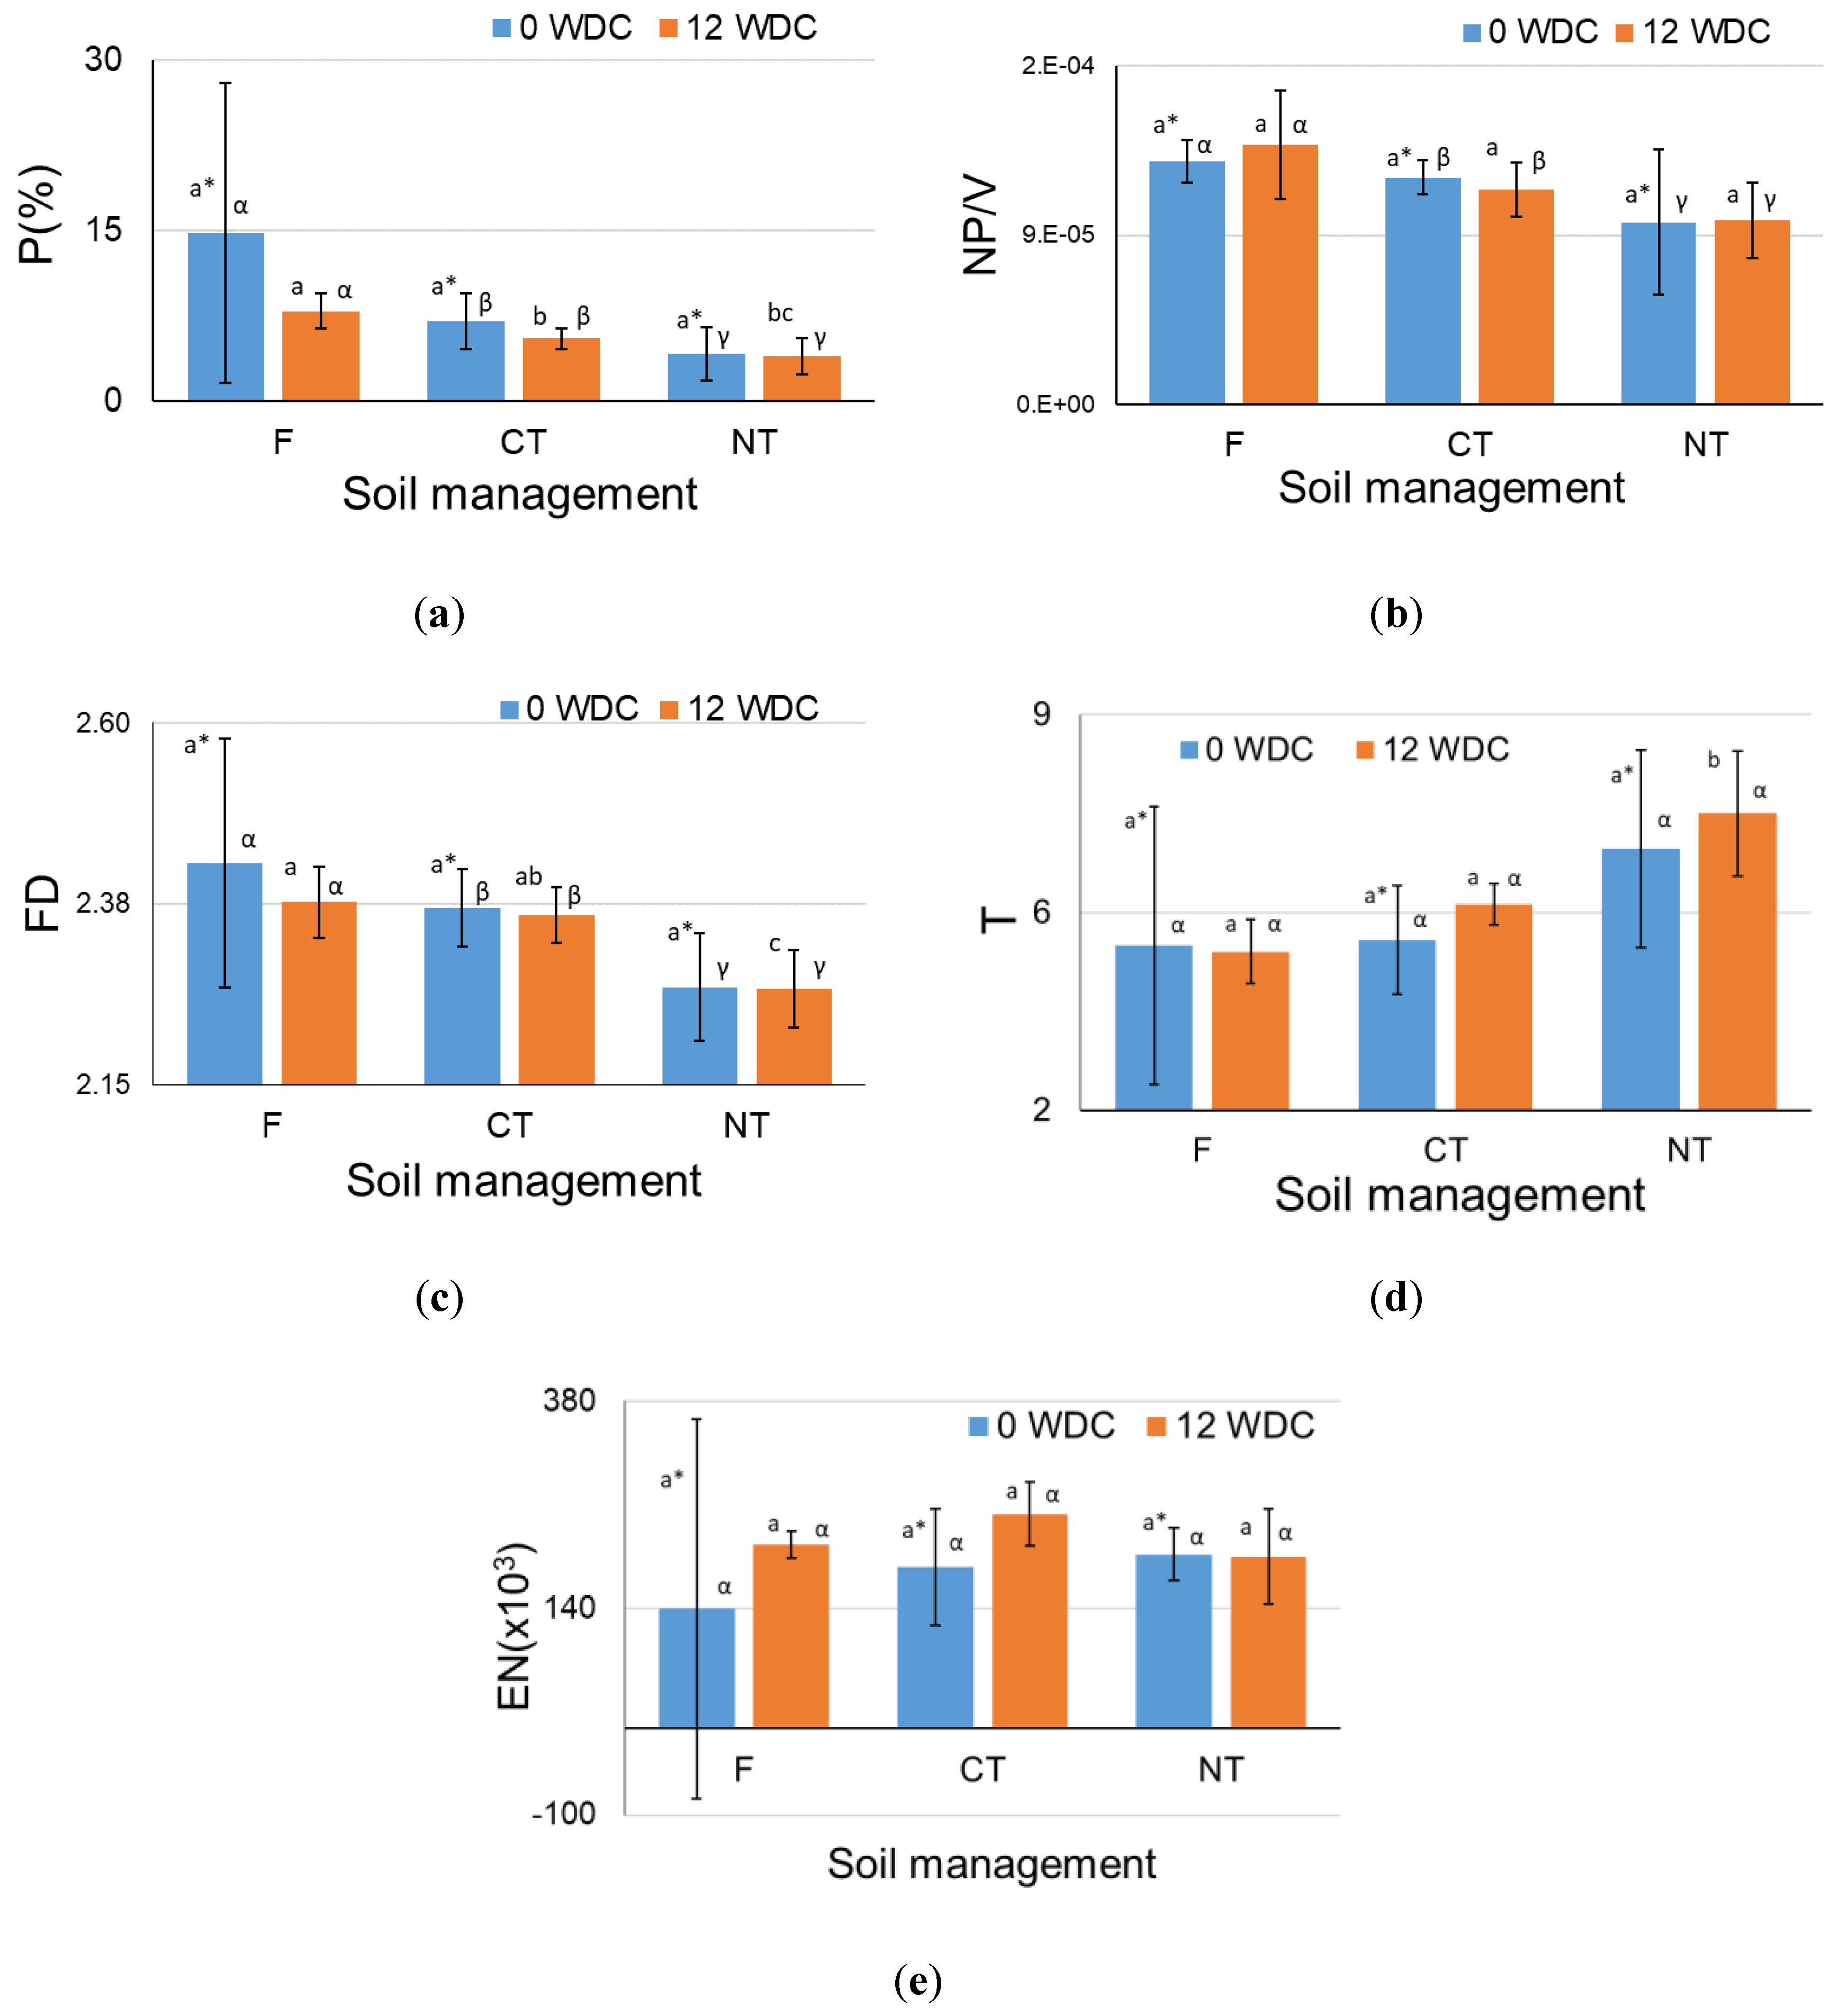
Figure 4.
3D renderings of the porous system (blue) of aggregate samples from each soil management: Forest (F), conventional tillage (CT), and no-tillage (NT), under 0 and 12 WDC (wetting and drying cycles). Samples from 0 and 12 WDC within the same soil management are not the same.
Figure 4.
3D renderings of the porous system (blue) of aggregate samples from each soil management: Forest (F), conventional tillage (CT), and no-tillage (NT), under 0 and 12 WDC (wetting and drying cycles). Samples from 0 and 12 WDC within the same soil management are not the same.
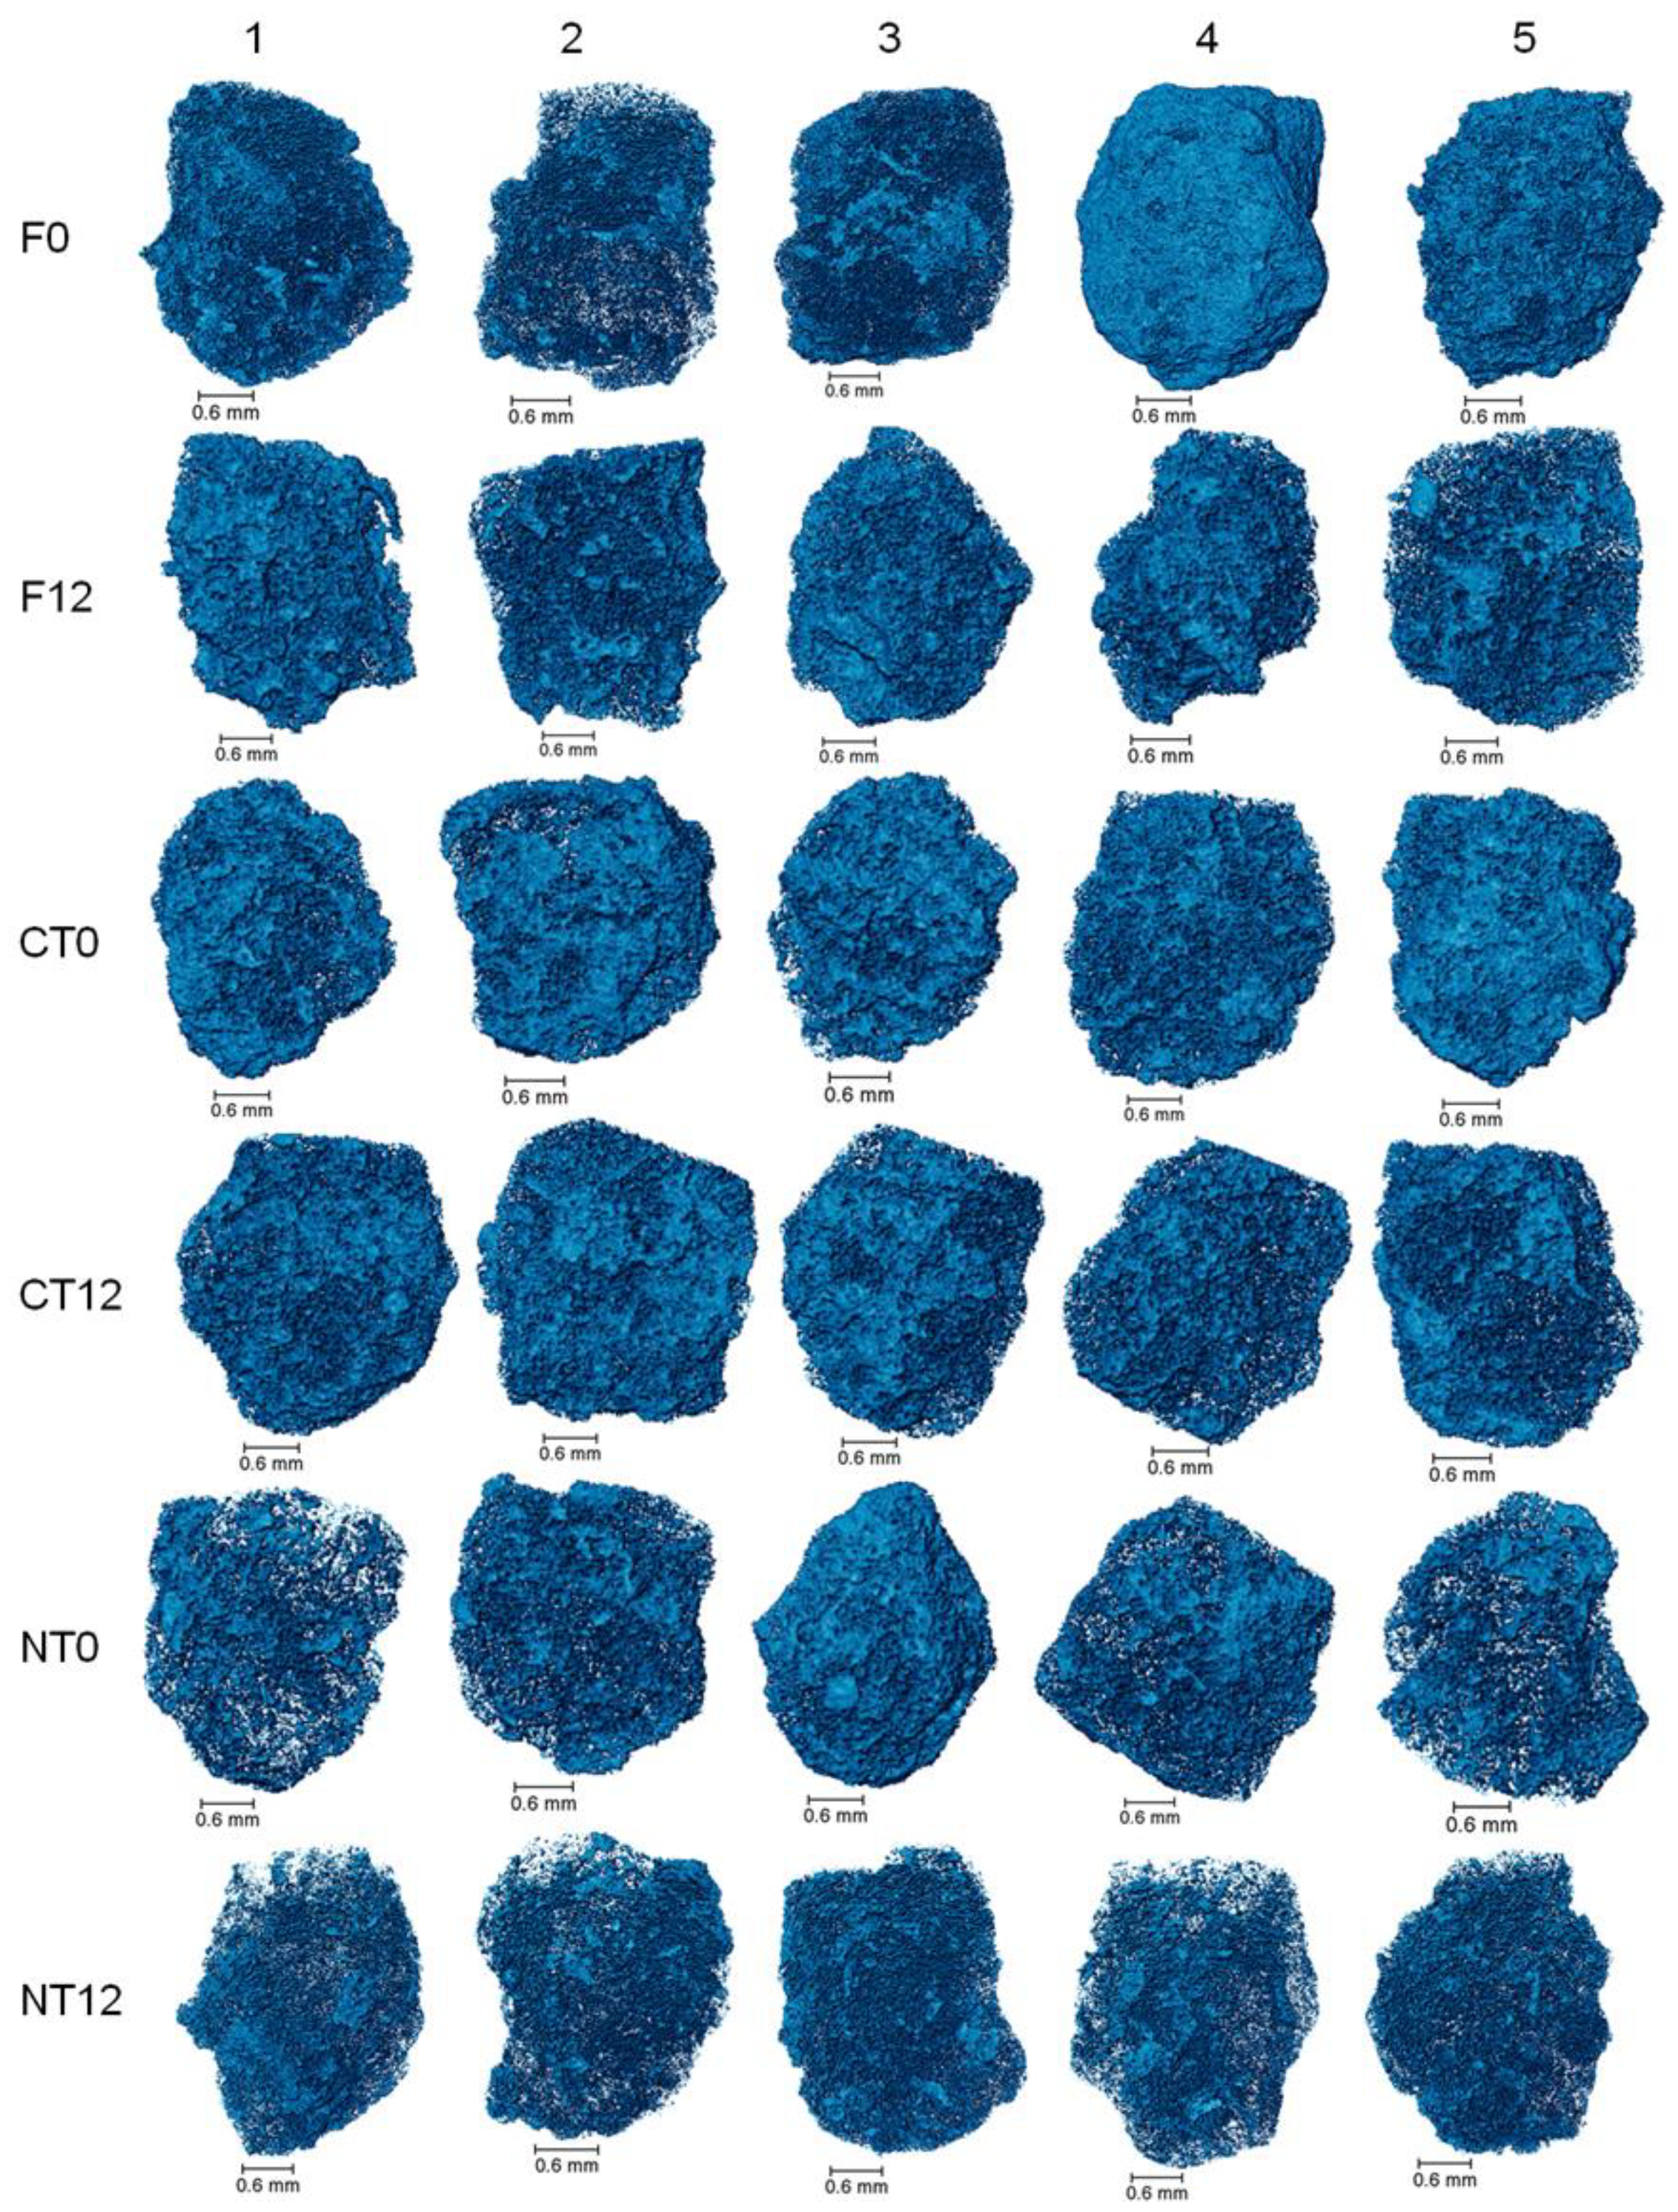
Figure 5.
Changes in: (a) image porosity of the most voluminous pore (PMVP), (b) fraction of the aggregate occupied by the MVP (FAMVP), (c) Euler Number of the most voluminous pore (ENMVP), (d) tortuosity of the MVP determined by two different methods (in solid colors: a local analysis based on the MVP skeletonization (L-τMVP) hatched: a global analysis based on the centroid path tortuosity algorithm applied to the entire isolated MVP (G-τMVP)), (e) hydraulic radius (R) of the MVP, (f) permeability (k) calculated for the MVP, and (g) hydraulic conductivity (K) calculated for the MVP for the samples subjected to 0 and 12 wetting and drying cycles (WDC). The different soil managements investigated were secondary forest (F), conventional tillage (CT), and no-tillage (NT). Different mean values represented by Latin letters with an asterisk and without an asterisk indicate significant differences (p≤0.05) between the management practices for the samples under 0 and 12 WDC. Mean values represented by different Greek letters indicate significant differences (p≤0.05) between 0 and 12 WDC within the same management practice. Data of PMVP, FAMVP, τMVP, R, k, and K for the 0 WDC under F, CT, and NT were addressed in [28] and are used here for reference purposes.
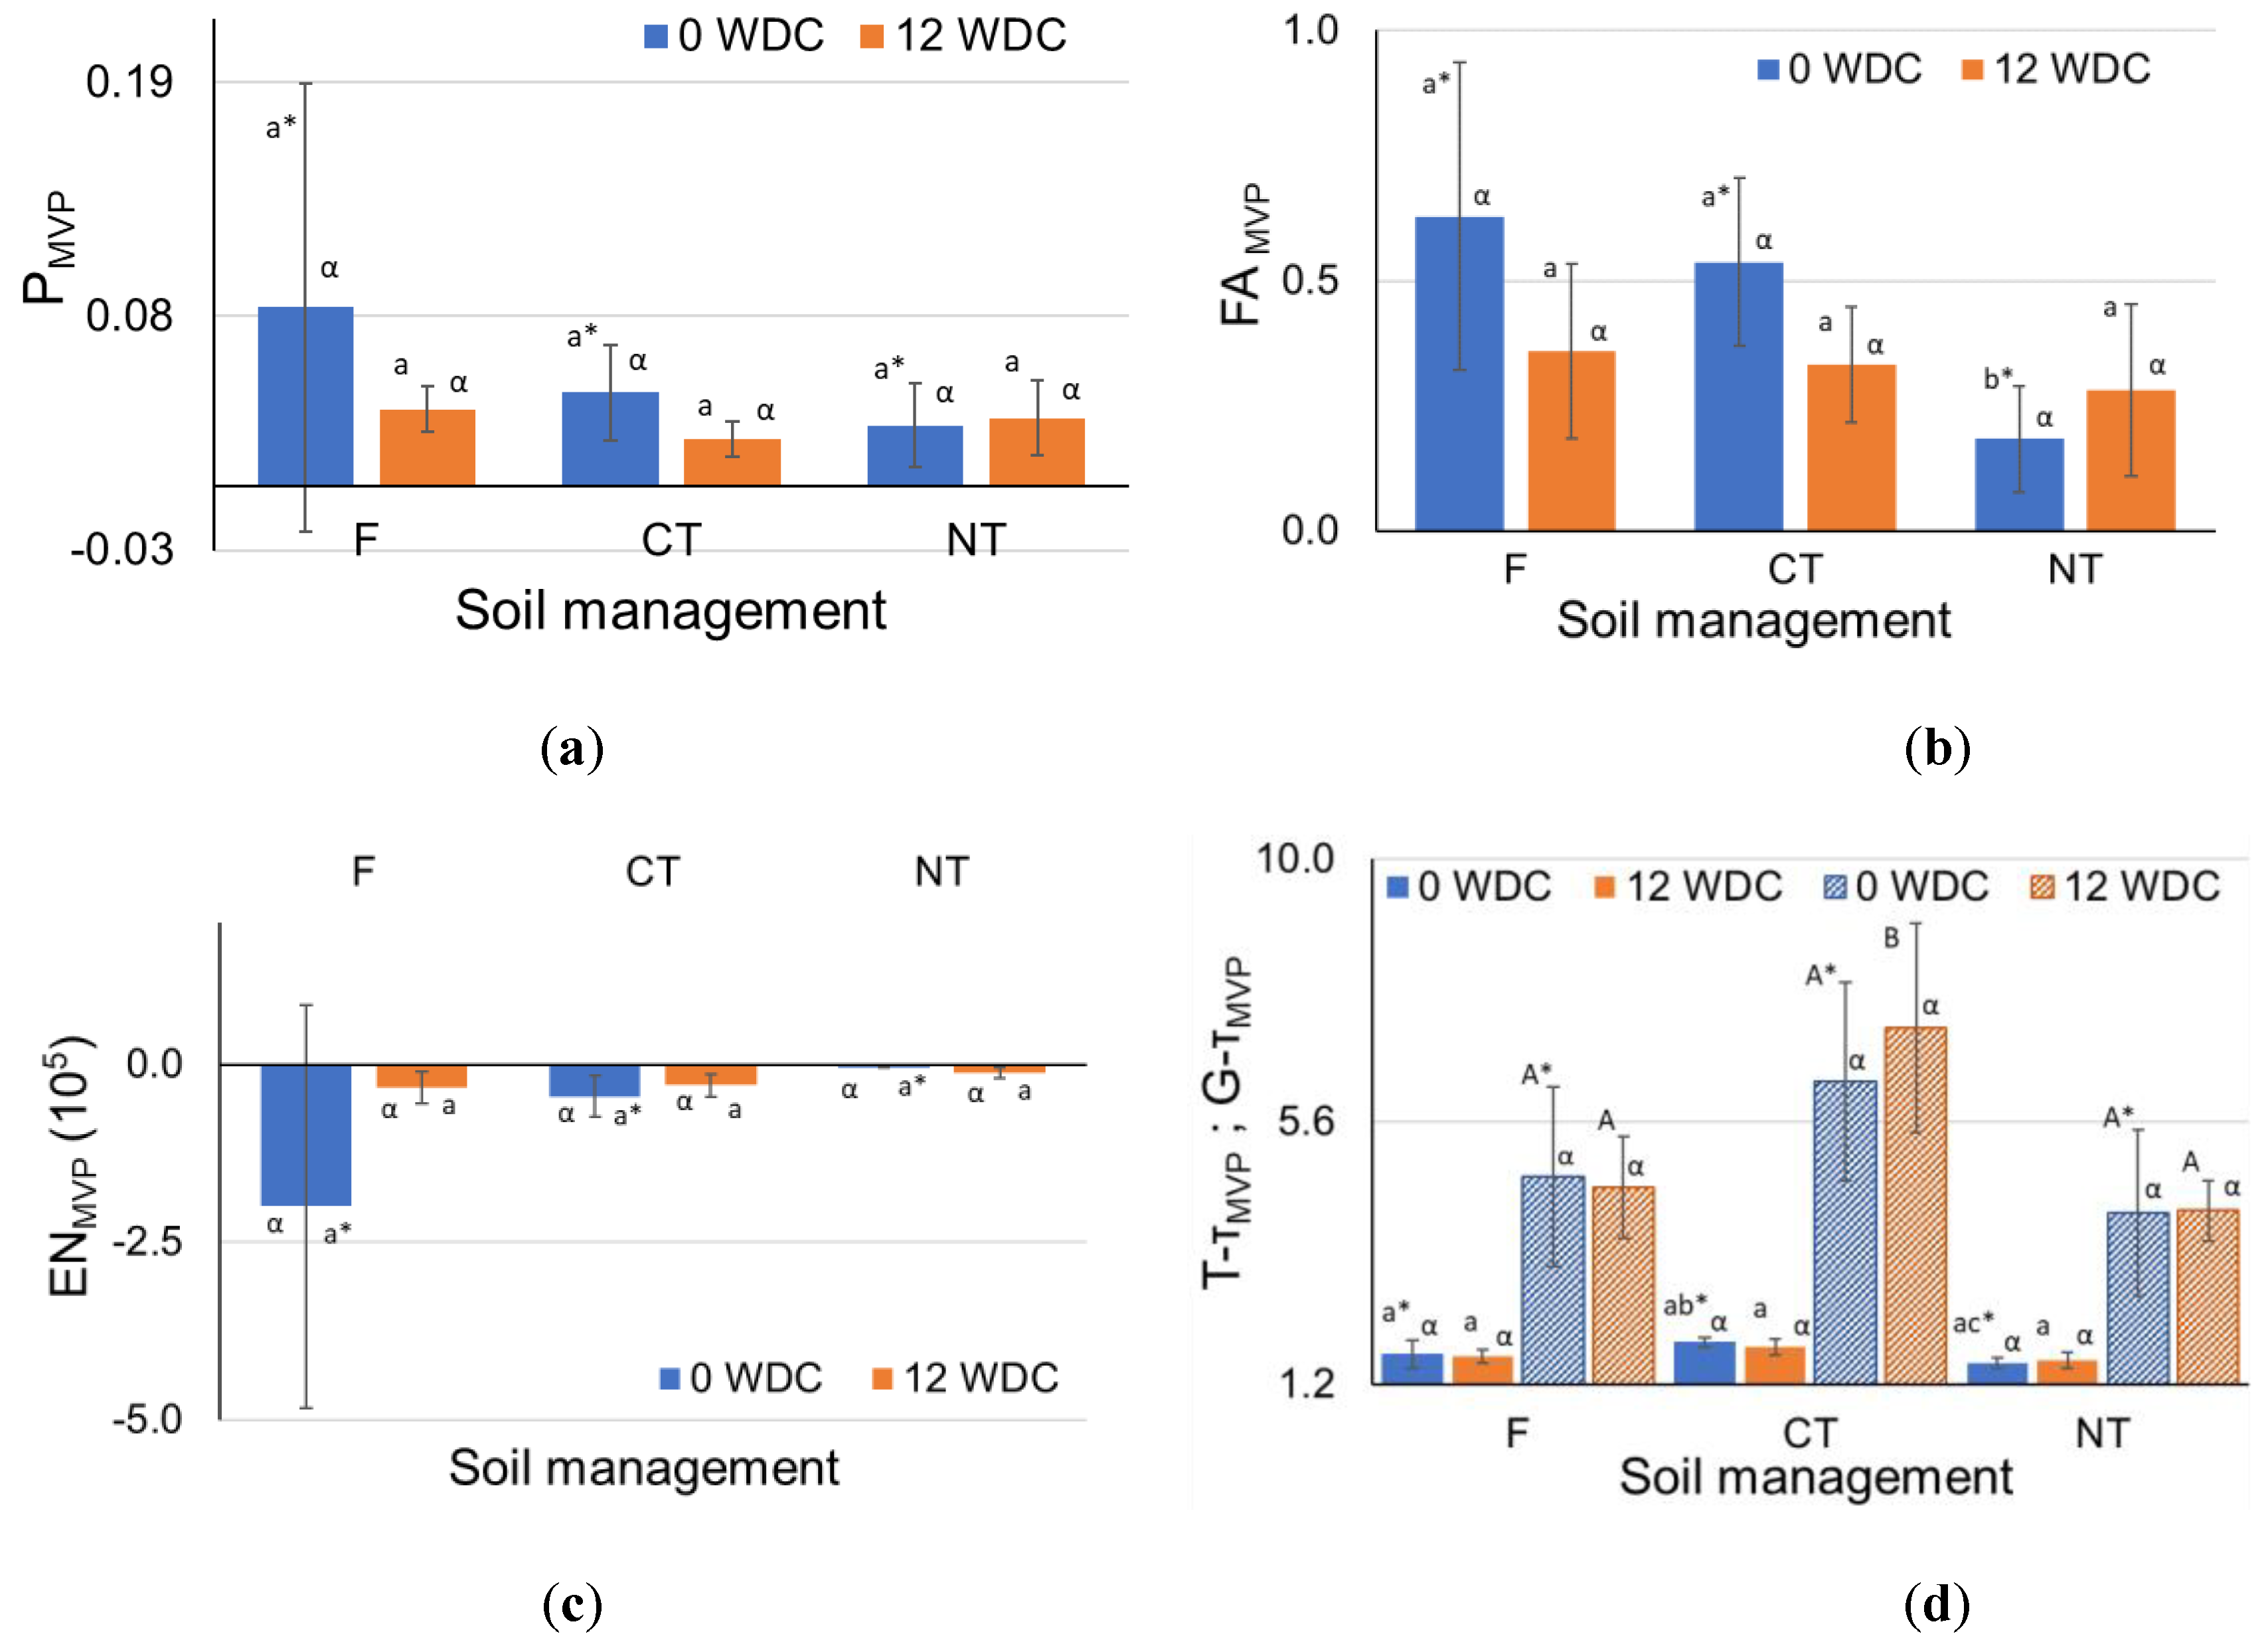
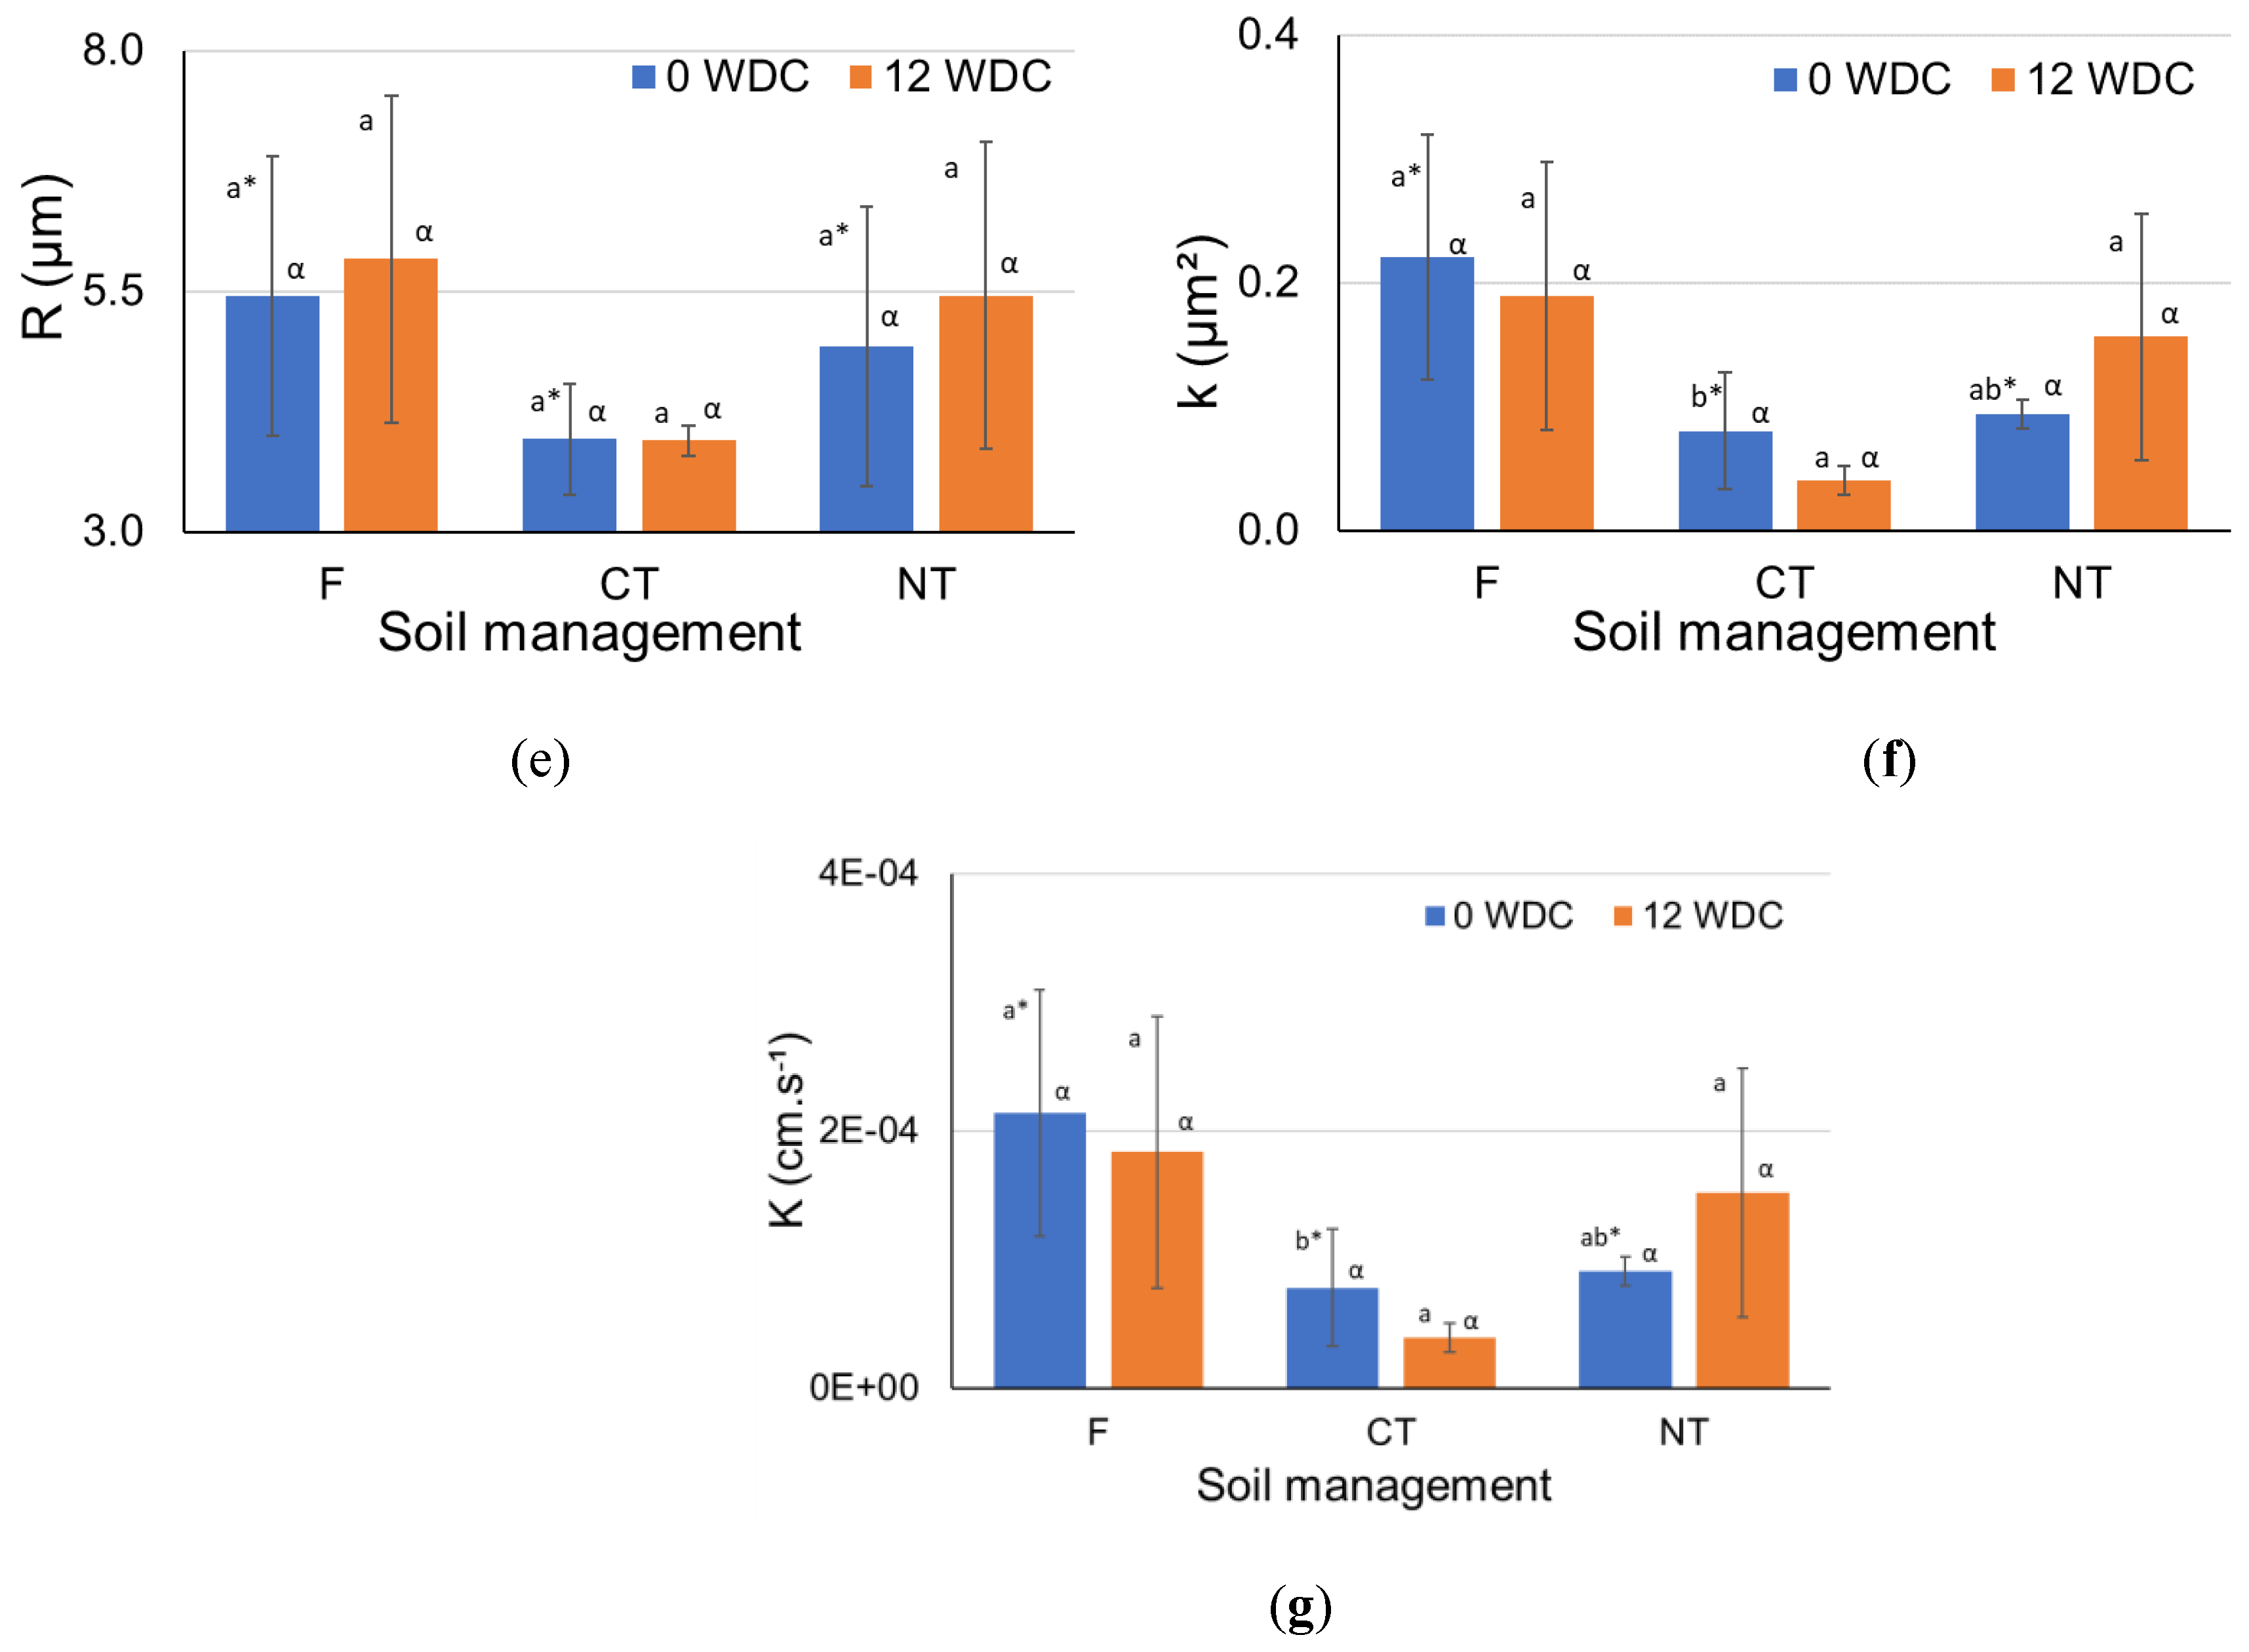
Figure 6.
Comparison between the hydraulic radii R and R' for samples under forest (F), conventional tillage (CT), and no-tillage (NT), and between samples under 12 WDC. An equivalent figure can be found in [28] for samples under 0 WDC and same land-use systems.
Figure 6.
Comparison between the hydraulic radii R and R' for samples under forest (F), conventional tillage (CT), and no-tillage (NT), and between samples under 12 WDC. An equivalent figure can be found in [28] for samples under 0 WDC and same land-use systems.

Figure 7.
Average frequency distribution of the mean segment radius of the most voluminous pore (MVP) skeleton from soil aggregate samples under (a,b) forest (F), (c,d) conventional tillage (CT), and (e,f) no-tillage (NT). Samples were submitted to 0 (left column) and 12 (right column) wetting and drying cycles (WDC). Standard deviations are shown as filled areas. The different number of samples (n) analyzed for each management practice is due to the exclusion of outliers. (a,c,e) Data from [28] presented here for reference purposes.
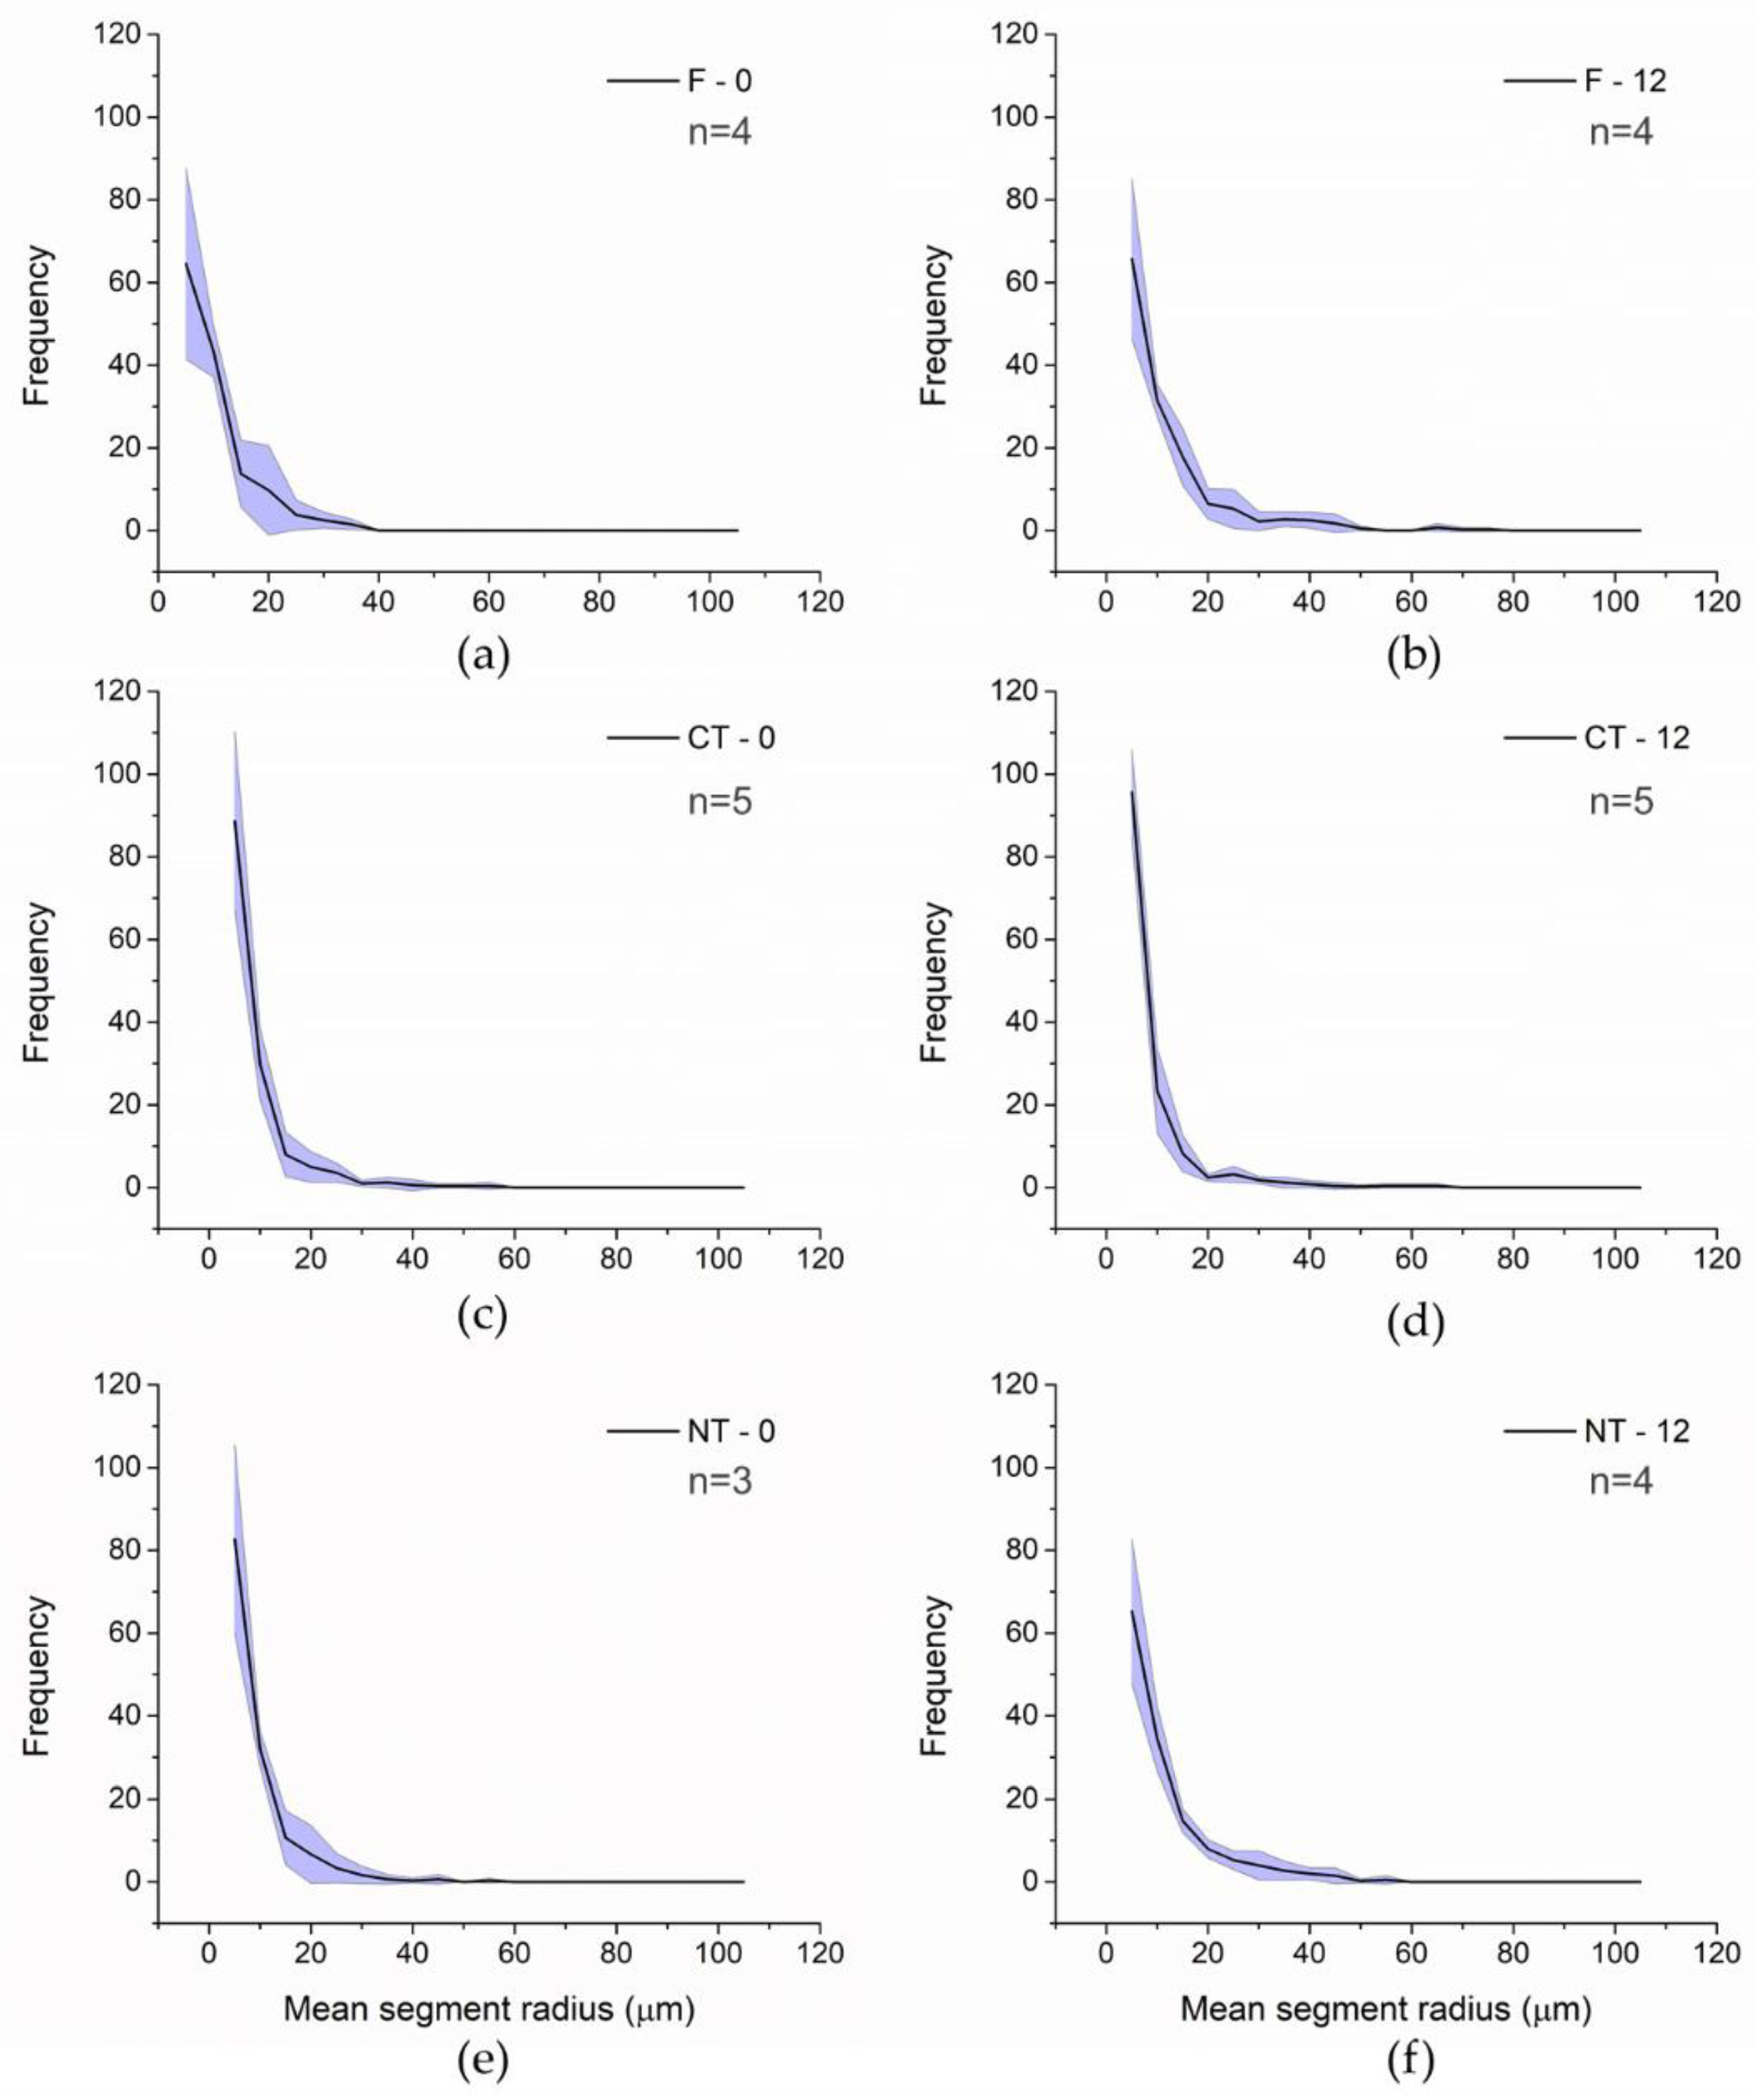
Figure 8.
Average frequency distribution of the segment tortuosity from the most voluminous pore (MVP) skeleton from soil aggregate samples under (a,b) forest (F), (c,d) conventional tillage (CT), and (e,f) no-tillage (NT). Samples were submitted to 0 (left column) and 12 (right column) wetting and drying cycles (WDC). Standard deviations are shown as filled areas. The different number of samples (n) analyzed for each land-use is due to the exclusion of outliers. (a,c,e) Data from [28] presented here for reference purposes.
Disclaimer/Publisher’s Note: The statements, opinions and data contained in all publications are solely those of the individual author(s) and contributor(s) and not of MDPI and/or the editor(s). MDPI and/or the editor(s) disclaim responsibility for any injury to people or property resulting from any ideas, methods, instructions or products referred to in the content. |
© 2025 by the authors. Licensee MDPI, Basel, Switzerland. This article is an open access article distributed under the terms and conditions of the Creative Commons Attribution (CC BY) license (http://creativecommons.org/licenses/by/4.0/).
Copyright: This open access article is published under a Creative Commons CC BY 4.0 license, which permit the free download, distribution, and reuse, provided that the author and preprint are cited in any reuse.


