
Submitted:
14 July 2025
Posted:
16 July 2025
You are already at the latest version
Abstract
Background/Objectives: Despite extensive evidence on the global burden of diabetes mellitus (DM), there is a lack of research on how sociodemographic and lifestyle factors collectively impact glycemic control and diabetes-related complications. This pilot study aimed to identify correlates of glycemic regulation, with a focus on physical activity (PA), education, and clinical variables, among adults with DM in Croatia. Methods: A cross-sectional study was conducted at the national reference center for diabetes, including 95 adult patients with type 1 or type 2 DM. Data were collected via a structured questionnaire and clinical records, covering sociodemographic characteristics, physical activity patterns, and laboratory indicators. Statistical analyses included descriptive statistics, t-tests, chi-square tests, correlation and regression analyses, and K-means clustering. Results: The mean HbA1c was 6.9% (SD = 1.3), with 33.7% of participants exceeding the 7.5% threshold. Higher education (β = −0.48, p = 0.013) and engagement in strength and balance training (β = −0.32, p = 0.041) were independently associated with lower HbA1c levels. Diabetes duration (β = 0.03, p = 0.004) and type 2 diabetes (β = 0.38, p = 0.030) were positive predictors of HbA1c. PA frequency and intensity were not significantly associated with glycemic control (p = 0.479). Cluster analysis identified three distinct profiles, with Cluster 2 (N = 10) exhibiting poor control (mean HbA1c = 9.8%) despite engaging in moderate activity. HbA1c > 7.5% was significantly associated with hypertension (OR = 3.70, 95% CI: 1.34–10.21) and retinopathy (OR = 2.82, 95% CI: 1.14–6.98). Age was the only significant predictor of cardiovascular comorbidities (OR = 1.12, p = 0.019). Education level was a predictor of participation in strength and balance training (OR = 2.45, p = 0.025). Conclusions: Glycemic control in individuals with diabetes is influenced by a combination of behavioral, clinical, and educational factors. Strength and balance training, as well as higher education, were associated with lower HbA1c levels, while older age and type 2 diabetes were indicators of a greater risk. Tailored interventions promoting structured PA and targeting educational disparities may improve clinical outcomes in this population.
Keywords:
comorbidities
; diabetes mellitus
; glycemic control
; health education
; hemoglobin A1c (HbA1c)
; physical activity
; sociodemographic factors
; strength training
1. Introduction
Over the past three decades, the global prevalence of diabetes mellitus (DM) and impaired glucose tolerance (IGT) has quadrupled [1], making DM a significant public health concern that currently affects 1 in 10 adults aged 20–79 and ranks among the leading causes of premature mortality [2]. The number of cases is projected to reach 783.2 million by 2045 [3]. Croatia reflects this global trend, with 396,005 diagnosed individuals recorded in 2024; however, the actual number is likely to exceed 500,000 due to underdiagnosis [4].
Type 2 diabetes (T2DM) is strongly associated with modifiable lifestyle factors such as insufficient physical activity and unhealthy diet [5], but also with genetic predisposition and family history; 60% of patients have a parent with T2DM [6]. In contrast, type 1 diabetes (T1DM) is more sporadic, with about 90% of patients lacking a positive family history [7]. Women, particularly those with polycystic ovary syndrome, are more susceptible to the early onset of T2DM [5, 8], and reproductive factors may further influence disease risk.
Complications such as cardiovascular disease, neuropathy, and diabetic foot [9,10,11], along with elevated cancer risk [12, 13], pose serious challenges. Life expectancy is reduced by approximately six years in people with diabetes [14], who are considered a vulnerable population due to frequent comorbidities [15].
Glycated hemoglobin, also known as hemoglobin A1c (HbA1c), is now a widely accepted measure of long-term glycemic control, preferred over fasting glucose and oral glucose tolerance tests due to its practicality [16]. Consequently, epidemiological surveillance relies on glycemic indicators such as HbA1c and fasting glucose [17]. Numerous risk factors for T2DM have been identified, including age [18], obesity [19, 20], gender [5], ethnicity [21], inactivity [22, 23], poor diet [15, 24], family history [6], gestational diabetes [25, 26], hypertension [27] and dyslipidemia [28].
Despite an abundance of epidemiological data, few studies have examined the joint influence of sociodemographic and lifestyle factors on glycemic control and the risk of complications. This study addresses that gap by analyzing a bimodal sample (younger and older adults) to examine patterns of care across the life course. It incorporates clinical markers (HbA1c, fasting glucose, cholesterol, creatinine), lifestyle factors (type and frequency of physical activity), and sociodemographic variables (gender, education, marital status, urban/rural setting).
2. Materials and Methods
2.1. Participants and Procedure
This cross-sectional study was conducted over three months (December 2024 to February 2025) at the University Clinic for Diabetes, Endocrinology, and Metabolic Diseases Vuk Vrhovac, Merkur University Hospital in Zagreb, which also serves as the national Reference Center for Diabetes. Of the 664 patients who attended routine follow-up visits during this period, 95 agreed to participate (n = 95). Additionally, this pilot study serves as a precursor to a larger, ongoing study targeting over 500 individuals with DM from diverse backgrounds through a multidimensional research framework.
Data collection took place in an outpatient setting during regularly scheduled clinical appointments. Participants received both verbal and written information about the study’s aims, procedures, potential risks and benefits, and their right to withdraw at any time. Those who agreed to participate signed an informed consent form. Most recent Clinical parameters (fasting glucose, HbA1c, total cholesterol, and serum creatinine) were extracted from medical records, while participants independently completed a structured questionnaire. Assistance was provided upon request, primarily to older individuals experiencing visual difficulties or fatigue. The average time required to complete the questionnaire was approximately 35 minutes.
Eligible participants were adults aged 18 years or older with a diagnosis of DM. Individuals with a history of psychiatric illness or those who declined participation were excluded from the study.
2.2. Instrument
Data were collected using a semi-structured, custom-developed questionnaire, comprising three main sections:
Sociodemographic and anthropometric data: participants reported their age, gender, education level, marital status, place of residence, employment status, height (in meters), and weight (in kilograms). Clinical and laboratory characteristics: this section included information on type of diabetes (T1DM, T2DM, gestational, or secondary), disease duration (in years), diabetes-related complications (e.g., myocardial infarction, stroke, arterial hypertension, diabetic foot, retinopathy, nephropathy), and type of therapy (none, oral medication, insulin, combined therapies including GLP-1 receptor agonists or insulin pump). Biochemical data were extracted from the most recent laboratory results, including fasting glucose (mmol/L), HbA1c (%), serum creatinine (µmol/L), and total cholesterol (mmol/L). Body weight and height were used to calculate BMI. Physical activity patterns: this section assessed the type, frequency, and intensity of physical activity. Participants reported engaging in various activities, including aerobic exercises (e.g., brisk walking, cycling, swimming, running, hiking, dancing), anaerobic exercises (e.g., strength training, resistance exercises, using fitness machines), and balance and proprioceptive exercises (e.g., standing on one leg, practicing tai chi). Intensity was categorized as low (<30 minutes), moderate (30–60 minutes), or high (60–120 minutes), and frequency was reported as daily, twice a week, or three or more times a week.
This multidimensional instrument enabled a comprehensive assessment of physical activity behaviors and their associations with glycemic control and chronic complications in individuals with type 2 diabetes.
2.3. Statistical Analysis
Statistical analyses were conducted using IBM SPSS Statistics for Windows, Version 25.0 (IBM Corp., Armonk, NY, USA). The study employed a quantitative cross-sectional design, involving 95 participants with a bimodal sample structure comprising both younger and older adults to capture age-related differences in diabetes care.
Descriptive statistics were used to summarize sociodemographic, clinical, and physical activity variables. Welch’s t-test was applied to compare mean HbA1c values between groups differing in physical activity engagement, due to unequal variances and group sizes. Chi-square tests (χ²) were used to examine differences in the prevalence of chronic complications across glycemic control categories (HbA1c ≤ 7.5% vs. > 7.5%). Pearson’s correlation coefficient (r) was used to assess the associations between continuous variables, such as disease duration and the number of complications. Predictors of glycemic control (HbA1c levels) were identified using simple and multiple linear regression models, including demographic, clinical, and lifestyle variables. Logistic regression was used to examine the predictors of participation in strength and balance training and cardiovascular comorbidities. Interaction terms were introduced in regression models to assess effect modification by place of residence (urban vs. rural) on the relationship between physical activity and HbA1c. Additionally, K-means cluster analysis was used to identify subgroups based on shared patterns in glycemic control, physical activity, and complications.
This comprehensive analytical approach ensured a robust, multidimensional assessment of diabetes-related outcomes.
3. Results
The final sample (Table 1) consisted of 95 adult individuals with diabetes, among whom 53 were male (55.8%) and 42 female (44.2%). The participants represented a wide age range, with the most significant proportion aged 65 years and older (n = 40; 42.11%), followed by those aged 58–65 years (n = 20; 21.05%). Younger age groups (below 50 years) were progressively less represented, with the lowest representation among participants aged 26–33 years (n = 3; 3.16%). In terms of educational attainment, more than half of the participants were secondary school students currently enrolled (n = 54; 56.8%), while 32.6% (n = 31) had completed a graduate degree or higher. A smaller proportion had completed undergraduate degrees (14.7%) or only secondary education (10.5%).
Regarding marital status, the majority were married (n = 59; 62.1%), while 13.7% were single, and 12.6% widowed. Smaller proportions reported being divorced (5.3%), in a relationship, engaged, or cohabiting (each 1.1%), while 3.2% did not specify. Most participants resided in urban areas (n = 74; 77.9%), with a minority living in rural areas (n = 21; 22.1%). Concerning employment status, half of the sample were retired (n = 48; 50.5%), followed by those employed full-time (n = 41; 43.2%), with a small number employed part-time (2.1%) or unemployed (4.2%).
The clinical and lifestyle profiles of 95 participants with diabetes were assessed (Table 2). Among them, 73.7% had type 2 diabetes and 26.3% type 1 diabetes. Correspondingly, 73.7% were on oral antidiabetic medication and 26.3% on insulin therapy. Arterial hypertension was the most prevalent comorbidity (63.2%). Microvascular complications included retinopathy (31.6%), diabetic foot (15.8%), nephropathy (12.6%), and neuropathy (8.4%). Cardiovascular events such as myocardial infarction or stroke were reported by 12.6%, and 10.5% had other chronic conditions, including autoimmune and oncological diseases. Body mass index classification revealed that 42.6% of participants were overweight, 26.6% were obese, and 28.7% had a normal weight.
Regarding physical activity, most participants engaged in aerobic exercises, with walking or brisk walking reported by 94.7%. Other aerobic activities included cycling (21.1%), swimming (15.8%), hiking or Nordic walking (12.6%), and dance, yoga, or Pilates (10.5%). Anaerobic or strength training was less common, practiced by 31.6% using elastic bands or bodyweight exercises, 26.3% with free weights, and 21.1% on gym machines. Balance and coordination exercises were reported by 21.1% of participants. Regarding exercise intensity, 52.6% performed moderate-intensity physical activity, 26.3% performed low-intensity physical activity, and 21.1% performed high-intensity physical activity. Exercise frequency varied, with 42.1% exercising at least three times per week, 36.8% exercising daily, 15.8% exercising twice per week, and 5.3% exercising less frequently.
To assess metabolic control and organ function in individuals with diabetes, descriptive statistics were calculated for four key laboratory biomarkers (Table 3): fasting glucose, glycated hemoglobin (HbA1c), total cholesterol, and serum creatinine. The average fasting glucose level was approximately 7.9 mmol/L (SD ≈ 2.3; range: 4.2–16.5 mmol/L) based on 82 participants. This distribution indicates substantial variability in short-term glycemic control, with some participants exhibiting normoglycemic values, while others demonstrated levels consistent with poorly managed hyperglycemia. The mean value for HbA1c, a key indicator of long-term glycemic regulation, was 6.9% (SD ≈ 1.3; range: 5.0–12.7%) across 90 participants. These results suggest that although a subset of the sample maintained satisfactory metabolic control (i.e., HbA1c ≤ 7.0%), a considerable proportion showed elevated values, indicative of suboptimal disease management or progression. Regarding lipid metabolism, the mean total cholesterol concentration was approximately 4.6 mmol/L (SD ≈ 1.1; range: 2.1–7.8 mmol/L) in a subsample of 88 participants. This moderate mean value, alongside a broad range, reflects the co-existence of both normolipidemic and hypercholesterolemic profiles within the cohort. Lastly, the mean serum creatinine level was 76.8 µmol/L (SD ≈ 34.6; range: 0.7–204.0 µmol/L) in a sample of 81 individuals. The wide dispersion of values highlights substantial inter-individual differences in renal function, potentially including early-stage kidney impairment or advanced diabetic nephropathy in a subset of respondents.
These descriptive findings provide a clinically relevant overview of the metabolic and renal status of the sample, offering a basis for subsequent analyses examining associations with physical activity patterns, sociodemographic characteristics, and diabetes-related complications.
An exploratory k-means cluster analysis was conducted using glycated hemoglobin (HbA1c), the number of chronic diabetes-related complications, and physical activity measures (intensity and frequency). Three distinct clusters emerged (Figure 1). Cluster 0 (N≈46) included participants with well-controlled glycemia (mean HbA1c ≈ 6.6%) and high physical activity, mainly exercising daily at moderate to high intensity. The average number of complications was approximately one, with 41% of participants reporting no complications at all. Cluster 1 (N≈39) also exhibited favorable glycemic control (mean HbA1c ≈ 6.5%) but low physical activity, typically twice weekly at low intensity or no regular exercise. Complications averaged around one per participant, with 38% reporting none. Cluster 2 (N≈10) exhibited poor glycemic control (mean HbA1c ≈ 9.8%) despite engaging in moderate physical activity (3–4 days per week, low to moderate intensity). This cluster had the lowest complication burden (mean ≈ 0.4), with 60% of participants reporting no complications at all. This may be attributed to shorter disease duration or early-stage diabetes, indicating a high-risk group that may require intensified management.
Table 4 presents the comparison of mean HbA1c values between participants classified as physically active (≥3 exercise sessions per week at moderate or vigorous intensity) and those classified as less active. Welch’s t-test indicated no statistically significant difference between the groups, t(36) = - 0.72, p = 0.479. The mean HbA1c value was slightly higher in the active group (6.86 ± 1.25) than in the less active group (6.67 ± 1.01), with a mean difference of 0.19 percentage points. However, the 95% confidence interval (- 0.35 to 0.73) included zero, indicating that this difference is not statistically significant. The effect size was small (Cohen’s d = 0.16), suggesting a negligible difference in glycemic control between groups. These findings do not support the hypothesis that higher frequency or intensity of physical activity is associated with lower HbA1c levels in this sample.
The results presented in Table 5 show that elevated HbA1c levels (>7.5%) are significantly associated with hypertension (χ² (1) = 6.79, p = 0.009; OR = 3.70, 95% CI [1.34–10.21]) and moderately associated with retinopathy (χ² (1) = 5.23, p = 0.022; OR = 2.82, 95% CI [1.14–6.98]). In contrast, the association with nephropathy did not reach statistical significance (χ²(1) = 1.64, p = 0.201; OR = 2.19, 95% CI [0.65–7.45]). The clinical implication is straightforward: maintaining HbA1c levels below 7.5% is not merely a numerical goal—it significantly reduces the odds of concurrent development of elevated blood pressure and visual impairment. These two complications critically impact the quality of life and long-term prognosis in individuals with diabetes.
Participants with a university degree or higher were 2.45 times more likely to engage in such exercise compared to those with lower education levels (OR = 2.45, 95% CI [1.12–5.36], p = 0.025). Although age was not statistically significant (p = 0.110), the trend suggests a potential age-related barrier to participation.
Overall, the model highlights educational attainment as a key leverage point for interventions aimed at promoting structured physical activity, especially in populations at risk for diabetes-related complications.
The parsimonious logistic regression model (Table 7) retained no statistically significant predictors of engaging in strength and balance training at least once per week. Although the odds ratio for type 2 diabetes was notably high (OR = 26.51), the wide confidence interval (95% CI [0.03–24329.90]) and non-significant p-value (p = 0.346) indicate a lack of statistical reliability. Other variables, including age, gender, and diabetes duration, also showed no significant associations with participation in strength and balance exercises.
The model suggests that, when controlling for these key clinical and demographic factors simultaneously, none appear to be strong independent predictors of engagement in such physical activity. This outcome may reflect the complexity of factors influencing exercise behavior or insufficient statistical power due to sample size and variability.
The linear regression model identified several significant predictors of HbA1c levels, offering insight into both clinical and behavioral determinants of glycemic control (Table 8). Education level emerged as a significant and protective factor. Participants with a university-level education or higher had, on average, 0.48 percentage points lower HbA1c compared to those with lower education (β = −0.48, p = 0.013). This suggests that higher educational attainment may facilitate better diabetes self-management, possibly through improved health literacy, greater access to resources, or stronger adherence to treatment regimens. Engagement in strength and balance training was also significantly associated with improved glycemic control. Those who participated in such an exercise had an average 0.32 percentage point lower HbA1c (β = −0.32, p = 0.041). This finding highlights the potential benefits of incorporating resistance and neuromotor training, in addition to aerobic activity, into diabetes care, particularly given its accessibility and the additional advantages for musculoskeletal health and fall prevention. The duration of diabetes showed a small but statistically significant positive association with HbA1c levels (β = 0.03, p = 0.004), indicating that each additional year of living with diabetes was associated with a 0.03% increase in HbA1c levels. This trend is consistent with the known progressive nature of type 2 diabetes and the cumulative burden of disease, which may make glycemic control more difficult over time. Having T2DM (vs. T1DM) was also associated with higher HbA1c levels (β = 0.38, p = 0.030). While this may initially seem counterintuitive, it may reflect differences in treatment strategies, disease perception, or clinical inertia in managing T2DM compared to the more intensively managed T1DM. Age showed a marginal trend toward higher HbA1c with increasing years (β = 0.01, p = 0.080), though this did not reach statistical significance. This may indicate subtle age-related changes in metabolism, comorbidities, or treatment priorities (e.g., relaxed glycemic targets in older adults); however, further investigation would be necessary to confirm this. Gender (male) was not a significant predictor (β = −0.05, p = 0.730), suggesting no substantial gender-based difference in HbA1c levels after accounting for other covariates in the model.
Taken together, these results highlight that modifiable factors, such as physical activity and education, play a measurable role in glycemic outcomes, even after adjusting for clinical variables like disease duration and diabetes type.
A logistic regression model was used to identify predictors of having at least one cardiovascular comorbidity (Table 9). Among the variables entered into the model, diabetes type (T2DM), age, gender, and disease duration, age emerged as the only statistically significant predictor. Specifically, each additional year of age was associated with a 12% increase in the odds of having a cardiovascular comorbidity (OR = 1.12, 95% CI [1.02–1.23], p = 0.019). Other predictors, including gender (OR = 0.46, p = 0.169), diabetes duration (OR = 0.96, p = 0.450), and diabetes type (OR = 0.63, p = 0.839), were not significantly associated with cardiovascular comorbidities in this model. Notably, while men appeared less likely than women to report cardiovascular conditions (OR < 1), this association did not reach statistical significance. Similarly, diabetes duration showed no meaningful effect, which may reflect the influence of unmeasured confounders or the relatively small sample size.
The linear regression analysis examined the effects of physical activity (PA), urbanicity, and their interaction on HbA1c levels (Table 10 and Figure 2). The intercept was significant (β = 6.50, p < 0.001), representing the baseline HbA1c level when all predictors are zero. The main effect of physical activity on HbA1c was adverse but not statistically significant (β = -0.031, p = 0.370), indicating a slight, non-significant tendency for higher physical activity to be associated with lower HbA1c levels. Urbanicity alone also showed a non-significant positive association with HbA1c (β = 0.21, p = 0.730), suggesting no meaningful difference in glycemic control between urban and rural residents.
The interaction term between physical activity and urbanicity approached statistical significance (β = -0.081, p = 0.061), suggesting a potential moderating effect of urbanicity on the relationship between physical activity and HbA1c. This indicates that the relationship between physical activity and glycemic control may vary depending on whether participants reside in urban or rural settings, with a trend toward more substantial beneficial effects of physical activity on HbA1c in one of these groups. However, as the p-value slightly exceeds the conventional threshold, this finding should be interpreted with caution and warrants further investigation.
4. Discussion
This study offers valuable insights into the public health aspects of the demographic and clinical profiles of individuals living with diabetes in Croatia, highlighting critical patterns that can inform more effective prevention strategies, targeted dietary interventions, and long-term disease management.
The composition of the 95-person sample provides a revealing, if complex, demographic and clinical snapshot of diabetes in Croatia. Although the nearly even gender distribution, 55.8% male and 44.2% female, initially suggests balance, it also invites deeper inspection given the known gender-related metabolic differences in T2DM [5]. Indeed, gender is not merely a demographic variable but a biological determinant that shapes disease onset, complication profiles, and treatment responses. Age stratification further sharpens the picture. As anticipated, younger adults were minimally represented: only 4.21% of respondents were aged 18–25, and 3.16% fell into the 26–33 age bracket. This reflects the epidemiological rarity of early-onset diabetes, typically T1DM or due to rare genetic-metabolic syndromes. From the age of 34 onward, participation increases steadily, with a dramatic representation beyond the fifth decade of life. Respondents aged 50–57 accounted for 12.63%, those 58–65 for 21.05%, and those over 65 comprised a striking 42.11% of the sample. These figures align with global findings showing that the majority of diabetes cases occur in older adults, and projections suggest this burden will continue to grow [29]. This age distribution is neither incidental nor merely descriptive—it encapsulates the cumulative biological and behavioral exposures underpinning diabetes. Risk factors such as prolonged physical inactivity, dietary indiscretions, and comorbid hypertension or dyslipidemia accrue over decades, increasing the likelihood of T2DM diabetes with age. However, aging itself is also an independent risk factor, associated with mitochondrial dysfunction, insulin resistance, and reduced β-cell reserve. Crucially, these older individuals are not merely diabetic; they are often multimorbid. Prior studies consistently show a higher prevalence of sarcopenia, cognitive decline, cardiovascular pathology, and frailty in older diabetic adults [30,31,32]. The challenge is thus twofold: managing glucose while also mitigating the functional and psychosocial losses that often accompany aging. It is this subgroup, physically slower, more isolated, and more medically complex, that demands tailored interventions, not generic ones.
The sociodemographic structure of the sample reveals a pronounced duality, with participants clustering into two distinct cohorts: secondary school students (56.8%) and older adults with graduate degrees (32.6%). This reflects the questionnaire design, which allowed respondents to provide multiple answers regarding both current and completed education. Marital status and employment also follow this bimodal pattern, with a predominance of married or widowed retirees alongside a smaller group of unmarried youth. Urban respondents dominate (77.9%), with rural voices underrepresented, potentially obscuring barriers such as limited access to care and health education in village settings.
Clinically, type 2 diabetes and oral therapy are most common (73.7%), corresponding with older participants, while type 1 diabetes and insulin use characterize the younger subset. This age-driven divergence must be modeled carefully, without stratification, aggregated results risk misinterpretation due to Simpson’s paradox. Variables such as age, education, and urbanicity should be treated as moderators in further analyses.
BMI data reinforce the high-risk profile: only 28.7% of respondents had a normal weight, while 42.6% were overweight and 26.6% obese. Although BMI is a widely used screening tool, it poorly reflects actual body fat [33]. Obesity, defined as a BMI greater than 30 kg/m², is a global epidemic linked to chronic diseases and cancers [34,35,36]. Socioeconomic factors, particularly income and education, have a strong influence on dietary adherence [37]. Physical activity remains a cornerstone in obesity management, primarily through its effects on energy balance [38].
The complication profile in this 95-patient cohort highlights a striking pattern seen across global diabetes populations: chronic hyperglycemia quietly sets the stage for both microvascular and macrovascular damage, with arterial hypertension (63%) and diabetic retinopathy (31.6%) leading the clinical cascade. These two conditions, often overlooked in early disease management, remain deeply entrenched once glucose dysregulation progresses, confirming that cardiometabolic risk compounds rapidly if not addressed early [39]. What is perhaps more revealing is the relatively high prevalence of diabetic peripheral neuropathy (DPN), affecting over half of diabetic individuals in broader epidemiological data, and acting as a key contributor to balance dysfunction and falls [40, 41]. In this cohort, diabetic-foot lesions (15.8%) and nephropathy (12.6%) further suggest that small-vessel damage is well established in a substantial subset, extending the pathophysiological footprint to peripheral nerves and renal microcirculation. Classical macrovascular events—myocardial infarction, stroke, or other cardiovascular crises—appear in 12.6% of participants. This aligns with international trajectories, indicating that such events are typically delayed until years of untreated or under-treated hypertension and dyslipidemia accumulate [39].
Against this backdrop, physical activity data might seem paradoxically encouraging at first glance. Walking is nearly universal (94.7%), likely due to its low barrier to entry and compatibility with neuropathic limitations. However, once we move beyond this most accessible form, engagement drops sharply. Activities requiring equipment, coordination, or a structured environment, such as cycling, swimming, and gym workouts, are practiced by only 20% of individuals. Strength training, despite its centrality to sarcopenia prevention and insulin sensitivity, is underutilized, with around 25–33% of respondents reporting participation, skewed toward minimal-load methods such as elastic bands or bodyweight routines. Balance-focused interventions, essential for fall prevention in DPN, remain niche, with only one in five engaging in modalities such as tai chi or guided stability drills. These patterns are consistent with previous findings, which show that while walking is commonly adopted, resistance and balance training are frequently neglected in real-world diabetes care [42]. The consequences of this imbalance are not trivial: underdeveloped muscle mass and poor postural control not only increase the risk of falls but also reduce glucose uptake and basal metabolic rate. These mechanisms should synergize with aerobic activity to yield better glycemic control [41].
A closer look at frequency and duration nuances the picture further. Most participants report moderate-length sessions (30–60 minutes), but only 21% reach the 60–120 minute threshold that may require more robust cardiovascular adaptations. Daily activity is achieved by just 36.8%, with another 42.1% exercising three or more times per week. A sizable minority, 21%, train two times or fewer weekly, likely representing a high-risk subgroup for worsening hypertension, sarcopenia, and glycemic control. This mixed pattern illustrates a familiar paradox in community diabetes management: while the average patient walks, they often do so too late, too little, or without complementary training strategies to address the broader syndrome of frailty, insulin resistance, and vascular decline as other studies have suggested, the timing and structure of exercise matter at least as much as total volume [40].
Hence, two priorities emerge for intervention. First, cardiometabolic deterioration must be intercepted earlier, before hypertension and retinopathy become entrenched, through systematic screening and tighter primary care control of blood pressure and lipids [39]. Second, physical activity counselling must mature beyond vague recommendations. A tiered prescription model is more appropriate, with walking as the foundational component, resistance work twice a week to address muscle loss, and targeted balance drills for neuropathy-related instability, delivered in group formats that promote adherence and accountability [42]. Of course, these results are based on self-report, which allows for multiple responses and may likely overestimate actual adherence in the real world. Complication overlap may be more complex than the numbers suggest. Still, the pattern remains consistent: walking is ordinary, but it is insufficient on its own. Without strategic additions like strength and stability training, the benefits of aerobic activity are blunted, and the broader syndrome of diabetes-related disability remains inadequately addressed.
The biochemical indicators suggest relatively good glycemic control among the sample; the average HbA1c is 6.9%, which aligns with commonly recommended targets for adults with T2DM. However, the wide range of values (from 5.0% to 12.7%) highlights the heterogeneity in disease management. A similar pattern has been observed in studies examining routine diabetes care, where average values often mask a subset of patients with poor glycemic control [43]. Serum creatinine values show even greater dispersion, with some participants exceeding thresholds for moderate-to-severe chronic kidney disease, suggesting that a portion of the sample may have progressed nephropathy despite apparently favorable averages.
Interestingly, the prevalence of self-reported complications in this portion of the sample appears lower than in prior data from the same study (e.g., hypertension in 35.8%, retinopathy in 9.5%, diabetic foot in 8.4%). This discrepancy is likely due to differences in data collection methods; while previous figures were based on structured questions about complications, these results stem from open-ended self-reports. Such approaches are prone to underreporting due to recall bias, lack of awareness, or perceived irrelevance. Prior studies have shown that patients frequently fail to recognize early micro- or macrovascular damage as “diabetes complications,” especially if this connection has not been communicated by healthcare providers [40]. Notably, nearly half of the participants (42%) reported no diabetes-related complications, which, if taken at face value, would be an encouraging finding. However, in the context of a disease with a well-known progressive course, such claims must be interpreted cautiously. It is likely that some complications have not yet manifested clinically or have not been recognized as diabetes-related. The tendency toward more complications with longer diabetes duration was confirmed in this sample. However, the correlation was modest (r ~ 0.21), consistent with previous findings that highlight the multifactorial nature of complication development. In addition to disease duration, control levels, therapeutic modality, genetic factors, and comorbidities, these factors play key roles [39, 43].
The analysis of physical activity patterns adds another layer of complexity. The high rate of participation in aerobic activity (93%) appears encouraging; however, a closer look reveals a familiar pattern: walking dominates, while targeted strength and balance training remain rare. Approximately 29% of participants engage in strength exercises, and only 16% report performing balance exercises – levels that fall short of expert recommendations for individuals at elevated risk of falls and sarcopenia [40, 42]. Although aerobic activity is foundational for metabolic and cardiovascular health, without structure and progression, it may be insufficient for preventing complex syndromes such as DPN, frailty, or metabolic inflexibility.
A somewhat unexpected result emerges from the analysis of the relationship between physical activity and HbA1c levels: no clear linear correlation was found between frequency or intensity of exercise and glycemic control. This finding may seem counterintuitive, yet it aligns with other research suggesting that the effect of exercise on HbA1c can be heavily influenced by additional factors, including diet, pharmacotherapy, adherence, and overall disease status [41]. In this group, the majority of participants already had relatively well-controlled HbA1c, which reduces variability and may obscure any additive effects of exercise. Furthermore, some of the more active participants have lived longer with the disease, developed more complications, and are therefore more motivated to exercise; however, they also have more challenging glycemic profiles, which may mask the exercise benefits. This phenomenon, known as reverse causality, has been flagged in the literature as a caution against simplistic interpretations of associations between health behaviors and outcomes [39]. Despite the absence of a statistically significant relationship between exercise and HbA1c in this sample, the value of physical activity should not be underestimated. Its benefits extend far beyond glycemic control, encompassing improved cardiovascular fitness, functional capacity, and psychological well-being, particularly in patients with DPN. The study by Haleem et al. [40] directly demonstrated the effectiveness of combined strength, aerobic, and balance training in reducing the severity of neuropathic symptoms, improving stability, and enhancing independence.
Ultimately, these findings reinforce the need for individualized approaches and more straightforward physical activity guidelines, not simply “more walking,” but structured, periodized programs incorporating resistance and balance components in a sustainable and engaging format. Likewise, early screening and prevention of complications must remain a top priority, as once micro- and macrovascular damage progresses, the potential for reversibility diminishes considerably. This missed opportunity for early intervention is perhaps the most visible underlying theme of these findings.
The non-significant Welch test underscores what large, cross-sectional datasets have long suggested: once overall HbA1c is already clustered near guideline targets, incremental differences in exercise dose often vanish beneath the noise of therapy, diet, and disease duration [41]. The direction of the effect, with slightly higher HbA1c in the more active subgroup, almost certainly reflects reverse causality: patients who struggle with glycaemia, or who have lived with diabetes longer, are precisely those who are urged to exercise harder; yet, their metabolic inertia masks any potential benefit. Similar neutral or paradoxical signals appear in population studies whenever activity is self-reported and medication regimens vary widely [39].
The logistic model, which shows a 2.45-fold greater likelihood of strength- or balance-training among university-educated participants, aligns with decades of evidence linking education to health literacy, self-efficacy, and proactive help-seeking [44]. Crucially, the association persists after adjusting for age, gender, and insulin use, implying that knowledge capital outweighs biological or cultural constraints once opportunities to exercise exist. That finding aligns with community trials, where simplified, coached programs have been shown to narrow the participation gap between educational strata [40].
Linear regression adds nuance: higher education independently lowers HbA1c (β ≈ –0.48 p.p.), but the coefficient attenuates (to –0.32 p.p.) after strength/balance training enters the model, signalling partial mediation. In practical terms, some of education’s glycaemic advantage stems from greater engagement in muscle-building exercise, consistent with mechanistic work showing that resistance training enhances insulin sensitivity beyond aerobic activity alone [42]. Yet, much of the educational effect remains direct, likely channeled through diet quality, drug adherence, and timely service use [43].
The absence of age or gender as predictors of strength and balance uptake contradicts stereotypes that women or older adults train less. More plausibly, our sample, recruited partly from rehabilitation clinics, was already motivated, suppressing demographic gradients. Small cell counts and wide confidence intervals suggest separation problems; larger, population-based cohorts typically overcome age- and gender-related barriers unless explicit coaching neutralizes them [45]. Conversely, age emerges as the lone robust predictor of cardiovascular comorbidity, with each additional year adding ~12 % to risk. That linear creep echoes atherosclerotic biology and reinforces calls for earlier, more aggressive risk-factor management, even before midlife, in diabetes [31, 32, 46]. Neither diabetes duration nor insulin therapy remained significant once age was modelled, supporting newer observations that modern basal–bolus regimens do not worsen HbA1c per se when titrated correctly [46].
Finally, the PA × urbanicity interaction, just shy of conventional significance, suggests that the metabolic payoff of exercise may be context-dependent, potentially larger in rural settings where incidental activity, food environments, and social support differ from those in cities. Similar moderation has been reported in European cohorts, although significance typically appears only when sample sizes exceed several hundred [43]. If confirmed, such a gradient would argue for place-tailored interventions: in dense urban areas, structural barriers (such as traffic, cost, and limited green space) may blunt the marginal gains of higher activity, whereas rural residents reap larger benefits from the same dose.
In our study, limitations include the fact that all models are constrained by a modest sample size, reliance on self-report, and a cohort already skewed toward reasonable glycemic control, which leaves little room to detect behavioral effects. Yet the converging signals are instructive:
- Education is a lever, both directly and through increased uptake of muscle- and balance-focused exercise.
- Strength and balance training are essential, as they can independently lower HbA1c and complement aerobic activity.
- Age, more than therapy type, drives cardiovascular burden, underscoring the urgency of earlier prevention.
- Context may shape exercise efficacy; the near-significant moderation by urbanicity warrants exploration in larger, geographically diverse samples.
Translationally, health systems should treat education as a modifiable exposure: plain-language materials, subsidized community gyms, and professional-led balance and strength classes can function as a “social prosthesis” for those lacking formal schooling. Without such scaffolding, the socioeconomic gap in diabetes outcomes documented across Europe is unlikely to narrow [45].
Future research should prioritize stratified analyses by age, education, and urbanicity to minimize confounding effects and more accurately capture subgroup-specific dynamics in glycemic control. Larger, population-based studies with longitudinal designs are recommended to validate the observed links between structured physical activity (especially resistance and balance training) and educational attainment, as well as long-term diabetes outcomes.
Additionally, this pilot analysis serves as a precursor to a larger, ongoing study that aims to include over 500 individuals with DM from diverse backgrounds. The forthcoming study will investigate the intricate relationship between disease-related, clinical, and sociodemographic factors and quality of life, providing a more comprehensive understanding of the issue. By adopting a multidimensional framework, the study aims to inform personalized intervention strategies and public health policies tailored to the specific needs of subgroups within the DM population.
5. Conclusions
This pilot study confirms that glycemic control in individuals with diabetes is influenced by both clinical and lifestyle factors, with education level and participation in strength and balance training emerging as key predictors of lower HbA1c. In contrast, general physical activity frequency and intensity were not significantly associated with glycemic outcomes, likely due to the presence of confounding factors and the already satisfactory metabolic control in most of the sample. Elevated HbA1c was significantly associated with hypertension and retinopathy, underscoring the importance of achieving and maintaining early and sustained glucose control. Older age was the only significant predictor of cardiovascular comorbidity, highlighting the need for preventive strategies to be implemented earlier in life. Educational attainment has both direct and indirect effects, via structured exercise, on health outcomes, suggesting that targeted health literacy interventions may reduce the burden of complications. While context (urban vs. rural) may moderate the effect of activity on HbA1c, further research is needed to confirm this.
Overall, the findings underscore the need for personalized, education-sensitive, and functionally diverse diabetes care that encompasses not only aerobic activity but also resistance and balance training tailored to individual risk profiles.
Author Contributions
Conceptualization, I.C., D.V.,G.K. M.K.Š.,M.S, V.K.,V.M. and D.R. .; methodology, I.C., D.V. G.K. M.S, V.K.,V.M., N.U.T., M.K.Š. and I.L.K.; software, D.V.; validation, I.C., I.L.K., D.V., V.K. and D.R.; formal analysis, D.V.; investigation, I.C., V.K., M.S.,G.K, D.R., N.U.T., V.M.; resources, D.V. and I.C.; data curation, I.C.V.K., D.R. and D.V.; writing—original draft preparation I.L.K. and I.C.; writing—review and editing, I.C. and I.L.K.; visualization, I.C., N.U.T., I.L.K. M.K.Š.; project administration, G.K.; funding acquisition, G.K.. All authors have read and agreed to the published version of the manuscript.
Funding
The University North funded the research in 2025, supporting scientific research and artistic work, under the title "Determinants of the quality of life of patients with type 2 diabetes in the area of the city Zagreb - a cross-sectional study," project code UNIN-BIOMED-25-1-7.
Institutional Review Board Statement
The study was conducted following the Declaration of Helsinki and approved by the Institutional Ethics Committee of the University Clinic for Diabetes, Endocrinology, and Metabolic Diseases “Vuk Vrhovac”, Merkur University Hospital, Zagreb, Croatia (Approval No. 03/1-8275/3; date of approval: 21 November 2024).
Informed Consent Statement
Informed consent was obtained from all subjects involved in the study.
Data Availability Statement
The research data are available on reasonable request from the corresponding author.
Acknowledgments
We sincerely thank all the patients and everyone who supported this research and its development in any way.
Conflicts of Interest
The authors declare no conflicts of interest.
Abbreviations
The following abbreviations are used in this manuscript:
| DM | Diabetes mellitus |
| T1DM | Type 1 diabetes mellitus |
| T2DM | Type 2 diabetes mellitus |
| HbA1c | Hemoglobin A1c (glycated hemoglobin) |
| PA | Physical activity |
| BMI | Body mass index |
| GLP-1 | Glucagon-like peptide-1 |
| DPN | Diabetic peripheral neuropathy |
| MI | Myocardial infarction |
References
- Majety, P.; Lozada Orquera, F. A.; Edem, D.; Hamdy, O. Pharmacological Approaches to the Prevention of Type 2 Diabetes Mellitus. Front Endocrinol (Lausanne) 2023, 14. [Google Scholar] [CrossRef] [PubMed]
- Strati, M.; Moustaki, M.; Psaltopoulou, T.; Vryonidou, A.; Paschou, S. A. Early Onset Type 2 Diabetes Mellitus: An Update. Endocrine, 2024, 85, 965–978. [Google Scholar] [CrossRef] [PubMed]
- Sun, H.; Saeedi, P.; Karuranga, S.; Pinkepank, M.; Ogurtsova, K.; Duncan, B. B.; Stein, C.; Basit, A.; Chan, J. C. N.; Mbanya, J. C.; et al. IDF Diabetes Atlas: Global, Regional and Country-Level Diabetes Prevalence Estimates for 2021 and Projections for 2045. Diabetes Res Clin Pract, 2022, 183. [Google Scholar] [CrossRef] [PubMed]
- Croatian Institute for Public Health. Available online: https://www.hzjz.hr/sluzba-epidemiologija-prevencija-nezaraznih-bolesti/odjel-za-koordinaciju-i-provodenje-programa-i-projekata-za-prevenciju-kronicnih-nezaraznih-bolest/dijabetes/ (accessed on 23 June 2025).
- Kautzky-Willer, A.; Harreiter, J.; Pacini, G. Sex and Gender Differences in Risk, Pathophysiology and Complications of Type 2 Diabetes Mellitus. Endocr Rev, 2016, 37, 278. [Google Scholar] [CrossRef] [PubMed]
- Magliano, D. J.; Sacre, J. W.; Harding, J. L.; Gregg, E. W.; Zimmet, P. Z.; Shaw, J. E. Young-Onset Type 2 Diabetes Mellitus - Implications for Morbidity and Mortality. Nat Rev Endocrinol, 2020, 16, 321–331. [Google Scholar] [CrossRef] [PubMed]
- Sims, E. K.; Besser, R. E. J.; Dayan, C.; Rasmussen, C. G.; Greenbaum, C.; Griffin, K. J.; Hagopian, W.; Knip, M.; Long, A. E.; Martin, F.; et al. Screening for Type 1 Diabetes in the General Population: A Status Report and Perspective. Diabetes, 2022, 71, 610–623. [Google Scholar] [CrossRef] [PubMed]
- Lascar, N.; Altaf, Q.A.; Raymond, N.T.; Brown, J.E.P.; Pattison, H.; Barnett, A.; Bailey, C.J.; Bellary, S. Phenotypic Characteristics and Risk Factors in a Multi-Ethnic Cohort of Young Adults with Type 2 Diabetes. Curr Med Res Opin, 2019, 35, 1893–1900. [Google Scholar] [CrossRef] [PubMed]
- Song, S. H. Early-Onset Type 2 Diabetes: High Lifetime Risk for Cardiovascular Disease. Lancet Diabetes Endocrinol, 2016, 4, 87–88. [Google Scholar] [CrossRef] [PubMed]
- Mei, Y.; Yang, X.; Gui, J.; Li, Y.; Zhang, X.; Wang, Y.; Chen, W.; Chen, M.; Liu, C.; Zhang, L. The Relationship between Psychological Resilience and Quality of Life among the Chinese Diabetes Patients: The Mediating Role of Stigma and the Moderating Role of Empowerment. BMC Public Health, 2023, 23. [Google Scholar] [CrossRef] [PubMed]
- Tancredi, M.; Rosengren, A.; Svensson, A.-M.; Kosiborod, M.; Pivodic, A.; Gudbjörnsdottir, S.; Wedel, H.; Clements, M.; Dahlqvist, S.; Lind, M. Excess Mortality among Persons with Type 2 Diabetes. New England Journal of Medicine, 2015, 373, 1720–1732. [Google Scholar] [CrossRef] [PubMed]
- Atchison, E. A.; Gridley, G.; Carreon, J. D.; Leitzmann, M. F.; McGlynn, K. A. Risk of Cancer in a Large Cohort of U.S. Veterans with Diabetes. Int J Cancer, 2011, 128, 635. [Google Scholar] [CrossRef] [PubMed]
- Tseng, C. H.; Tseng, F. H. Diabetes and Gastric Cancer: The Potential Links. World J Gastroenterol 2014, 20, 1701. [Google Scholar] [CrossRef] [PubMed]
- Seshasai, S. R. K.; Kaptoge, S.; Thompson, A.; Angelantonio, E. Di; Gao, P.; Sarwar, N.; Whincup, P. H.; Mukamal, K. J.; Gillum, R. F.; Holme, I.; et al. Diabetes Mellitus, Fasting Glucose, and Risk of Cause-Specific Death. New England journal of medicine 2011, 364, 829. [Google Scholar] [CrossRef]
- Martín-Peláez, S.; Fito, M.; Castaner, O. Mediterranean Diet Effects on Type 2 Diabetes Prevention, Disease Progression, and Related Mechanisms. A Review. Nutrients, 2020, 12, 1–15. [Google Scholar] [CrossRef] [PubMed]
- Elsayed, N. A.; Aleppo, G.; Aroda, V. R.; Bannuru, R. R.; Brown, F. M.; Bruemmer, D.; Collins, B. S.; Hilliard, M. E.; Isaacs, D.; Johnson, E. L.; et al. 2. Classification and Diagnosis of Diabetes: Standards of Care in Diabetes-2023. Diabetes Care, 2023, 46, S19–S40. [Google Scholar] [CrossRef] [PubMed]
- Zhou, B.; Sheffer, K. E.; Bennett, J. E.; Gregg, E. W.; Danaei, G.; Singleton, R. K.; Shaw, J. E.; Mishra, A.; Lhoste, V. P. F.; Carrillo-Larco, R. M.; et al. Global Variation in Diabetes Diagnosis and Prevalence Based on Fasting Glucose and Hemoglobin A1c. Nat Med, 2023, 29, 2885–2901. [Google Scholar] [CrossRef]
- Nanayakkara, N.; Curtis, A. J.; Heritier, S.; Gadowski, A. M.; Pavkov, M. E.; Kenealy, T.; Owens, D. R.; Thomas, R. L.; Song, S.; Wong, J.; et al. Impact of Age at Type 2 Diabetes Mellitus Diagnosis on Mortality and Vascular Complications: Systematic Review and Meta-Analyses. Diabetologia, 2021, 64, 275–287. [Google Scholar] [CrossRef] [PubMed]
- Lascar, N.; Brown, J.; Pattison, H.; Barnett, A. H.; Bailey, C. J.; Bellary, S. Type 2 Diabetes in Adolescents and Young Adults. Lancet Diabetes Endocrinol, 2018, 6, 69–80. [Google Scholar] [CrossRef] [PubMed]
- Antwi, J. Precision Nutrition to Improve Risk Factors of Obesity and Type 2 Diabetes. Curr Nutr Rep, 2023, 12, 679–694. [Google Scholar] [CrossRef] [PubMed]
- Walker, R. J.; Strom Williams, J.; Egede, L. E. Influence of Race, Ethnicity and Social Determinants of Health on Diabetes Outcomes. Am J Med Sci 2016, 351, 366–373. [Google Scholar] [CrossRef] [PubMed]
- Qiu, S.; Cai, X.; Yin, H.; Sun, Z.; Zügel, M.; Steinacker, J. M.; Schumann, U. Exercise Training and Endothelial Function in Patients with Type 2 Diabetes: A Meta-Analysis. Cardiovasc Diabetol, 2018, 17. [Google Scholar] [CrossRef] [PubMed]
- Hollekim-Strand, S. M.; Bjørgaas, M. R.; Albrektsen, G.; Tjønna, A. E.; Wisløff, U.; Ingul, C. B. High-Intensity Interval Exercise Effectively Improves Cardiac Function in Patients with Type 2 Diabetes Mellitus and Diastolic Dysfunction: A Randomized Controlled Trial. J Am Coll Cardiol 2014, 64, 1758–1760. [Google Scholar] [CrossRef] [PubMed]
- Emadian, A.; Andrews, R. C.; England, C. Y.; Wallace, V.; Thompson, J. L. The Effect of Macronutrients on Glycaemic Control: A Systematic Review of Dietary Randomised Controlled Trials in Overweight and Obese Adults with Type 2 Diabetes in Which There Was No Difference in Weight Loss between Treatment Groups. Br J Nutr, 2015, 114, 1656–1666. [Google Scholar] [CrossRef] [PubMed]
- You, H.; Hu, J.; Liu, Y.; Luo, B.; Lei, A. Risk of Type 2 Diabetes Mellitus after Gestational Diabetes Mellitus: A Systematic Review & Meta-Analysis. Indian J Med Res, 2021, 154, 62–77. [Google Scholar] [CrossRef] [PubMed]
- Rosenbloom, J. I.; Blanchard, M. H. Compliance with Postpartum Diabetes Screening Recommendations for Patients with Gestational Diabetes. J Womens Health, 2018, 27, 498–502. [Google Scholar] [CrossRef] [PubMed]
- Przezak, A.; Bielka, W.; Pawlik, A. Hypertension and Type 2 Diabetes-The Novel Treatment Possibilities. Int J Mol Sci, 2022, 23. [Google Scholar] [CrossRef] [PubMed]
- Wrona, M.; Skrypnik, D. New-Onset Diabetes Mellitus, Hypertension, Dyslipidaemia as Sequelae of COVID-19 Infection-Systematic Review. Int J Environ Res Public Health, 2022, 19. [Google Scholar] [CrossRef] [PubMed]
- Cho, N. H.; Shaw, J. E.; Karuranga, S.; Huang, Y.; da Rocha Fernandes, J. D.; Ohlrogge, A. W.; Malanda, B. IDF Diabetes Atlas: Global Estimates of Diabetes Prevalence for 2017 and Projections for 2045. Diabetes Res Clin Pract 2018, 138, 271–281. [Google Scholar] [CrossRef] [PubMed]
- Bellary, S.; Kyrou, I.; Brown, J. E.; Bailey, C. J. Type 2 Diabetes Mellitus in Older Adults: Clinical Considerations and Management. Nat Rev Endocrinol, 2021, 17, 534–548. [Google Scholar] [CrossRef] [PubMed]
- Inciardi, R. M.; Claggett, B.; Gupta, D. K.; Cheng, S.; Liu, J.; Tcheugui, J. B. E.; Ndumele, C.; Matsushita, K.; Selvin, E.; Solomon, S. D.; et al. Cardiac Structure and Function and Diabetes-Related Risk of Death or Heart Failure in Older Adults. J Am Heart Assoc 2022, 11. [Google Scholar] [CrossRef] [PubMed]
- Obisesan, O. H.; Orimoloye, O. A.; Wang, F. M.; Dardari, Z. A.; Selvin, E.; Boakye, E.; Osei, A. D.; Honda, Y.; Dzaye, O.; Pankow, J.; et al. Coronary Artery Calcium Scores in Older Adults With Diabetes and Their Association With Diabetes-Specific Risk Enhancers (from the Atherosclerosis Risk in Communities Study). Am J Cardiol, 2023, 201, 219–223. [Google Scholar] [CrossRef] [PubMed]
- Potter, A. W.; Chin, G. C.; Looney, D. P.; Friedl, K. E. Defining Overweight and Obesity by Percent Body Fat Instead of Body Mass Index. J Clin Endocrinol Metab, 2025, 110. [Google Scholar] [CrossRef] [PubMed]
- Boutari, C.; Mantzoros, C. S. A 2022 Update on the Epidemiology of Obesity and a Call to Action: As Its Twin COVID-19 Pandemic Appears to Be Receding, the Obesity and Dysmetabolism Pandemic Continues to Rage On. Metabolism, 2022, 133. [Google Scholar] [CrossRef] [PubMed]
- Zhan, Z.; Chen, X.; Xu, S.; Li, Q.; Yu, J.; Guo, Z.; Chen, B. Impact of High Body Mass Index on Gallbladder and Biliary Tract Cancer Burden in China: A Comprehensive Analysis of Trends from 1990 to 2021. World J Surg Oncol, 2024, 22, 296. [Google Scholar] [CrossRef] [PubMed]
- Shabestari, A. N.; Moghaddam, S. S.; Sharifi, F.; Fadayevatan, R.; Nabavizadeh, F.; Delavari, A.; Jamshidi, H. R.; Naderimagham, S. The Most Prevalent Causes of Deaths, DALYs, and Geriatric Syndromes in Iranian Elderly People Between 1990 and 2010: Findings from the Global Burden of Disease Study 2010. Arch Iran Med, 2015, 18, 462–479. [Google Scholar]
- Yatsuda, M.; Furou, M.; Kamachi, K.; Sakamoto, K.; Shoji, K.; Ishihara, O.; Kagawa, Y. Serotonin Transporter Gene Polymorphisms Predict Adherence to Weight Loss Programs Independently of Obesity-Related Genes. Nutrients 2025, 17, 1094. [Google Scholar] [CrossRef] [PubMed]
- Niezgoda, N.; Chomiuk, T.; Kasiak, P.; Mamcarz, A.; Śliż, D. The Impact of Physical Activity on Weight Loss in Relation to the Pillars of Lifestyle Medicine-A Narrative Review. Nutrients, 2025, 17. [Google Scholar] [CrossRef] [PubMed]
- Riandini, T.; Khoo, E. Y. H.; Tai, B. C.; Tavintharan, S.; Phua, M. S. L. A.; Chandran, K.; Hwang, S. W.; Venkataraman, K. Fall Risk and Balance Confidence in Patients With Diabetic Peripheral Neuropathy: An Observational Study. Front Endocrinol (Lausanne) 2020, 11. [Google Scholar] [CrossRef] [PubMed]
- Haleem, F.; Saeed, A.; Kundi, M.; Jalal, A.; Bilal, M.; Jalal, M. Combined Effects of Strength and Balance Training versus Aerobic Training on Balance, Neuropathy Symptoms and Quality of Life in Patients with Diabetic Peripheral Neuropathy. Physiotherapy Research International, 2024, 29. [Google Scholar] [CrossRef] [PubMed]
- Ernandes, R. de C.; Brech, G. C.; Luna, N. M. S.; Bega, A.; Guimarães, D. S.; Bocalini, D. S.; Scherrer, G.; Greve, J. M. D. A.; Leme, L. E. G.; Alonso, A. C. Impact of Diabetic Neuropathy on Quality of Life and Postural Balance in Brazilian Older Adults. Acta Ortop Bras, 2020, 28, 275–279. [Google Scholar] [CrossRef] [PubMed]
- de Seixas Soares, A. L.; Brech, G. C.; Machado-Lima, A.; dos Santos, J. R.; D’ Andréa Greve, J. M.; Grecco, M. V.; Afonso, M.; Sousa, J. C.; Rodrigues, A. T.; dos Santos Lino, M. H.; et al. Can 12-Week Resistance Training Improve Muscle Strength, Dynamic Balance and the Metabolic Profile in Older Adults with Type 2 Diabetes Mellitus? Int J Environ Res Public Health, 2025, 22, 184. [Google Scholar] [CrossRef] [PubMed]
- Ding, L.; Fu, B.; Zhang, H.; Dai, C.; Zhang, A.; Yu, F.; Mi, L.; Hua, W.; Tang, M. The Impact of Triglyceride Glucose-Body Mass Index on All-Cause and Cardiovascular Mortality in Elderly Patients with Diabetes Mellitus: Evidence from NHANES 2007–2016. BMC Geriatr 2024, 24, 356. [Google Scholar] [CrossRef] [PubMed]
- Dominick, G. M.; Dunsiger, S. I.; Pekmezi, D. W.; Marcus, B. H. Health Literacy Predicts Change in Physical Activity Self-Efficacy Among Sedentary Latinas. J Immigr Minor Health, 2013, 15, 533. [Google Scholar] [CrossRef] [PubMed]
- Marmot, M. Social Determinants of Health Inequalities. Lancet, 2005, 365, 1099–1104. [Google Scholar] [CrossRef] [PubMed]
- Davies, M. J.; Aroda, V. R.; Collins, B. S.; Gabbay, R. A.; Green, J.; Maruthur, N. M.; Rosas, S. E.; Del Prato, S.; Mathieu, C.; Mingrone, G.; et al. Management of Hyperglycaemia in Type 2 Diabetes, 2022. A Consensus Report by the American Diabetes Association (ADA) and the European Association for the Study of Diabetes (EASD). Diabetologia, 2022, 65, 1925–1966. [Google Scholar] [CrossRef] [PubMed]
Figure 1.
Clusters by HbA1c and exercise intensity.
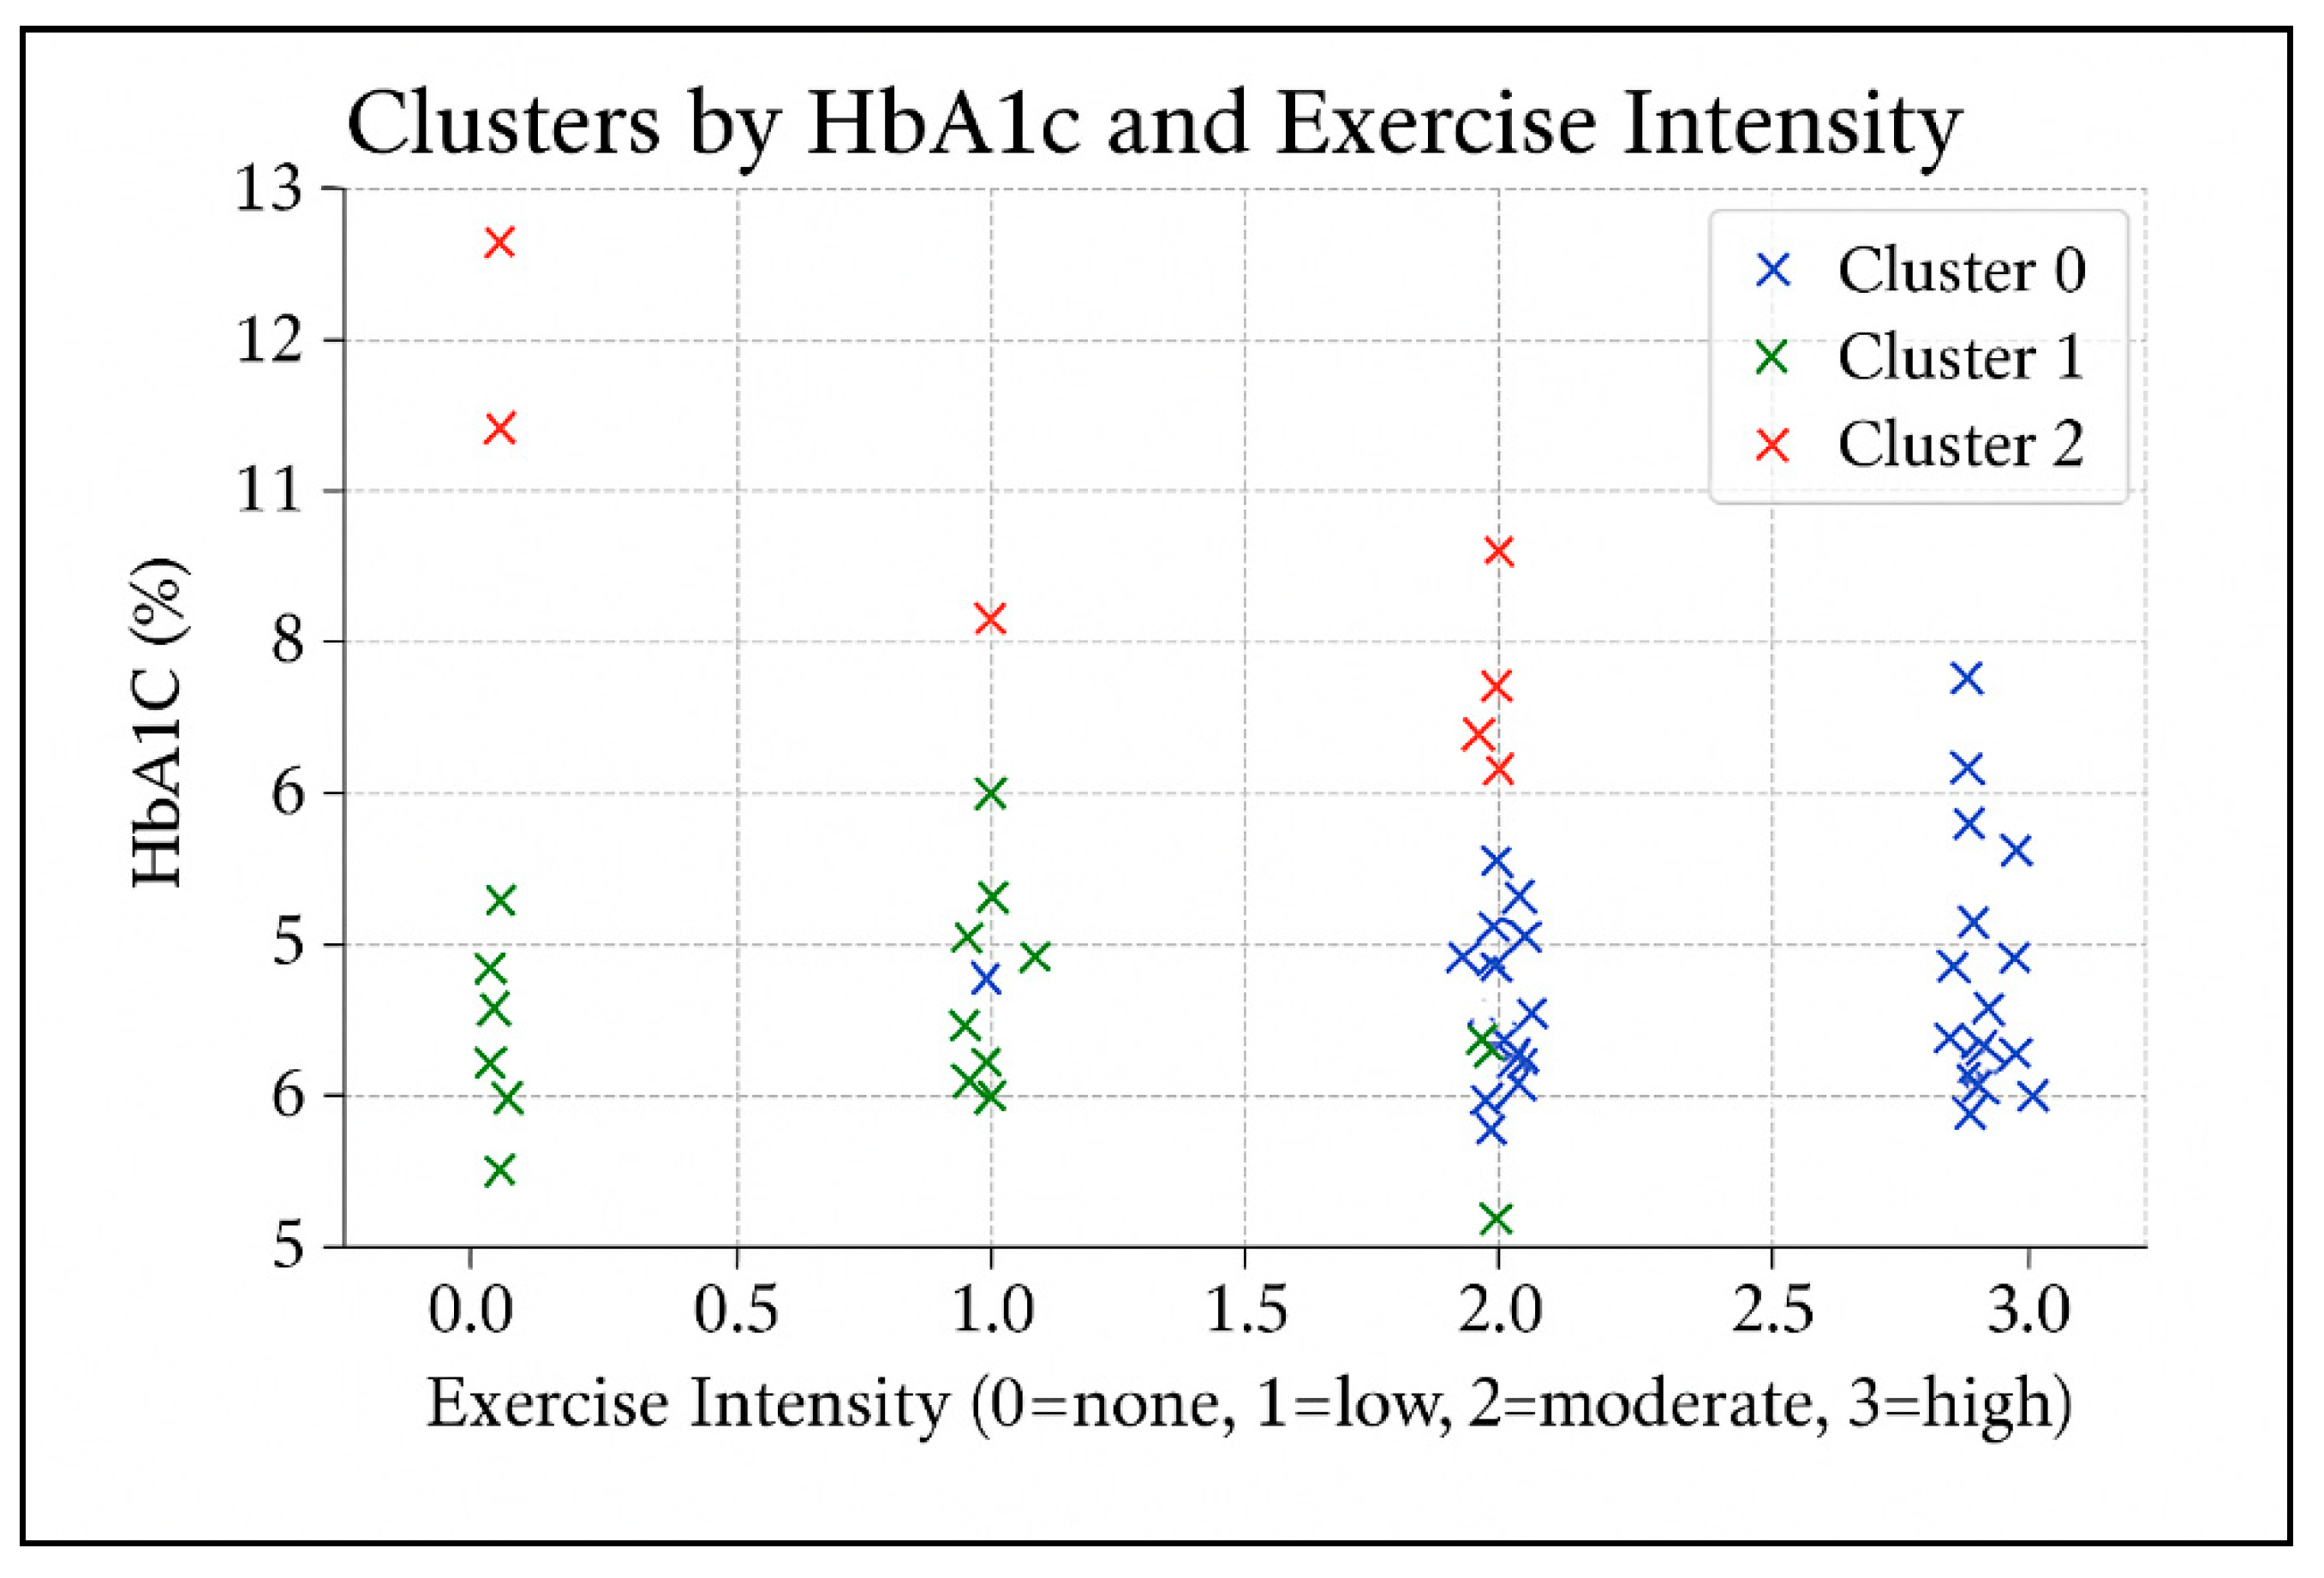
Figure 2.
Effects of physical activity (PA), urbanicity, and their interaction on HbA1c levels.
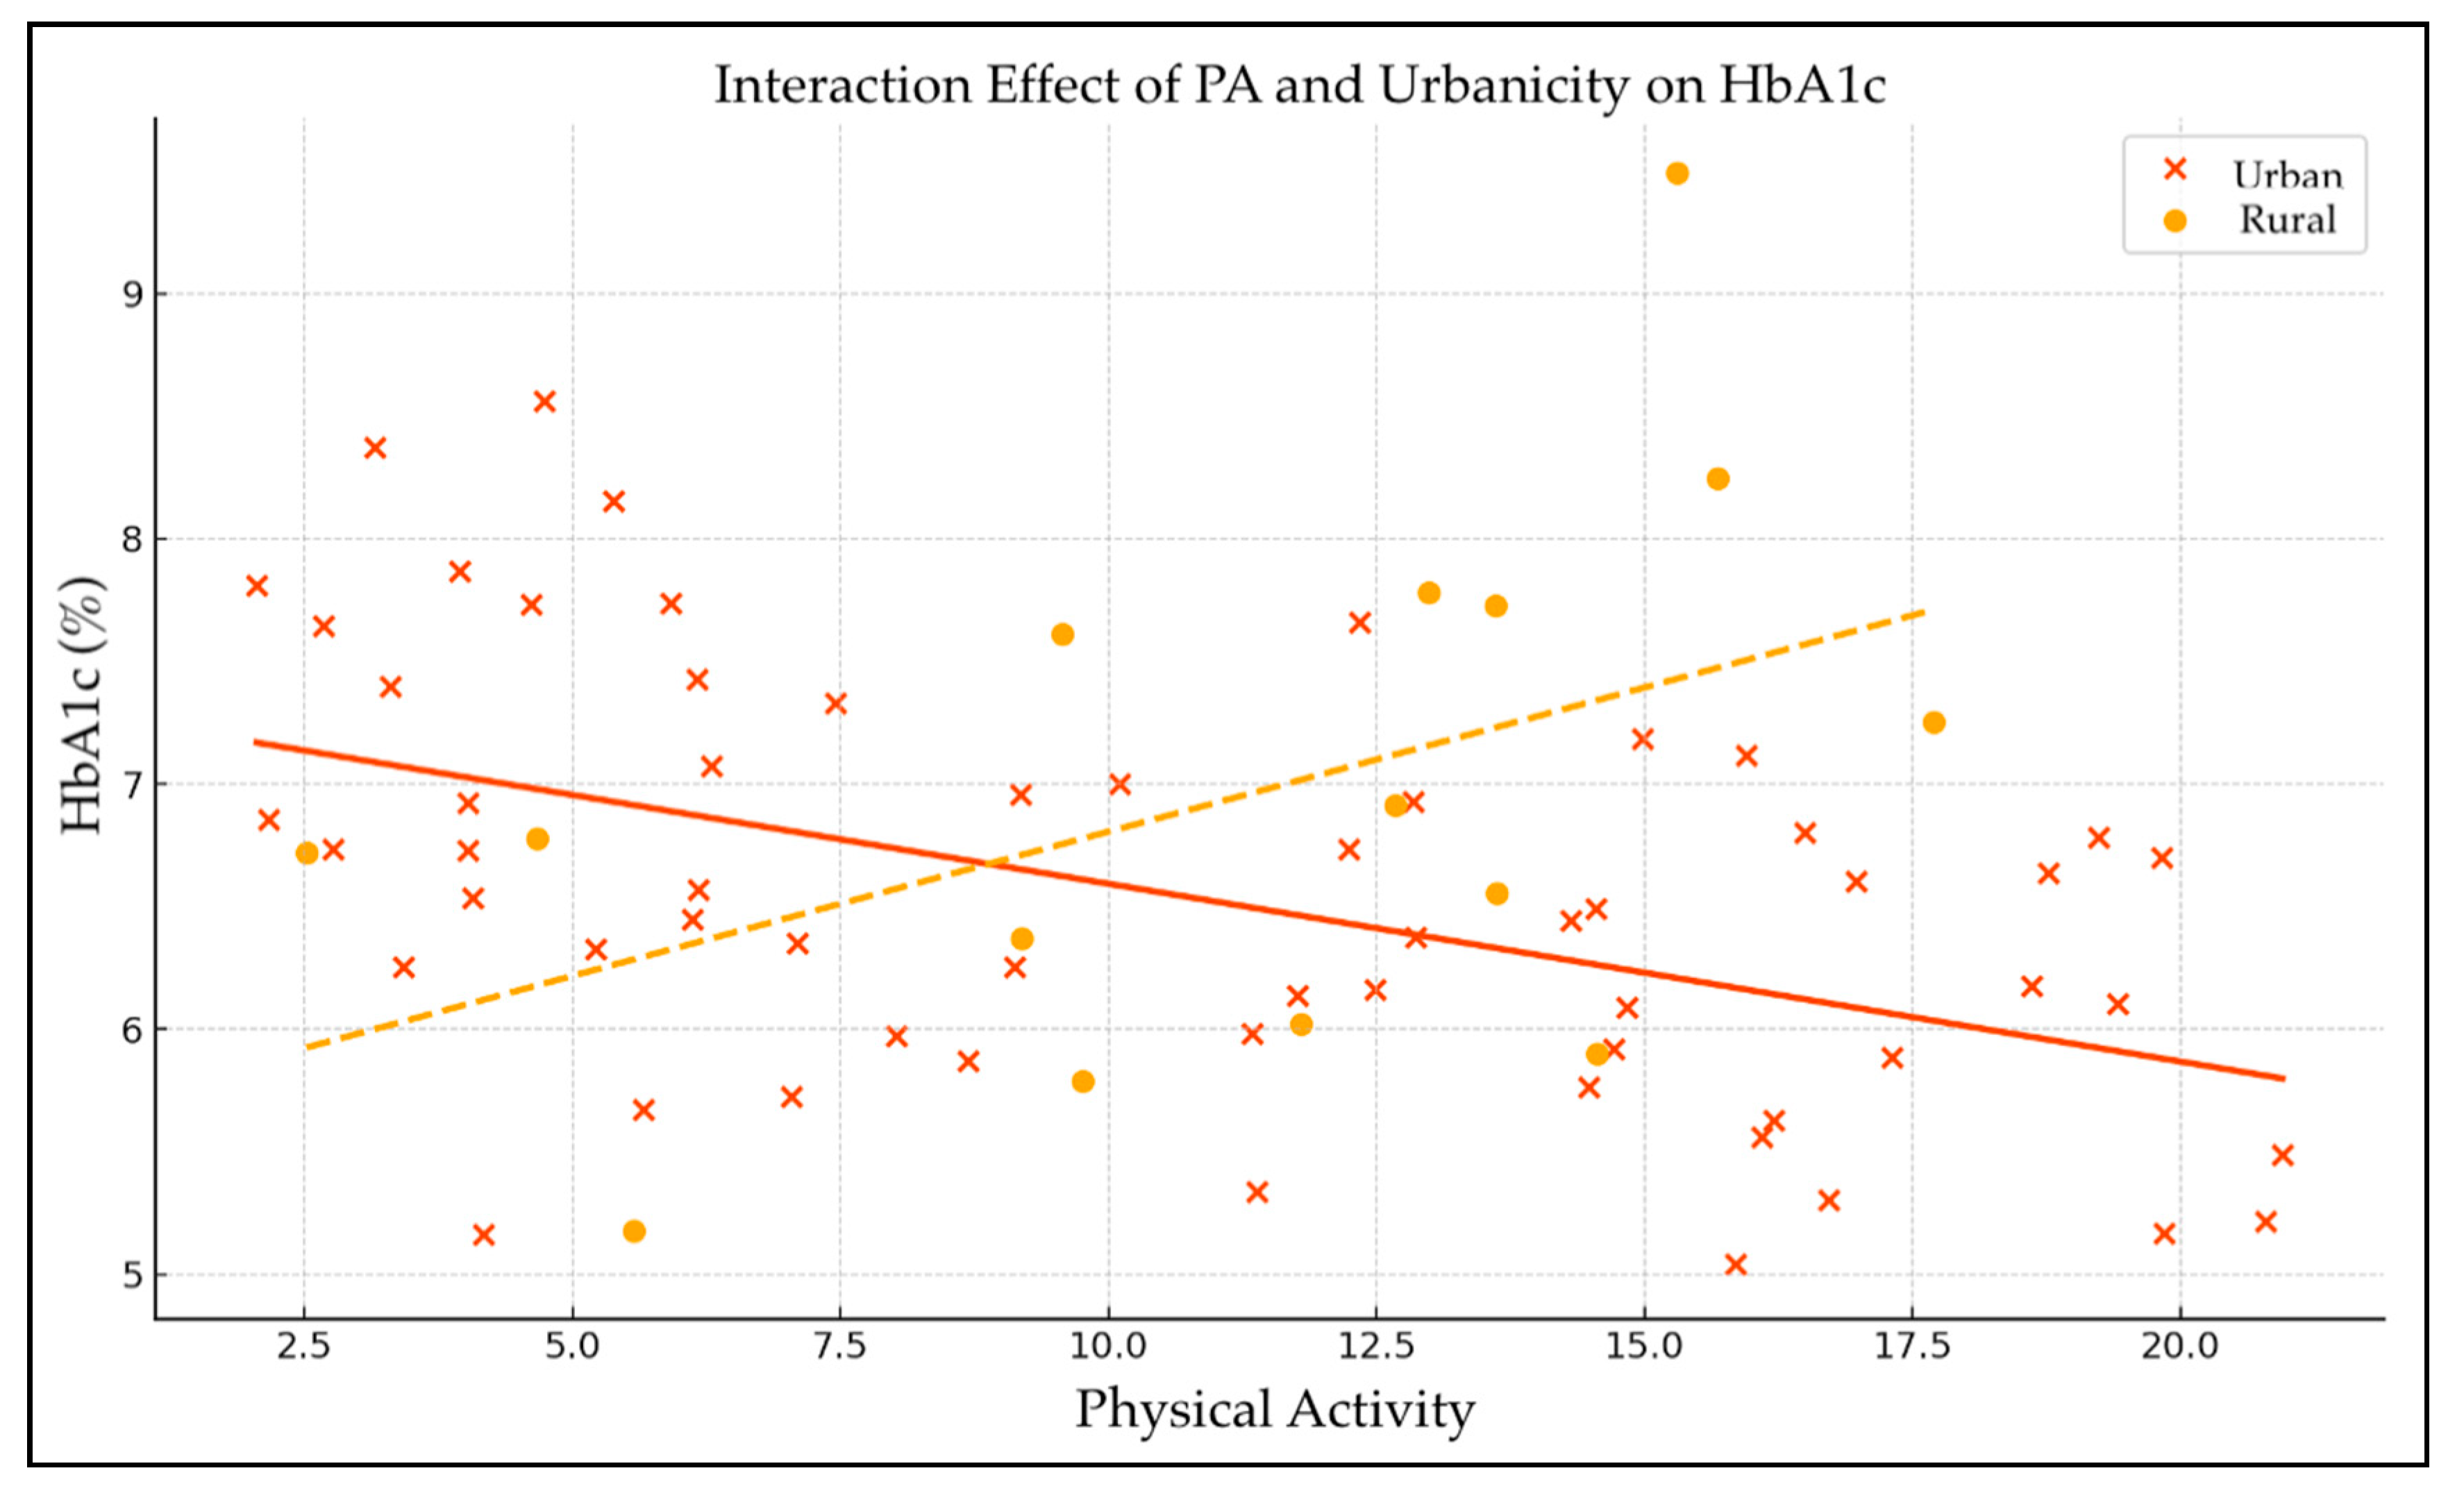

Table 1.
Sociodemographic characteristics of the sample (N = 95).
| Construct / Variable | Category | N (%) |
|---|---|---|
| gender | male | 53 (55.8%) |
| female | 42 (44.2%) | |
| age group | 18–25 | 4 (4.21%) |
| 26–33 | 3 (3.16%) | |
| 34–41 | 6 (6.32%) | |
| 42–49 | 10 (10.53%) | |
| 50–57 | 12 (12.63%) | |
| 58–65 | 20 (21.05%) | |
| 65+ | 40 (42.11%) | |
| educational attainment | secondary school (currently enrolled) | 54 (56.8%) |
| completed secondary school / high school diploma | 10 (10.5%) | |
| completed undergraduate degree | 14 (14.7%) | |
| completed graduate degree or higher | 31 (32.6%) | |
| marital status | married | 59 (62.1%) |
| single (never married) | 13 (13.7%) | |
| widowed | 12 (12.6%) | |
| divorced | 5 (5.3%) | |
| cohabiting partnership | 1 (1.1%) | |
| in a relationship | 1 (1.1%) | |
| engaged | 1 (1.1%) | |
| not specified / other | 3 (3.2%) | |
| place of residence | urban (town/city) | 74 (77.9%) |
| rural (village) | 21 (22.1%) | |
| employment status | retired | 48 (50.5%) |
| employed, full-time | 41 (43.2%) | |
| employed, part-time | 2 (2.1%) | |
| unemployed | 4 (4.2%) |
Table 2.
Clinical characteristics and physical activity patterns among individuals with diabetes1 (N = 95).
Table 2.
Clinical characteristics and physical activity patterns among individuals with diabetes1 (N = 95).
| Construct / Variable | Category | N (%) |
|---|---|---|
| type of diabetes | T1DM | 25 (26.3) |
| T2DM | 70 (73.7) | |
| treatment type | insulin | 25 (26.3) |
| oral medication (tablets) | 70 (73.7) | |
| complications / comorbidities | ||
| arterial hypertension | 60 (63.2%) | |
| diabetic foot | 15 (15.8%) | |
| retinopathy | 30 (31.6%) | |
| nephropathy | 12 (12.6%) | |
| neuropathy / polyneuropathy | 8 (8.4%) | |
| cardiovascular (mi, stroke, etc.) | 12 (12.6%) | |
| other (psoriasis, cancer, etc.) | 10 (10.5%) | |
| aerobic exercise | walking / brisk walking | 90 (94.7%) |
| cycling | 20 (21.1%) | |
| swimming | 15 (15.8%) | |
| hiking / nordic walking | 12 (12.6%) | |
| dance / yoga / pilates | 10 (10.5%) | |
| anaerobic / strength | free weights / dumbbells | 25 (26.3%) |
| elastic bands / body-weight | 30 (31.6%) | |
| gym machines | 20 (21.1%) | |
| balance / coordination | one-leg stand / tai-chi | 20 (21.1%) |
| exercise intensity | low (< 30 min) | 25 (26.3%) |
| moderate (30–60 min) | 50 (52.6%) | |
| high (60–120 min) | 20 (21.1%) | |
| exercise frequency | every day | 35 (36.8%) |
| ≥ 3 times per week | 40 (42.1%) | |
| 2 times per week | 15 (15.8%) | |
| < 2 times per week / irregular | 5 (5.3%) | |
| body mass index (BMI) | 18.5–24.99 | 27 (28.72%) |
| 25–29.99 | 40 (42.55%) | |
| 30–34.99 | 16 (17.02%) | |
| 35–39.99 | 7 (7.45%) | |
| ≥ 40 | 2 (2.13%) |
1Percentages for complications and physical activity types do not sum to 100% because of multiple responses. Frequencies are based on visual inspection of paper records and may include minor estimation errors.
Table 3.
Fasting glucose, HbA1c, cholesterol, and creatinine: summary statistics2.
| Variable | N | Mean | SD | Min | Max |
|---|---|---|---|---|---|
| fasting glucose (mmol/L) | 82 | 7.9 | 2.3 | 4.2 | 16.5 |
| HbA1c (%) | 90 | 6.9 | 1.3 | 5.0 | 12.7 |
| total cholesterol (mmol/L) | 88 | 4.6 | 1.1 | 2.1 | 7.8 |
| serum creatinine (µmol/L) | 81 | 76.8 | 34.6 | 0.7 | 204.0 |
2N values vary due to missing data. The inclusion of range allows for a more nuanced interpretation of inter-individual variability within each clinical parameter.
Table 4.
Comparison of HbA1c values between physically active and less active.
| Group | N | Mean HbA1c ± SD | t (df) | p | Cohen’s d | 95% CI of the Difference |
|---|---|---|---|---|---|---|
| active | 75 | 6.86 ± 1.25 | ||||
| less active | 20 | 6.67 ± 1.01 | −0.72 (36) | 0.479 | 0.16 | −0.35 to 0.73 |
3Welch’s t-test was used due to unequal group sizes (N = 75 vs. N = 20) and variance differences, preventing type I or II errors from standard t-test assumption violations. Active = exercise frequency≥ 3 times per week and every day; less active = exercise frequency 2 times per week < 2 times per week / irregular.
Table 5.
Prevalence of diabetes complications by HbA1c level and associated odds ratios.
| Complication | Prevalence HbA1c > 7.5% | Prevalence HbA1c ≤ 7.5% | χ² (1) | p | OR | 95% CI OR |
|---|---|---|---|---|---|---|
| arterial hypertension | 26 / 32 | 34 / 63 | 6.79 | 0.009 | 3.70 | 1.34 – 10.21 |
| retinopathy | 15 / 32 | 15 / 63 | 5.23 | 0.022 | 2.82 | 1.14 – 6.98 |
| nephropathy | 6 / 32 | 6 / 63 | 1.64 | 0.201 | 2.19 | 0.65 – 7.45 |
HbA1c: glycated hemoglobin; OR: odds ratio; CI: confidence interval. χ² (1): Chi-square tests (df = 1) were used to assess differences in complication prevalence between patients with HbA1c > 7.5% and those with HbA1c ≤ 7.5%.
Table 6.
Predictors of engaging in strength and balance training: full logistic regression4.
| Predictor | OR | 95% CI | p |
|---|---|---|---|
| education ≥ university level | 2.45 | 1.12 – 5.36 | 0.025 |
| age (years) | 0.97 | 0.94 – 1.01 | 0.110 |
| gender (male) | 1.20 | 0.55 – 2.63 | 0.650 |
| duration of diabetes (years) | 1.04 | 0.99 – 1.10 | 0.120 |
| T2DM (vs. T1DM) | 0.83 | 0.32 – 2.10 | 0.700 |
| insulin therapy | 1.35 | 0.53 – 3.42 | 0.530 |
OR: odds ratio; CI: confidence interval. 4Full logistic regression model with education, age, gender, diabetes duration, diabetes type, and insulin therapy as predictors of engaging in strength and balance training at least once per week.
Table 7.
Predictors of engaging in strength and balance training: parsimonious logistic regression model5.
Table 7.
Predictors of engaging in strength and balance training: parsimonious logistic regression model5.
| Predictor | OR | 95% CI for OR | p |
|---|---|---|---|
| constant | 0.01 | 0.00 – 0.69 | 0.033 |
| T2DM (vs. T1DM) | 26.51 | 0.03 – 24,329.90 | 0.346 |
| age (years) | 1.05 | 0.91 – 1.22 | 0.505 |
| male | 0.87 | 0.16 – 4.72 | 0.875 |
| duration of diabetes (years) | 1.04 | 0.89 – 1.22 | 0.611 |
5Parsimonious logistic regression model including selected clinical and demographic predictors of engaging in strength or balance training at least once per week. OR: odds ratio; CI: confidence interval.
Table 8.
Predictors of HbA1c (%): linear regression6.
| Predictor | β | SE | p |
|---|---|---|---|
| (intercept) | 8.05 | 0.64 | <0.001 |
| education ≥ university level | −0.48 | 0.19 | 0.013 |
| strength/balance training | −0.32 | 0.15 | 0.041 |
| age (years) | 0.01 | 0.01 | 0.080 |
| gender (male) | −0.05 | 0.14 | 0.730 |
| disease duration (years) | 0.03 | 0.01 | 0.004 |
| T2DM (vs. T1DM) | 0.38 | 0.17 | 0.030 |
6Results from the linear regression model assessing predictors of HbA1c levels.β: unstandardized regression coefficient; SE: standard error; HbA1c: glycated hemoglobin; T2DM: type 2 diabetes mellitus (reference category = type 1 diabetes); education: dichotomized as university degree or higher vs. lower educational attainment; strength/balance training: engaging in such activity at least once per week (yes = 1, no = 0); gender: male = 1, female = 0.
Table 9.
Predictors of cardiovascular comorbidities: logistic regression7.
| Predictor | OR | 95 % CI OR | p |
|---|---|---|---|
| const | 0.01 | 0.00 – 0.13 | 0.001 |
| T2DM | 0.63 | 0.01 – 55.41 | 0.839 |
| age | 1.12 | 1.02 – 1.23 | 0.019 |
| male | 0.46 | 0.15 – 1.39 | 0.169 |
| disease duration | 0.96 | 0.87 – 1.06 | 0.45 |
7Logistic regression model assessing predictors of having ≥1 cardiovascular comorbidity (e.g., myocardial infarction, stroke, angina). OR = odds ratio; CI = confidence interval; p = p-value; T2DM = type 2 diabetes mellitus (reference category = type 1 diabetes); Age and disease duration are measured in years; gender coded as 1 = male, 0 = female.
Table 10.
Predictors of HbA1c levels: linear regression8.
| Coefficient | β (SE) | 95 % CI | p |
|---|---|---|---|
| intercept | 6,50 (0,55) | 5,41 – 7,59 | < 0,001 |
| PA (β₁) | –0,031 (0,034) | –0,099 – 0,037 | 0,370 |
| urbanicity (β₂) | 0,21 (0,59) | –0,96 – 1,38 | 0,730 |
| interaction PA × urbanicity (β₃) | –0,081 (0,042) | –0,165 – 0,003 | 0,061 |
8Multiple linear regression analysis examining the association between physical activity (PA), urbanicity, and their interaction on glycated hemoglobin (HbA1c) levels. β = unstandardized regression coefficient; SE = standard error; 95% CI = 95% confidence interval. The interaction term tests whether the effect of physical activity on HbA1c differs by urban or rural residence.
Disclaimer/Publisher’s Note: The statements, opinions and data contained in all publications are solely those of the individual author(s) and contributor(s) and not of MDPI and/or the editor(s). MDPI and/or the editor(s) disclaim responsibility for any injury to people or property resulting from any ideas, methods, instructions or products referred to in the content. |
© 2025 by the authors. Licensee MDPI, Basel, Switzerland. This article is an open access article distributed under the terms and conditions of the Creative Commons Attribution (CC BY) license (http://creativecommons.org/licenses/by/4.0/).
Copyright: This open access article is published under a Creative Commons CC BY 4.0 license, which permit the free download, distribution, and reuse, provided that the author and preprint are cited in any reuse.


