Submitted:
15 July 2025
Posted:
16 July 2025
You are already at the latest version
Abstract
Handedness, as an inherent characteristic in the human subsystem, is often overlooked or considered as having "no obvious connection" to safety. To explore the relationship between handedness and safety, this study proposed three hypotheses and conducted a series of questionnaires, experiments, and statistical analyses around them. This research system is considered a method that can accurately reflect the relationship between handedness and system safety. The results showed that left-handed testers had excellent operational and correct capture abilities in the predetermined safety scenario. Individual factors did not affect this advantage, and the advantage even expanded with the increase of individual factor scores. In addition, when considering the palm travel angle α and arm extension direction β, the characterization phenomenon of handedness showed incomplete symmetry. However, regardless of how α and β changed, the overall performance of left-handed people was still better than that of right-handed people. This further proves that left-handed operators have better accident prevention and control capabilities for accidents themselves, and this advantage makes the system closer to inherent safety. For a specific operating position (train driver), we found that left-handed drivers performed better than right-handed drivers in braking time (83.6ms ahead of braking) and emergency braking error rate (decreased by 7.7‰), indirectly verifying the unique advantage of left-handed manipulators in accident prevention or control. This study proves that handedness can become a new influencing factor of HCI safety and verifies its importance and criticality as an evaluation criterion, which establishes a bridge between handedness and safety.
Keywords:
handedness
; HCI
; numerical analysis
; handling safety
; braking ergonomics
1. Introduction
Safety issues have always been the focus of attention in various fields around the world. With the popularization and application of new man-machine cooperative devices, the role of human factors in the field of safety has been paid more and more attention [1,2]. Dominant hand, as one of the inherent characteristics of human beings, has an important influence on people ‘s sports performance, cognition and attention in daily life. Most of the previous studies have focused on the effect of dominant hand on human cognition and sport performance [3]. However, the relationship between dominant hand and safety is often neglected or considered to be “ no obvious link “, so there are few studies on its application and value in the field of safety. We believe that the application and value of dominant hand in the field of safety need to be further explored.
The development and persistence of laterality is a key feature of human motor behavior, in which the asymmetry of hand use is the most prominent [4]. Sanja Budisavljevic et al. defined the handedness in response to this asymmetry: one hand tends to play a dominant and manipulative role, which is called the dominant hand while the other hand plays a supportive and stable role. Right-handedrs and left-handers were distinguished according to the degree and direction of hand habitus, and the asymmetry between the two is called handedness [5].
Scholars in various fields [6,7,8] studied and recorded the differences between the dominant hand, among which the characteristics of creativity, novelty pursuit, spatial ability and mental rotation task were positively correlated with left-handers. At the same time, some scholars use Annett ‘s nail plate [9] knock fast [10,11], circle marking [12], and kinematic tasks [13] to evaluate the performance ability of the hand. It was found that people may have differences in the external performance ability in related fields due to the difference in the dominant hand. However, it is almost not considered that there is a link between handedness and safety in previous studies, which leads to the relationship between handedness and safety is often ignored or subconsciously considered to have no connection. A recent study has attracted our attention [14]. Researchers conducted a field survey and analyzed the braking preparation of shared electric motorcycle drivers. They found that people are more inclined to left-handed braking, but left-handed brakes may have potential safety hazards during braking because of their design, which causes our doubt on the opinion that ‘safety is not affected by the dominant hand’. A large number of literature show that left-handers perform better than right-handers in spatial processing ability. At the same time, the ability of spatial image memory, intuition, body coordination and visual perception dominated by right brain is obviously better than that of right-handers due to the high degree of right brain development of left-handers [15]. When some positions have to be prepared for emergency operation, can left-handed people use their left hand to operate keys to improve the overall safety of the system? (For example, the response time difference of 1 second may lead to a safety distance reduction of nearly 100 meters when the high-speed train is running at full speed; the design of military aircrafts pays more attention to the driver ‘s response to stimuli) Also, in HCI system design [16,17], people also did not incorporate the handedness into the principle of Human Engineering (HE). Therefore, it is impossible to determine whether the handedness can indirectly affect the safety of operation, especially in some emergency operation positions. It is not clear whether the asymmetry between the dominant hands has an impact on HCI under emergency operation. However, it is worth pondering whether handedness may directly lead to differences in people ‘s perception of safety, which cannot be verified in existing literature and studies. In summary, previous studies have tended to explain the principles and phenomena of the asymmetry of dominant hands, and have not established a link between dominant hand as an inherent characteristic of human beings and safety, and it is impossible to distinguish whether the relationship between them is direct or indirect.
In the HE principle, the human arm can be regarded as a multi-degree-of-freedom component, and the muscle appears as a power source in which the human acts as a torque on the bone through muscle contraction, thereby driving limb movement [18]. From the perspective of biomechanics, the human arm, as a separate subsystem, exhibits different motion characteristics due to the limitations of arm freedom and muscle contraction when it extends forward β1, lateral extension β3, and medial flexion and extension β2. The left and right arms of human are basically symmetrical only from the perspective of structure, but studies have shown that [19,20] the left and right arms of the human still show different responses and the difference is not large due to the influence of the habit of using the hand when they move in the same movement distance and the opposite movement direction. The representation (mechanical response speed, error rate, etc.) are also different when the palm travel angle α, the arm extension direction β, and the distance l are different. The above situation may be more obvious when the left and right hands are used as dominant hands respectively. Therefore, the influence of handedness cannot be ignored from the perspective of safety. At the same time, a study [21] indirectly proved the performance of chirality in arm movement asymmetry, and this representation phenomenon can reflect the influence of handedness on operation safety through specific competitive operation rate and error rate for the purpose of rapid response and precise operation.
In summary, the asymmetry of the dominant hand is always based on the laterality of the human body, and shows the asymmetry of behavior and operation. This asymmetry will always show the left or right advantage when is based on the purpose of completing the goal and shortening the time. Furthermore, the gap between left and right will be infinitely enlarged when this advantage is used as a safety assessment factor in emergency situations. Although HE design [22] has made great progress in the field of safe HCI field, it is rarely considered in existing studies and designs to regard the asymmetry of the hand as a certain factor affecting system safety. According to Daniel K. Shipp, “The best safety measures are those taken before the accident”. Therefore, this paper attempts to analyze the influence of handedness on system safety, especially in the aspect of human-computer interaction under emergency operation. A new evaluation factor of system safety was proposed and verified by us, which can effectively improve the safety of human-computer cooperative operation. The research in this paper reveals the important influence of handedness in the field of HCI safety, which is of great significance for HCI safety design and operator selection, especially in emergency operation scenarios such as high-speed trains and aerospace.
2. Handedness and Safety
In various application fields, hundreds of human and mechanical cooperation devices have been designed and manufactured, which are used to promote strong interaction between humans and autonomous systems, as well as for training, security collaboration, and physical task assistance [23]. When people operate these devices, they will be limited by external factors, equipment factors, their own factors, and management factors. The synergy of many factors can be regarded as a ‘Human-Computer Associative Systems’ (HCAS). On the basis of pursuing efficiency and operability, safety is also considered as one of the design standards of HCI (HE). The so-called system safety not only refers to the safety of HCAS itself, but also refers to the fact that HCAS can suppress, eliminate or mitigate the risk of accidents under the synergistic effect of human and machinery when safety problems occur.
In HCAS, humans and equipment appear as separate subsystems. For the equipment subsystem, a series of design models have been proposed based on different research objects, including equipment size, layout, and color. For example, a layout model is proposed to reduce activation time, center-fixation, gaze time, and errors in automotive button design [24], and a study examines the effects of button color and background on augmented reality interfaces [25]. The safety of equipment has always been a concern for designers and users, and has generally reached the target in today’s manufacturing and application fields. When humans are involved as a subsystem in HCAS, their subjectivity and individual differences make it difficult to control the safety level of the subsystem within a certain allowable range. At the same time, when humans appear as uncertain factors, the overall safety of the system is affected by multiple factors, resulting in variable and complex characteristics. To address this issue, researchers have conducted extensive studies on the human subsystem, but they mainly focus on mental and operational health, and knowledge level as research targets. Handedness, as one of the individual factors of humans, is rarely considered as a safety factor by researchers.
Handedness is one of the manifestations of human laterality, and there are differences in various abilities between left-handers and right-handers, which are caused by asymmetry. The main cause of handedness is currently unknown [26,27], but this does not hinder exploration of the representation of handedness. The known differences in abilities mainly manifest as differences in creativity [28], artistic ability, and spatial ability [29]. In a study conducted at a university in China, we found that students with different dominant hands may have differences in speed and efficiency (accuracy) when participating in a key pressing task. The purpose of this experiment was to verify the differences between left-handers and right-handers at that time, and it is worth considering that handedness may have an impact on the safety of emergency operations when speed is mapped to emergency operation rate and efficiency is mapped to operation error rate. In addition, humans are subjective, and the representation of interactive operations may be different under “purposeless” and “purposeful” conditions. If students are informed that “their operations may affect their own safety,” the representation of left-handers and right-handers may be different from that under the previous “purposeless” operation. Therefore, we speculate that in certain situations, handedness may affect the speed and efficiency of emergency operations, thereby affecting the safety of HCAS. However, before proving this speculation, we need to understand whether the relationship between handedness and safety perception is direct or indirect. That is to say, whether handedness directly affects human safety perception (intrinsic factors), or indirectly affects human-machine operations through external performance abilities (reaction ability, movement ability, spatial processing ability, etc.) (extrinsic factors). Therefore, we propose three hypotheses regarding the above issues:
a. The existence of handedness directly affects the safety perception of left-handers and right-handers differently.
b. The existence of handedness leads to differences in operational ability between left-handers and right-handers, which indirectly affects the safety of HCAS.
c. The existence of handedness does not affect the safety of HCAS.
2.1. Direct Effect
To verify hypothesis a, based on the principles of safety psychology, we designed a set of survey questionnaires (Ⅰ) and recruited 38 college students aged 20-25 (left-handers n=19; right-handers m=19) who agreed to participate in the questionnaire survey. It is understood that all participants have taken an introductory psychology course at this university and have received good grades in the course. In addition, when we use this data, we did not make exact subdivisions for the participants’ average age or gender.
Participants answered six common safety perception questionnaires by choosing one of two options: (A) yes or (B) no. Table 1 shows the specific content of the questionnaire and the choices of the two groups of testers. It should be noted that the scores of the items were adjusted based on the optimal option of the item.
Among the 38 participants, left-handed and right-handed testers showed almost identical scores. By taking the arithmetic mean of each item’s score, we found that the difference in “safety perception” scores between left-handers and right-handers was 0.008, which may be influenced by the sample size, but it is unlikely to exceed 1% of the total score. Therefore, we may conclude that hypothesis a is not valid, which means that the existence of handedness does not cause differences in safety perception between left-handers and right-handers. It is worth noting that some participants showed a negative attitude in this questionnaire survey. It is understood that they do not disregard safety, but consistently believe that safety issues will not occur around them.
It should be noted that the data provided in Table 1 cannot draw a conclusion that hypothesis b is valid or prove that hypothesis c is valid, as they are not mutually exclusive. However, if hypothesis b is denied, hypothesis c is verified to be valid. Therefore, verifying whether hypothesis b is valid is the key to solving the problem.
2.2. Indirect Influence
To verify whether hypothesis b is valid, it is necessary to clarify which factors appear as interfering factors and which factors can measure safety. The external performance ability mentioned in hypothesis b may not all be factors that can measure operational safety. Among them, the mechanical response ability [30] based on HE is a measure of arm reaction and motor ability. Research shows [31] that differences in handedness may lead to differences in the completion rate of kinematic tasks, so it can be used to evaluate safety issues in emergency HCI. At the same time, we further hypothesize that when handedness may indirectly affect the safety of E-HCI, the safety of HCAS is consequently affected, and we can conclude that handedness can indirectly affect system safety.
It should be noted that even if the indirect impact is caused by external factors, people can make up for these differences through postnatal training. In addition, differences in certain individual factors (such as body shape, exercise status, sleep quality, etc.) may also prevent us from accurately reflecting the relationship between handedness and emergency operation safety. Therefore, we must distinguish which factors may affect the relationship between the two and which factors must appear as measuring factors. We invited 5 experts in relevant fields to select important influencing factors, as shown in Table 2.
To conduct experiments based on the influencing factors listed in Table 2, it is important to note that measuring factors are different from interfering factors. When conducting experiments, interfering factors must remain consistent or similar, while measuring factors will inevitably change. In addition, interfering factors do not have the possibility to change the nature of the relationship, while measuring factors may have the potential to change it. Therefore, by controlling the measuring factors, we can more accurately evaluate the differences in emergency operation safety between left-handers and right-handers.
3. Data Collection and Experimental Design
3.1. Data Collection
The participants in this study were 726 students aged 20-25 from the same university who agreed to participate in the experiment. It is worth noting that to ensure that the participants had a higher level of safety awareness, all of them were selected from the “Safety Engineering” major at the university. Before conducting the specific experiment, the students had to first complete a task to indicate whether they were left-handed or not. The measurement of handedness is usually assessed through experimental tasks or questionnaire reports describing daily habits. The Oldfield Handedness Questionnaire is the most popular assessment tool, which uses the lateral preference inventory to express the degree of preference for right-handedness or left-handedness [33]. However, the Oldfield Handedness Questionnaire is not applicable in Chinese society. The “Chinese Handedness Scale,” proposed in 1980, is a reference to the Annett Handedness Questionnaire and Oldfield Handedness Questionnaire, and is specifically designed for the Chinese population. It can better express the degree of preference for right-handedness or left-handedness among the Chinese population.
According to the statistical data of the “Chinese Handedness Scale,” out of the 726 experiment participants, only 37 were left-handed (accounting for 5.1%), including 16 left-handed females and 21 left-handed males. Among the 726 testers, there were a total of 689 right-handed testers, including 361 males and 328 females. To ensure the symmetry and randomness of the experimental data, we grouped all left-handers into one group, the L group, and randomly divided all right-handers into 17 groups, with varying numbers of people in each group. However, each group could only have a number of people chosen from (35, 37, 39, 41). We then selected one of the 17 groups at random to serve as the right-handed group, the R group, which contained 39 people. In total, the 76 people in the L and R groups would further participate in the experiment.
3.2. Experimental Design
To better reveal the different representations of handedness in emergency HCI, this study was divided into three experiments (Experiment 1, Experiment 2, Experiment 3).
3.2.1. Experiment 1
This experiment is based on the variable factors listed in Table 2, and the individual data of 76 testers were collected to establish a database of handedness scores related to individual factors in order to solve the interference problem of variable factors.
For all testers, they were required to participate in a survey questionnaire (II), the specific content of which is shown in Annex 1. The questionnaire II was formulated by summarizing previous data and conducting on-site investigations to develop an “addition and subtraction formula questionnaire,” which has a maximum score of 100 points and a basic score of 1 point. In addition, before the start of Experiment 1, we informed the testers that their score data would not be made public and that the score would not have any competitive significance.
3.2.2. Experiment 2
Based on a special scenario (considering safety) and interference factors (consistency), we observed the interaction process between two groups of testers and digital instruments. By measuring reaction time, movement time, and error rate, we obtained the arm mechanical response time in emergency HCI and the efficiency of correct operation. Experiment 2 provides data support for studying the differences in safety between left-handers and right-handers in emergency operations.
In order to fit the complex emergency operation environment, we selected a relatively enclosed room and controlled unnecessary factors such as room lighting and desk height to ensure that each participant was in the same scenario when participating in the experiment. The main digital instrument used in this experiment is a variable sliding reaction and movement time tester (The instrument is validated).
(1) Testers entered the room and took their seats in the order determined by random draw, as shown in Figure 1. They placed their dominant hand naturally on the experimental platform, and then, according to the position of the tester’s dominant hand shoulder, the position of the digital instrument was determined.
- While keeping their body posture, the testers extended their dominant arm forward parallel to the table, with the palm facing the table surface. At this point, the experiment assistant adjusted the position of the instrument so that its center was located at the wrist of the tester’s dominant hand and the central axis coincided with the “arm-shoulder” central axis. The position of the instrument at this time was recorded as Position A.
- Based on Position A and the tester’s height, adjust the height of the chair so that the line connecting the tester’s eye on the dominant hand side and the center of the device forms a 60° angle with the table surface. Studies have shown that when the operator mainly focuses on a target (main display screen), they can also roughly observe the cone surrounding the gaze line at an angle of about 30°. When the tester’s position, chair height, and instrument position are set according to the above method, any tester can ensure a comfortable and consistent operating scenario.
- When the arm position is uniquely determined, using the shoulder joint as the center and the distance from the center to Position A as the radius, rotate 45° to the left or right (depending on the handedness) to determine position A’, which is defined as Position B. Position B is another test position for the instrument. It should be noted that at this time, the device should also be rotated 45° compared to its position at A, as shown in Figure 2.
(2) Adjust the position of the stimulus button so that it is 120mm away from the proximity switch. The tester presses the proximity switch, and when a random stimulus is presented, i.e., the light turns on, the instrument starts timing. When the subject’s finger leaves the response button, the timer stops, and the internal instrument automatically records the reaction time. Meanwhile, the instrument starts timing again. When the subject presses the target button corresponding to the stimulus, the timer stops again, and the internal instrument automatically records the movement time. If the subject presses the wrong target button, the instrument will consider it as an error; if the movement time exceeds 9.999 s, the instrument will also consider it as an error. In these two cases, the experiment will not have movement time and will not count towards the total. Before the experiment begins, the tester will be informed of the principles and importance of the experiment, and the tester will receive a vague hint: this experiment may affect safety (when the tester makes a mistake or has a movement time exceeding 0.5 seconds, the instrument will emit a piercing sound wave). Therefore, the tester is advised to capture and press the button as quickly as possible when the stimulus is presented.
(3) The experiment is carried out in two sets at positions A and B, with a total of 10 stimuli per set (we found that when subjects perform more than 20 operations at once, it may cause fatigue or form muscle memory), and all four sets of experiments require the tester to maintain an upright posture, leaning against the chair, with no restrictions on the head. At the same time, the tester is informed that there is no need to pay attention to body posture when the stimulus is presented. In addition, before the experiment begins, the tester is allowed to familiarize themselves with the testing process and methods until they feel confident in completing the task well, at which point the formal experiment can begin. Ask the tester to place the index finger of their dominant hand naturally on the proximity switch, with the instrument at position A. Record the average reaction time, average movement time, and the number of errors for the two sets of experiments. When position A is completed, move the instrument to position B and test again, recording the time and the number of errors. During this period, the tester is not allowed to adjust their body posture.
3.2.3. Experiment 3
Experiment 3 is based on the actual data obtained from Experiment 2. We will calculate the average movement time for both the L and R groups and find the five testers closest to that data, and ask them to participate in the experiment again. Experiment 3 aims to verify the movement differences between the left and right dominant hands at different α and β values, and further explore the characterization phenomena of HCI in emergency scenarios for both. For hypothesis 2, the collection and analysis of data in Experiment 3 are essentially exploratory in nature.
In this experiment, two sets of experiments are carried out for positions A and B, with each set having 20 trials, and other settings referring to Experiment 2. It is important to note that in this experiment, when recording data, the data is divided into eight regions according to the button positions (each region is a 25° sector with the axis as the radius), as shown in Figure 3. The specific time taken for each button press in each region is recorded, as well as the number of button errors.
It is worth noting that the appearance of the stimulus from the instrument is random, and no one can predict whether all eight directional buttons will be lit during a set of experiments. Therefore, in a set of experiments, if there is a button that has not been lit within 20 trials, the experiment will restart.
4. Results
4.1. Experiment 1
Experiment 1 uses questionnaire II, which is divided into three main categories: basic items, bonus items, and deduction items, with a total of 20 sub-items. This experiment is based on the data in Table 2 and uses the scoring method to calculate the individual factor scores of all testers, which can be seen in Table 3 and Table 4. All individual factors that may affect the validity of hypothesis b are reflected in questionnaire II. For example, finger flexibility may affect the speed and efficiency of button operation, and finger flexibility is not only determined by innate conditions but may also be influenced by acquired training (computer typing speed, proficiency in buttoned instruments, etc.), which are reflected in Table 3 and Table 4.
Scores that are too high [80,100) or too low [1,20) may cause severe data dispersion. Through Table 3 and Table 4, it can be found that the total scores of all participants are basically between 30-66, and the scores are relatively concentrated. This indicates that all 76 participants can serve as testers. The scores of each sub-item can be compared in the form of bar charts.
According to Figure 4, the score proportions of various items for participants in the L and R groups are similar (difference: left-handers tend to have a sports advantage, while right-handers tend to have a typing advantage), and the score differences are small. The item with the largest score difference is “personality traits,” with a difference of 2.249 points. It is worth noting that statistics show that left-handed females tend to have a more “negative” personality compared to right-handed females, while this is not evident among males. In addition, left-handed participants are more proficient in using musical instruments, which is consistent with the research of John P. Aggleton and Robert W. Kentridge[6]. Apart from this, the absolute value of the deduction items for the L group is higher than that for the R group. This is because two left-handed participants had injuries to their left arm, and one had a history of surgery. However, the differences in other items are all within 2 points, indicating that the individual factors of left-handed and right-handed participants are basically similar.
The total score of left-handed participants is slightly lower than that of right-handed participants. Theoretically, the score is positively correlated with the operating ability, which is a characterization phenomenon of the influence of individual factors on operating ability. Therefore, it is preliminarily inferred that the operating ability of right-handed participants is better than that of left-handed participants.
4.2. Experiment 2
The data obtained from Experiment 2 is shown in Table 5 (left-handers) and Table 6 (right-handers). Table 5 and Table 6 display the experimental results for error rate, reaction time, and movement time. The original sequence of the test is reconstructed in the tables through the item numbers.
4.2.1. RT
Regarding the results of the RT for left-handers and right-handers, see Table 5 and Table 6. In terms of individual test data, x1 and x3 are significantly larger than x2 and x4. This is because, in the first set of tests at any position, testers always have feelings of tension and apprehension (fear of pressing the wrong key), as confirmed by the consistent feedback from testers after the experiment. However, the time difference between the two is small, and the data is still reliable. At the same time, we find that the time taken at position B is shorter compared to position A. This is because the triceps in the arm are in a contracted state at position B, compared to position A. When the stimulus occurs, the arm-palm-finger system can respond more quickly. Therefore, the differences among these variables are not caused by handedness.
According to the data in Table 5 and Table 6, gender differences are not significant in both the L (left-handers) and R (right-handers) groups, with females showing lower average reaction abilities compared to males, which is consistent with the research results of Thomas Buser et al. It is worth noting that under consistent constraint conditions, the average RTl for left-handers (269.44ms) is less than the average RTr for right-handers (280.67ms), which is consistent for both positions A (RTl=269.05ms, RTr=281.78ms) and B (RTl=269.84ms, RTr=279.95ms). Therefore, overall, left-handers have better emergency response capabilities than right-handers. In addition, if the data from the two groups (L and R) is too dispersed, meaning the total average reaction time is significantly affected by individual data, the conclusion may not be proven correct. To further verify this point, we matched the scores of the testers in Experiment 1 with their reaction times (assigning “Dimensions” to the reaction times). Table 7 and Table 8 show this correlation.
According to the data in Table 7 and Table 8, we present the relationship between individual factors and reaction time using a scatter plot (with the x-axis representing the score and the y-axis representing reaction time), as shown in Figure 5. Figure 5(a) and (d) show the scatter plots of the average reaction time and scores for the four groups of L and R testers, while (b) and (c) show the scatter plots of the average reaction time and scores for the two groups of L testers at positions A and B, respectively. The experimental data is found to be stable while also exhibiting different characteristics.
As shown in Figure 5(a) and Figure 5(d), the standard deviation for the L group is 0.02101 and for the R group is 0.03114. The standard deviation reflects the degree of dispersion of a dataset; both groups have relatively small standard deviations, indicating that these values deviate little from the average. We also used the Mean±Standard deviation to analyze the dispersion of the data points and found that the dispersion for the L and R groups is 31.58% and 13.04%, respectively, which is within an acceptable range. At the same time, all the original data points (tester reaction times) fluctuate around the mean. When analyzing the data fitting, we found that r21 (left hand correlation coefficient) is 0.11707 and r22 is 0.02247, both showing weak correlation. This proves that regardless of whether a person is left-handed or right-handed, the correlation between RT and individual factor scores is relatively weak, which is also shown in Figure 5(b) and Figure 5(c). Additionally, research has found [34] that reaction time represents the time interval from stimulus to response when a stimulus activates sensory organs, is transmitted to the brain through the nervous system, is processed and then transmitted from the brain to effectors to act on external objects. As a result, reaction time serves as a measure of the coordination and rapid response ability of the human nervous and muscular systems, mainly influenced by the nervous system and not significantly affected by acquired activities. Testers with different dominant hands, due to the impact of brain hemisphere specialization, show that left-handers have better reaction ability than right-handers. In summary, left-handers have an advantage in reaction ability when dealing with sudden stimuli compared to right-handers.
4.2.2. ET and Mechanical Response Time (MRT)
The results for the L and R groups’ ET can be found in Table 5 and Table 6. Similar to reaction time, each tester’s ET also exhibits the phenomenon of unstable data in the first set of tests, which is still caused by anxiety and overthinking. At the same time, the movement time also shows the difference between position B and position A, but this difference only exists within the L or R groups and does not affect the comparison between groups. According to Table 5 and Table 6, under consistent constraint conditions, the average movement time for left-handers (ETl=259.76ms) is less than that for right-handers (ETr=288.13ms). This is consistent for both positions A (ETl=262.26ms, ETr=289.00ms) and B (ETl=257.26ms, ETr=287.26ms). Additionally, when comparing the score situation with ET, the ET at positions A and B maintains the same trend as the average ET of the testers. This is similar to RT, which means that regardless of the initial position of the arm, the overall trend remains consistent. Figure 6 reflects the consistency of the change trend in different positions.
ET, which represents the time from receiving the stimulus signal and the brain issuing a command to the start and end of the action, is influenced not only by the transmission of information in neural synapses, but also by a series of factors such as finger flexibility, arm movement ability, and other interference factors. Therefore, merely comparing the average time advantage for ET is insufficient to prove the difference in emergency operation movement ability between left-handers and right-handers. To further confirm this point, we present the relationship between individual factors and average ET in the form of a scatter plot (with scores on the x-axis and reaction time on the y-axis), as shown in Figure 7. Figure 7(a) and 7(b) show the scatter plots of the mean reaction time for the four sets of tests for the L and R group testers, with their corresponding scores.
As shown in the figure, all the original data points (tester ET) are significantly negatively correlated with the x-axis data. Analyzing the data fitting, the left-hand correlation coefficient (r21) is 0.89271, and the right-hand correlation coefficient (r22) is 0.82275. The absolute value of the correlation coefficient is greater than 0.7, indicating strong correlation for both left-handers and right-handers. This proves that regardless of whether a person is left-handed or right-handed, the correlation between ET and individual factor scores is relatively strong. Therefore, we must further process the ET data group, divide the tester’s original data into score segments, and then compare them. The division method is as follows: divide the scores into intervals according to a certain gradient (5 points): [30, 35), [35, 40), [40, 45), [45, 50), [50, 55), [55, 60), [60, 66]. Then, calculate the arithmetic mean of the tester scores within each score interval. The statistical results are shown in Figure 8(a).
According to Figure 8(a), except for the [40, 45) interval, the average movement time in other score intervals still shows that left-handed testers perform better than right-handed testers. Although the average time in the [40, 45) interval shows a contrary conclusion, it is normal to have local deviations due to the asymmetry of the samples (L≠R). Meanwhile, by observing the time difference changes, we find that in the [40, 45) interval, the time difference between left-handers and right-handers is only -0.0265, while the corresponding time difference in other intervals is significantly greater than 100ms. Additionally, we find that the change trend of the time difference has a certain positive correlation with the score interval, but this correlation is not obvious. To address this phenomenon, we introduce the concept of Mechanical Response Time (MRT). MRT refers to the total time from receiving the stimulus to completing the task, and it can be simply expressed as:
(1)
According to Table 5 and Table 6, the MRT for left-handers is 529.2ms, while the MRT for right-handers is 568.8ms. Under the same constraint conditions, the L group is faster than the R group by an average of 39.6ms (6.96%). Moreover, as shown in Figure 8(b), the MRT shows the opposite change trend with the variation of score intervals, indicating that MRT is negatively correlated with the score (though not strictly correlated). This means that as the individual factor score increases, MRT may decrease, and the time difference of MRT is positively correlated with the score. This suggests that the rate of MRT decrease becomes faster as the score decreases. Therefore, there is an inevitable strong negative correlation between individual factor differences and both ET and MRT. In summary, when L group and R group testers receive a sudden stimulus, the overall performance of the L group is better than that of the R group. This advantage still exists even if individual factors are considered, and it becomes more apparent as individual factor scores increase. In dealing with sudden stimuli, left-handers have a better ability to complete kinematic tasks with emergency operation characteristics than right-handers.
4.2.3. Operation Mistake
According to Table 5 and Table 6, the average Error rate (Er) for left-handers is 1.84%, while the average Er for right-handers is 2.61%. The number of errors (n) for left-handers is significantly less than that for right-handers. In addition, we find that all testers exhibit the same pattern: those with poor sleep quality and overly active personalities may be more prone to errors in emergency operations, but this is unrelated to their RT and ET performance. It is worth noting that for both left-handed and right-handed testers, errors always occur in a few fixed-position buttons. We are concerned that the Er statistics in Table 5 and Table 6 may be affected by equipment parameters (the stimuli appear randomly, and not all eight indicator lights are necessarily lit in a group test). Therefore, it is necessary to carry out Experiment 3 from the perspective of Er.
4.3. Experiment 3
The data shown in Table 9, Table 10, Table 11 and Table 12 are obtained from Experiment 3. They represent the characterization phenomena of movement time and error rate caused by changes in direction parameters (palm travel angle α and arm extension direction β) for the L group and R group in Positions A and B. According to the biomechanics classification of arm movement types [18], we divide arm extension into three directions in this experiment: β1 (arm forward extension, corresponding to L1 and R1 positions), β2 (arm inward flexion, left-handers correspond to R2, R3, R4 positions; right-handers correspond to L2, L3, L4 positions), and β3 (arm outward extension, left-handers correspond to L2, L3, L4 positions; right-handers correspond to R2, R3, R4 positions). Ln and Rn are separately represented asα. Experiment 3 did not record reaction time because it is not affected by direction parameters, which was confirmed in “4.2.1 RT”.
4.3.1. Group R Data Analysis
Concerning the results on the influence of direction parameters on right-handers, please refer to Table 9 and Table 10. Based on the data from the R group, the eight positions correspond to different response phenomena, in which both the average movement time (ET) and the operation error rate are significantly affected by changes in direction parameters.
- (1)
- A position
Regarding the performance of right-handers at Position A, we can observe different response phenomena for different key stimuli, which may result from the combined effects of α and β. Following the performance patterns of movement time (ET) in Table 9, we reorganize the data, dividing α into three regions, as shown in Figure 9 (a), represented by Red (25, 100), Yellow (-50, 25), and Green (-100, -50) respectively. The study found that the red region has the optimal average movement time, but a high error rate of 13.34%, with β=(β3) and α=(R2, R3, R4); the green region has a relatively faster (medium) average movement time and an error rate of 5% (medium), with β=(β2) arm flexion and α=(L3, L4); the yellow region has the slowest average movement time, but an error rate of 0 in 30 stimuli, with β=(β1, β2) and α=(R1, L1, L2). For the red region, we find that R3 and R4 have the fastest speeds, which is because when test subjects receive stimuli from R3 and R4, the arm extension speed is affected by the triceps brachii, brachialis, and extensor digitorum muscles (collectively referred to as the “muscle group”), as illustrated in Figure 9. Moreover, it is understood that almost every test subject reported feeling relaxed when the lateral keys were illuminated, while feeling fatigued when L1 and L2 were illuminated. In addition, the higher error rate in the red region is due to test subjects stating that when R3 and R4 were illuminated, their fingers could quickly capture the keys, but during the finger movement process, the lateral position of the palm obscured the stimulating light, leading to errors in finger capturing. However, this was not evident for other α values. The above findings represent the performance of right-handers at Position A when receiving urgent stimuli.
- (2)
- B position
Similar to Position A, the performance of right-handers at Position B is also influenced by the combined effects of α and β. However, at Position B, the red region shrinks, and R2 is no longer included. Both the Yellow and Green regions extend 25° to the right (toward the lateral side of the arm). It is worth noting that the yellow region at Position B performs better in terms of reaction time and error rate than the green region. In contrast, the green region’s performance at Position B is not as good as at Position A. This is because Position B is on the 45° line to the right of the body’s central axis, and at this position, the green region takes on some of the yellow region’s functions under unfavorable conditions. The specific patterns can be observed in Table 10. Similarly to Position A, test subjects still reported that keys in the lateral area were easier to capture. The above findings represent the performance of right-handers at Position B.
4.3.2. Group L Data Analysis
Regarding the results of the influence of direction parameters on left-handers, please refer to Table 11 and Table 12. These results show a certain mirror pattern compared to the characterization phenomena of right-handers.
Here is a set of illustrations.
Similar to the A and B positions of right-handers, the performance of left-handers at positions A and B is also influenced by the combined effects of α and β. The red (-100, -25), yellow (-25, 50), and green (50, 100) regions for left-handers are symmetric with respect to the midline axis compared to the three regions for right-handers, as shown in Figure 11. It should be noted that while β is symmetric, the specific values of α are not symmetric. For example, the average reaction time for left-handers in the red region at Position A is 225.45ms, with an error rate of 10%, which is significantly better than right-handers. However, for left-handers at Position A, the green region’s performance in terms of reaction time and error rate is significantly better than the yellow region, which is the opposite of right-handers. Similarly, left-handers at Position B also exhibit differences between the yellow and green regions. It is understood that left-handed test subjects agreed with the right-handed test subjects’ description of the yellow region, but they believed that for the red region, the yellow region might be more prone to errors. The data in Table 11 can verify this point.
Figure 12 shows the individual data of the five test subjects in Groups L and R at different positions. Taking Figure 12(a) as an example, the trends in individual data among the test subjects are generally consistent. The optimal α for left-handers (α=Li) and right-handers (α=Ri) are symmetric with respect to the midline axis, both at the outermost position of β3. However, the least optimal positions (slowest reaction times) are not symmetric, which can be proven by comparing Figures 12(b) and 12(d). In addition, the statistics on error rates in Tables 9, 10, 11, and 12 are also used to demonstrate the asymmetry. In summary, when the left and right hands are used as the dominant hands, even with the same movement distance and symmetric movement direction (Li and Ri), the characterization phenomena of the dominant hand change at this moment (incomplete symmetry). At the same time, within the same region, the overall performance (speed and error rate) of left-handers is better than that of right-handers, and the value of α does not affect this pattern.
Overall, in emergency operation scenarios where personal safety is considered, left-handed test subjects have better motor skills, reaction abilities, and correct capture abilities than right-handed test subjects. Individual factors do not change this advantage, and the advantage is even amplified as individual factor scores increase. In addition, when considering the palm travel angle α and arm extension direction β, the characterization phenomena of the dominant hand show incomplete symmetry. However, regardless of how α (Li and Ri) and β change, the overall performance (speed and error rate) of left-handers is still better than that of right-handers. In conclusion, due to the existence of hand dominance, there are differences in operating abilities between left-handers and right-handers, which indirectly affect the safety of HCAS. Hypothesis b is considered to be established.
4.4. Applying Extensions
Considering the overall safety of emergency operation positions, they widely exist worldwide, such as high-speed train driving positions, pilot positions, and firefighting equipment operation positions. When hypothesis b is considered established, the conclusions obtained from the experiments (in emergency operation scenarios where personal safety is considered, left-handed test subjects have better motor skills, reaction abilities, and correct capture abilities than right-handed test subjects) will have an impact on the actual operation positions. The differences in dominant hands may cause a chain reaction and affect safety. Therefore, we have to prove the significance and impact of the conclusions in practice.
Taking the CRH5G high-speed train driving position as the main analysis object and based on the HE principle, we use the conclusions obtained from experiments 1, 2 and 3 to determine the emergency brake valve positions suitable for left-handed or right-handed drivers. Then, according to the vector coordinates (direction and distance) and button size of the position, we use Fitts’ law [34] to determine the time difference required for left-handed and right-handed drivers to capture the brake valve in scenarios requiring emergency braking.
It is worth noting that the CRH5A train uses a button-type brake valve, while some vehicles use a brake lever. They are consistent in principle. For the convenience of the study, we choose the brake valve-type train driving cab. Figure 13 shows the CRH-type driving cab operating platform and a three-dimensional model of the driver’s basic operating posture, with the button representing the pre-set position of the brake valve.
Based on previous studies [35,36], we focus on the differences in dominant hands to determine the valve position coordinates suitable for left and right dominant hands. Before this, we need to exclude equipment factors unrelated to this study: valve body color, shape, appearance, etc., as well as personnel factors unrelated to this study: driver’s sitting posture, driver’s psychological quality, etc. Environmental factors and management factors are not considered. The determination of valve position coordinates will be divided into three steps: 1. Determine which positions cannot be set with brake valves; 2. Determine the optimal brake valve setting orientation through the conclusion of experiment 3; 3. Combining the results of a and b, we can determine the optimal valve position that is suitable for both left-handed and right-handed drivers, allowing them to perform emergency braking operations effectively and safely.
1. Identify admissible areas
The disallowed areas refer to the areas where brake valves cannot be set according to regulations, as well as the areas prone to accidental touches and high error rate areas. It is understood that the layout of the train driving cab needs to be strictly designed according to the specifications. Based on previous research [32], we have developed a selection model for all disallowed areas, as shown in Figure 14 (a) and (b).
Area Ⅰ is the train control basic button area, where emergency brake valves cannot be set; Area Ⅱ is the prone-to-accidental-touch area, which includes two accidental touch scenarios: the area swept by the arm during the movement of the palm from position A to position B, and the area within 100mm around the palm; Area Ⅲ is prone to obstructing the view of the display screen; Area Ⅳ is the high-error-rate area (>10%) measured in Experiment 3.
2. Set the orientation to determine
As we know, train drivers are required to place their hands in front of their body (Position A). To alleviate the discomfort caused by maintaining the same posture for an extended period, they will place their hands on the sides of the table (Position B) when it doesn’t affect their operation. Experiment 3 provides two sets of positions A and B, corresponding to the standard hand placement and the natural hand placement for train drivers. In an emergency, the driver’s hands may be in either position A or B. Therefore, we choose the intersection point JD of the bisector of the optimal area α of positions A and B as the optimal position for the valve.
For left-handed drivers, we choose the (-100, -62.5) interval as the optimal area for position A, considering that although the red area has the best MRT, the error rate (Er=10%) is relatively high. Therefore, we select a quarter of the red area’s angle as the optimal area, with the bisector O1A=-81.25° as the optimal line. For position B, the directions O2A, O2B, and O2C are all selectable, and their intersection points with O1A are JDA, JDB, and JDC. However, point JDB is beyond the operable distance (100cm from the shoulder joint). Similarly, when analyzing the optimal orientation for right-handed drivers, only point JDC can be selected.
3. Determine the optimal position of the valve
Fitts’ Law refers to the time it takes to reach a target using a “pointing device” being related to two factors: the distance between the current position of the device and the target (l), and the size of the target (w). Fitts’ Law was proposed in 1954 by Dr. Fitts from the United States and is one of the most widely used models in the human-computer interaction (HCI) field. Studies have shown [37] that Fitts’ Law can be expressed based on the arm’s kinematics, making it very suitable for human behavior data in various situations. The expression of Fitts’ Law in this study is shown in Equation (2):
(2)
l represents the movement amplitude; w represents the target width, which is 5cm; MRT represents the mechanical response time of the arm; a and b are empirical coefficients. The coefficient a is determined by the individual factors of the test subject (left-handed a=0.08, right-handed a=0.12), and b is determined by the experimental equipment, with a statistical value of 0.16.
According to Equation (2), for left-handed drivers, JDA (MRT1=601.2ms, MRT2=477.6ms) is more suitable as the optimal valve position than JDC (MRT1=646.1ms, MRT2=520.6ms). Therefore, the optimal position for left-handed drivers is JDA (MRT1=601.2ms, MRT2=477.6ms), and the optimal position for right-handed drivers is JDC (MRT1=685.7ms, MRT2=560.2ms). When the constraint conditions are the same, the braking time for left-handed drivers is shorter than that for right-handed drivers (braking starts 83.6ms earlier). Assuming the train is traveling at full speed (350km/h), in the event of an emergency, left-handed drivers can provide at least an additional 8.135m of safety distance compared to right-handed drivers. In addition, under the same constraint conditions, the emergency braking error rate for left-handed drivers is 7.7‰ lower than that for right-handed drivers. In summary, during high-speed train travel, left-handed drivers’ emergency braking operations can better avoid accidents.
5. Discussion and Conclusions
5.1. Discussion
In order to explore the relationship between handedness and safety, this study adopted a combined method of questionnaire and experimental analysis to investigate the characterization phenomena of testers with different dominant hands. To identify whether the connection between handedness and safety is directly or indirectly related, we proposed three hypotheses and conducted a series of questionnaires, experiments, and simulations around these hypotheses. In our first hypothesis, we expected the presence of handedness to directly affect left-handers and right-handers’ perception of safety and lead to differences; however, the results of questionnaire Ⅰ indicated that this was not the case. Among the 38 participants, right-handers scored only 0.008 points higher than left-handers (out of 100 points), and these results may be due to the small sample size; as the sample size increases, the difference in scores between the two groups may continue to fluctuate within an acceptable range.
Based on hypothesis a, we preliminarily inferred that there might be a lack of a bridge connecting handedness and safety, and at least one such bridge is needed. Therefore, in our second hypothesis, we expected that due to the presence of handedness, there would be differences in operational abilities between left-handers and right-handers, thereby indirectly affecting the safety of HCAS. The data from Experiment 2 showed that this was correct, but we must note that testers with different dominant hands may have many commonalities and individual differences. Therefore, we combined the data from Experiment 1 and Experiment 2, and the results showed that left-handers always had an advantage over right-handers in emergency operation capabilities, and individual factors would not change this advantage; as the scores of individual factors increased, the advantage became more apparent. At the same time, when considering the palm progression angle α and arm extension direction β, the characterization phenomena of dominant hand showed incomplete symmetry, but regardless of how α (Li and Ri) and β changed, the overall performance (speed and error rate) of left-handers was still better than that of right-handers. Experiment 3 further verified the conclusions of the previous two experiments.
The reasons for this phenomenon (advantage) were explained in the article. Firstly, we ruled out the influence of safety cognition and individual factors on the results through a detailed questionnaire Ⅰ. In addition, we were concerned that this might be caused by differences in the “muscle-skeletal system” of the left and right hands, but this was denied in our literature review [38]. Thus, we inferred that this was due to the human body’s lateralization and the asymmetrical development of the cerebral hemispheres, which are unique characteristics of left-handers and right-handers.
Based on theoretical research, we introduced specific operation positions and analyzed the impact of different handedness on emergency safety operations. The results showed that in the event of an emergency, left-handed drivers could maintain at least an additional 8.135 meters of safety distance compared to right-handed drivers. Moreover, under the same constraints, the emergency braking error rate of left-handed drivers was 7.7‰ lower than that of right-handed drivers. In summary, during high-speed train operation, left-handed drivers’ emergency braking operation can better avoid accidents. We introduced practical applications to reinforce the indication that the left hand is more advantageous for overall safety.
The contribution of this study to the existing literature and safety management practices includes the following aspects.
5.1.1. Theoretical Implication
Theoretically, this study, based on physiological phenomena and HE principles, demonstrates that handedness can serve as a new influencing factor for HCI safety. It establishes a bridge between handedness and safety, providing innovative solutions for addressing new issues in the field of safety.
In previous studies, some scholars have proposed connections between handedness and various factors, such as imagination [39], artistic ability [40], spatial processing ability [41], responsiveness [42], and skill level [43]. Other researchers have analyzed the relationship between handedness and physiological [44] and pathological [45] factors. However, the connection between handedness and external safety has not been well explored. This study uses university students with varying handedness and a certain level of safety awareness as subjects. Based on kinematic data (RT, ET, and Error rate under changing α and β) and individual factor quantification data, a model was constructed to associate handedness and safety. This model helps to address uncertainty issues in the field of safety. Furthermore, by combining HE principles, it was found that many safety HCI designs tend to ignore the lateral dominance of the human body. They often assume that handedness does not play a role when the hand (fingers, palm, and arm) is involved in the operation of HCAS. This is because previous studies have focused on right-handed operations, and it was believed that right-handed operation is sufficient to address safety issues. A few scholars have considered left-handers [46] in their designs, but they believe that left-handers, due to their small proportion, cannot be one of the standards for assessing position interaction design and do not think that the safety of a collaborative system may be affected by handedness. Thus, handedness has not been incorporated into HCI design as a safety measurement factor.
5.1.2. Practical Implication
The main purpose of this study is to explore the connection between handedness and safety and, through questionnaires and experiments, we have verified the theoretical correlation between the two. However, how beneficial is this theoretical model when applied to practice? This was discussed when we conducted a simulation calculation for train driver positions. The application results show that left-handers have a significant advantage in emergency braking operations and are better at avoiding traffic accidents. Therefore, in actual train driver training, the training of left-handed drivers can be introduced to improve the reaction speed and coping ability of train drivers in emergency situations, thereby enhancing railway traffic safety. In addition, this study has certain guiding significance for improving the safety of transportation, machinery manufacturing, aerospace, healthcare, and other fields. For example, in the field of machinery manufacturing, the needs of left-handers can be considered to improve the safety of mechanical operations; in the aerospace field, the ability of pilots to handle emergencies can be improved, reducing the occurrence of flight accidents; in the healthcare field, the ability of medical staff to handle emergencies such as first aid can be enhanced, further improving the safety of the healthcare field.
In summary, the practical application significance of this study lies in improving the safety of human-machine collaborative operations, providing guidance for practical applications. In particular, in the training of train drivers, pilots, and other emergency operators, the results of this study can provide scientific and practical teaching methods for training institutions to ensure the safety and stability of railway transportation operations. Moreover, based on the handedness phenomenon and HE principles, this study provides a new approach that can help design and create more efficient and accurate safety systems. Such systems can improve people’s perception and response speed in the safety field, thereby better protecting people’s lives and property safety.
5.2. Conclusions
In summary, this study used a combination of questionnaire and experimental analysis to study the relationship between handedness and safety. Three hypotheses are put forward and verified one by one according to the different contact methods (direct and indirect). Firstly, the “safety cognition score” of participants was analyzed, and it was proved that hypothesis a was not valid, that is, people would not have differences in ‘safety cognition’ because of different dominant hands. Secondly, we analyzed the influencing factors of hypothesis b, and divided it into several interference factors and measurement factors. On this basis, three groups of core experiments were carried out, which used questionnaires and simulation experiments to analyze the experimental results and questionnaire results. Then, it is concluded that left-handers are always better than right-handers in emergency operation ability, and individual factors will not change this advantage, which is even more obvious with the increase of individual factor score. Moreover, the representation phenomenon of the used hand shows incomplete symmetry when the palm travel angle α and the arm extension direction β are considered. However, the overall performance (rate and error rate) of the left-handers is still better than that of the right-handers, no matter how α (Li and Ri) and β change. And we explain the reasons for this phenomenon, and then verify the correctness of Hypothesis b. (there is a difference in the operation ability between the left-handers and the right-handers due to the existence of the handedness, which indirectly affects the safety of HCAS). At the same time, Hypothesis c is considered to be negative. Secondly, to further strengthen this indication (advantages in safety), we introduced specific operation positions and analyzed the driving safety level of high-speed train drivers with different dominant hands in emergency operation scenarios. Ultimately, it was proven that left-handed drivers’ emergency braking operations during train operation could better avoid accidents, and left-handed drivers were closer to inherent safety.
Funding
This research received no external funding.
Institutional Review Board Statement
Not applicable.
Informed Consent Statement
Not applicable.
Data Availability Statement
Not applicable.
Conflicts of Interest
Not applicable.
References
- Shukla, A.; Katt, B.; Nweke, L.O.; Yeng, P.K.; Weldehawaryat, G.K. System security assurance: A systematic literature review. Comput. Sci. Rev. 2022, 45. [Google Scholar] [CrossRef]
- Cesarini, D. , Dawes, Christopher T, D., Johannesson, M., Lichtenstein, P., Wallace, B., 2009. Genetic variation in preferences for giving and risk taking. Q. J. Econ. 124 (2), 809-842.
- Budisavljevic, S.; Castiello, U.; Begliomini, C. Handedness and White Matter Networks. Neurosci. 2020, 27, 88–103. [Google Scholar] [CrossRef] [PubMed]
- McManus, I. , 2009. The history and geography of human handedness. In: Sommer IEC, Kahn RS, eds. Language lateralization and psychosis. Cambridge University Press. p. 37-58.
- King, R.B. Chirality and Handedness. Ann. New York Acad. Sci. 2003, 988, 158–170. [Google Scholar] [CrossRef] [PubMed]
- Gneezy, U.; Niederle, M.; Rustichini, A. Performance in Competitive Environments: Gender Differences. Q. J. Econ. 2003, 118, 1049–1074. [Google Scholar] [CrossRef]
- Niederle, M.; Vesterlund, L. Do Women Shy Away From Competition? Do Men Compete Too Much? Q. J. Econ. 2007, 122, 1067–1101. [Google Scholar] [CrossRef]
- Niederle, M. , Vesterlund, L., 2011. Gender and competition. Annu. Rev. Econom. 3 (10), 601- 630.
- Annett, M. A CLASSIFICATION OF HAND PREFERENCE BY ASSOCIATION ANALYSIS. Br. J. Psychol. 1970, 61, 303–321. [Google Scholar] [CrossRef] [PubMed]
- Peters, M. Why the preferred hand taps more quickly than the non-preferred hand: Three experiments on handedness. Can. J. Psychol. Can. de Psychol. 1980, 34, 62–71. [Google Scholar] [CrossRef]
- Peters, M.; Durding, B.M. Handedness measured by finger tapping: A continuous variable. Can. J. Psychol. Can. de Psychol. 1978, 32, 257–261. [Google Scholar] [CrossRef] [PubMed]
- Tapley, S.; Bryden, M. A group test for the assessment of performance between the hands. Neuropsychologia 1985, 23, 215–221. [Google Scholar] [CrossRef] [PubMed]
- Begliomini, C.; Nelini, C.; Caria, A.; Grodd, W.; Castiello, U.; Warrant, E. Cortical Activations in Humans Grasp-Related Areas Depend on Hand Used and Handedness. PLOS ONE 2008, 3, e3388. [Google Scholar] [CrossRef] [PubMed]
- Siebert, F.W.; Ringhand, M.; Englert, F.; Hoffknecht, M.; Edwards, T.; Rötting, M. Braking bad – Ergonomic design and implications for the safe use of shared E-scooters. Saf. Sci. 2021, 140. [Google Scholar] [CrossRef]
- Vingerhoets, G. Phenotypes in hemispheric functional segregation? Perspectives and challenges. Phys. Life Rev. 2019, 30, 1–18. [Google Scholar] [CrossRef] [PubMed]
- Tsai, T.-H.; Huang, C.-C.; Zhang, K.-L. Design of hand gesture recognition system for human-computer interaction. Multimedia Tools Appl. 2019, 79, 5989–6007. [Google Scholar] [CrossRef]
- Dahiya, A.; Aroyo, A.M.; Dautenhahn, K.; Smith, S.L. A survey of multi-agent Human–Robot Interaction systems. Robot. Auton. Syst. 2022, 161. [Google Scholar] [CrossRef]
- Yu, H. , 2008. A study on high-precision human muscle fatigue modeling with physiological characteristics and its application in arm flexion and extension movements. Doctoral dissertation, Fudan University.
- Waseem, M.; Devas, G.; Laureta, E. A Neonate With Asymmetric Arm Movements. Pediatr. Emerg. Care 2009, 25, 98–99. [Google Scholar] [CrossRef] [PubMed]
- Todor, J.I.; Kyprie, P.M.; Price, H.L. Lateral Asymmetries in Arm, Wrist and Finger Movements. Cortex 1982, 18, 515–523. [Google Scholar] [CrossRef] [PubMed]
- Haaland, K.Y.; Harrington, D.L. Hemispheric asymmetry of movement. Curr. Opin. Neurobiol. 1996, 6, 796–800. [Google Scholar] [CrossRef] [PubMed]
- Hunter, S.L. Ergonomic evaluation of manufacturing system designs. J. Manuf. Syst. 2001, 20, 429–444. [Google Scholar] [CrossRef]
- Fitzsimons, K.; Acosta, A.M.; Dewald, J.P.A.; Murphey, T.D. Ergodicity reveals assistance and learning from physical human-robot interaction. Sci. Robot. 2019, 4. [Google Scholar] [CrossRef] [PubMed]
- Yi, Z.; Bauer, P.H. Optimization models for placement of an energy-aware electric vehicle charging infrastructure. Transp. Res. Part E: Logist. Transp. Rev. 2016, 91, 227–244. [Google Scholar] [CrossRef]
- Yamin, P.A.R.; Park, J.; Kim, H.K.; Hussain, M. Effects of button colour and background on augmented reality interfaces. Behav. Inf. Technol. 2023, 43, 663–676. [Google Scholar] [CrossRef]
- Andersen, K.W.; Siebner, H.R. Mapping dexterity and handedness: recent insights and future challenges. Curr. Opin. Behav. Sci. 2018, 20, 123–129. [Google Scholar] [CrossRef]
- Buckingham, G. , Carey, D., 2015. Attentional asymmetries - cause or consequence of human right handedness? Front Psychol 5:1587.
- Duffau, H.; Leroy, M.; Gatignol, P. Cortico-subcortical organization of language networks in the right hemisphere: An electrostimulation study in left-handers. Neuropsychologia 2008, 46, 3197–3209. [Google Scholar] [CrossRef] [PubMed]
- Szaflarski, J.P.; Holland, S.K.; Schmithorst, V.J.; Byars, A.W. fMRI study of language lateralization in children and adults. Hum. Brain Mapp. 2005, 27, 202–212. [Google Scholar] [CrossRef] [PubMed]
- Behrendt, F.; Rizza, J.C.; Blum, F.; Suica, Z.; Schuster-Amft, C. German version of the Chedoke McMaster arm and hand activity inventory (CAHAI-G): intra-rater reliability and responsiveness. Heal. Qual. Life Outcomes 2020, 18, 1–9. [Google Scholar] [CrossRef] [PubMed]
- Buser, T.; Cappelen, A.; Gneezy, U.; Hoffman, M.; Tungodden, B. Competitiveness, gender and handedness. Econ. Hum. Biol. 2021, 43, 101037. [Google Scholar] [CrossRef] [PubMed]
- Edlin, J.M.; Leppanen, M.L.; Fain, R.J.; Hackländer, R.P.; Hanaver-Torrez, S.D.; Lyle, K.B. On the use (and misuse?) of the Edinburgh Handedness Inventory. Brain Cogn. 2015, 94, 44–51. [Google Scholar] [CrossRef] [PubMed]
- Burns, B.D.; Webb, A.C. Spread of Responses in the Cerebral Cortex to Meaningful Stimuli. Nature 1970, 225, 469–470. [Google Scholar] [CrossRef] [PubMed]
- Fitts, P.M. The information capacity of the human motor system in controlling the amplitude of movement. J. Exp. Psychol. 1954, 47, 381–391. [Google Scholar] [CrossRef] [PubMed]
- Deborah, A. , Shani, M., Dafna, H., Omer, W., David, E., Leonid, K., (2022) Optimal bed height for passive manual tasks. Journal of Bodywork and Movement Therapies 29, pages 127-133.
- Şenol, M.B. A new optimization model for design of traditional cockpit interfaces. Aircr. Eng. Aerosp. Technol. 2020, 92, 404–417. [Google Scholar] [CrossRef]
- Takeda, M.; Sato, T.; Saito, H.; Iwasaki, H.; Nambu, I.; Wada, Y. Explanation of Fitts’ law in Reaching Movement based on Human Arm Dynamics. Sci. Rep. 2019, 9, 1–12. [Google Scholar] [CrossRef] [PubMed]
- Budisavljevic, S.; Castiello, U.; Begliomini, C. Handedness and White Matter Networks. Neurosci. 2020, 27, 88–103. [Google Scholar] [CrossRef] [PubMed]
- Hoffmann, E.R. Movement time of right- and left-handers using their preferred and non-preferred hands. Int. J. Ind. Ergon. 1997, 19, 49–57. [Google Scholar] [CrossRef]
- Bobrova, E.V.; Reshetnikova, V.V.; Vershinina, E.A.; Grishin, A.A.; Bobrov, P.D.; Frolov, A.A.; Gerasimenko, Y.P. Success of Hand Movement Imagination Depends on Personality Traits, Brain Asymmetry, and Degree of Handedness. Brain Sci. 2021, 11, 853. [Google Scholar] [CrossRef] [PubMed]
- Casey, M.B.; Winner, E.; Benbow, C.; Hayes, R.; Dasilva, D. Skill at image generation: Handedness interacts with strategy preference for individuals majoring in spatial fields. Cogn. Neuropsychol. 1993, 10, 57–77. [Google Scholar] [CrossRef]
- Nastou, E.; Ocklenburg, S.; Hoogman, M.; Papadatou-Pastou, M. Handedness in ADHD: Meta-Analyses. Neuropsychol. Rev. 2022, 32, 877–892. [Google Scholar] [CrossRef] [PubMed]
- Todor, J.I.; Doane, T. Handedness Classification: Preference versus Proficiency. Percept. Mot. Ski. 1977, 45, 1041–1042. [Google Scholar] [CrossRef] [PubMed]
- Morgenstern, H.; Glazer, W.M.; Doucette, J.T. Handedness and the risk of tardive dyskinesia. Biol. Psychiatry 1996, 40, 35–42. [Google Scholar] [CrossRef] [PubMed]
- Hicks, R.E.; Kinsbourne, M. Human Handedness: A Partial Cross-Fostering Study. Science 1976, 192, 908–910. [Google Scholar] [CrossRef] [PubMed]
- Jiang, Y.; Peng, X.; Xue, M.; Wang, C.; Qi, H. An Underwater Human–Robot Interaction Using Hand Gestures for Fuzzy Control. Int. J. Fuzzy Syst. 2020, 23, 1879–1889. [Google Scholar] [CrossRef]
Figure 1.
The tester prepares the pose.
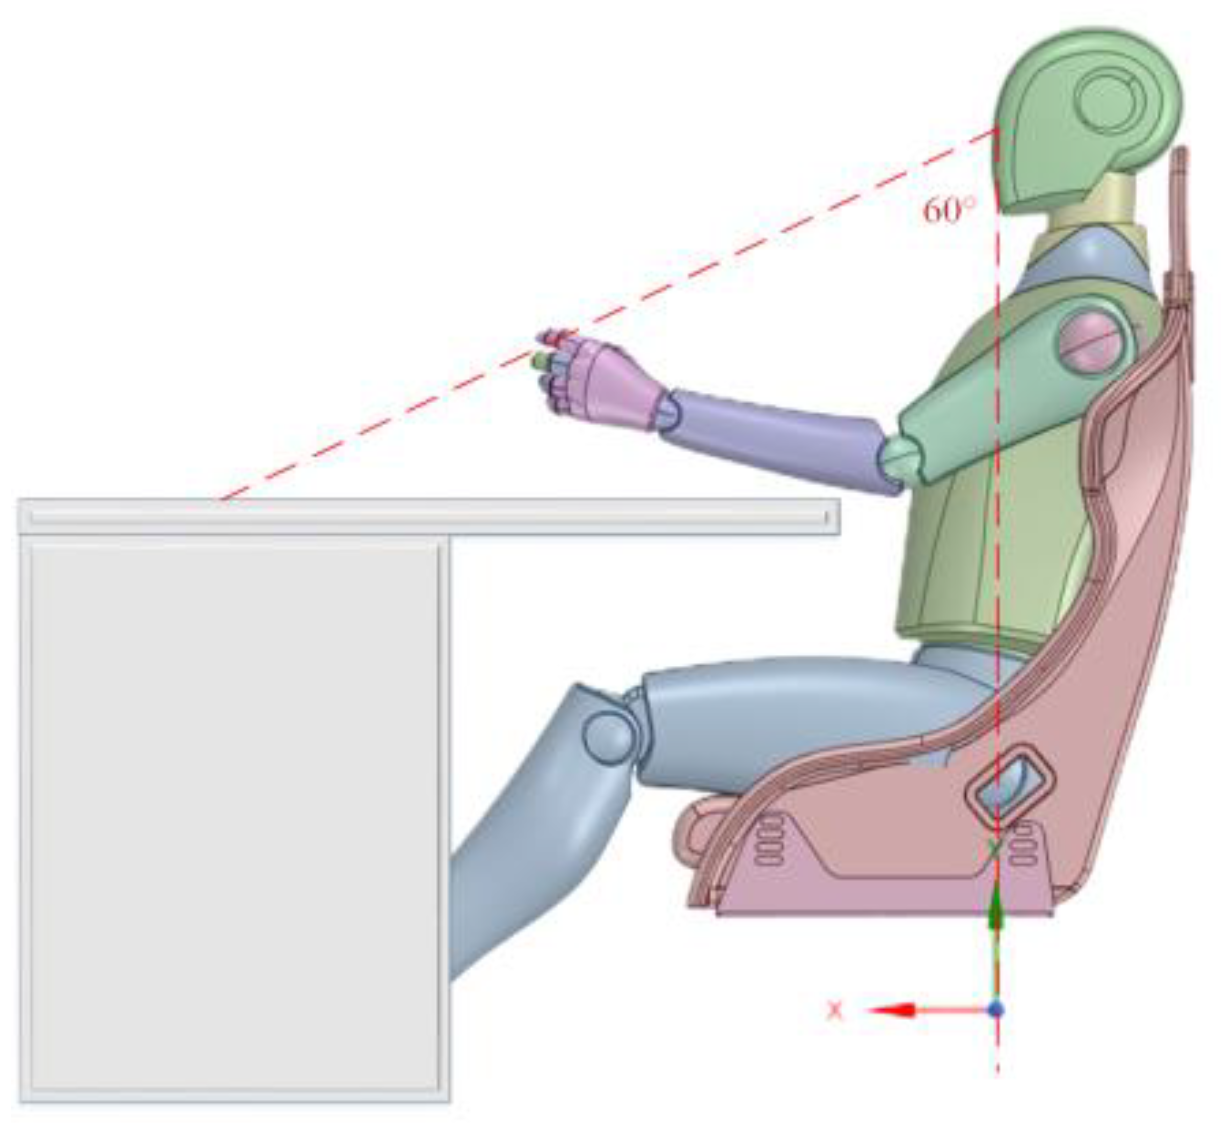
Figure 2.
Location Schematic.
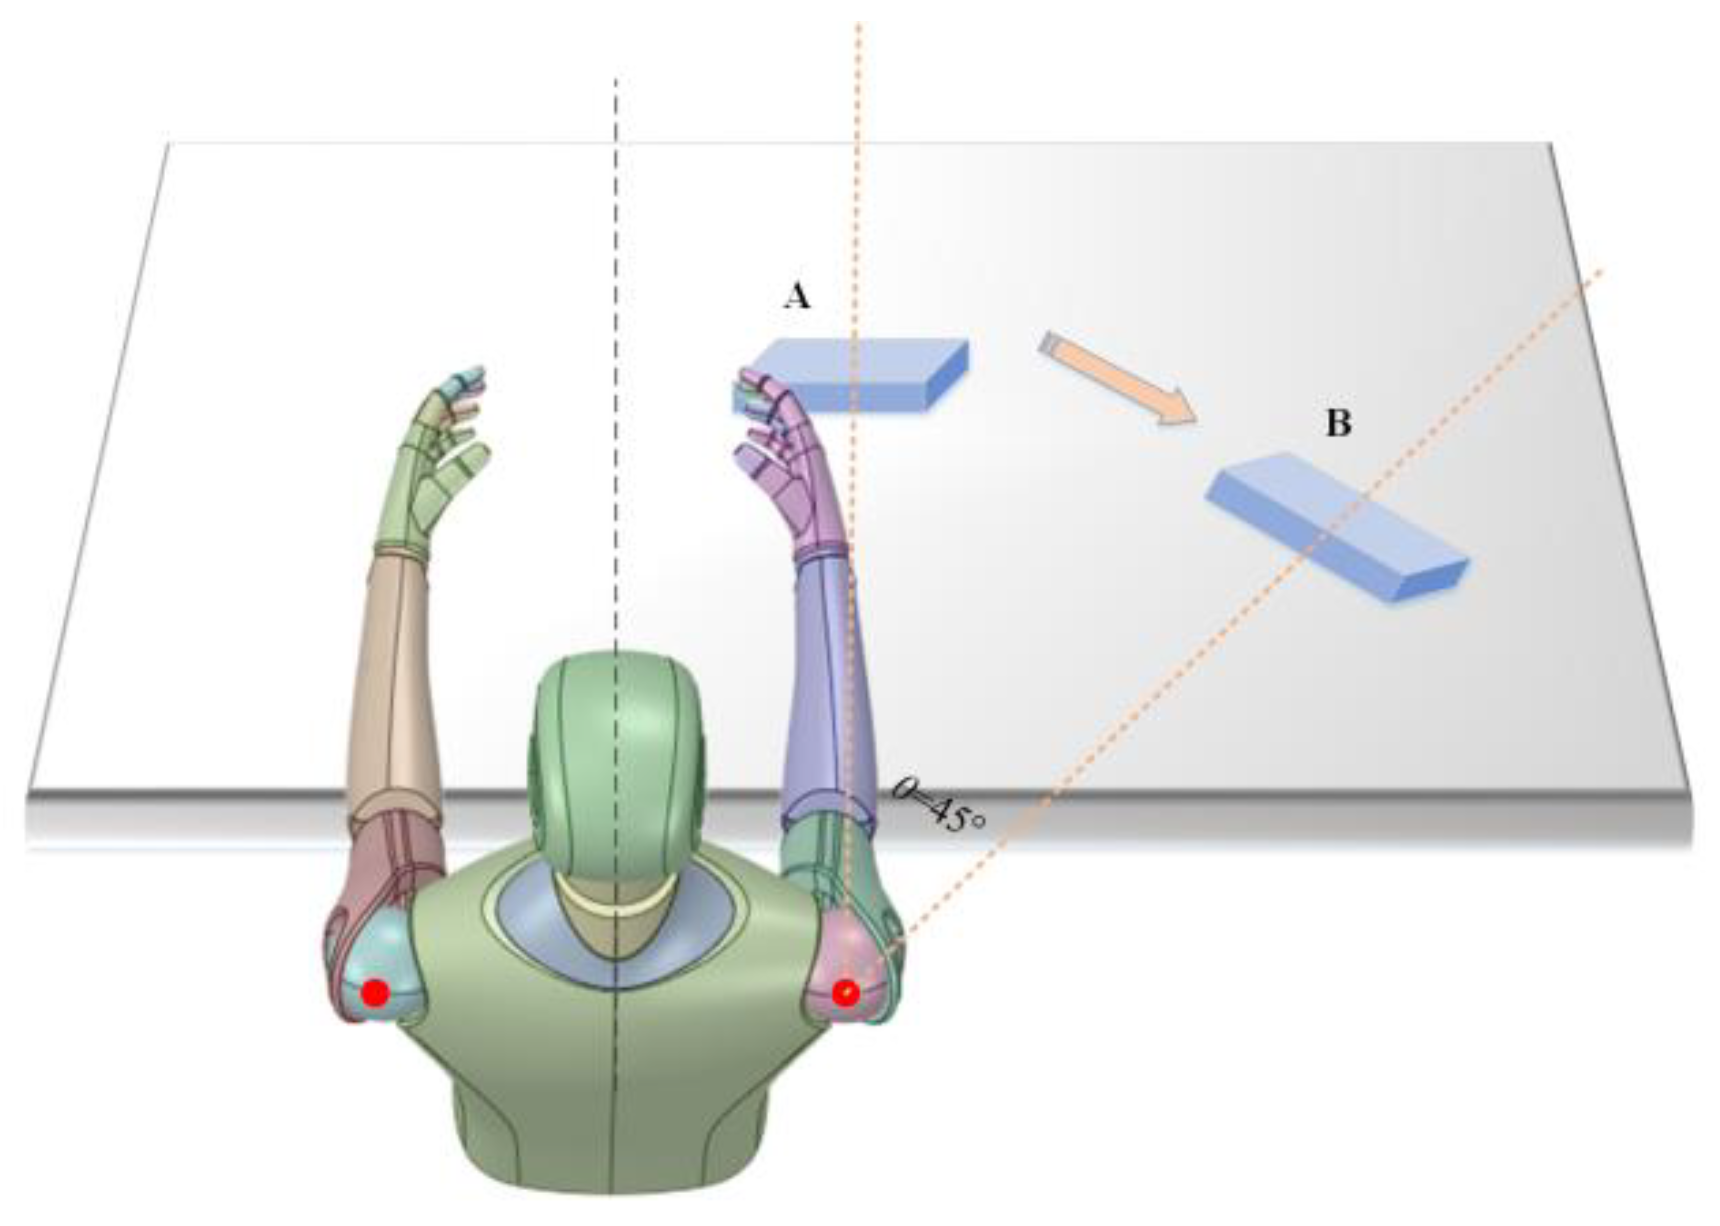
Figure 3.
Regional division of the keys.
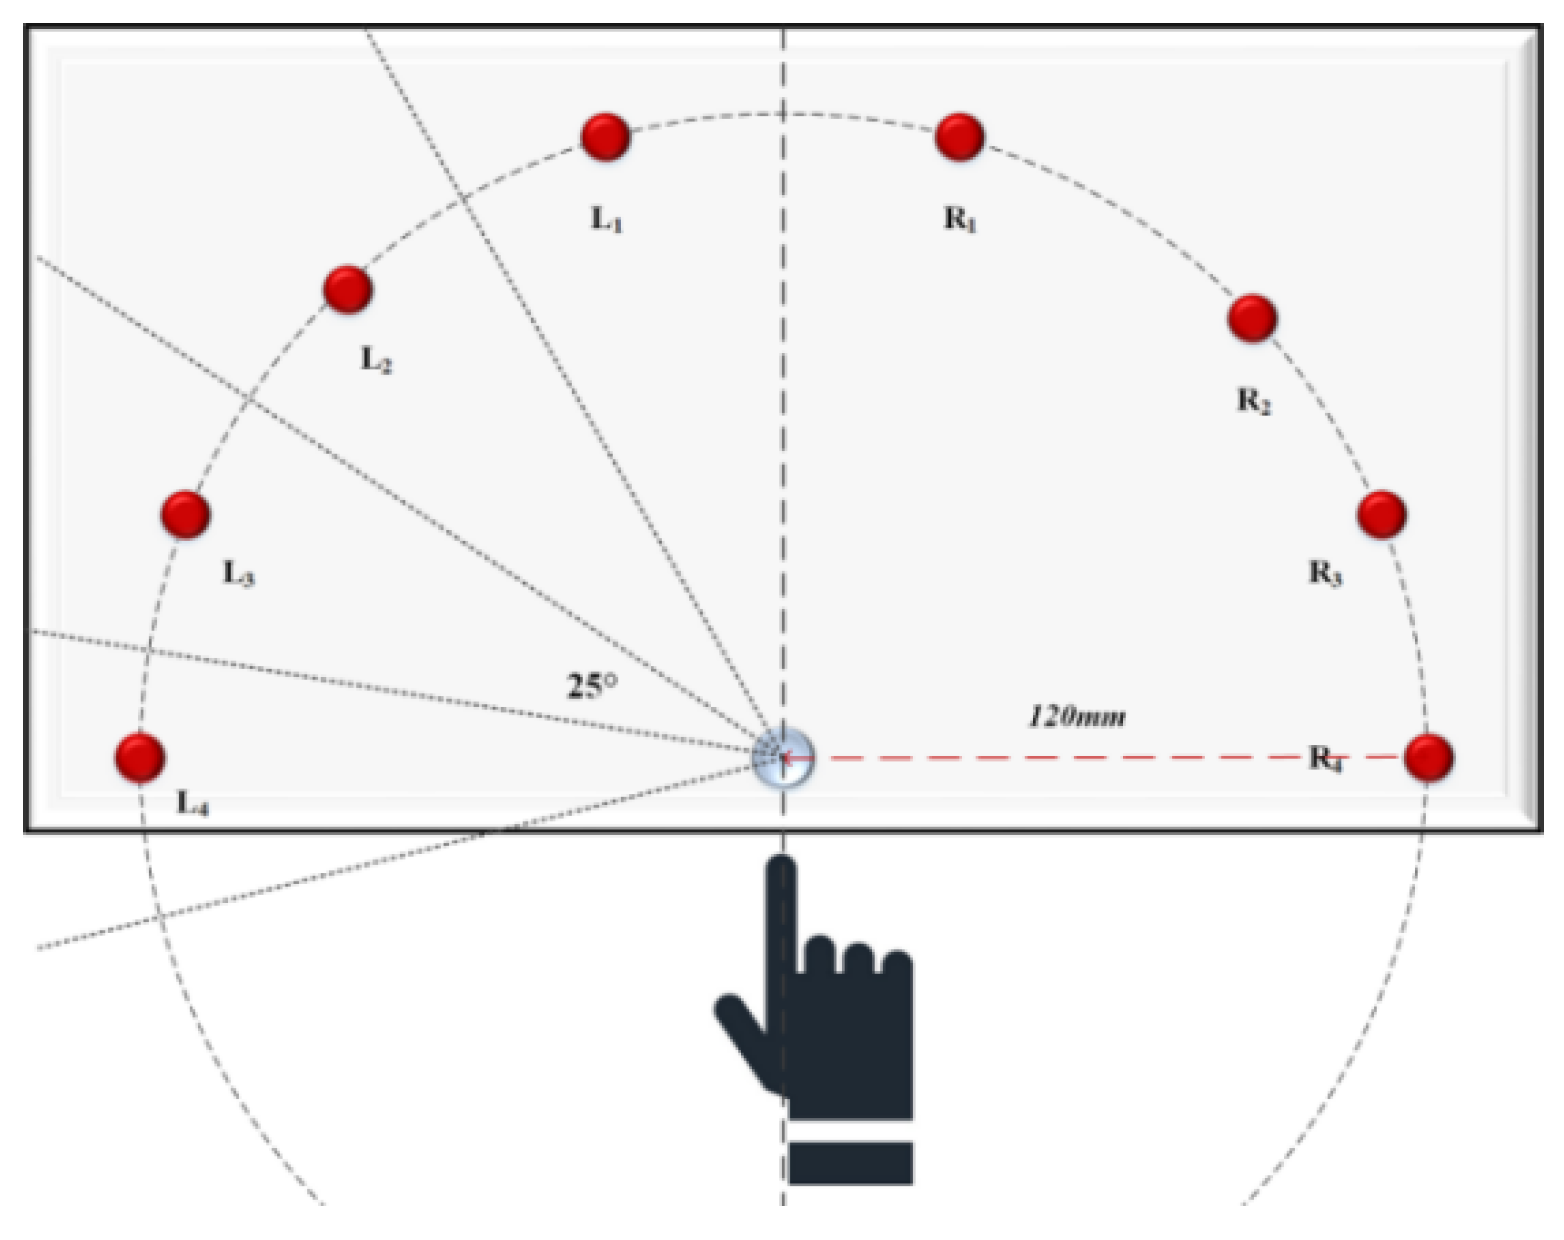
Figure 4.
Plot of the score statistics for each item.

Figure 5.
Score with RT, (a) Mean RT of the L group; (b) RT at position A in group L; (c) RT of position B in group L; (d) Mean RT of the R group.
Figure 5.
Score with RT, (a) Mean RT of the L group; (b) RT at position A in group L; (c) RT of position B in group L; (d) Mean RT of the R group.
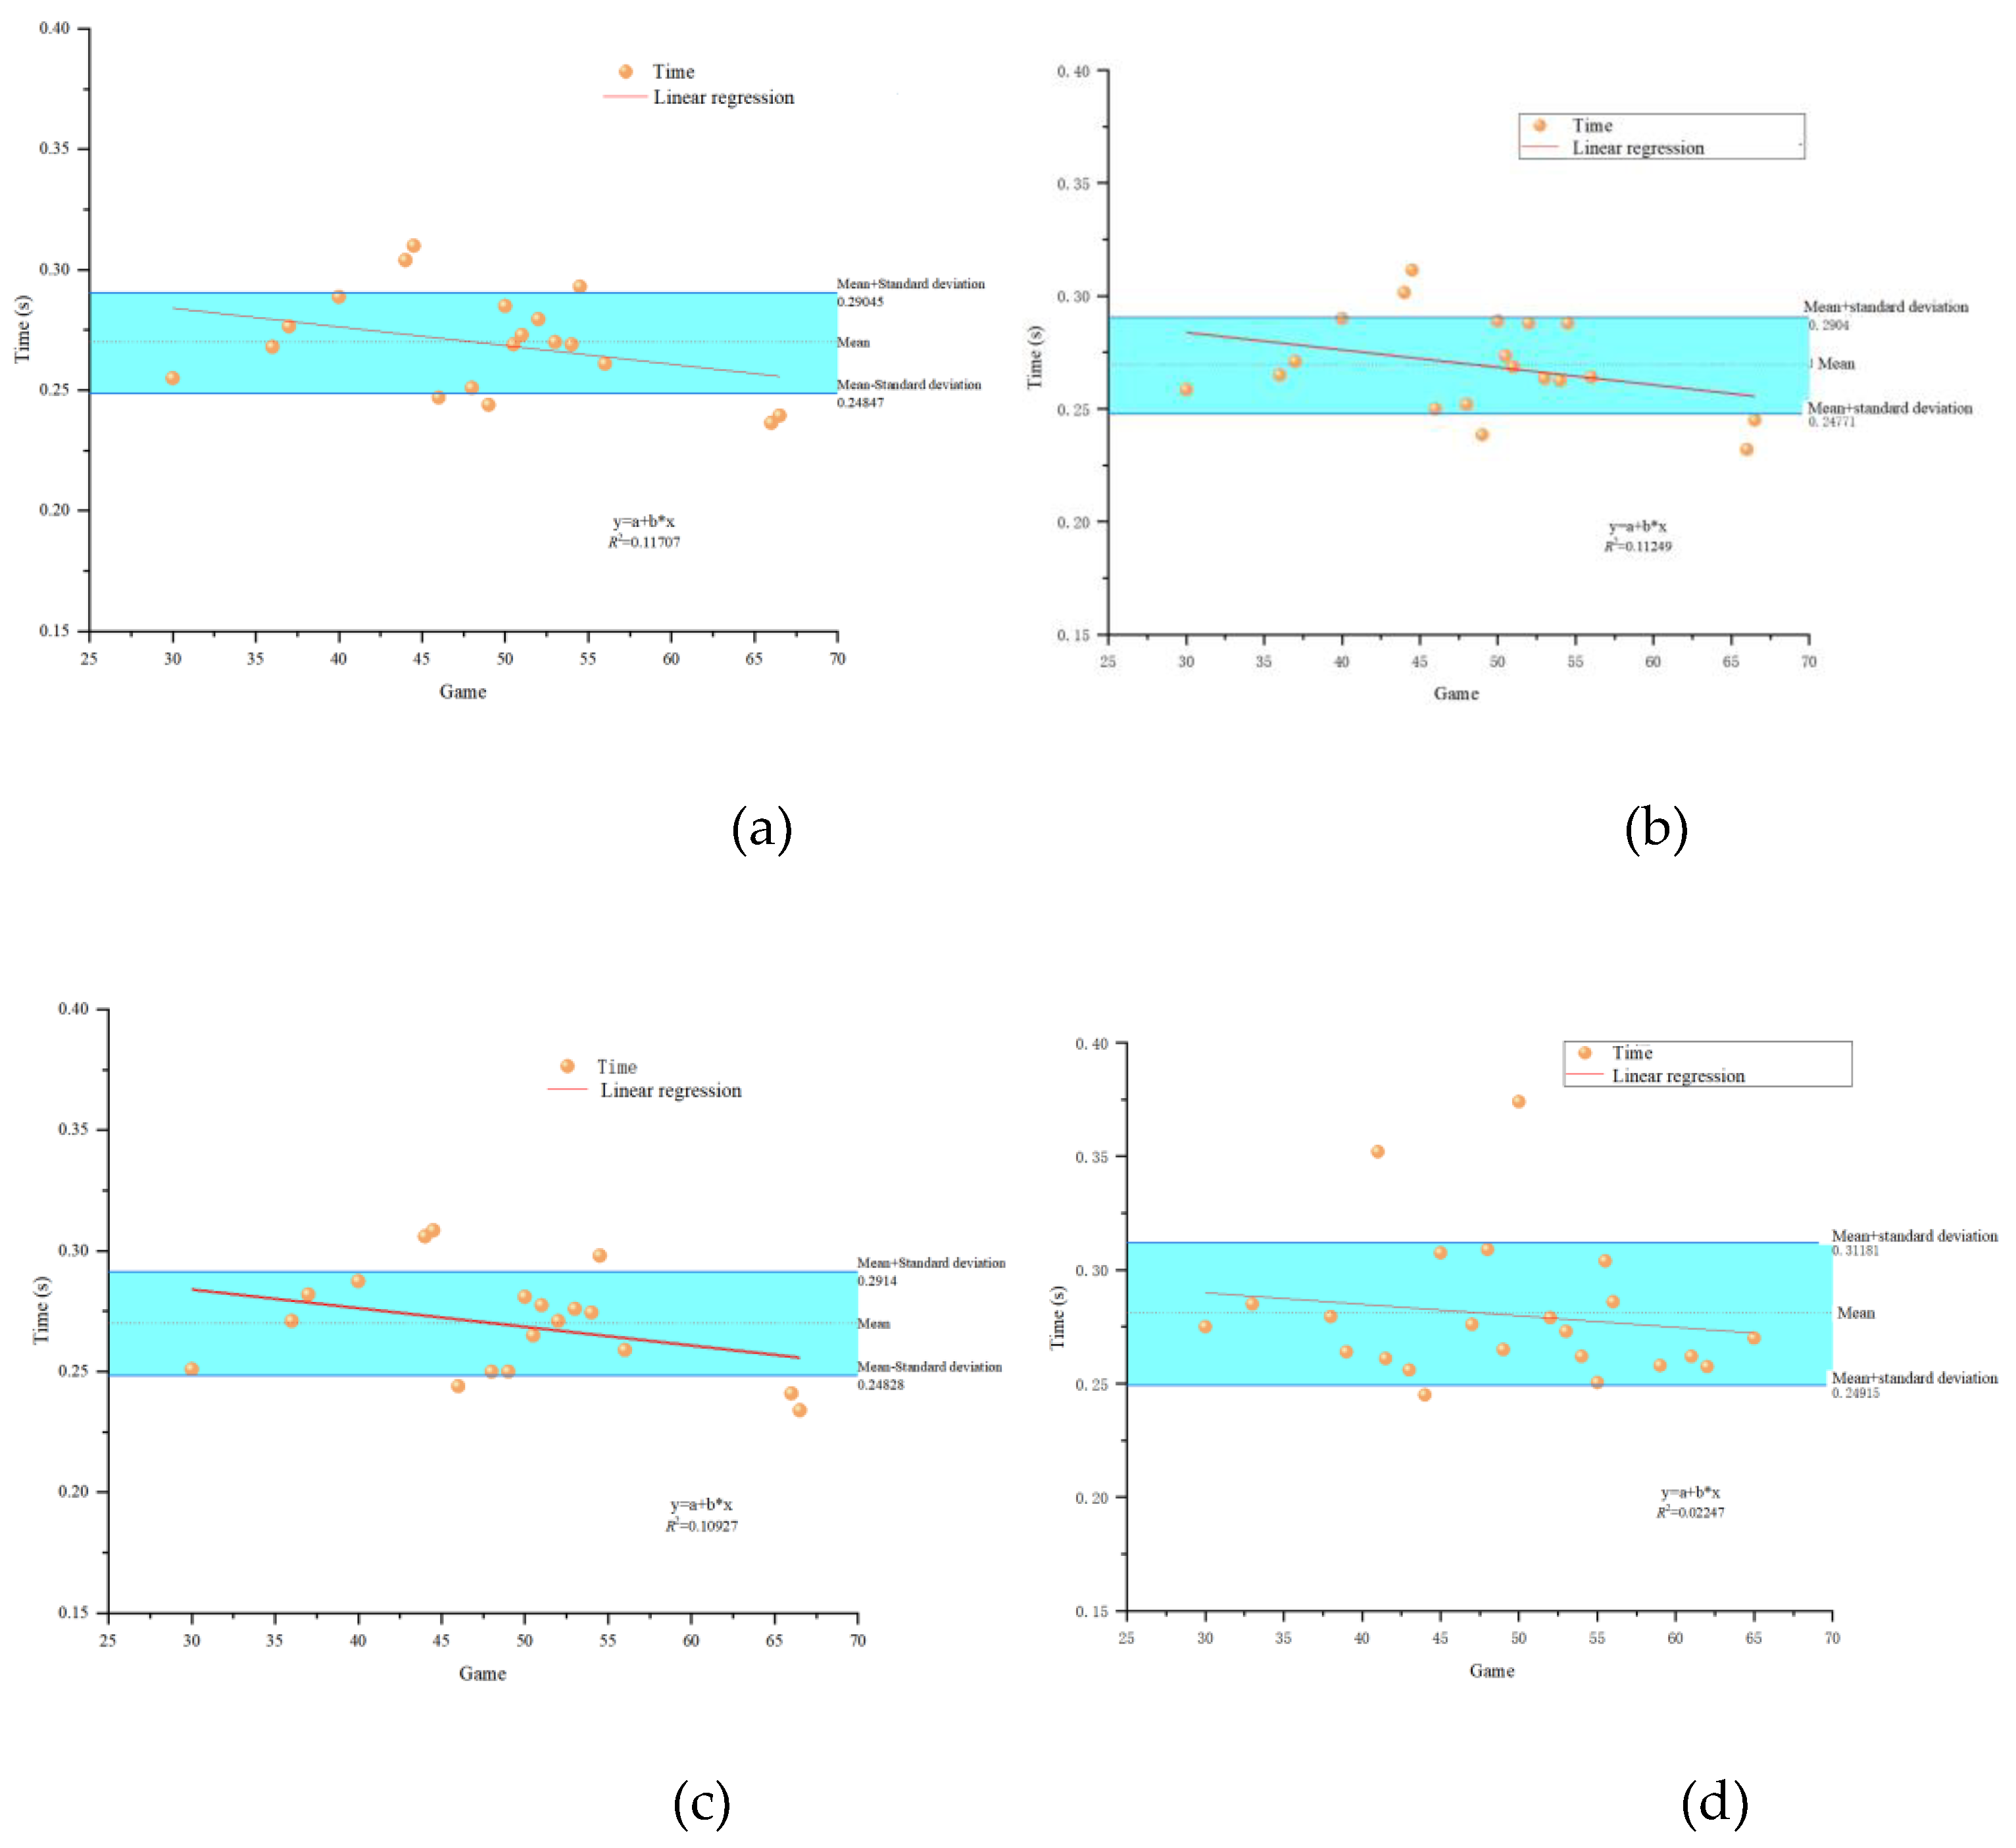
Figure 6.
ET trends at different locations.
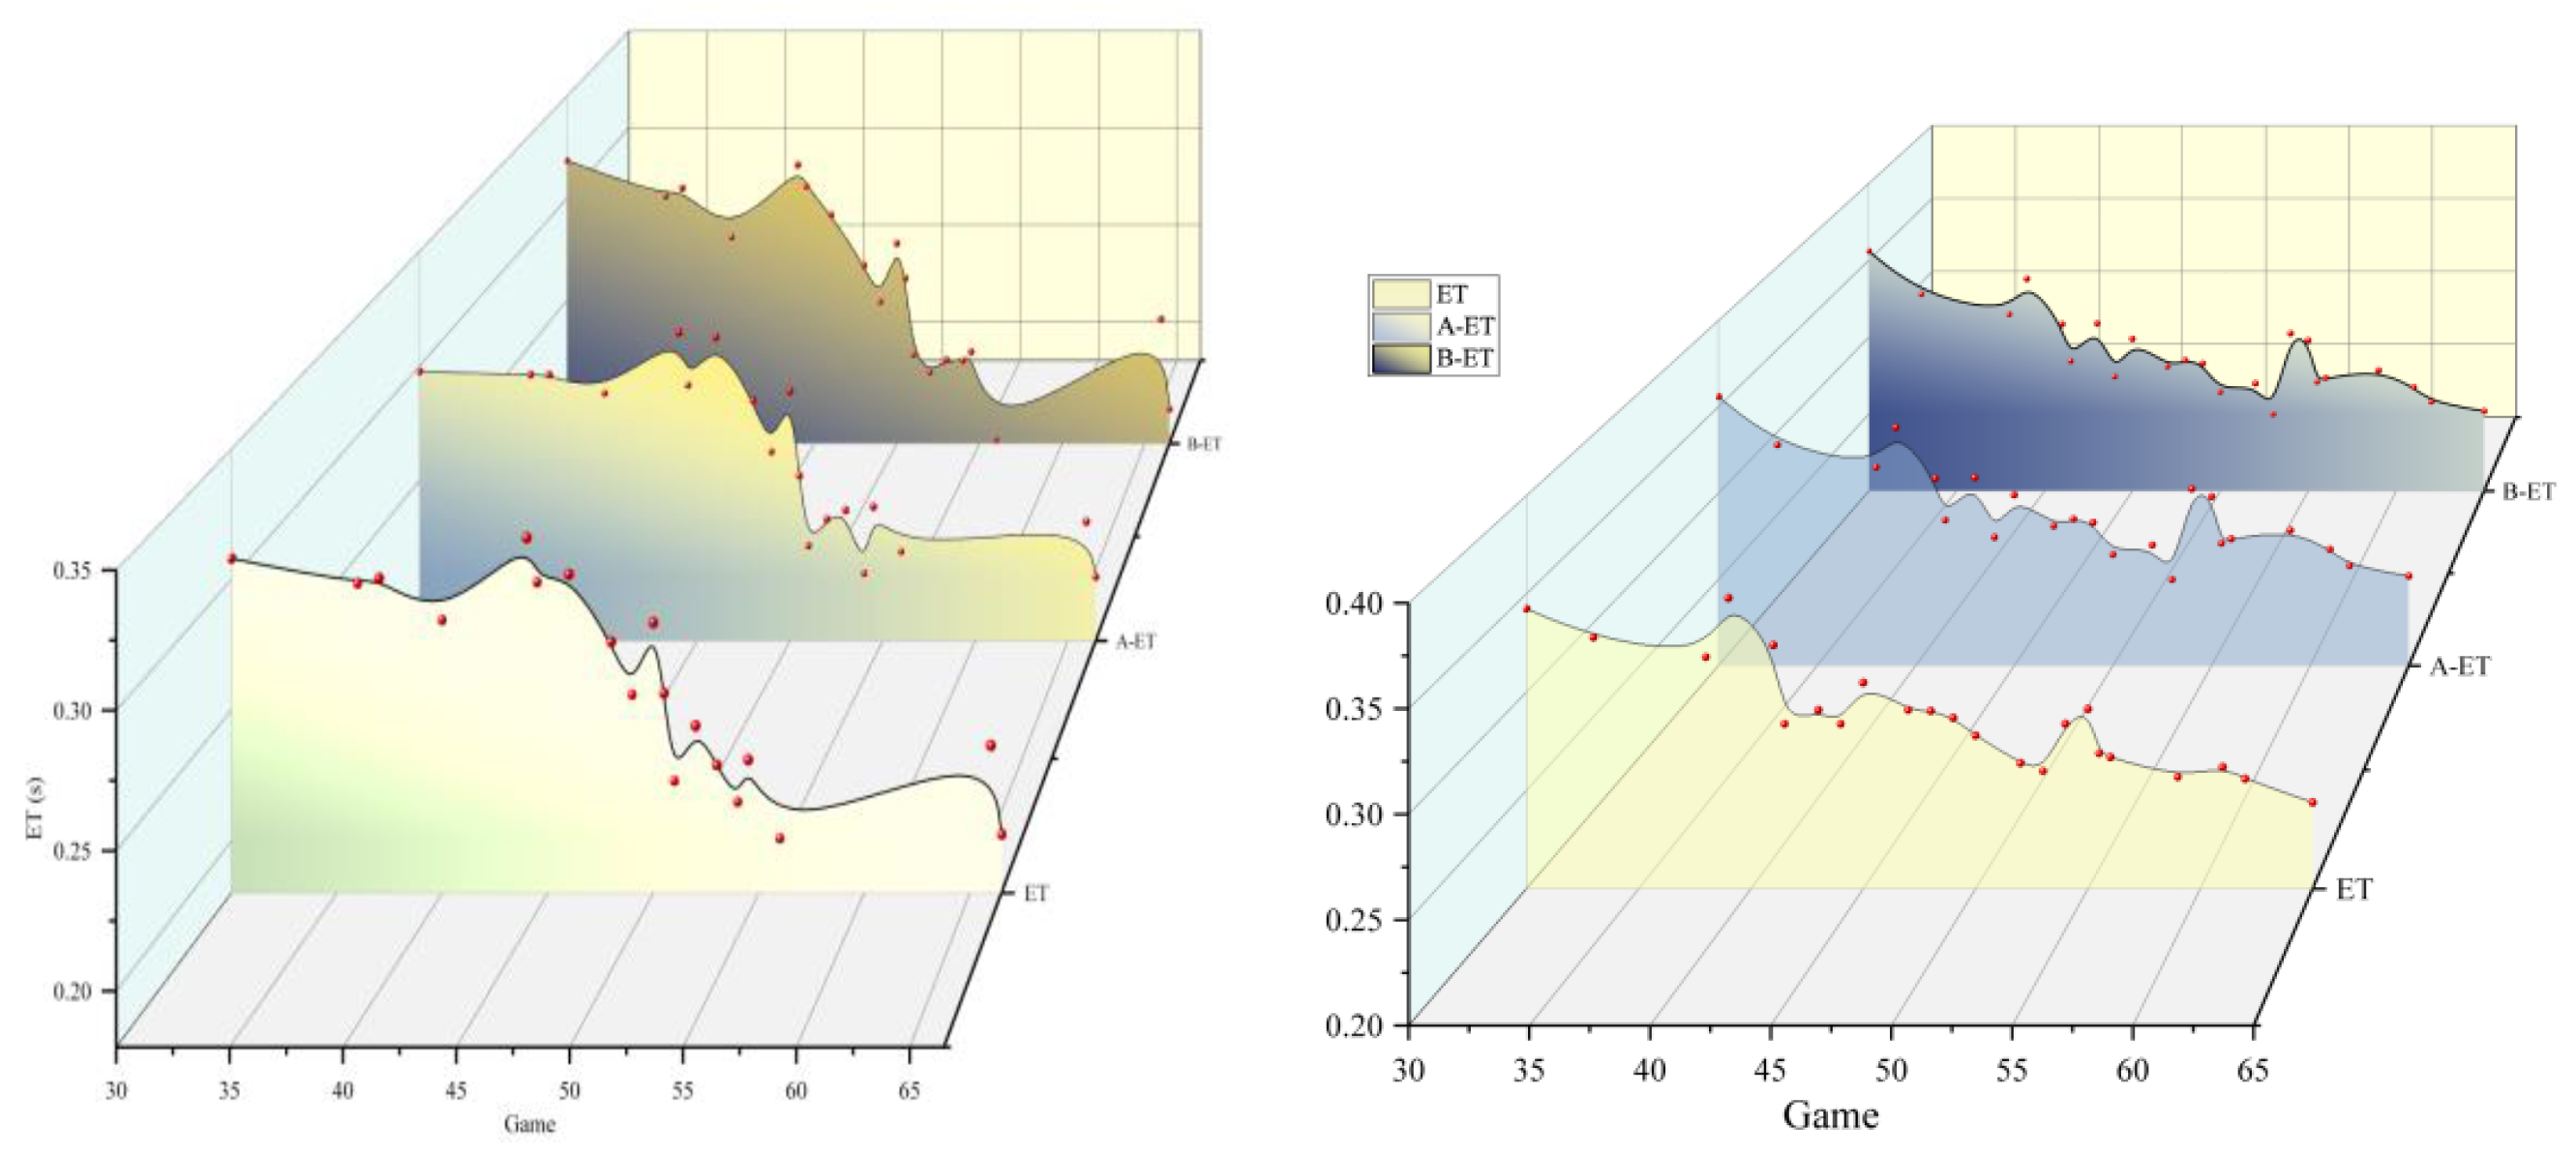
Figure 7.
Score with ET, (a) L group; (b) R group.
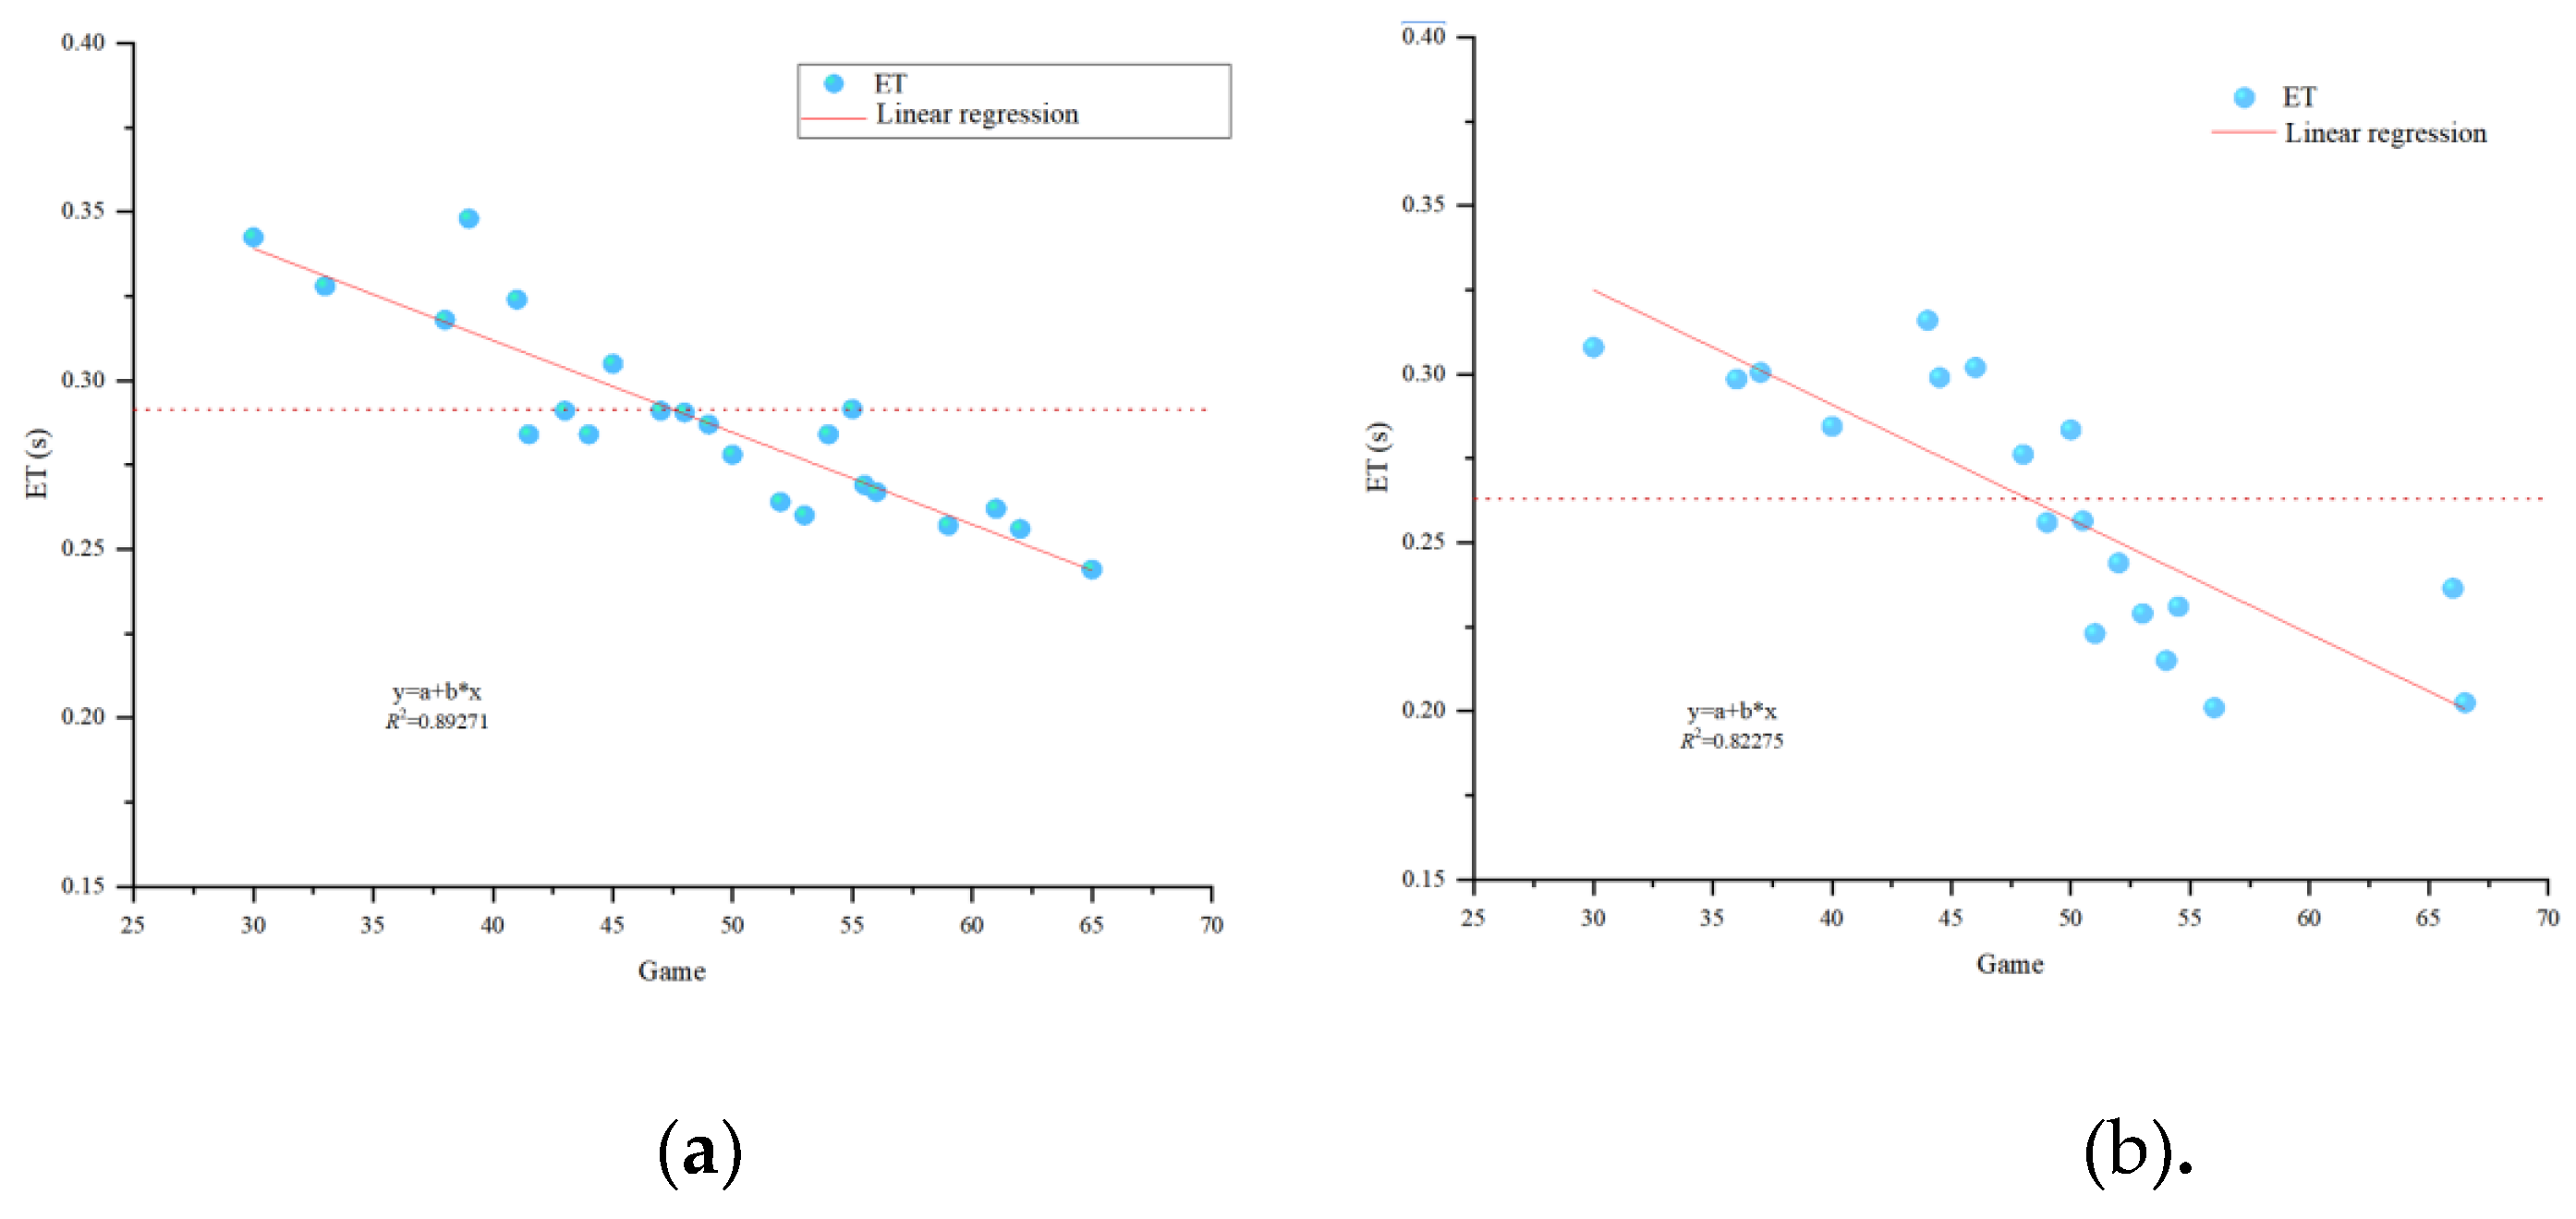
Figure 8.
Test time and time difference in the different scoring intervals, (a) ET; (b) MRT.
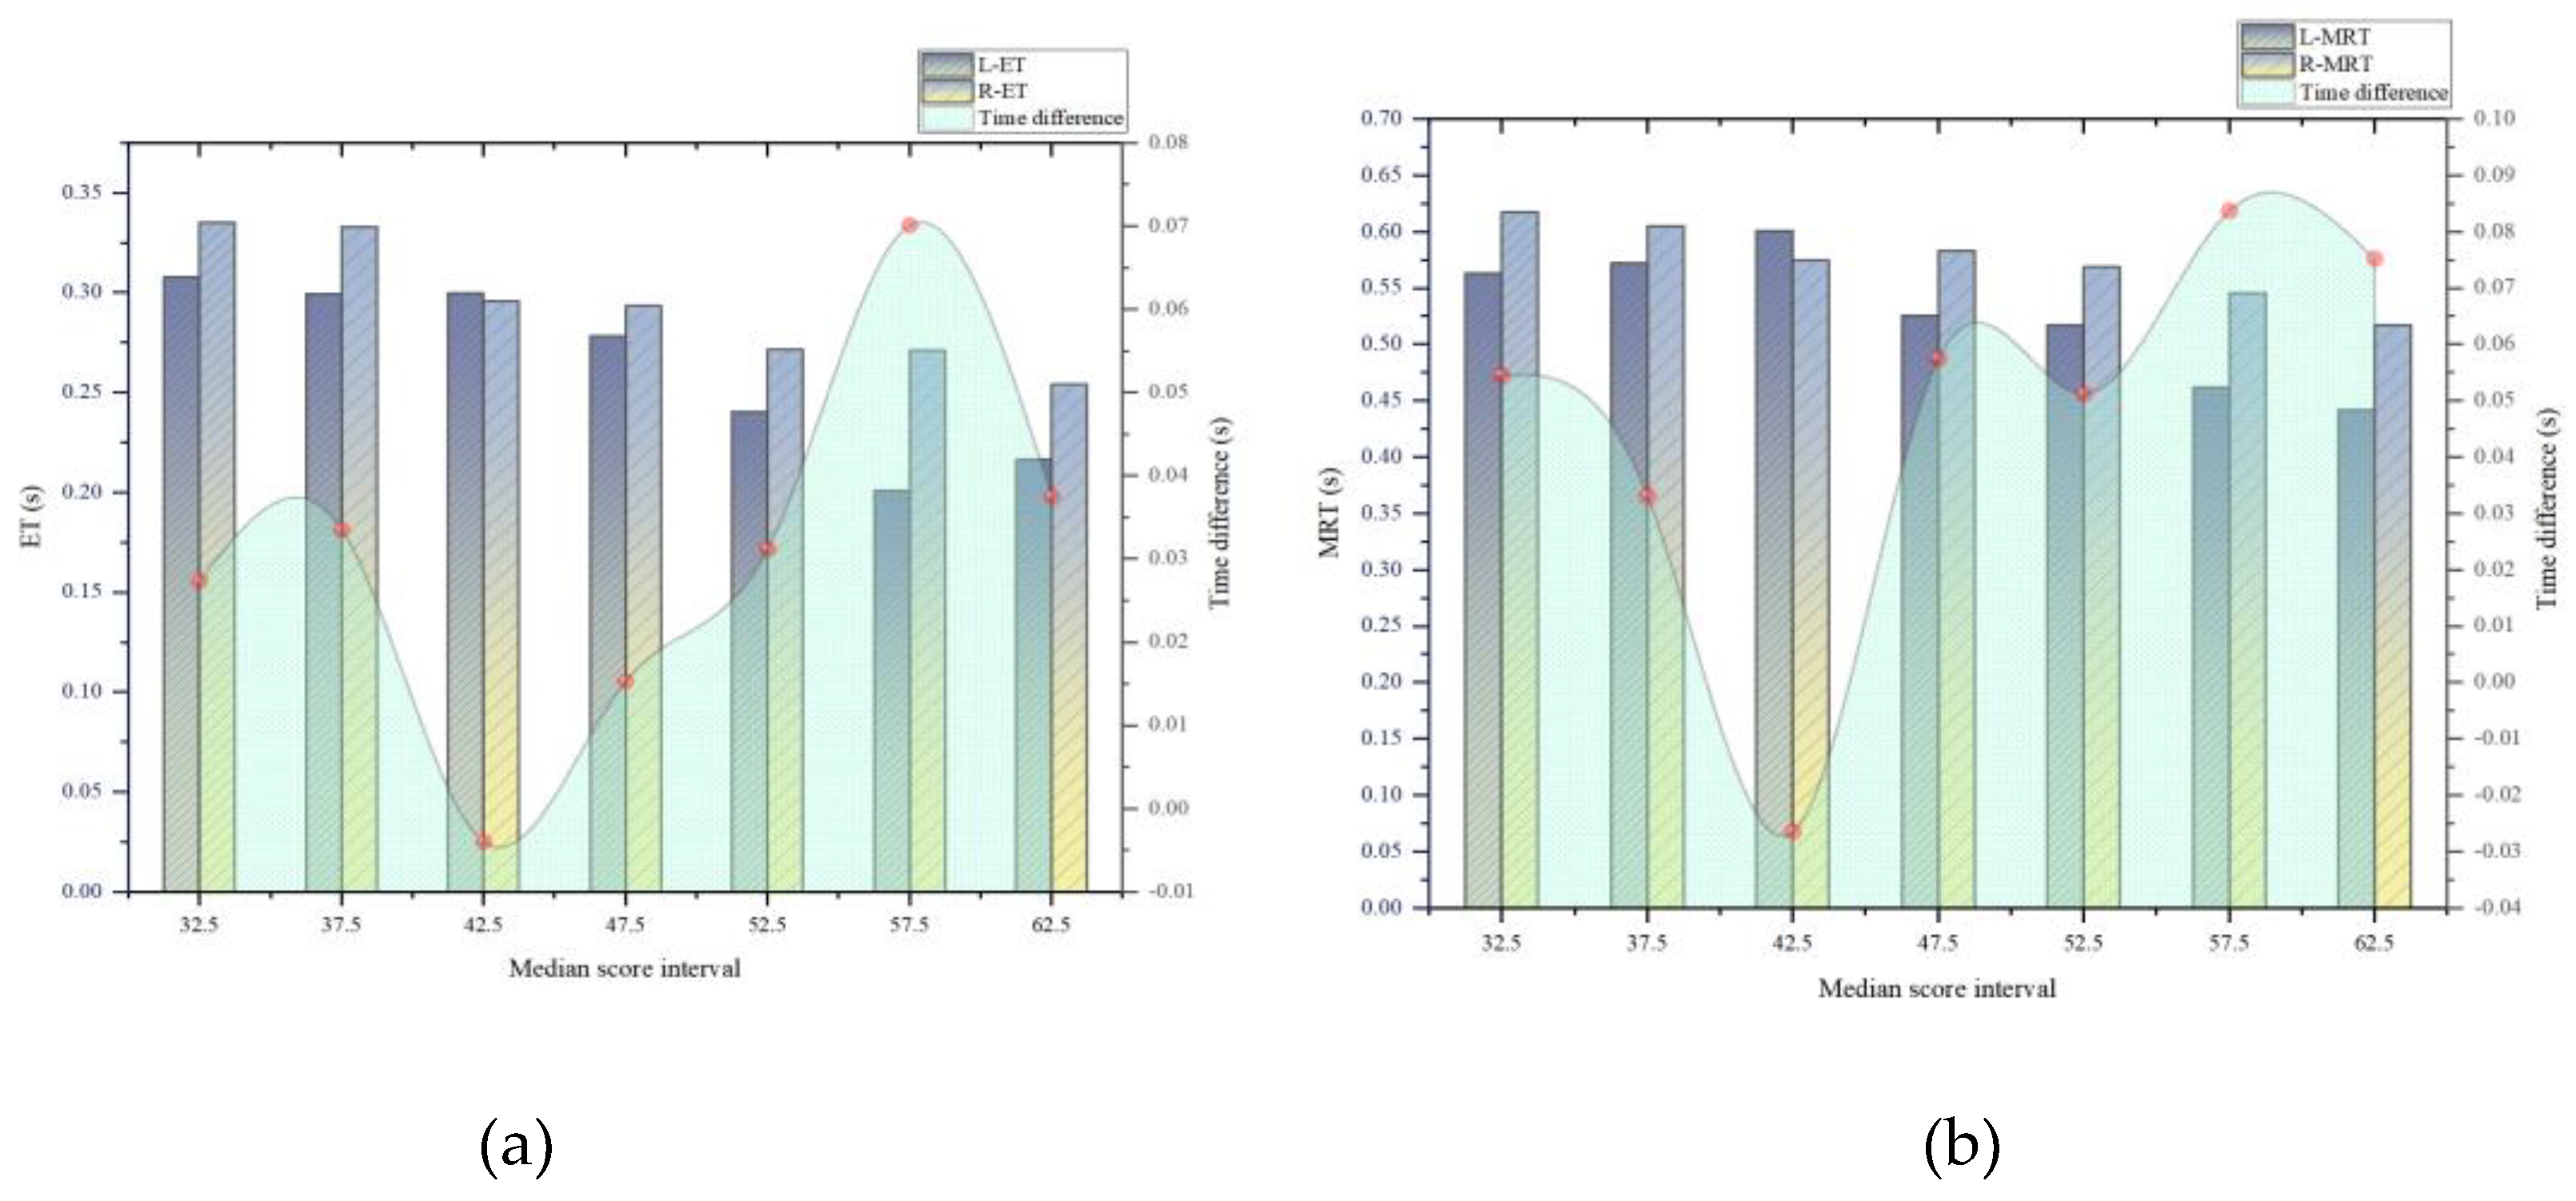
Figure 9.
Zoning, (a) Position A; (b) Position B.
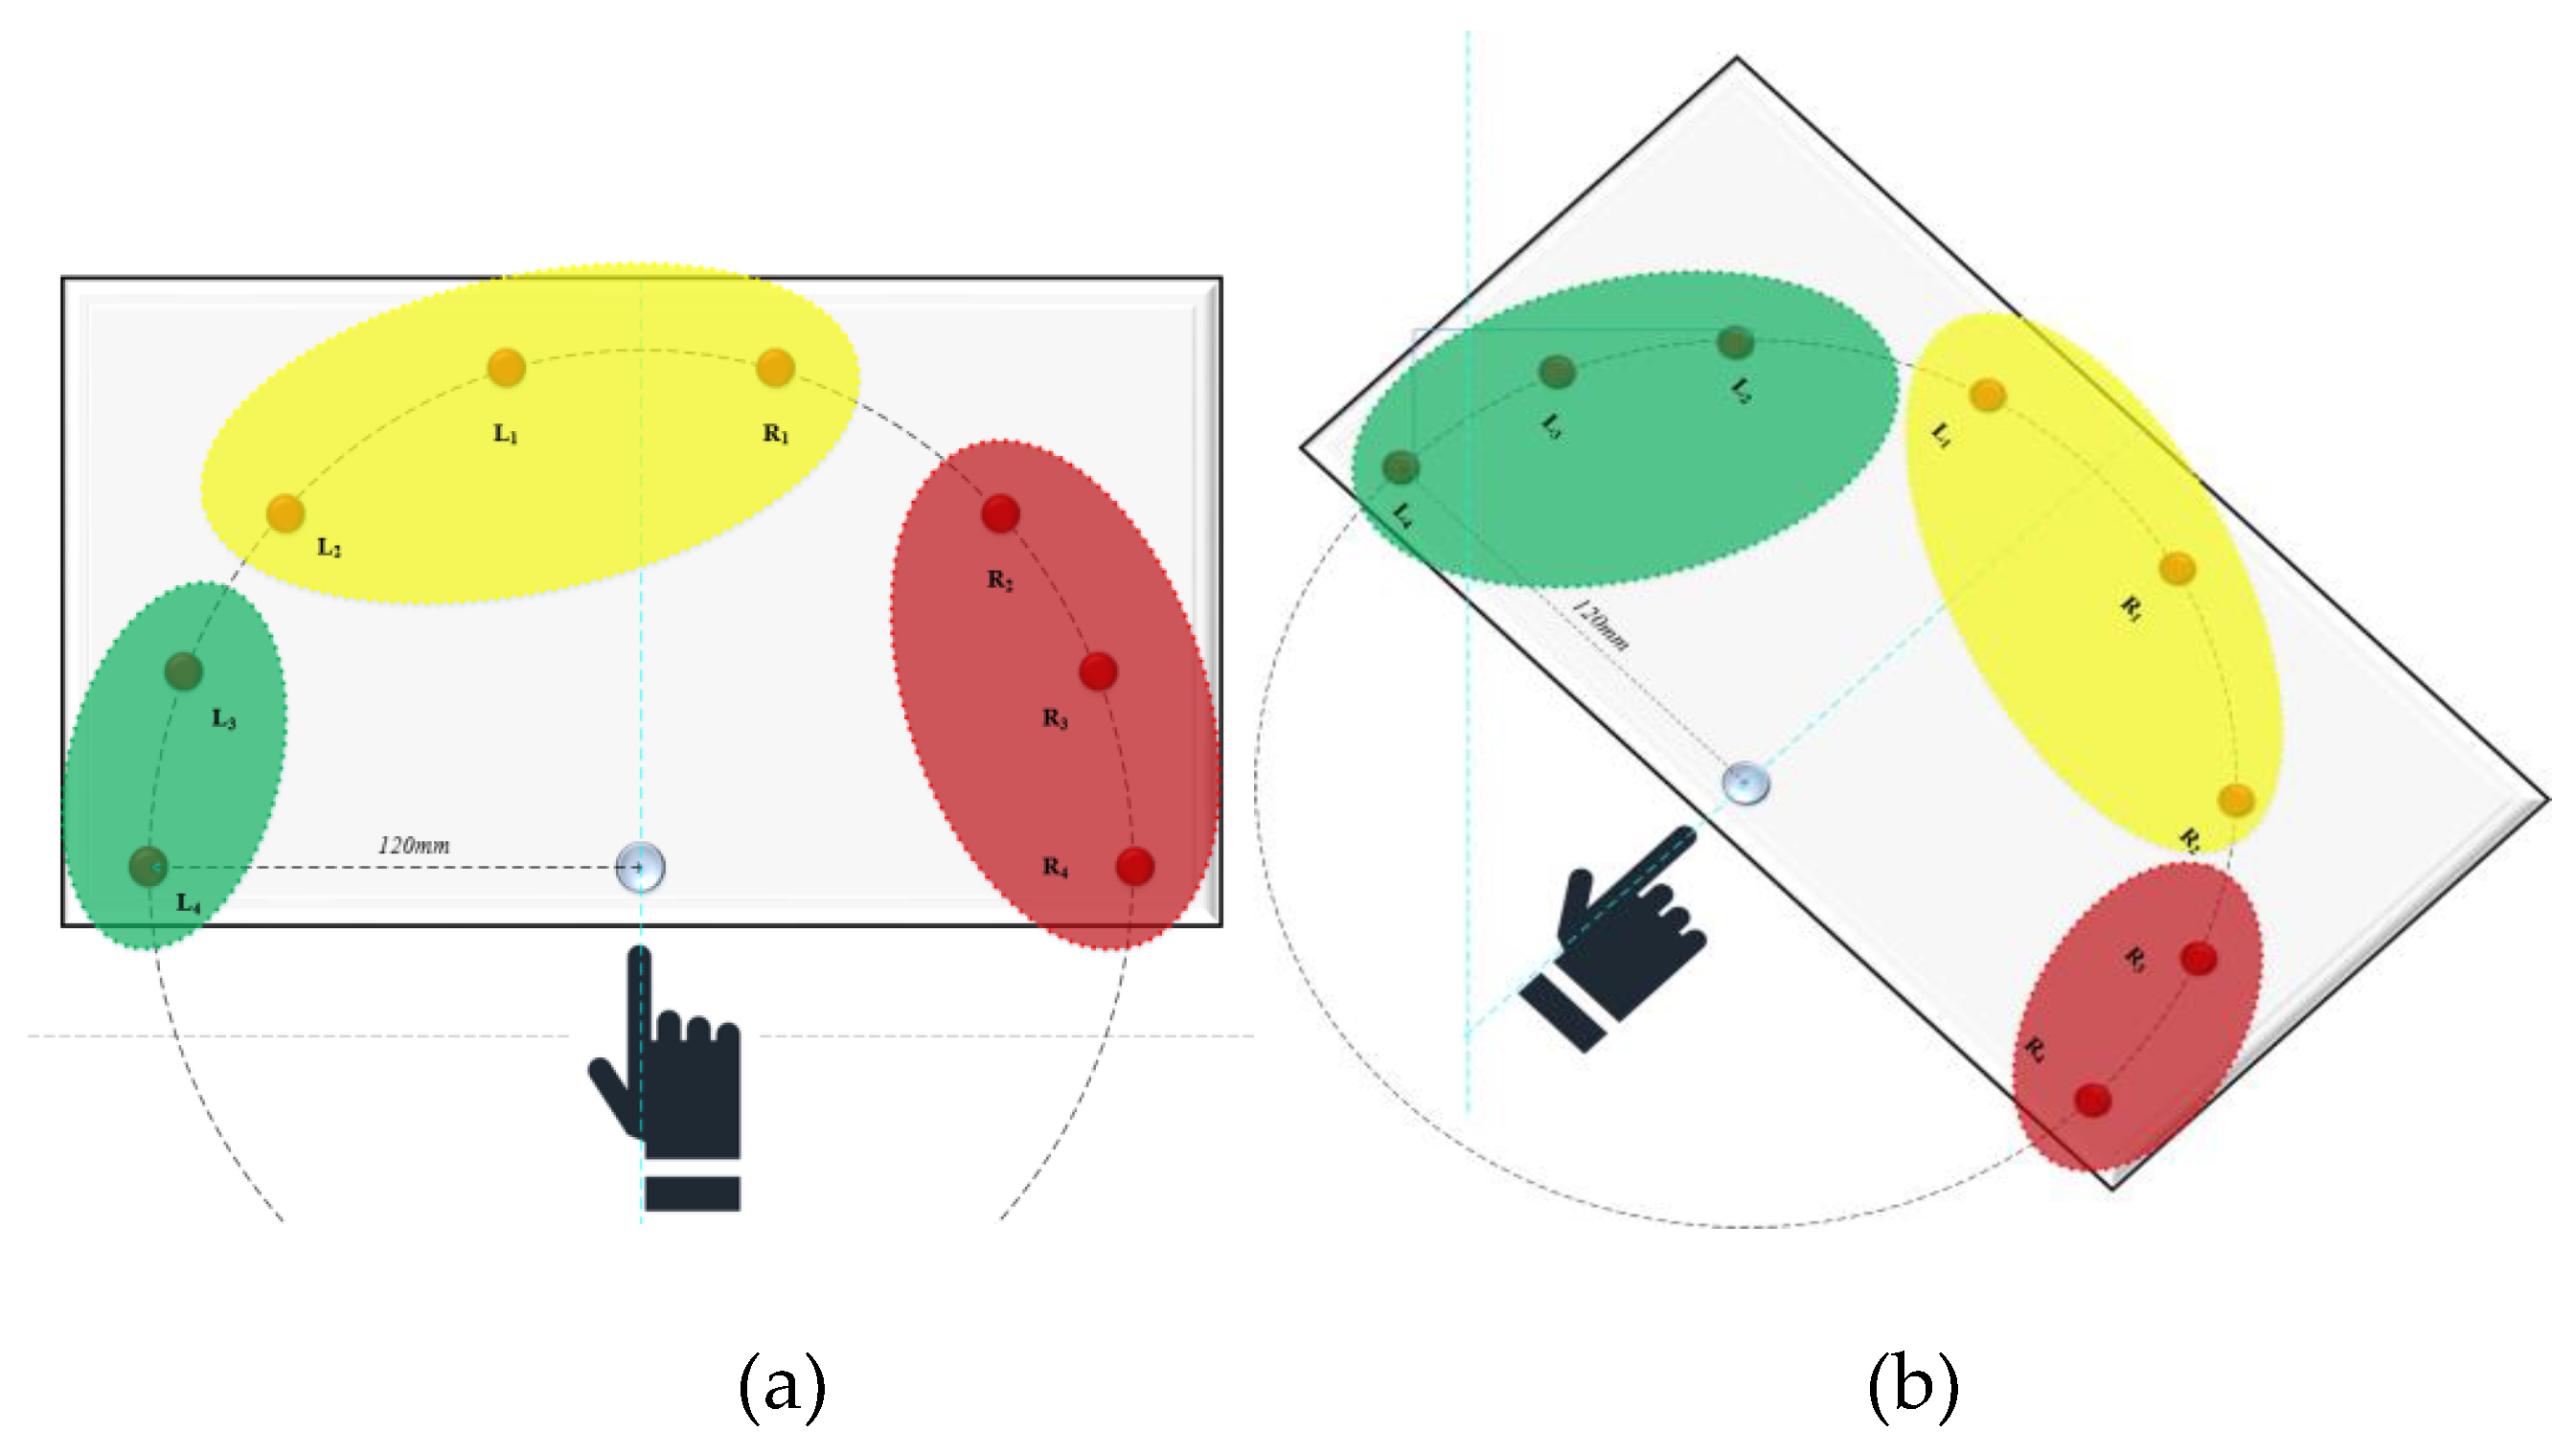
Figure 10.
The “muscle group” of the arm.
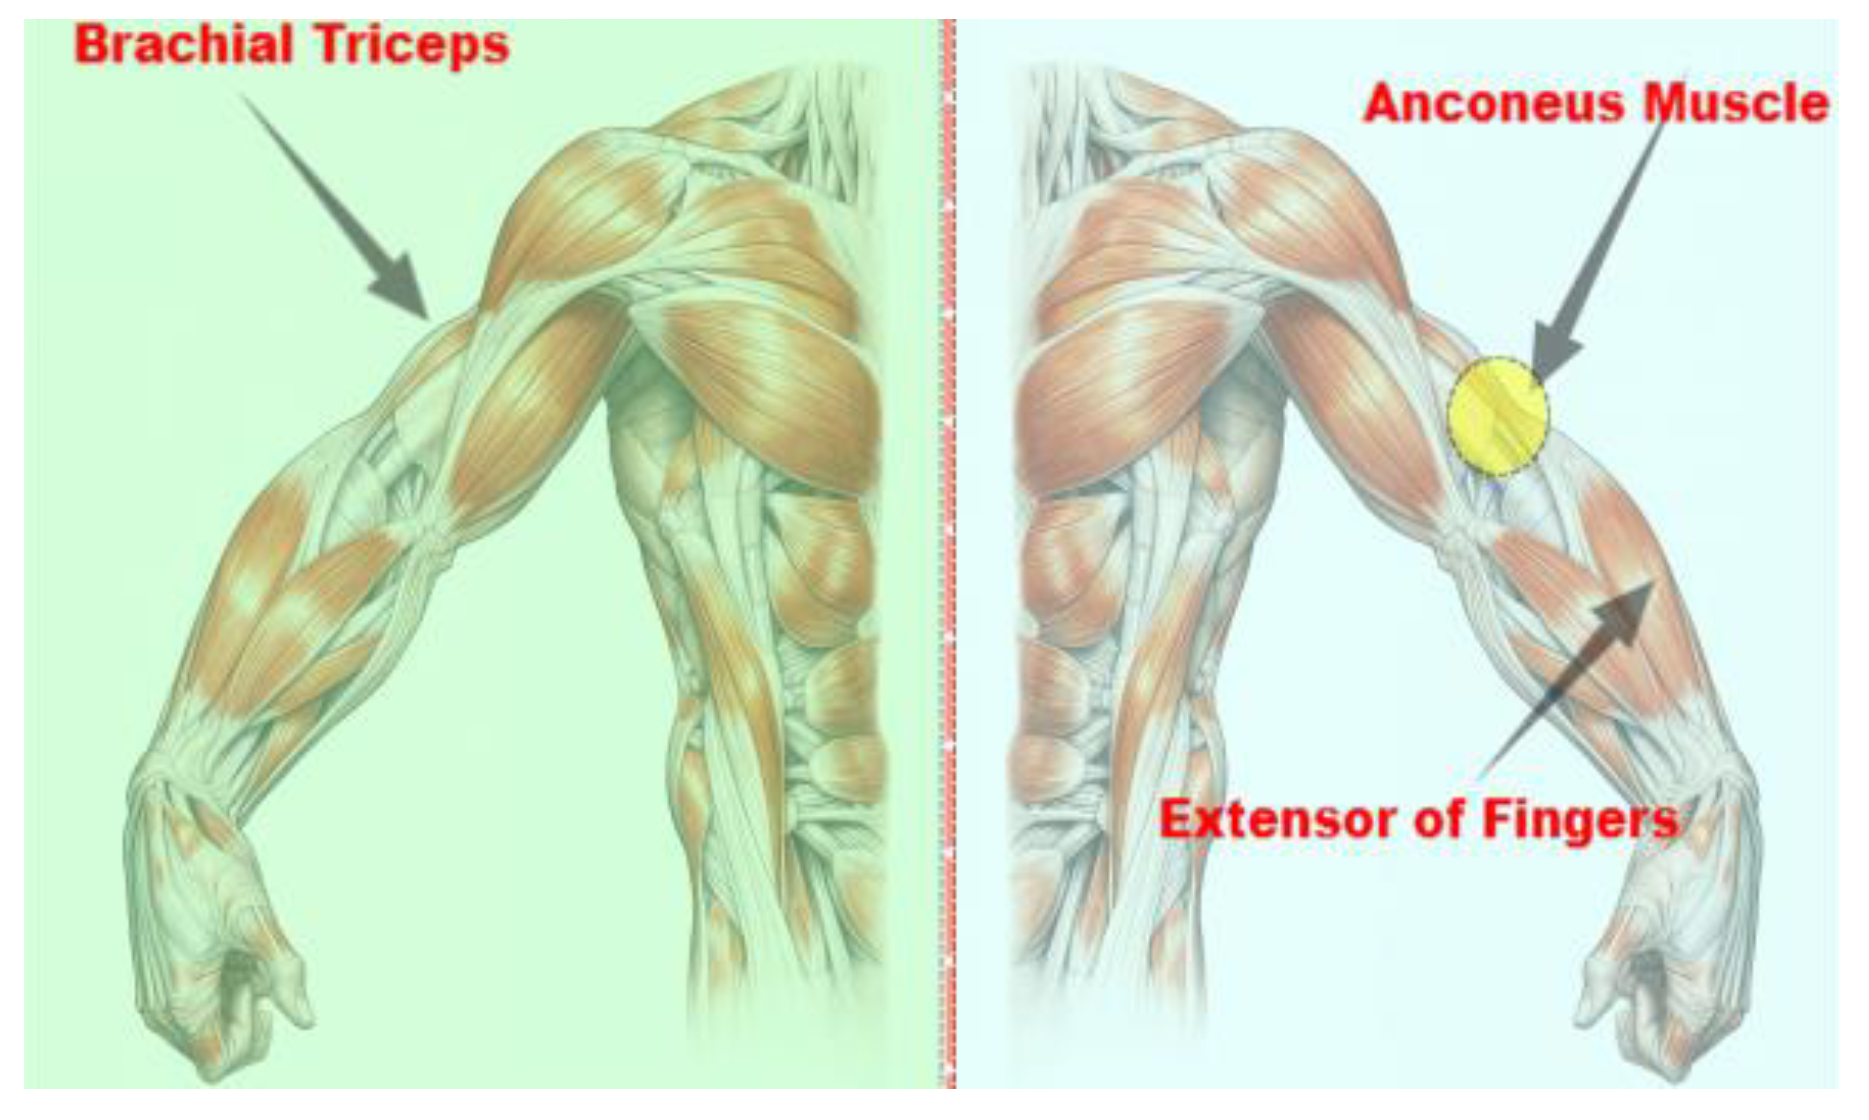
Figure 11.
Zoning, (a) Position A; (b) Position B.
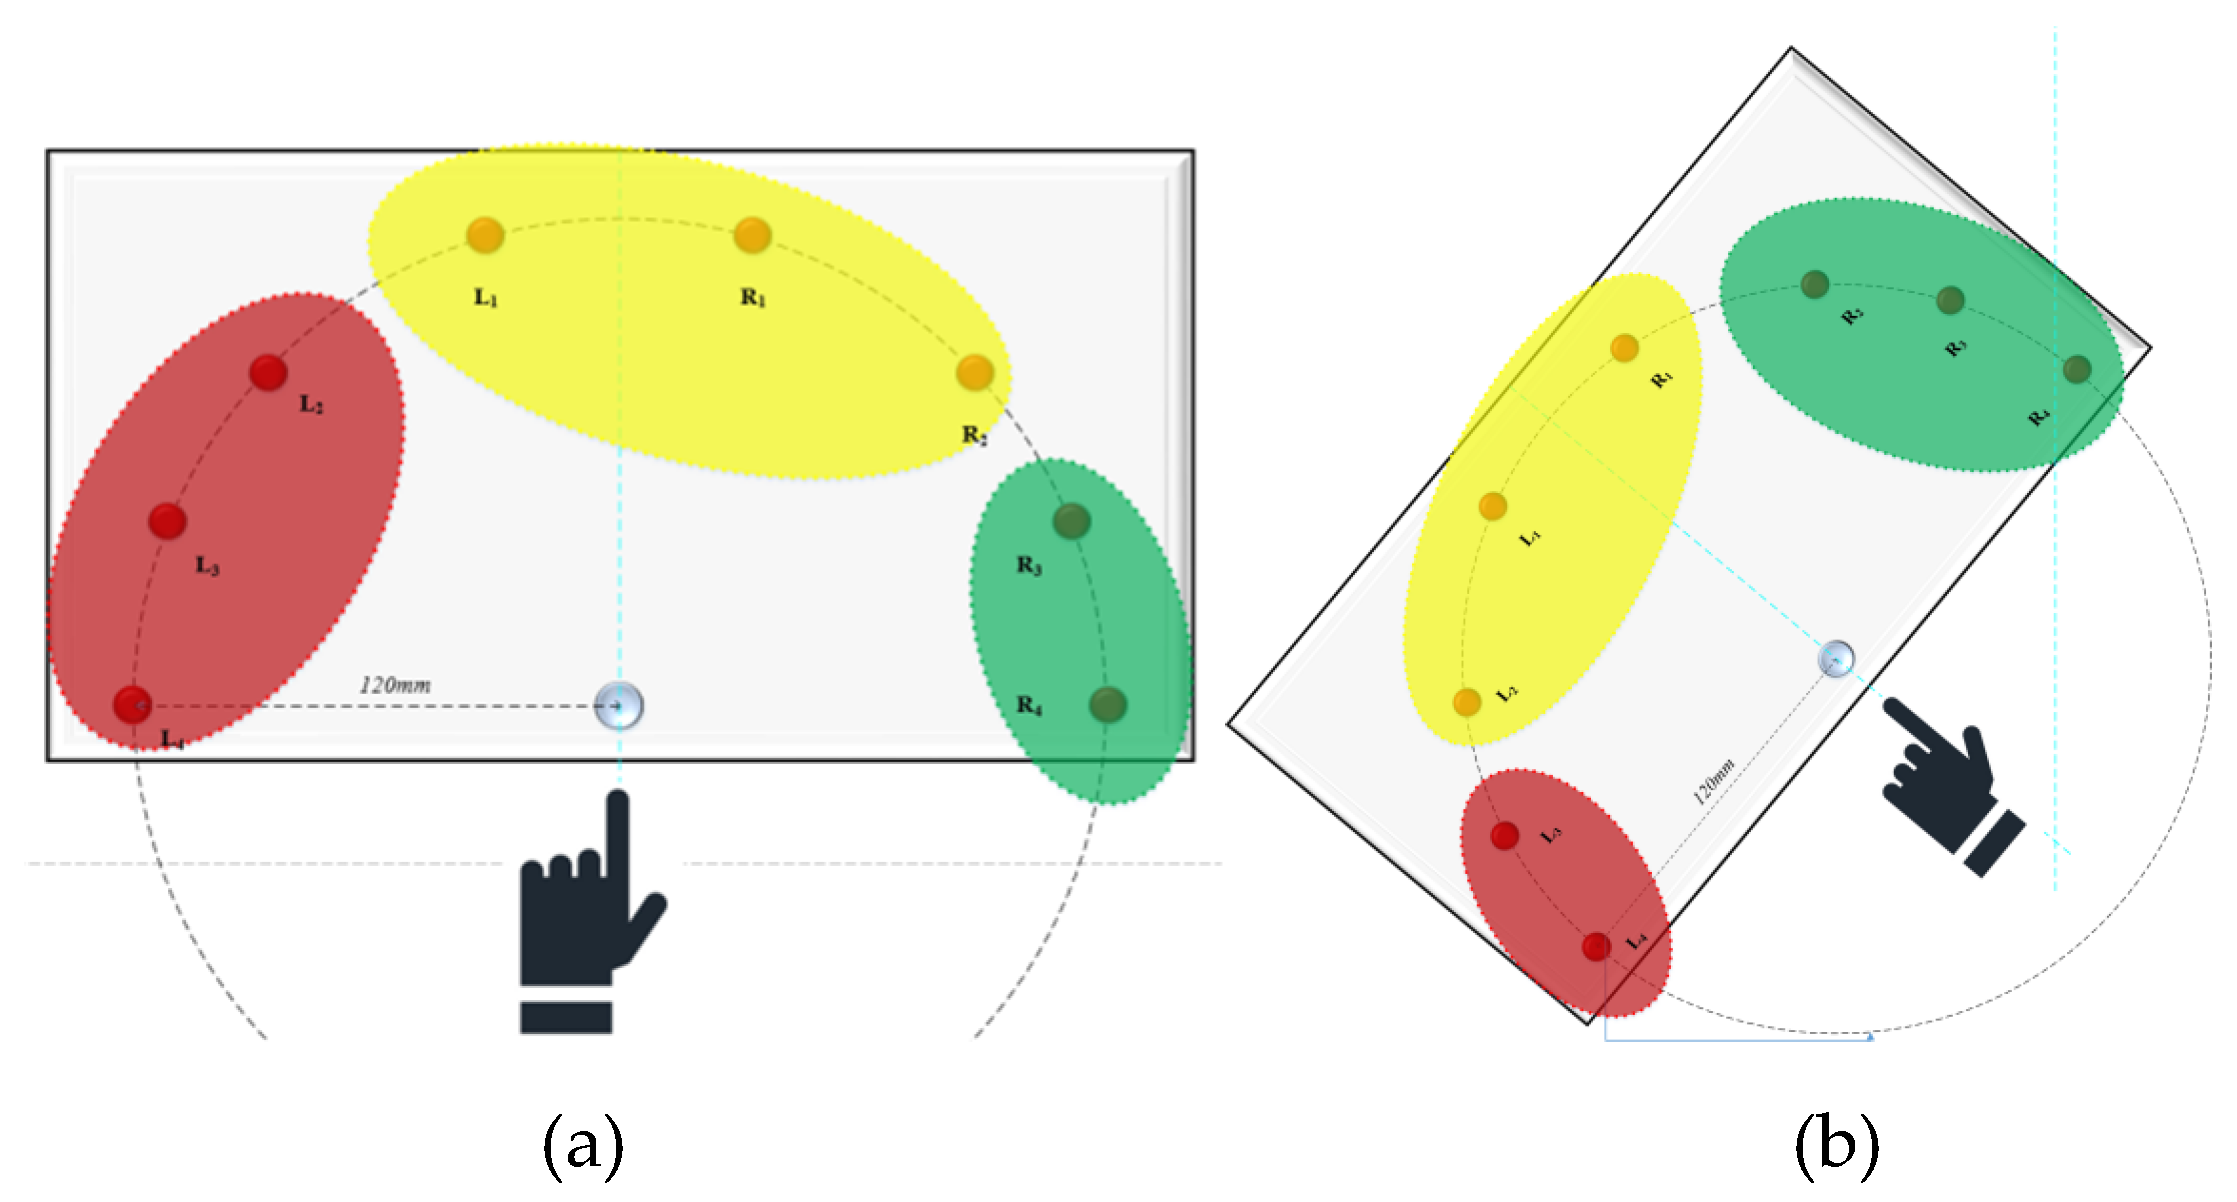
Figure 12.
A ladder diagram of each α orientation, (a) A-R; (b) B-R; (c) A-L; (d) B-L.
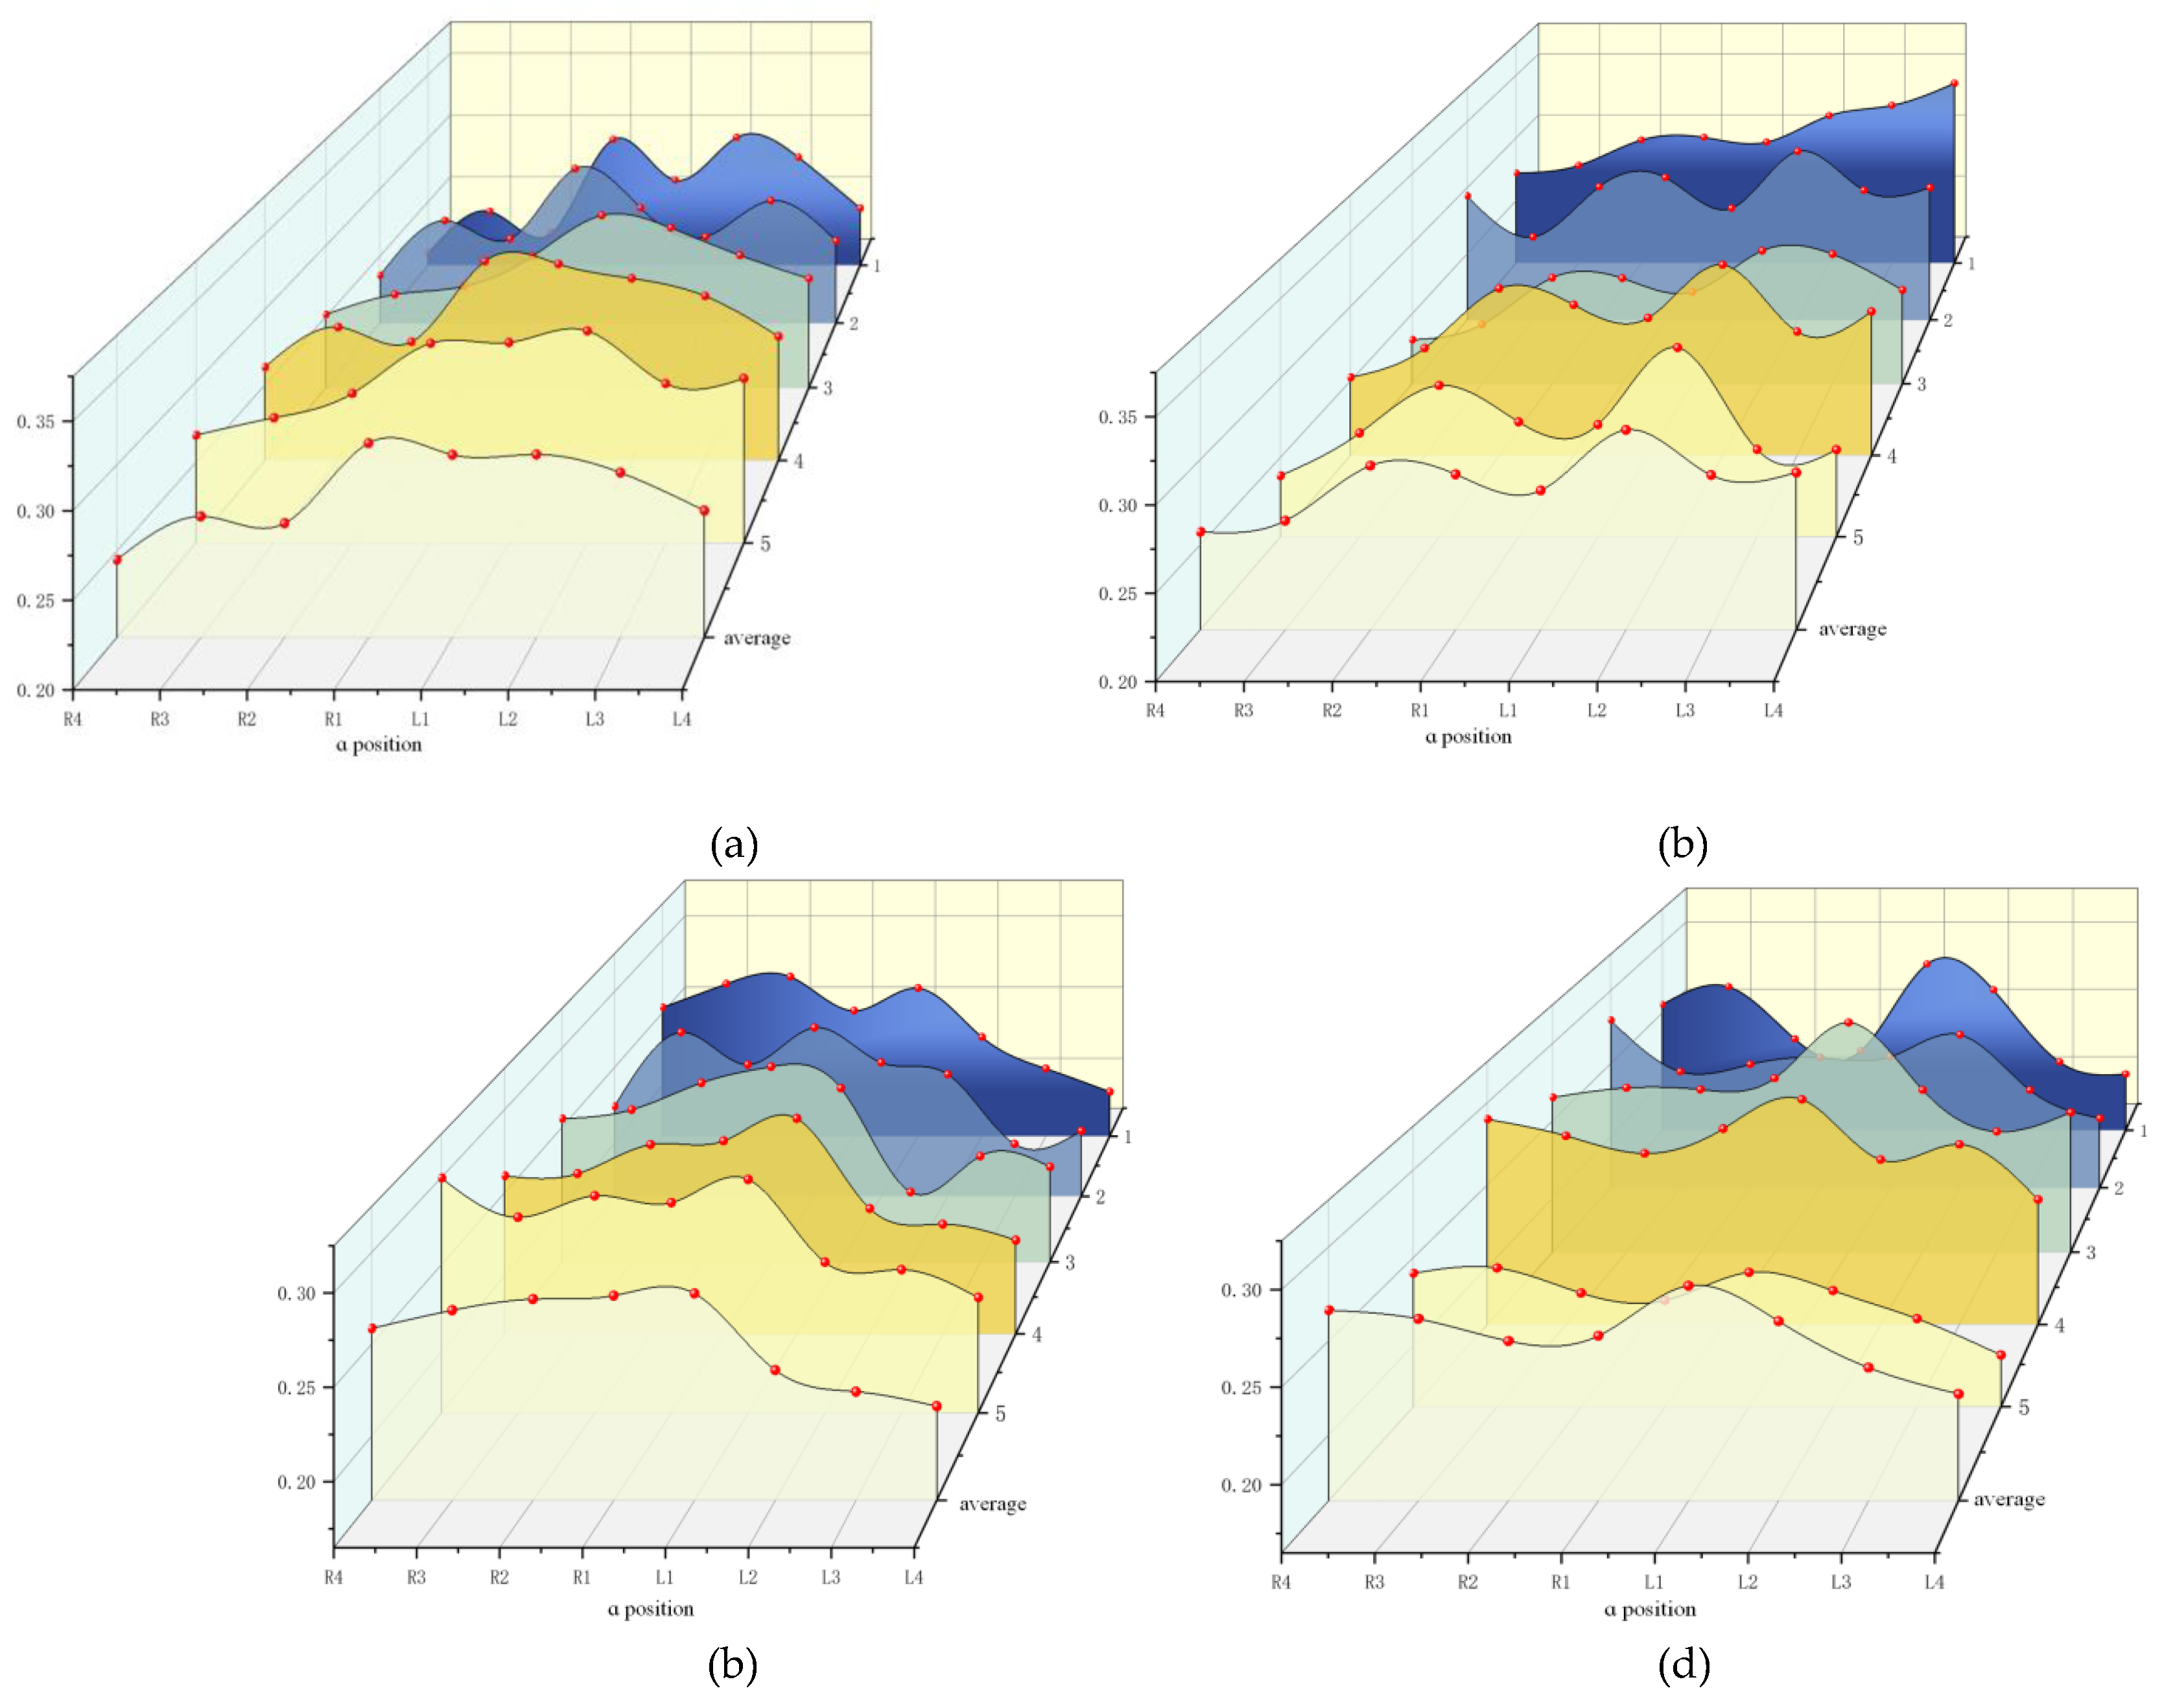
Figure 13.
Operating stand in the cockpit.
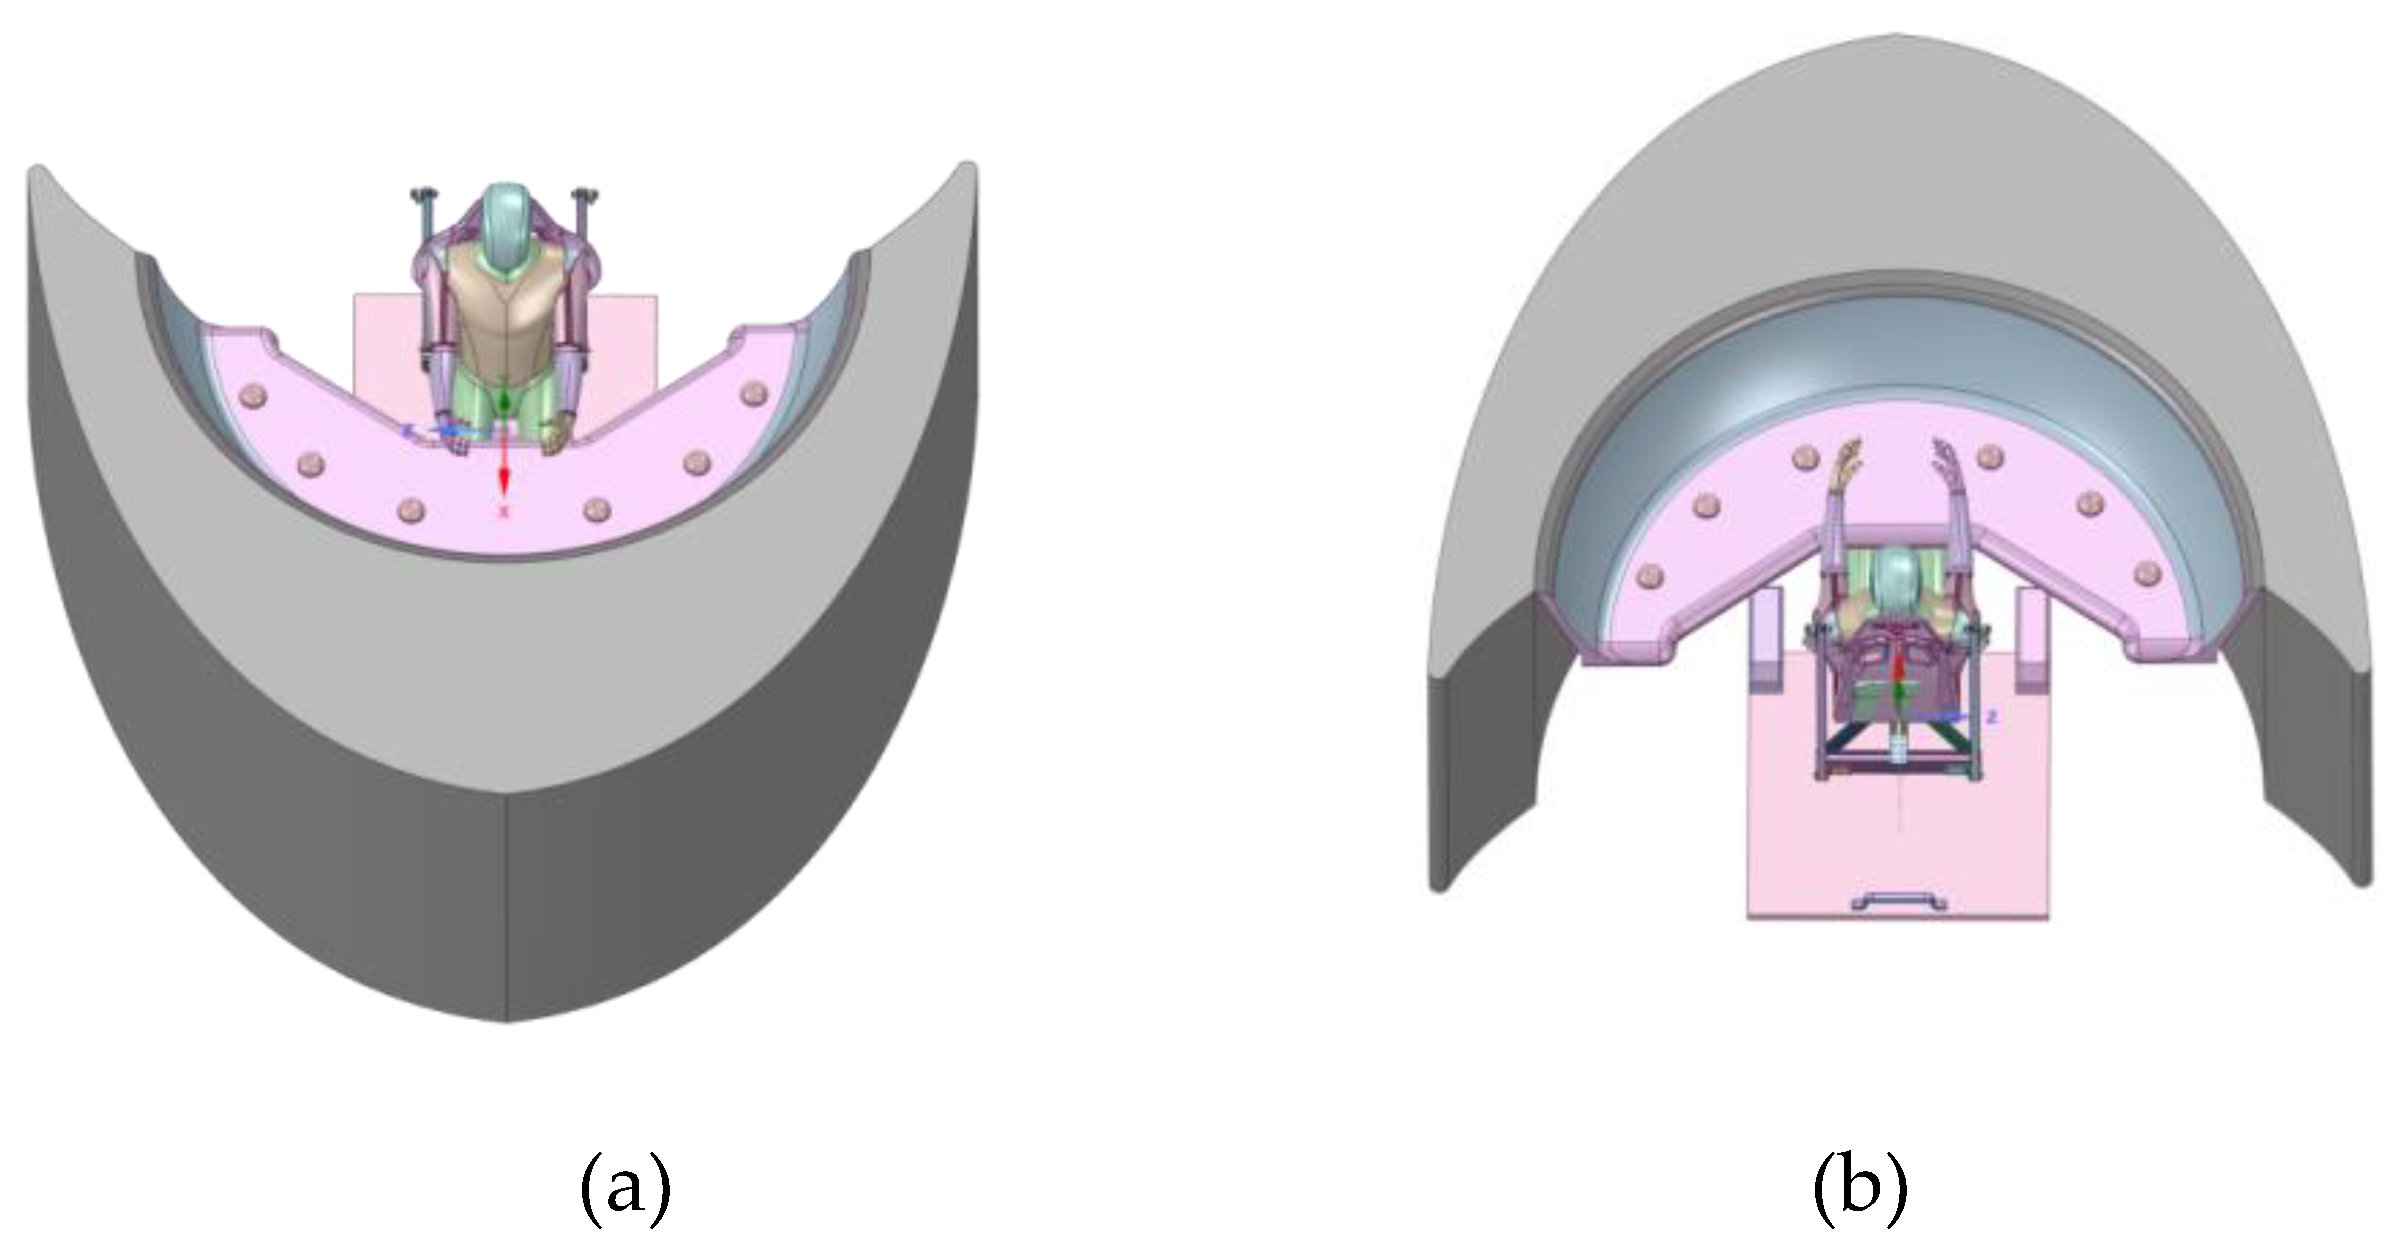
Figure 14.
A selection model for impermissible regions; (a) Left-handed selection model; (b)Right-handed selection model; (c) Legend.
Figure 14.
A selection model for impermissible regions; (a) Left-handed selection model; (b)Right-handed selection model; (c) Legend.

Table 1.
Safety cognition.
| Left-handers/Persons | Right-handers/Persons | |||||
| (A)yes | (B)no | score | (A)yes | (B)no | score | |
| Whether to pay attention to their own safety | 18 | 1 | 0.947 | 19 | 0 | 1.000 |
| Whether to pay attention to safe operation | 17 | 2 | 0.895 | 17 | 2 | 0.895 |
| Whether there has been any intentional unsafe behavior | 3 | 16 | 0.842 | 2 | 17 | 0.895 |
| Whether something will still be implemented when it may affect the safety of others | 0 | 19 | 1.000 | 1 | 18 | 0.947 |
| Whether they will take the initiative to ensure the safety of others | 16 | 3 | 0.842 | 17 | 2 | 0.895 |
| Will actively participate in learning safety knowledge (which may focus on their own safety and others) | 16 | 3 | 0.842 | 15 | 4 | 0.789 |
| Average score | 0.895 | 0.903 | ||||
Table 2.
Classification of influencing factors.
| Type 1 | Type 2 | Representative factors | Explain |
| Interference factor | Common factors | Degree of muscle development in the four limbs | Currently, these factors have not been found to have a connection with handedness, and they are necessary aspects of human biology. Differences in handedness do not affect their existence. |
| Degree of freedom of the bone-joint | |||
| Variable factor | Finger flexibility | The so-called variable factor refers to the existence of a factor that interferes with the correct judgment of the relationship between handedness and operational safety when it is used as a factor for evaluating the correlation between handedness and operational safety. The difference between it and the common factor is that it may not be mastered by every tester or there may be significant differences between testers. Due to the uncertainty of variable factors, it is impossible to completely eliminate them. Therefore, we only exclude the main influencing factors for the kinematic tasks required to be completed in this study. |
|
| Body size (height, weight) | |||
| People’s sleep quality | |||
| Concentration | |||
| Human sitting posture | |||
| Arm initial trend status | |||
| Palm-key position relationship | |||
| Equipment layout | |||
| Size and color of the keys | |||
| External environment | |||
| Measuring factors | Sex | By taking the measuring factors as control variables, we can reflect the differences in emergency operation safety between left-handers and right-handers in various aspects. | |
| Hand direction α | |||
| Arm extension direction β |
Table 3.
Left-handers score status.
| Number | Sex | Basic item | …1 | Item 5 | … | Subdivision | TP |
| 01 | Woman | 1 | … | 1 | … | 0 | 30 |
| 02 | Woman | 1 | … | 1 | … | -1 | 36 |
| … | … | … | … | … | … | … | … |
| 36 | Woman | 1 | … | 7 | … | -1 | 66 |
| 37 | Man | 1 | … | 7 | … | 0 | 66 |
| Average | 1 | … | 4.89 | … | -0.53 | 46.65 | |
1 Please contact the Corresponding Author for specific data, and the following table is the same.
Table 4.
Right-handers score status. .
| Number | Sex | Basic item | … | Item 5 | … | Subdivision | TP |
| 01 | Man | 1 | … | 4 | … | 0 | 30 |
| 02 | Woman | 1 | … | 4 | … | 0 | 33 |
| … | … | … | … | … | … | … | … |
| 38 | Man | 1 | … | 7 | … | 0 | 62 |
| 39 | Man | 1 | … | 10 | … | 0 | 65 |
| Average | 1 | … | 6.18 | … | -0.23 | 48.7 | |
Table 5.
Performance of the left-handers in Experiment 2.
| number | Position | group countxi | general RT/s | average RT/s | Average RT on one side/s | general ET/s | average ET/s | Average ET on one side/s | Error numbern |
|---|---|---|---|---|---|---|---|---|---|
| 1(woman) | A | 1 | 2.511 | 0.251 | 0.2585 | 3.032 | 0.303 | 0.2975 | 0 |
| 2 | 2.669 | 0.266 | 2.929 | 0.292 | 0 | ||||
| B | 1 | 2.492 | 0.249 | 0.251 | 3.210 | 0.320 | 0.3185 | 0 | |
| 2 | 2.536 | 0.253 | 3.169 | 0.316 | 0 | ||||
| … | … | … | … | … | … | … | … | … | … |
| 37(man) | A | 1 | 2.387 | 0.238 | 0.245 | 2.021 | 0.202 | 0.208 | 0 |
| 2 | 2.523 | 0.252 | 2.147 | 0.214 | 0 | ||||
| B | 1 | 2.314 | 0.231 | 0.234 | 1.937 | 0.193 | 0.197 | 0 | |
| 2 | 2.376 | 0.237 | 2.013 | 0.201 | 0 | ||||
| A | 0.26905 | 0.26226 | Total 14 | ||||||
| B | 0.26984 | 0.25726 | |||||||
| average | 0.26944 | 0.25976 | |||||||
Table 6.
Performance of the right-handed individuals in Experiment 2.
| number | Positio n | group countxi | general RT/s | average RT/s | Average RT on one side/s | general ET/s | average ET/s | Average ET on one side/s | Error numbern |
| 1(woman) | A | 1 | 3.168 | 0.316 | 0.294 | 3.391 | 0.339 | 0.328 | 0 |
| 2 | 2.722 | 0.272 | 3.179 | 0.317 | 0 | ||||
| B | 1 | 2.713 | 0.271 | 0.2755 | 3.279 | 0.327 | 0.328 | 0 | |
| 2 | 2.801 | 0.280 | 3.295 | 0.329 | 0 | ||||
| … | … | … | … | … | … | … | … | … | … |
| 39(man) | A | 1 | 2.887 | 0.288 | 0.285 | 2.603 | 0.260 | 0.252 | 0 |
| 2 | 2.826 | 0.282 | 2.443 | 0.244 | 0 | ||||
| B | 1 | 2.719 | 0.271 | 0.275 | 2.334 | 0.233 | 0.236 | 0 | |
| 2 | 2.794 | 0.279 | 2.395 | 0.239 | 0 | ||||
| A | 0.28178 | 0.289 | Total 24 | ||||||
| B | 0.27995 | 0.28726 | |||||||
| average | 0.28067 | 0.28813 | |||||||
Table 7.
Left-handed score versus test time.
| Number | Sex | TP | RT | Position RT | ET | Position ET | Error number n |
| 01 | Woman | 30 | 0.255 | 0.2585 | 0.308 | 0.2975 | 0 |
| 0.251 | 0.3185 | ||||||
| 02 | Woman | 36 | 0.268 | 0.265 | 0.2985 | 0.296 | 0 |
| 0.271 | 0.301 | ||||||
| … | … | … | … | … | … | … | … |
| 36 | Woman | 66 | 0.2365 | 0.232 | 0.2305 | 0.232 | 1 |
| 0.241 | 0.229 | ||||||
| 37 | Man | 66 | 0.2385 | 0.245 | 0.2025 | 0.208 | 0 |
| 0.234 | 0.197 | ||||||
| Average | 46.65 | 0.26944 | 0.25976 | 14 | |||
Table 8.
Right-handed scores versus when tested.
| Number | Sex | TP | RT | Position RT | ET | Position ET | Error number n | ||||
| 01 | Man | 30 | 0.275 | 0.280 | 0.3425 | 0.356 | 0 | ||||
| 0.271 | 0.329 | ||||||||||
| 02 | Woman | 33 | 0.285 | 0.294 | 0.328 | 0.328 | 1 | ||||
| 0.2755 | 0.328 | ||||||||||
| … | … | … | … | … | … | … | … | ||||
| 38 | Man | 62 | 0.2575 | 0.252 | 0.256 | 0.258 | 0 | ||||
| 0.263 | 0.254 | ||||||||||
| 39 | Man | 65 | 0.270 | 0.285 | 0.244 | 0.252 | 0 | ||||
| 0.275 | 0.236 | ||||||||||
| Average | 48.70 | 0.28067 | 0.28813 | 24 | |||||||
Table 9.
Right-handed representation in the case of Position A.
| Irradiation loop α / ° | Number | 01 | … | 05 | Average ET | Error number | Er | Region ET | Error number |
| (25,100) | R2 | 0.2252 | … | 0.2928 | 0.26612 | 3 | 30% | 0.2604 | 4 |
| R3 | 0.2423 | … | 0.2777 | 0.27006 | 1 | 10% | |||
| R4 | 0.2094 | … | 0.2669 | 0.24502 | 0 | ||||
| (-50,25) | R1 | 0.299 | … | 0.3239 | 0.31248 | 0 | 0.30803 | 0 | |
| L1 | 0.267 | … | 0.3244 | 0.3057 | 0 | ||||
| L2 | 0.3006 | … | 0.3316 | 0.30592 | 0 | ||||
| (-100,-50) | L3 | 0.285 | … | 0.2989 | 0.29544 | 1 | 10% | 0.28445 | 1 |
| L4 | 0.2449 | … | 0.3022 | 0.27346 | 0 | ||||
| (-100,100) | Average | 0.2592 | … | 0.3023 | 0.284275 | 5 | 5% | 5 |
Table 10.
Right-handed representation in the case of Position B.
| Irradiation loop α / ° | Number | 01 | … | 05 | Average ET | Error number | Er | Region ET | Error number |
| (50,100) | R3 | 0.2779 | … | 0.2653 | 0.26408 | 1 | 10% | 0.26082 | 2 |
| R4 | 0.2718 | … | 0.2384 | 0.25756 | 1 | 10% | |||
| (-25,50) | R1 | 0.3003 | … | 0.2723 | 0.29136 | 0 | 0.28988 | 1 | |
| R2 | 0.2982 | … | 0.2953 | 0.2964 | 1 | 10% | |||
| L1 | 0.2965 | … | 0.2706 | 0.2819 | 0 | ||||
| (-100,-25) | L2 | 0.3176 | … | 0.3191 | 0.31744 | 2 | 20% | 0.30026 | 3 |
| L3 | 0.3258 | … | 0.255 | 0.29092 | 0 | ||||
| L4 | 0.3435 | … | 0.2549 | 0.29242 | 1 | 10% | |||
| (-100,100) | Average | 0.30395 | … | 0.27136 | 0.28651 | 6 | 6% | 6 |
Table 11.
Left-handed representation in the case of Position A.
| Irradiation loop α / ° | Number | 01 | … | 05 | Average ET | Error number | Er | Region ET | Error number |
| (-100,-25) | L2 | 0.2332 | … | 0.2514 | 0.2359 | 2 | 20% | 0.22545 | 3 |
| L3 | 0.2115 | … | 0.2471 | 0.22418 | 1 | 10% | |||
| L4 | 0.1956 | … | 0.2312 | 0.21628 | 0 | ||||
| (-25,50) | L1 | 0.2668 | … | 0.2988 | 0.2776 | 0 | 0.27619 | 1 | |
| R1 | 0.2513 | … | 0.2855 | 0.27644 | 1 | 10% | |||
| R2 | 0.2747 | … | 0.2894 | 0.27454 | 0 | ||||
| (50,100) | R3 | 0.2698 | … | 0.2771 | 0.26848 | 0 | 0.26353 | 0 | |
| R4 | 0.2536 | … | 0.2996 | 0.25858 | 0 | ||||
| (-100,100) | Average | 0.2446 | … | 0.2725 | 0.254 | 4 | 4% | 4 |
Table 12.
Left-handed representation in the case of Position B.
| Irradiation loop α / ° | Number | 01 | … | 05 | Average ET | Error number | Er | Region ET | Error number |
| (-100,-50) | L3 | 0.2144 | … | 0.2152 | 0.2358 | 0 | 0.22881 | 1 | |
| L4 | 0.2056 | … | 0.1945 | 0.22182 | 1 | 10% | |||
| (-50,25) | L1 | 0.2851 | … | 0.2416 | 0.27932 | 3 | 30% | 0.26418 | 3 |
| L2 | 0.2665 | … | 0.2312 | 0.26052 | 0 | ||||
| R1 | 0.2224 | … | 0.2256 | 0.2527 | 0 | ||||
| (25,100) | R2 | 0.2310 | … | 0.2298 | 0.2499 | 1 | 10% | 0.2593 | 1 |
| R3 | 0.2687 | … | 0.2441 | 0.26166 | 0 | ||||
| R4 | 0.2559 | … | 0.2411 | 0.26634 | 0 | ||||
| (-100,100) | Average | 0.2437 | … | 0.2279 | 0.2535 | 5 | 5% | 5 |
Disclaimer/Publisher’s Note: The statements, opinions and data contained in all publications are solely those of the individual author(s) and contributor(s) and not of MDPI and/or the editor(s). MDPI and/or the editor(s) disclaim responsibility for any injury to people or property resulting from any ideas, methods, instructions or products referred to in the content. |
© 2025 by the authors. Licensee MDPI, Basel, Switzerland. This article is an open access article distributed under the terms and conditions of the Creative Commons Attribution (CC BY) license (https://creativecommons.org/licenses/by/4.0/).
Copyright: This open access article is published under a Creative Commons CC BY 4.0 license, which permit the free download, distribution, and reuse, provided that the author and preprint are cited in any reuse.


