
Submitted:
14 July 2025
Posted:
16 July 2025
You are already at the latest version
Abstract
Diet and gut microbiota are key determinants of host health, but their interaction in Blastocystis-colonised individuals remains poorly understood. We evaluated the rela-tionship between diet quality, faecal microbial diversity, and Blastocystis colonisation in two cohorts: university students (FACSA) and institutionalised children with their caregivers (PAVILA), all Blastocystis-positive subjects. We assessed diet quality using the Healthy Eating Index-2020 (HEI-2020), and we characterised faecal microbiota by 16S rRNA sequencing. Alpha and beta diversity were analysed, and genus-level trans-formed data were further evaluated using PERMANOVA, PCoA, and db-RDA.
The FACSA cohort presented higher microbial richness and diversity (Shannon and Simpson indexes) than PAVILA (p < 0.01), and microbial composition differed signifi-cantly between cohorts (PERMANOVA R² = 0.39, p = 0.002). Total diet quality was as-sociated with microbial structure (R² = 0.26, p = 0.016), with protein (R² = 0.23, p = 0.017) and vegetable (R² = 0.17, p = 0.044) components being the main contributors. Multivariate analysis showed higher protein and vegetable intakes were associated with genera such as Sellimonas, Murimonas, Alistipes and Desulfovibrio (FACSA group). In contrast, Hydrogenoanaerobacterium, V9D2013_group and Haemophilus were related to lower-quality diets (PAVILA group). Despite universal colonisation by Blastocystis, differences in microbial diversity and structure reflect a modulating effect of diet con-ditioned by the sociodemographic environment. These findings suggest the relevance of dietary quality as a modulator of the gut microbiota in populations colonised by Blastocystis and may guide future nutritional interventions in vulnerable groups.
Keywords:
Diet
; Microbiota
; Blastocystis
; Cohorts
; 16S rRNA
1. Introduction
The human gastrointestinal tract is inhabited by diverse and dynamic microbial ecosystem [1,2] that greatly contributes to metabolic homeostasis [3], immune modulation [4], and the general wellbeing [5]. Imbalances of this community, called dysbiosis [6], is associated with several diseases such as inflammatory bowel disease [7], obesity, [8,9] and infections [10]. Among the gut inhabitants, the protozoan parasite Blastocystis has recently drawn attention, due to its global distribution and the ongoing debate over its role in health and disease [11]. Blastocystis, one of the most common eukaryotic microorganisms that colonise the human gut, is highly prevalent, from 10-100%, depending on the population and the diagnostic methods used [12,13,14,15,16]. The clinical significance of Blastocystis spp. remains controversial, as several studies have reported a higher prevalence in healthy individuals who typically exhibit greater bacterial richness and diversity in their gut microbiota [17]. This has led to suggestions that Blastocystis may be a component of a healthy gut microbiota. However, associations have also been reported between Blastocystis and symptoms such as diarrhoea, abdominal pain, and bloating [18]. In addition, some studies have linked its presence to irritable bowel syndrome, intestinal dysbiosis, diabetes, obesity, and depression [19]. The clinical interpretation of Blastocystis spp. remains uncertain, mainly due to the wide variety of subtypes that exist [15]. Despite its common prevalence, the role of this protozoan in the disease is a matter of debate.
In contrast, the association between Blastocystis and the gut microbiota remains complex and variable [20]. Blastocystis colonisation influences bacterial diversity and the composition of dominant phyla, such as Firmicutes and Bacteroidetes [21]. The bacterial diversity of the intestine increases with the colonisation of Blastocystis. A study conducted in a rural population in Colombia reported that individuals colonised by Blastocystis had a higher abundance of beneficial bacterial genera, such as Faecalibacterium, Alistipes, and Prevotella, compared to non-colonised individuals. Depending on the intensity of Blastocystis colonisation, distinct microbial profiles are also identified [22]. These connections are known to vary among different groups. Moreover, factors linked to hosts, such as geographical location, age, and dietary habits, are believed to influence the relationship between Blastocystis and the gut microbiota. A study of Colombian children found no significant differences in bacterial composition between individuals colonised and non-colonised by Blastocystis, although colonised children exhibited greater microbial richness [23].
Diet has a significant role in shaping the structure and function of the gut microbiota [24,25]. High-fibre, predominantly plant-based diets are associated with greater microbial diversity and a greater abundance of beneficial short-chain fatty acid (SCFA)-producing bacteria, such as Faecalibacterium and Roseburia. These bacteria play a crucial role in mitigating intestinal inflammation. Plant-based dietary patterns contribute to the balance of the gut microbiota and help reducing systemic inflammation [26]. An intervention study demonstrated that the consumption of high-fibre or fermented foods modulates the gut microbiota and enhances immune function in healthy adults, highlighting the role of diet in beneficially modifying microbiome composition [25].In contrast, Western diets characterised by high consumption of saturated fats, refined sugars, and ultra-processed foods have an impact on lower microbial diversity and an increase in pro-inflammatory bacterial taxa. Such diets may promote intestinal dysbiosis and increased gut permeability, thus contributing to chronic low-grade inflammation [3]. Recent studies suggest that they could also influence Blastocystis colonisation [22].
In children living in institutional settings or from low socioeconomic backgrounds, the interaction between diet, gut microbiota, and protozoa, such as Blastocystis, highlights the need to study this interaction. These children often face heightened risks due to inadequate nutrition and limited access to healthcare services, factors that can affect gut health and microbial resilience. Socioeconomic status (SES) is a key determinant of gut microbiota composition in children. Children from low socioeconomic backgrounds often exhibit distinct microbial profiles compared to those from higher socioeconomic backgrounds. A study conducted in Indonesia revealed that children from low-SES had higher abundances of Prevotella and Escherichia-Shigella. In contrast, individuals from high-SES showed increased levels of Bifidobacterium and Lactobacillus [27]. Malnutrition poses a significant challenge to children's health, particularly in low-income regions. A poor diet may alter the gut microbiota, reducing its diversity and promoting the growth of pathogenic bacteria [28]. Parasitosis is characterised by chronic intestinal inflammation and increased permeability, resulting from repeated exposure to enteric pathogens and poor sanitation, which leads to nutrient malabsorption and impaired child growth [29,30]. In this context, Blastocystis colonisation is notably prevalent among children with malnutrition in resource-limited settings [31]. Based on these observations, the present study aimed to investigate the relationship between Blastocystis colonisation and gut microbiota composition in individuals from two cohorts with different dietary patterns.
2. Materials and Methods
2.1. Study Population and Design
This cross-sectional study analysed two cohorts: (a) the FACSA cohort, consisting of university students (n = 46) from the Faculty of Health Sciences, and (b) the PAVILA cohort (n = 37), composed of children living in a group home and their adult caregivers. Participants were recruited voluntarily and provided informed consent in accordance with institutional ethical standards. Demographic information, including age, sex, and anthropometric measurements, was collected. Diet quality was assessed using a validated food frequency questionnaire.
For the gut microbiota analysis, a subset of 14 individuals colonised by Blastocystis was selected, including eight from the FACSA cohort and six from the PAVILA cohort. Two samples from the PAVILA cohort were excluded due to poor DNA integrity, which prevented successful sequencing. This analysis aimed to evaluate whether diet quality influences gut microbiota composition across different host environments, with a particular focus on individuals colonised by Blastocystis.
2.2. Dietary Assessment
A validated Food Frequency Questionnaire (FFQ) developed by Macedo et al. in 2013 was used [32] to evaluate diet quality. Nutritionists administered the FFQ to participants via Google Docs. Reported food group portions were converted into grams per day and analysed for energy and macronutrients using the Evalfinut 2.0 software (Ibero-American Nutrition Foundation, FINUT). This program assesses individual dietary intake based on food frequency and nutrient composition according to the Spanish Food Composition Database (BEDCA 2.0) [32] and the USDA National Nutrient Database for Standard Reference (Version 28) [33].
The Healthy Eating Index (HEI-2020) was calculated for each participant to assess their diet quality [34]. The International Physical Activity Questionnaire (IPAQ) was used to evaluate Physical activity, classifying individuals into low, moderate, or high activity levels based on self-reported time spent in vigorous and moderate activity, walking, and sedentary time. Physical activity levels were expressed in MET minutes per week, in accordance with standard IPAQ scoring protocols [35].
2.3. Sample Collection and DNA Extraction
Stool samples were collected from participants in sterile 2 mL vials and stored at −80 °C until processing. Total bacterial genomic DNA was extracted from 200 mg of stool using the E.Z.N.A.® Stool DNA Kit (OMEGA Bio-Tek, Inc.), following the manufacturer’s instructions. DNA integrity was assessed by 1.5% agarose gel electrophoresis, and DNA concentration was measured using a NanoDrop One spectrophotometer.
2.4. Gut Microbiota Profiling
Microbiota profiles were analysed in fourteen faecal DNA samples from Blastocystis-colonised subjects: eight from the FACSA cohort and six from the PAVILA cohort. Two samples of the PAVILA cohort were excluded due to low DNA quality. For each sample, the V3 hypervariable region of the 16S rRNA gene was amplified using primers containing Illumina overlap adapters (forward: 5′-TCGTCGGCAGCGTCAGATGTGTATAAGAGACAGACYCCTACGGGRGGCAGCAG-3′ and reverse: 5′-GTCTCGTGGGCTCGGAGATGTGTATAAGAGACAGTTACCGCGGCTGCTGGCAC-3′). Amplicons were purifed with AMPure XP beads and subsequently index using the Nextera XT v2 kit to add dual indices. DNA concentrations were quantified using a Qubit 3.0 fluorometer. Libraries were then normalised and pooled in equimolar amounts, followed by sequencing on the Illumina MiSeq platform using the MiSeq Reagent Kit V2 (500 cycles) to generate 250 bp paired-end reads [36].
2.5. Bioinformatic Processing
Initial quality control of raw reads was performed using FastQC. Forward and reverse reads were trimmed to 240 base pairs based on quality scores. The trimmed reads were then merged and denoised using the DADA2 plugin in QIIME2, enabling the generation of high-resolution amplicon sequence variants (ASVs). Taxonomic assignment was conducted using a closed-reference approach with the SILVA reference database (99% similarity threshold). Chimeric sequences were removed using the VSEARCH plugin. Taxonomic classification was carried out with a Naive Bayes classifier trained on SILVA sequences. Phylogenetic reconstruction involved multiple sequence alignment with MAFFT and tree construction using FastTree through the q2-phylogeny module. Alpha diversity was assessed using the Shannon and Simpson indices, while beta diversity was calculated using Bray–Curtis distances.
2.6. Detection of Blastocystis
The presence of Blastocystis DNA from faecal DNA extracts was determined using a real-time PCR assay with a specific probe. The primers used were F1: GGTCCGGTGAACACTTTGGATTT and R1: CCTACGGAAACCTTGTTAC-GACTTCA, with the probe FAM-TCGTGTAAATCTTACCATTTAGAGGA-MGBNFQ (Integrated DNA Technologies, IDT). Reactions were performed in a RotorGene® thermal cycler (Qiagen) using the QuantiNova Probe RT-PCR kit in 10 µL volumes containing 5 µL of 2× master mix, 0.1 µL of RT mix, 0.5 µL of primer and probe mix, 3.5 µL of RNase/DNase-free water, and 1 µL of DNA (40 ng). Thermal cycling conditions followed the manufacturer's protocol: 95°C for 5 minutes, followed by 40 cycles of 95°C for 5 seconds and 60°C for 30 seconds [37].
2.7. Statistical Analysis
Dietary characteristics between the FACSA and PAVILA cohorts were compared using the HEI-2020 Healthy Eating Index, considering both the total score and the scores of its 13 individual components. Quantitative variables were summarised as means ± standard deviations or medians with interquartile ranges, depending on the distribution of the data. Normality was assessed using the Shapiro–Wilk test. Based on data distribution, comparisons between cohorts were conducted using either the Student’s t-test or the Mann–Whitney U test. Statistical significance was set at p < 0.05, and p-values were adjusted for multiple comparisons using the Benjamini–Hochberg method. For microbiota data, alpha diversity analysis was conducted on genus-level abundance data transformed using the Hellinger transformation. The Shannon and Simpson indices were calculated to evaluate community richness and evenness. Beta diversity was assessed using Bray–Curtis distances, also based on Hellinger-transformed data. PERMANOVA (Permutational Multivariate Analysis of Variance) was used to test whether overall gut microbiota composition differed significantly according to the total HEI-2020 score and its individual components. Additionally, distance-based Redundancy Analysis (db-RDA) was performed to visualise associations between dietary variables and microbial community variation, with particular emphasis on key components such as vegetable and protein intake. The ten taxa most strongly associated with the ordination axes (p < 0.1) were highlighted graphically. All statistical and graphical analyses were performed using R (version 4.4.3).
2.8. Ethical Considerations
The Research Ethics Committee of the Faculty of Medicine and Nutrition at Juárez University of Durango, under registration number CEI-FAMEN-36, approved the study. All procedures were carried out according to the ethical principles outlined in the Declaration of Helsinki and compliance with current national regulations governing research involving human subjects.
Adult participants written informed consent prior to inclusion in the study. The legal representatives of the children in the PAVILA cohort signed the consent letters, as well as assent from minors, considering their age and level of understanding. The confidentiality of personal data was ensured through the code and the secure storage of biological samples. Participation was voluntary and posed no physical or psychological risks to the subjects.
3. Results
3.1. Dietary Quality and Blastocystis Status by Cohort
We first compared HEI-2020 dietary component scores between individuals with Blastocystis-colonisation within each cohort. In the FACSA cohort, colonised participants exhibited higher total HEI-2020 scores, with a tendency toward greater intake of fruits and vegetables (Table 1). In contrast, in the PAVILA cohort, colonised children showed significantly lower vegetable intake compared to non-colonised peers (adjusted p = 0.018, Table 2).
3.2. Alpha Diversity Analysis Between FACSA and PAVILA Cohorts
To characterise the gut microbiota structure in participants from the two cohorts, FACSA (university students) and PAVILA (children and caregivers in a shelter), we evaluated three alpha diversity metrics: observed richness (number of genera), Shannon diversity index, and Simpson diversity index.
Our results showed that the FACSA cohort exhibited significantly greater richness and diversity than the PAVILA cohort. Specifically, the observed number was higher in the FACSA group (p = 0.0024), as was the Shannon index (p = 0.0013), suggesting a more diverse and evenly distributed gut microbial community. The Simpson index was also significantly different between cohorts (p = 0.0013), further supporting the presence of compositional differences in microbial communities (Figure 1).
3.3. Beta Diversity Analysis
Figure 2 illustrates a clear separation in microbiota composition between the FACSA and PAVILA cohorts along the first two principal coordinates. Each point represents an individual sample, while shaded ellipses denote the 95% confidence interval for each group. The first two principal coordinates analysis (PCoA) axes explained 50.76% and 14.35% of the total variance, respectively. The PERMANOVA test confirmed a significant difference between groups (F = 3.33, R² = 0.217, p = 0.018), supporting the hypothesis that host-related factors contribute to distinct gut microbial community structures.
3.4. PCoA Biplot with Genus-Level Arrows
The PCoA based on Bray–Curtis dissimilarities and Hellinger-transformed genus-level data revealed a clear separation between the two cohorts, despite all individuals being colonised by Blastocystis (Figure 3). Samples from the FACSA cohort, with higher HEI-2020 scores and healthier dietary patterns, clustered predominantly toward the right side of the ordination space. In contrast, individuals from the PAVILA cohort, who had lower overall dietary quality, grouped toward the left. Genus-level vectors overlaid on the biplot illustrate the taxa most strongly associated with this compositional variation. Notably, most genera—including Bacteroides, Odoribacter, Subdoligranulum, Murimonas, Faecalibacterium, and Parabacteroides—were projected toward the FACSA cluster, suggesting an enrichment of these taxa in individuals with better diet quality. Surprisingly, only Segatella was directionally associated with the PAVILA cluster (Figure 3). This pattern suggests that the microbiota of university students (FACSA), despite colonisation by Blastocystis, remains more diverse and enriched in genera typically linked to metabolic health and dietary fiber intake.
These results underscore the modulatory role of diet quality in shaping gut microbial communities, even among Blastocystis-colonised hosts, and highlight the ecological impact of contrasting host environments such as institutionalisation and youth in the PAVILA cohort versus independent adulthood in the FACSA cohort.
3.5. Diet–Microbiota Associations within Colonised Individuals
3.5.1. Beta Diversity and Diet Quality Score in Blastocystis-Colonised Individuals
To evaluate whether diet quality influences overall gut microbial composition in individuals colonised by Blastocystis, we performed a PERMANOVA using Bray-Curtis dissimilarities. We modelled the total HEI-2020 diet quality score as a continuous predictor variable. The PERMANOVA test revealed a statistically significant association between diet quality and microbiota structure (R² = 0.26, F = 4.27, p = 0.016), indicating that dietary quality accounts for approximately 26% of the variance in microbial community composition. Figure 4 illustrates a visible compositional gradient, where individuals with lower diet scores tend to cluster separately from those with higher scores. The first two axes explain 50.76% and 14.35% of the total variance, respectively.
3.5.2. Microbial Composition Projected onto Dietary Quality Gradient
To analyse the relationship between diet quality and gut microbiota composition, PCoA based on Bray–Curtis dissimilarities were performed and coloured by HEI-2020 scores. The first two axes explained 50.76% and 14.35% of the total variance, respectively. A compositional gradient was observed: individuals with lower HEI-2020 scores (blue hues) were positioned mainly on the left side of the ordination space, whereas those with higher scores (red hues) clustered toward the right, both in the upper and lower quadrants.
An envfit projection was used to identify the top 10 genera most associated with this gradient (p < 0.1). Sellimonas and Subdoligranulum were strongly associated with higher HEI-2020 scores. At the same time, Acutalibacter, Phocea, Bilophila, Bacteroides, and [Eubacterium]_siraeum_group also pointed in that direction, suggesting a shared ecological niche among participants with higher-quality diets. In contrast, Segatella was the only genus whose vector aligned with the cluster of individuals with lower HEI-2020 scores, suggesting a potential association with poorer diet quality (Figure 5).
3.5.2. PERMANOVA Results by Dietary Component
We performed PERMANOVA using Bray-Curtis dissimilarities calculated from Hellinger-transformed genus-level microbiota data to assess the influence of each dietary component on microbial community structure. As shown in Table 3, significant associations were observed for the protein intake score (R² = 0.232, p = 0.017) and the vegetable intake score (R² = 0.167, p = 0.044). These findings indicate that these two components of diet quality may be key contributors to the observed variation in gut microbiota composition. The remaining components showed weaker and non-significant relationships with microbial structure.
Table 3. PERMANOVA results evaluate the association between individual dietary components from the Healthy Eating Index-2020 (HEI-2020) and gut microbiota composition based on Bray-Curtis dissimilarities of Hellinger-transformed genus-level data. Statistically significant associations (p < 0.05) were observed between the protein foods score and the total vegetable score, indicating their influence on microbial community structure among individuals colonised by Blastocystis. R² represents the proportion of variance explained by each dietary variable.
3.5.3. db-RDA Analysis: Protein and Vegetable Intake
We conducted distance-based redundancy analysis (db-RDA) using Bray-Curtis dissimilarities of Hellinger-transformed genus-level microbiota data constrained by specific HEI-2020 dietary components.
To analyse the relationship between protein intake and gut microbiota composition in Blastocystis-colonised individuals, a distance-based redundancy analysis (db-RDA) was performed using Bray–Curtis dissimilarities of Hellinger-transformed genus-level data, constrained by the protein foods component of the Healthy Eating Index-2020 (HEI-2020). The first canonical axis (CAP1) explained 100% of the constrained variance, while the first unconstrained axis (MDS1) accounted for 32.45% of the residual variance.
A clear cohort-based separation was observed along CAP1: individuals from the FACSA cohort (orange), characterised by higher protein scores, clustered to the right, while those from the PAVILA cohort (green), characterised by lower protein intake, grouped on the left. Environmental vector fitting (envfit, p < 0.1) identified ten genera strongly associated with the ordination axes. Genera such as Sellimonas, Subdoligranulum, Bacteroides, and Murimonas were aligned with higher protein intake and the FACSA cohort. Conversely, Segatella was the only genus that projected in the direction of lower protein scores, aligning with the PAVILA group. (Figure 6). These findings suggest a diet-driven structuring of the gut microbiota that reflects differences in protein consumption between cohorts.
To explore the influence of vegetable intake on gut microbiota composition in Blastocystis-colonised individuals, a distance-based redundancy analysis (db-RDA) was conducted using Bray–Curtis dissimilarities of Hellinger-transformed genus-level data, constrained by the vegetable component score of the Healthy Eating Index-2020 (HEI-2020). The first constrained axis (CAP1) explained 100% of the variance associated with vegetable intake, while the first unconstrained axis (MDS1) accounted for 36.55% of the residual variance.
A clear separation between cohorts was observed: individuals from the FACSA cohort (orange), characterised by higher vegetable scores, were positioned on the right side of CAP1, whereas those from the PAVILA cohort (green), with lower scores, clustered on the left. The environmental fit analysis (envfit, p < 0.1) identified several genera associated with the CAP1 gradient. Taxa such as Sellimonas, Acutalibacter, Murimonas, and Alistipes were aligned with higher vegetable intake in the FACSA cohort, while Segatella was projected in the direction of lower vegetable intake in the PAVILA group. Figure 7. These findings suggest a compositional shift in the microbiota structure linked to dietary vegetable intake among Blastocystis-positive individuals.
3.5.4. Multivariate analysis of the combined effect of protein and vegetable intake on gut microbiota composition in individuals colonised by Blastocystis
A multivariate model incorporating protein and vegetable dietary scores demonstrated a significant impact on gut microbiota composition (R² = 0.31, F = 2.50, p = 0.025). This result suggests that, in Blastocystis-colonised individuals, specific dietary components collectively contribute to explaining more than 30% of the variability in microbial structure, reinforcing their role as key ecological determinants.

Table 4.
PERMANOVA Model Summary (Protein and Vegetables).
| Term | Df | Sum of Squares | R² | F | p-value |
| Model (Protein + Vegetables) | 2 | 0.66195 | 0.31268 | 2.5021 | 0.025 |
| Residual | 11 | 1.45506 | 0.68732 | ||
| Total | 13 | 2.11701 | 1.0 |
Table 4. Results of the PERMANOVA model assessing the joint effect of protein and vegetable scores on gut microbiota composition in individuals colonised by Blastocystis. For the analysis, we calculate Bray–Curtis distances from Hellinger-transformed data. The model explained 31.3% of the total variation and was statistically significant (p = 0.025, 999 permutations).
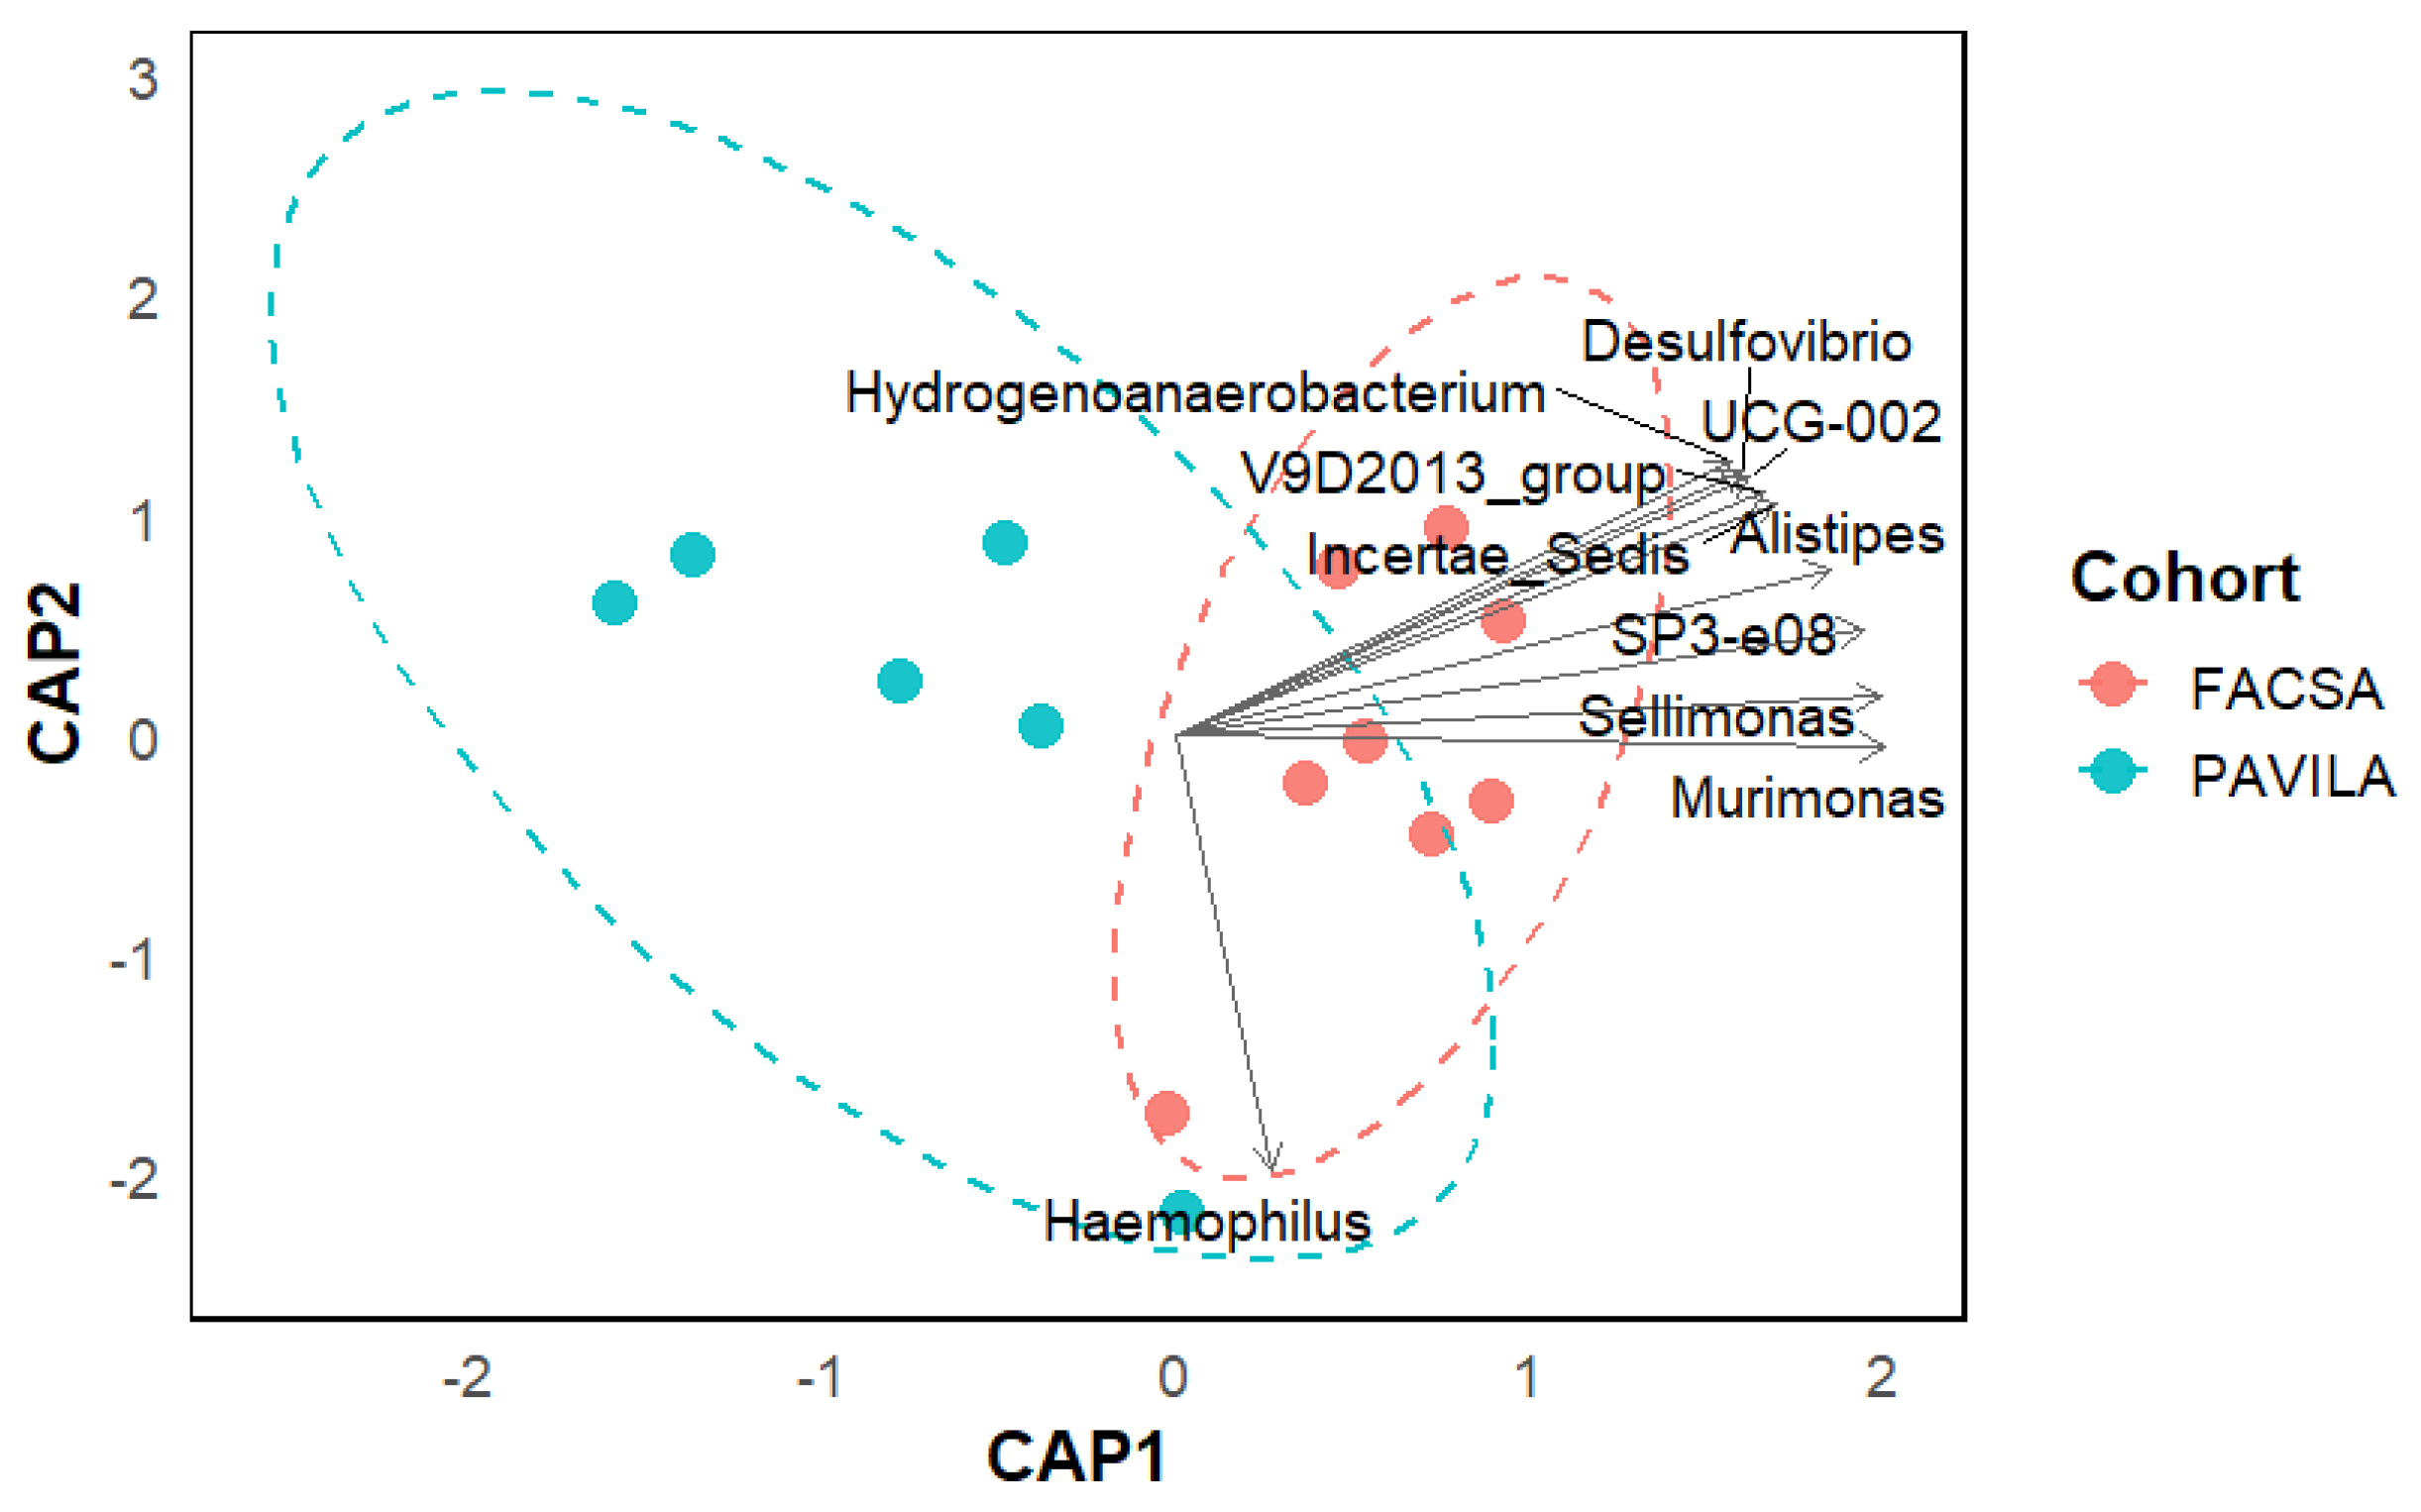
We observed a clear separation between the FACSA and PAVILA cohorts in the db-RDA analysis along the CAP1 axis based on the combined protein and vegetable dietary score. The model was statistically significant (p = 0.025), indicating that these variables explain a important proportion of the variation in the gut microbiota of individuals colonised by Blastocystis. The projected vectors showed that genera such as Sellimonas, Murimonas, Alistipes, and Desulfovibrio were associated with better dietary scores and oriented toward the FACSA cohort. In contrast, genera such as Hydrogenoanaerobacterium, V9D2013_group, and Haemophilus aligned with individuals from the PAVILA cohort, who present lower vegetable and protein intakes. This pattern supports that diet exerts a structuring effect on the microbiota, modulating the microbial community even in the common presence of Blastocystis.
Figure 8.
Distance-based redundancy analysis (db-RDA) using protein and vegetable dietary scores as explanatory variables. We perform The analysis using Bray–Curtis distances of Hellinger-transformed data. The points represent Blastocystis-colonised individuals from the FACSA (red) and PAVILA (blue) cohorts, and the ellipses indicate the 95% confidence intervals of each group. The ten taxa most associated with the canonical axes are included, projected by vectors (envfit, p < 0.1). The separation between cohorts suggests that the combined effect of these dietary components differentially modulates gut microbial composition depending on the host context.
4. Discussion
In this study, we examined dietary modulation of gut microbiota composition in Blastocystis-colonised individuals from two distinct cohorts: university students (FACSA) and institutionalised children/caregivers (PAVILA). Our results highlight how ecological context and diet may shape microbial patterns.
Diet quality and cohort differences
Diet quality, as quantified by HEI-2020 scores, differed significantly between the two cohorts, with FACSA participants demonstrating higher overall diet quality. FACSA participants consumed higher amounts of fruits, healthier fats (as reflected in favourable ratios of unsaturated to saturated fatty acids), and lower levels of added sugars patterns known to support gut microbiota diversity and metabolic health [38]. In contrast, PAVILA children exhibited lower vegetable intake, which aligns with studies in diverse populations showing that insufficient consumption of vegetables is associated with reduced microbial richness and functional metabolites like SCFAs [39]. These observations support the assertion that while Blastocystis colonisation can occur across a range of dietary backgrounds, the broader dietary environment and host setting critically modulate microbiota interactions. Similar findings have emerged in multi-ethnic cohorts, where HEI scores especially components related to fruit and vegetable intake explained the largest variance in gut microbial community structure [39,40,41].
Alpha diversity insights
In our analysis focusing exclusively on Blastocystis-colonised individuals, those from the FACSA cohort exhibited significantly higher microbial richness and evenness compared to PAVILA participants. This pattern is consistent with multiple high-impact studies demonstrating that Blastocystis colonisation is associated with increased bacterial diversity in healthy hosts [42,43]. For instance, Tito et al., reported that colonisation was positively correlated with greater microbial richness, enriched in Clostridiales and Ruminococcaceae taxa [44], while Audebert et al. found that Blastocystis-positive individuals had a higher abundance of Prevotella- or Ruminococcus-driven enterotypes and greater alpha diversity compared to negative subjects [42].
Furthermore, it is well established that gut microbiota alpha diversity increases substantially during early childhood and continues to mature through early school age. A longitudinal study by Stewart et al. demonstrated that bacterial taxonomic diversity increases significantly from infancy to approximately 36 months, stabilizing thereafter [45]. Similar findings were reported by Roswall et al., indicating gradual diversity gains during the first decade of life [46].
These patterns suggest that the lower alpha diversity observed in the younger, institutionalised PAVILA cohort can be attributed to the ongoing maturation of the microbiome, a process delayed compared to adult levels, rather than external speculation. The evidence underscores that age and colonisation status together influence microbial ecological outcomes.
Beta diversity and ecological context
When analyses were confined to Blastocystis-colonised individuals, we observed significant differences in community composition between cohorts (PERMANOVA p = 0.001; Figure 2). This suggests that factors such as lifestyle, and institutional living exert independent effects on gut microbiota structure. Longitudinal cohort studies demonstrate that beta diversity evolves across the lifespan, with adult-like microbiota profiles typically emerging by the end of the first decade of life [46]. Additionally, lifestyle factors such, socioeconomic conditions, and dietary diversity are well documented to influence microbial composition substantially, independent of age; institutional environments and constrained dietary options have also been associated with reduced microbial diversity and shifts in community composition in preschool-age children [47,48,49,50,51].
Exploratory visualisation of diet–microbiota interactions in Blastocystis-colonised individuals
A principal coordinates analysis (PCoA) based on Bray–Curtis dissimilarities and coloured by HEI-2020 total scores revealed a structured distribution of samples, despite all individuals being colonised by Blastocystis. Notably, individuals with higher dietary quality (as indicated by red hues) clustered toward one side of the ordination space, while those with lower scores (blue/purple hues) were positioned on the opposite end (as shown in Figure 5). This gradient-like pattern suggests that even within a uniformly colonised population dietary quality may drive compositional shifts in gut microbiota. These findings suggest that Blastocystis colonisation can occur in diverse dietary contexts and that host diet plays a modulatory role in shaping microbial ecology. It should be noted that the visualisation of microbiota composition constrained by HEI-2020 scores revealed taxa-specific associations along the dietary quality gradient. Notably, Segatella was enriched in individuals with low-quality diets, which contrasts with previously reported role in SCFA production and metabolic health [52,53]. The positioning of Segatella along the HEI-2020 gradient revealed a strong association with individuals exhibiting the lowest overall dietary quality. Interestingly, this genus was also detected in the PAVILA cohort, where colonised individuals had notably lower vegetable intake. This apparent paradox suggests that Segatella may respond to broader ecological conditions influenced by multiple dietary components, rather than isolated vegetable consumption. Indeed, Segatella isolates have been shown to ferment plant polysaccharides into diverse short-chain fatty acids (formate, lactate, succinate, propionate, acetate) [54], indicating sensitivity to complex dietary substrates. This finding is consistent with reports suggesting that Segatella may increase in environments where diets are high in sugars and low in protein, which are patterns commonly observed in resource-limited settings. As noted by Xiao et al. (2024) point out, Segatella dominance does not necessarily indicate good nutritional quality; rather, it may reflect a monotonous diet rich in plant-based carbohydrates but lacking in variety and essential nutrients [55]. The coexistence of Segatella with Blastocystis in PAVILA cohort may suggest a standard ecological configuration associated with institutional diets that have high starch content but low in nutritional diversity. This highlights the importance of understanding microbial profiles within the specific social and dietary contexts of each group.
On the other hand, principal coordinates analysis (PCoA) also revealed a transparent gradient, where individuals with higher-quality diets occupied a different region in the ordination space. Projecting microbial genera using envfit analysis further supported this pattern: genera such as Sellimonas and Subdoligranulum were enriched in participants with higher HEI-2020 scores, consistent with their potential role in beneficial ecological setups. Interestingly, other taxa, such as Acutalibacter and Bacteroides, also aligned with this higher-quality dietary group. In a systematic review of dietary interventions in individuals with type 2 diabetes, Bock et al. (2022) reported an increase in the abundance of Bacteroides and Alistipes following intervention with Mediterranean or high-fibre diets. Subdoligranulum exhibited variable responses, depending on the type of intervention and the basal microbiota; these findings partially align with our results. In our cohort of healthy individuals colonised by Blastocystis, we also observed that Bacteroides and Alistipes align with patterns of higher dietary quality. Although the metabolic context differs, these observations suggest that specific genera may serve as common functional indicators in response to dietary improvements [56]. A previous study analysing colonic mucosal samples found that participants with lower HEI scores had significantly reduced abundances of Subdoligranulum and Parabacteroides compared to those with better diet quality. Furthermore, they observed that Alistipes tended to be more abundant in individuals with greater adherence to healthy dietary patterns, characterised by higher consumption of fruits, fibre, and greater dietary diversity [57].
Dietary components shape microbiota
The db-RDA constrained by the HEI-2020 protein component suggest that protein intake modulates gut microbiota composition in individuals colonised by Blastocystis. The observed separation of cohorts along CAP1 is consistent with dietary records showing higher protein food scores in the FACSA group relative to PAVILA. Notably, the genera Sellimonas, Subdoligranulum, and Bacteroides, which projected toward the FACSA cluster, have been previously associated with greater dietary diversity and fibre-protein co-fermentation (ref).
Interestingly, Segatella was again aligned with the PAVILA group and lower protein intake, consistent with its prior association with lower vegetable scores in this same population. This recurring pattern suggests that Segatella may represent a microbial marker of low-nutrient dietary profiles [55]. Together, these findings highlight the relevance of individual dietary components beyond total diet quality in shaping gut microbial ecology under Blastocystis colonisation, potentially modulating colonisation dynamics or host-microbe interactions.
PERMANOVA results revealed that protein intake (R² = 0.23, p = 0.017) and vegetable intake (R² = 0.17, p = 0.044) were significantly associated with microbiota composition. This aligns with evidence that dietary protein strongly influences gut microbial community structure and metabolic outputs: a high-protein diet can modulate bacterial taxa involved in proteolytic fermentation, affecting SCFAs and potentially driving changes in gut health [58]. Plant-based components, including vegetables rich in fibre, have been shown to promote the growth of SCFA-producing bacteria such as Lachnospiraceae and Bacteroidetes and support microbial diversity and functional capacity [59,60].
Multivariate analysis revealed that dietary components of protein and vegetables differentially modulate faecal microbiota composition across cohorts, even in Blastocystis-colonised individuals. Some studies have shown that higher total protein intake (animals plus vegetables) correlates with higher microbial diversity and changes in bacterial profiles. Furthermore, evidence from human cohorts indicates that vegetable-rich diets promote greater bacterial richness and the presence of functional genera [61,62]. Furthermore, studies on dietary patterns have shown that plant-based diets are strongly associated with increased genera such as Alistipes [57] and Sellinomas [63]. In contrast, dietary styles characteristic of more restrictive environments favor distinct bacterial profiles [64]. The association of our proposed genera Sellimonas and Murimonas with healthier diets [65] and Haemophilus with more limited diets [66], reinforces the notion that Blastocystis may be shaped by host-specific ecological contexts. This supports the idea that its role should not be regarded as universally pathogenic. Consequently, its role should be analysed while considering nutritional quality and social and environmental determinants.
Strengths and Limitations
This study presents several notable strengths. First, it focuses on individuals colonised by Blastocystis spp., allowing for a targeted analysis of dietary and ecological factors that shape the gut microbiota independent of colonisation status. By controlling for this key variable, we were able to examine microbiota structure within a relatively homogeneous colonisation profile, thereby reducing confounding effects. Second, we integrated detailed dietary quality assessment using the HEI-2020, enabling the exploration of specific components (e.g., protein and vegetable intake) and their multivariate associations with gut microbiota. Third, the inclusion of two contrasting populations—university students and institutionalised children/caregivers—provided an opportunity to examine the impact of diverse socioeconomic and dietary environments within a shared colonisation context. Lastly, our use of Hellinger-transformed genus-level data and Bray–Curtis dissimilarity in multivariate frameworks (PERMANOVA, db-RDA) ensured robust ecological interpretations.
However, several limitations must be acknowledged. The sample size was relatively small, particularly within each subgroup, limiting statistical power and the generalizability of results. Although our focus on Blastocystis-colonised individuals strengthens internal validity, it precludes direct comparisons with non-colonised controls. Furthermore, we did not perform subtyping of Blastocystis, which may be a relevant limitation given the reported variation in host responses and microbial associations for subtypes such as ST1, ST4, and ST7. Our cross-sectional design also limits causal inference, and while dietary data were collected using validated methods, reliance on self-reported intake may introduce recall bias. Finally, microbiota profiling was based on 16S rRNA sequencing at the genus level, which, while informative, lacks resolution on strain-specific or functional dynamics that could be captured through metagenomics.
Future studies should incorporate Blastocystis subtyping, expand to larger and more diverse cohorts, and integrate metagenomic and metabolomic analyses to further disentangle the diet–microbiota–Blastocystis triad.
5. Conclusions
Our findings highlight the critical role of diet in shaping gut microbiota composition among Blastocystis-colonised individuals from different social and dietary environments. Despite universal colonisation, microbial diversity and structure differed markedly between cohorts, reflecting the influence of dietary quality, age, and institutional living. Notably, protein and vegetable intake emerged as key dietary components associated with microbiota variation, underscoring their ecological relevance in modulating gut microbial communities.
Moreover, our results contribute to the growing body of evidence suggesting that Blastocystis acts more as an ecological indicator than a pathogen, particularly in individuals with diverse and metabolically active microbiota. These findings support a context-dependent interpretation of Blastocystis colonisation and reinforce the need to consider both dietary and host ecological factors in gut microbiome research.
Future research integrating Blastocystis subtyping, functional microbiome profiling, and immune markers will be essential to clarify causal pathways and to explore the potential of dietary interventions to modulate the microbiota in colonised populations.
Supplementary Materials
The following supporting information can be downloaded at: guangorena, janeth (2025), “DIET_MICROBIOTA_BLASTOCYSTIS”, Mendeley Data, V1, doi: 10.17632/r6x9vthwpx.1
Author Contributions
J.O.G.G. and C.M.Y.; methodology, A.M.H.; software, F.F.G.G.; validation, J.O.G.G., F.F.G.G. and A.I.P.H.; formal analysis, J.O.G.G.; investigation, J.O.G.G.; resources, J.OG.G., A.I.P.H., F.F.G.G.; data curation, C.M.Y.; writing—original draft preparation, J.O.G.G..; writing—review and editing, J.O.G.G., C.M.Y.; visualization, A.M.H.; supervision, J.O.G.G., F.F.G.G.; project administration, J.O.G.G.; funding acquisition, J.O.G.G., A.I.P.H. All authors have read and agreed to the published version of the manuscript.
Funding
The Science and Technology Council of the State of Durango partially funded this research
Institutional Review Board Statement
The study was conducted by the Declaration of Helsinki and was approved by the Research Ethics Committee of the Faculty of Medicine and Nutrition with registration number CEI-FAMEN-36, approved on September 22, 2022.
Informed Consent Statement
We obtained informed consent from adult participants and from the parents, guardians, or legal representatives of minor participants, as well as a letter of assent from minor participants.
Data Availability Statement
The data presented in this study are available in the article and supplementary materials. Supplementary files include anonymised dietary intake and microbiota metadata (n = 14), genus-level microbiota abundance, and R scripts used for statistical analysis. We provide all files to support transparency and reproducibility by the study's ethical approval (CEI-FAMEN-36).
Acknowledgments
The authors thank the Pan de Vida de la Laguna shelter staff, especially Dr. Faby Salas, the institution's legal representative, for their support in coordinating fieldwork, participant recruitment, and study logistics. They also acknowledge the valuable support of the Center for Food and Development Research (CIAD), Mazatlán unit, Dr. Bruno Gómez in sample processing and microbiota sequencing. They also acknowledge the technical assistance of the team at the Center for Biomedical Sciences Research at the Autonomous University of Coahuila, who collaborated in the bioinformatics analysis of the samples. While preparing this manuscript, the authors used ChatGPT (OpenAI, GPT-4 model) to support the writing of the abstract and the interpretation of multivariate analyses. The authors carefully reviewed and edited all generated content and assume full responsibility for the published version of this manuscript.
Conflicts of Interest
“The authors declare no conflicts of interest.”
Abbreviations
The following abbreviations are used in this manuscript:
| PERMANOVA | Permutational Multivariate Analysis of Variance |
| HEI-2020 | Healthy Eating Index-2020 |
| 16S rRNA | 16S ribosomal Ribonucleic Acid |
| db-RDA | Distance-based Redundancy Analysis |
| PCoA | Principal Coordinates Analysis |
| R2 | Coefficient of Determination |
| SES | Socioeconomic Status |
| FFQ | Food Frequency Questionnaire |
| FINUT | Ibero-American Nutrition Foundation |
| BEDCA | Spanish Food Composition Database |
| USDA | United States Department of Agriculture |
| IPAQ | International Physical Activity Questionnaire |
| MET | Metabolic Equivalent of Task |
| E.Z.N.A. | E.Z.N.A. stands for 'Easy Nucleic Acid', a brand of nucleic acid extraction kits |
| DNA | Deoxyribonucleic Acid |
| Bio-Tek, Inc | Bio-Tek Instruments, Inc. (a laboratory instrumentation company) |
| FastQC | Fast Quality Control (a tool for quality checking high throughput sequence data) |
| DADA2 | Divisive Amplicon Denoising Algorithm 2 |
| QIIME2 | Quantitative Insights Into Microbial Ecology 2 |
| ASVs | Amplicon Sequence Variants |
| VSEARCH | Vectorized Search (open-source tool for metagenomics) |
| SILVA | SILVA ribosomal RNA gene database project |
| MAFFT | Multiple Alignment using Fast Fourier Transform |
| PCR | Polymerase Chain Reaction |
| IDT | Integrated DNA Technologies |
| Qiagen | Qiagen (biotech company for DNA/RNA extraction and analysis kits) |
| RT-PCR | Reverse Transcription Polymerase Chain Reaction |
| RNase | Ribonuclease |
| DNase | Deoxyribonuclease |
| CEI-FAMEN | Comité de Ética en Investigación de la Facultad de Medicina y Nutrición (ESP) |
| envfit | Environmental Fitting Function (in R vegan package) |
| CAP1 | Canonical Axis 1 (used in constrained ordination analyses) |
| MDS1 | Multidimensional Scaling Dimension 1 |
| F | F-statistic |
| p | p-value |
| Df | Degrees of Freedom |
| SCFAs | Short-Chain Fatty Acids |
| ST1 | Subtype 1 (Blastocystis subtype) |
| ST4 | Subtype 4 (Blastocystis subtype) |
| ST7 | Subtype 7 (Blastocystis subtype) |
References
- Illiano, P.; Brambilla, R.; Parolini, C. The Mutual Interplay of Gut Microbiota, Diet and Human Disease. FEBS Journal 2020, 287, 833–855. [Google Scholar] [CrossRef] [PubMed]
- Nemzer, B. V.; Al-Taher, F.; Kalita, D.; Yashin, A.Y.; Yashin, Y.I. Health-Improving Effects of Polyphenols on the Human Intestinal Microbiota: A Review. Int J Mol Sci 2025, 26, 1–20. [Google Scholar] [CrossRef] [PubMed]
- Severino, A.; Tohumcu, E.; Tamai, L.; Dargenio, P.; Porcari, S.; Rondinella, D.; Venturini, I.; Maida, M.; Gasbarrini, A.; Cammarota, G.; et al. The Microbiome-Driven Impact of Western Diet in the Development of Noncommunicable Chronic Disorders. Best Pract Res Clin Gastroenterol 2024, 72, 1–8. [Google Scholar] [CrossRef] [PubMed]
- Hou, K.; Wu, Z.X.; Chen, X.Y.; Wang, J.Q.; Zhang, D.; Xiao, C.; Zhu, D.; Koya, J.B.; Wei, L.; Li, J.; et al. Microbiota in Health and Diseases. Signal Transduct Target Ther 2022, 7, 1–8. [Google Scholar] [CrossRef] [PubMed]
- Jandhyala, S.M.; Talukdar, R.; Subramanyam, C.; Vuyyuru, H.; Sasikala, M.; Reddy, D.N. Role of the Normal Gut Microbiota. World J Gastroenterol 2015, 21, 8836–8847. [Google Scholar] [CrossRef] [PubMed]
- Hasan, N.; Yang, H. Factors Affecting the Composition of the Gut Microbiota, and Its Modulation. PeerJ 2019, 2019, 1–31. [Google Scholar] [CrossRef] [PubMed]
- Qiu, P.; Ishimoto, T.; Fu, L.; Zhang, J.; Zhang, Z.; Liu, Y. The Gut Microbiota in Inflammatory Bowel Disease. Front Cell Infect Microbiol 2022, 12, 1–14. [Google Scholar] [CrossRef] [PubMed]
- Duan, M.; Wang, Y.; Zhang, Q.; Zou, R.; Guo, M.; Zheng, H. Characteristics of Gut Microbiota in People with Obesity. PLoS One 2021, 16, 1–15. [Google Scholar] [CrossRef] [PubMed]
- Riggen-Bueno, V.; Del Toro-Arreola, S.; Baltazar-Díaz, T.A.; Vega-Magaña, A.N.; Peña-Rodríguez, M.; Castaño-Jiménez, P.A.; Sánchez-Orozco, L.V.; Vera-Cruz, J.M.; Bueno-Topete, M.R. Intestinal Dysbiosis in Subjects with Obesity from Western Mexico and Its Association with a Proinflammatory Profile and Disturbances of Folate (B9) and Carbohydrate Metabolism. Metabolites 2024, 14, 1–17. [Google Scholar] [CrossRef] [PubMed]
- Piperni, E.; Nguyen, L.H.; Manghi, P.; Kim, H.; Pasolli, E.; Andreu-Sánchez, S.; Arrè, A.; Bermingham, K.M.; Blanco-Míguez, A.; Manara, S.; et al. Intestinal Blastocystis Is Linked to Healthier Diets and More Favorable Cardiometabolic Outcomes in 56,989 Individuals from 32 Countries. Cell 2024, 187, 4554–4570. [Google Scholar] [CrossRef] [PubMed]
- Aykur, M.; Malatyalı, E.; Demirel, F.; Cömert-Koçak, B.; Gentekaki, E.; Tsaousis, A.D.; Dogruman-Al, F. Blastocystis: A Mysterious Member of the Gut Microbiome. Microorganisms 2024, 12, 1–19. [Google Scholar] [CrossRef] [PubMed]
- Khaled, S.; Gantois, N.; Ly, A.T.; Senghor, S.; Even, G.; Dautel, E.; Dejager, R.; Sawant, M.; Baydoun, M.; Benamrouz-Vanneste, S.; et al. Prevalence and Subtype Distribution of Blastocystis Sp. In Senegalese School Children. Microorganisms 2020, 8, 1–17. [Google Scholar] [CrossRef] [PubMed]
- Nemati, S.; Zali, M.R.; Johnson, P.; Mirjalali, H.; Karanis, P. Molecular Prevalence and Subtype Distribution of Blastocystis Sp. In Asia and in Australia. J Water Health 2021, 19, 687–704. [Google Scholar] [CrossRef] [PubMed]
- Marangi, M.; Boughattas, S.; De Nittis, R.; Pisanelli, D.; delli Carri, V.; Lipsi, M.R.; La Bella, G.; Serviddio, G.; Niglio, M.; Lo Caputo, S.; et al. Prevalence and Genetic Diversity of Blastocystis Sp. among Autochthonous and Immigrant Patients in Italy. Microb Pathog 2023, 185, 1–8. [Google Scholar] [CrossRef] [PubMed]
- Fusaro, C.; Bernal, J.E.; Baldiris-Ávila, R.; González-Cuello, R.; Cisneros-Lorduy, J.; Reales-Ruiz, A.; Castro-Orozco, R.; Sarria-Guzmán, Y. Molecular Prevalence and Subtypes Distribution of Blastocystis Spp. in Humans of Latin America: A Systematic Review. Trop Med Infect Dis 2024, 9, 1–22. [Google Scholar] [CrossRef] [PubMed]
- Rebolla, M.F.; Silva, E.M.; Gomes, J.F.; Falcão, A.X.; Rebolla, M.V.F.; Franco, R.M.B. High Prevalence of Blastocystis Spp. Infection in Children and Staff Members Attending Public Urban Schools in São Paulo State, Brazil. Rev Inst Med Trop Sao Paulo 2016, 58, 1–8. [Google Scholar] [CrossRef] [PubMed]
- Power, S.E.; O’Toole, P.W.; Stanton, C.; Ross, R.P.; Fitzgerald, G.F. Intestinal Microbiota, Diet and Health. British Journal of Nutrition 2014, 111, 387–402. [Google Scholar] [CrossRef] [PubMed]
- Beyhan, Y.E.; Güven, İ.; Aydın, M. Detection of Blastocystis Sp. in Ulcerative Colitis, Crohn’s and Chronic Diarrheal Patients by Microscopy, Culture and Real-Time Polymerase Chain Reaction. Microb Pathog 2023, 177, 106039. [Google Scholar] [CrossRef] [PubMed]
- Mayneris-Perxachs, J.; Arnoriaga-Rodríguez, M.; Garre-Olmo, J.; Puig, J.; Ramos, R.; Trelis, M.; Burokas, A.; Coll, C.; Zapata-Tona, C.; Pedraza, S.; et al. Presence of Blastocystis in Gut Microbiota Is Associated with Cognitive Traits and Decreased Executive Function. ISME Journal 2022, 16, 2181–2197. [Google Scholar] [CrossRef] [PubMed]
- Deng, L.; Wojciech, L.; Gascoigne, N.R.J.; Peng, G.; Tan, K.S.W. New Insights into the Interactions between Blastocystis, the Gut Microbiota, and Host Immunity. PLoS Pathog 2021, 17, 1–15. [Google Scholar] [CrossRef] [PubMed]
- Yañez, C.M.; Hernández, A.M.; Sandoval, A.M.; Domínguez, M.A.M.; Muñiz, S.A.Z.; Gómez, J.O.G. Prevalence of Blastocystis and Its Association with Firmicutes/Bacteroidetes Ratio in Clinically Healthy and Metabolically Ill Subjects. BMC Microbiol 2021, 21, 1–11. [Google Scholar] [CrossRef] [PubMed]
- Castañeda, S.; Tomiak, J.; Andersen, L.O.; Acosta, C.P.; Vasquez-A, L.R.; Stensvold, C.R.; Ramírez, J.D. Impact of Blastocystis Carriage and Colonization Intensity on Gut Microbiota Composition in a Non-Westernized Rural Population from Colombia. PLoS Negl Trop Dis 2025, 19, 1–19. [Google Scholar] [CrossRef] [PubMed]
- Castañeda, S.; Muñoz, M.; Villamizar, X.; Hernández, P.C.; Vásquez, L.R.; Tito, R.Y.; Ramírez, J.D. Microbiota Characterization in Blastocystis-Colonized and Blastocystis-Free School-Age Children from Colombia. Parasit Vectors 2020, 13, 1–12. [Google Scholar] [CrossRef] [PubMed]
- Cena, H.; Calder, P.C. Defining a Healthy Diet: Evidence for the Role of Contemporary Dietary Patterns in Health and Disease. Nutrients 2020, 12, 1–15. [Google Scholar] [CrossRef] [PubMed]
- Wastyk, H.C.; Fragiadakis, G.K.; Perelman, D.; Dahan, D.; Merrill, B.D.; Yu, F.B.; Topf, M.; Gonzalez, C.G.; Van Treuren, W.; Han, S.; et al. Gut-Microbiota-Targeted Diets Modulate Human Immune Status. Cell 2021, 184, 4137–4153. [Google Scholar] [CrossRef] [PubMed]
- Soldán, M.; Argalášová, Ľ.; Hadvinová, L.; Galileo, B.; Babjaková, J. The Effect of Dietary Types on Gut Microbiota Composition and Development of Non-Communicable Diseases: A Narrative Review. Nutrients 2024, 16, 1–16. [Google Scholar] [CrossRef] [PubMed]
- Amaruddin, A.I.; Hamid, F.; Koopman, J.P.R.; Muhammad, M.; Brienen, E.A.T.; van Lieshout, L.; Geelen, A.R.; Wahyuni, S.; Kuijper, E.J.; Sartono, E.; et al. The Bacterial Gut Microbiota of Schoolchildren from High and Low Socioeconomic Status: A Study in an Urban Area of Makassar, Indonesia. Microorganisms 2020, 8, 1–12. [Google Scholar] [CrossRef] [PubMed]
- Iddrisu, I.; Monteagudo-Mera, A.; Poveda, C.; Pyle, S.; Shahzad, M.; Andrews, S.; Walton, G.E. Malnutrition and Gut Microbiota in Children. Nutrients 2021, 13, 1–21. [Google Scholar] [CrossRef] [PubMed]
- Harper, K.M.; Mutasa, M.; Prendergast, A.J.; Humphrey, J.; Manges, A.R. Environmental Enteric Dysfunction Pathways and Child Stunting: A Systematic Review. PLoS Negl Trop Dis 2018, 12, 1–23. [Google Scholar] [CrossRef] [PubMed]
- Tickell, K.D.; Atlas, H.E.; Walson, J.L. Environmental Enteric Dysfunction: A Review of Potential Mechanisms, Consequences and Management Strategies. BMC Med 2019, 17, 1–9. [Google Scholar] [CrossRef] [PubMed]
- Zaman Wahid, B.; Haque, M.A.; Gazi, M.A.; Fahim, S.M.; Faruque, A.S.G.; Mahfuz, M.; Ahmed, T. Site-Specific Incidence Rate of Blastocystis Hominis and Its Association with Childhood Malnutrition: Findings from a Multi-Country Birth Cohort Study. American Journal of Tropical Medicine and Hygiene 2023, 108, 887–894. [Google Scholar] [CrossRef] [PubMed]
- BEDCA Base de Datos Española de Composición de Alimentos. Available online: https://www.bedca.net/bdpub/index.php (accessed on 1 June 2025).
- Fukagawa, N.K.; McKillop, K.; Pehrsson, P.R.; Moshfegh, A.; Harnly, J.; Finley, J. USDA’s FoodData Central: What Is It and Why Is It Needed Today? American Journal of Clinical Nutrition 2022, 115, 619–624. [Google Scholar] [CrossRef] [PubMed]
- Shams-White, M.M.; Pannucci, T.R.E.; Lerman, J.L.; Herrick, K.A.; Zimmer, M.; Meyers Mathieu, K.; Stoody, E.E.; Reedy, J. Healthy Eating Index-2020: Review and Update Process to Reflect the Dietary Guidelines for Americans, 2020-2025. J Acad Nutr Diet 2023, 123, 1280–1288. [Google Scholar] [CrossRef] [PubMed]
- Carrera, Y.; Carrera, A.; Formación, Y. Cuestionario Internacional de Actividad Física (IPAQ). Revista Enfermería del Trabajo 2017, 7, 49–54. [Google Scholar]
- D’Amore, R.; Ijaz, U.Z.; Schirmer, M.; Kenny, J.G.; Gregory, R.; Darby, A.C.; Shakya, M.; Podar, M.; Quince, C.; Hall, N. A Comprehensive Benchmarking Study of Protocols and Sequencing Platforms for 16S RRNA Community Profiling. BMC Genomics 2016, 17, 1–20. [Google Scholar] [CrossRef] [PubMed]
- Stensvold, C.R.; Ahmed, U.N.; Andersen, L.O.B.; Nielsen, H.V. Development and Evaluation of a Genus-Specific, Probe-Based, Internal-Process-Controlled Real-Time PCR Assay for Sensitive and Specific Detection of Blastocystis Spp. J Clin Microbiol 2012, 50, 1847–1851. [Google Scholar] [CrossRef] [PubMed]
- De Filippo, C.; Cavalieri, D.; Di Paola, M.; Ramazzotti, M.; Poullet, J.B.; Massart, S.; Collini, S.; Pieraccini, G.; Lionetti, P. Impact of Diet in Shaping Gut Microbiota Revealed by a Comparative Study in Children from Europe and Rural Africa. Proc Natl Acad Sci U S A 2010, 107, 14691–14696. [Google Scholar] [CrossRef] [PubMed]
- Deehan, E.C.; Yang, C.; Perez-Muñoz, M.E.; Nguyen, N.K.; Cheng, C.C.; Triador, L.; Zhang, Z.; Bakal, J.A.; Walter, J. Precision Microbiome Modulation with Discrete Dietary Fiber Structures Directs Short-Chain Fatty Acid Production. Cell Host Microbe 2020, 27, 389–404.e6. [Google Scholar] [CrossRef] [PubMed]
- Um, C.Y.; Peters, B.A.; Choi, H.S.; Oberstein, P.; Beggs, D.B.; Usyk, M.; Wu, F.; Hayes, R.B.; Gapstur, S.M.; McCullough, M.L.; et al. Grain, Gluten, and Dietary Fiber Intake Influence Gut Microbial Diversity: Data from the Food and Microbiome Longitudinal Investigation. Cancer Research Communications 2023, 3, 43–53. [Google Scholar] [CrossRef] [PubMed]
- Conlon, M.A.; Bird, A.R. The Impact of Diet and Lifestyle on Gut Microbiota and Human Health. Nutrients 2015, 7, 17–44. [Google Scholar] [CrossRef] [PubMed]
- Audebert, C.; Even, G.; Cian, A.; Blastocystis Investigation Group; Loywick, A.; Merlin, S.; Viscogliosi, E.; Chabé, M.; El Safadi, D.; Certad, G.; et al. Colonization with the Enteric Protozoa Blastocystis Is Associated with Increased Diversity of Human Gut Bacterial Microbiota. Sci Rep 2016, 6, 1–11. [CrossRef]
- Stensvold, C.R.; Sørland, B.A.; Berg, R.P.K.D.; Andersen, L.O.; van der Giezen, M.; Bowtell, J.L.; El-Badry, A.A.; Belkessa, S.; Kurt, Ö.; Nielsen, H.V. Stool Microbiota Diversity Analysis of Blastocystis-Positive and Blastocystis-Negative Individuals. Microorganisms 2022, 10, 1–6. [Google Scholar] [CrossRef] [PubMed]
- Tito, R.Y.; Chaffron, S.; Caenepeel, C.; Lima-Mendez, G.; Wang, J.; Vieira-Silva, S.; Falony, G.; Hildebrand, F.; Darzi, Y.; Rymenans, L.; et al. Population-Level Analysis of Blastocystis Subtype Prevalence and Variation in the Human Gut Microbiota. Gut 2019, 68, 1180–1189. [Google Scholar] [CrossRef] [PubMed]
- Stewart, C.J.; Ajami, N.J.; O’Brien, J.L.; Hutchinson, D.S.; Smith, D.P.; Wong, M.C.; Ross, M.C.; Lloyd, R.E.; Doddapaneni, H.V.; Metcalf, G.A.; et al. Temporal Development of the Gut Microbiome in Early Childhood from the TEDDY Study. Nature 2018, 562, 583–602. [Google Scholar] [CrossRef] [PubMed]
- Roswall, J.; Olsson, L.M.; Kovatcheva-Datchary, P.; Nilsson, S.; Tremaroli, V.; Simon, M.C.; Kiilerich, P.; Akrami, R.; Krämer, M.; Uhlén, M.; et al. Developmental Trajectory of the Healthy Human Gut Microbiota during the First 5 Years of Life. Cell Host Microbe 2021, 29, 765–776. [Google Scholar] [CrossRef] [PubMed]
- De Filippo, C.; Cavalieri, D.; Di Paola, M.; Ramazzotti, M.; Poullet, J.B.; Massart, S.; Collini, S.; Pieraccini, G.; Lionetti, P. Impact of Diet in Shaping Gut Microbiota Revealed by a Comparative Study in Children from Europe and Rural Africa. Proc Natl Acad Sci U S A 2010, 107, 14691–14696. [Google Scholar] [CrossRef] [PubMed]
- Korpela, K.; Salonen, A.; Virta, L.J.; Kekkonen, R.A.; De Vos, W.M. Association of Early-Life Antibiotic Use and Protective Effects of Breastfeeding: Role of the Intestinal Microbiota. JAMA Pediatr 2016, 170, 750–757. [Google Scholar] [CrossRef] [PubMed]
- Sonnenburg, E.D.; Smits, S.A.; Tikhonov, M.; Higginbottom, S.K.; Wingreen, N.S.; Sonnenburg, J.L. Diet-Induced Extinctions in the Gut Microbiota Compound over Generations. Nature 2016, 529, 212–226. [Google Scholar] [CrossRef] [PubMed]
- Sonnenburg, E.D.; Sonnenburg, J.L. The Ancestral and Industrialized Gut Microbiota and Implications for Human Health. Nat Rev Microbiol 2019, 17, 383–390. [Google Scholar] [CrossRef] [PubMed]
- Yatsunenko, T.; Rey, F.E.; Manary, M.J.; Trehan, I.; Dominguez-Bello, M.G.; Contreras, M.; Magris, M.; Hidalgo, G.; Baldassano, R.N.; Anokhin, A.P.; et al. Human Gut Microbiome Viewed across Age and Geography. Nature 2012, 486, 222–227. [Google Scholar] [CrossRef] [PubMed]
- Kovatcheva-Datchary, P.; Nilsson, A.; Akrami, R.; Lee, Y.S.; De Vadder, F.; Arora, T.; Hallen, A.; Martens, E.; Björck, I.; Bäckhed, F. Dietary Fiber-Induced Improvement in Glucose Metabolism Is Associated with Increased Abundance of Prevotella. Cell Metab 2015, 22, 971–982. [Google Scholar] [CrossRef] [PubMed]
- Precup, G.; Vodnar, D.C. Gut Prevotella as a Possible Biomarker of Diet and Its Eubiotic versus Dysbiotic Roles: A Comprehensive Literature Review. British Journal of Nutrition 2019, 122, 131–140. [Google Scholar] [CrossRef] [PubMed]
- De Filippis, F.; Pasolli, E.; Tett, A.; Tarallo, S.; Naccarati, A.; De Angelis, M.; Neviani, E.; Cocolin, L.; Gobbetti, M.; Segata, N.; et al. Distinct Genetic and Functional Traits of Human Intestinal Prevotella Copri Strains Are Associated with Different Habitual Diets. Cell Host Microbe 2019, 25, 444–453. [Google Scholar] [CrossRef] [PubMed]
- Xiao, X.; Singh, A.; Giometto, A.; Brito, I.L. Segatella Clades Adopt Distinct Roles within a Single Individual’s Gut. NPJ Biofilms Microbiomes 2024, 10, 1–17. [Google Scholar] [CrossRef] [PubMed]
- Bock, P.M.; Martins, A.F.; Ramalho, R.; Telo, G.H.; Leivas, G.; Maraschin, C.K.; Schaan, B.D. The Impact of Dietary, Surgical, and Pharmacological Interventions on Gut Microbiota in Individuals with Diabetes Mellitus: A Systematic Review. Diabetes Res Clin Pract 2022, 189, 1–19. [Google Scholar] [CrossRef] [PubMed]
- Liu, Y.; Ajami, N.J.; El-Serag, H.B.; Hair, C.; Graham, D.Y.; White, D.L.; Chen, L.; Wang, Z.; Plew, S.; Kramer, J.; et al. Dietary Quality and the Colonic Mucosa-Associated Gut Microbiome in Humans. American Journal of Clinical Nutrition 2019, 110, 701–712. [Google Scholar] [CrossRef] [PubMed]
- Wu, S.; Bhat, Z.F.; Gounder, R.S.; Ahmed, I.A.M.; Al-Juhaimi, F.Y.; Ding, Y.; Bekhit, A.E.D.A. Effect of Dietary Protein and Processing on Gut Microbiota—A Systematic Review. Nutrients 2022, 14, 1–29. [Google Scholar] [CrossRef] [PubMed]
- Ríos-Covián, D.; Ruas-Madiedo, P.; Margolles, A.; Gueimonde, M.; De los Reyes-Gavilán, C.G.; Salazar, N. Intestinal Short Chain Fatty Acids and Their Link with Diet and Human Health. Front Microbiol 2016, 7, 1–9. [Google Scholar] [CrossRef] [PubMed]
- Koh, A.; De Vadder, F.; Kovatcheva-Datchary, P.; Bäckhed, F. From Dietary Fiber to Host Physiology: Short-Chain Fatty Acids as Key Bacterial Metabolites. Cell 2016, 165, 1332–1345. [Google Scholar] [CrossRef] [PubMed]
- Fackelmann, G.; Manghi, P.; Carlino, N.; Heidrich, V.; Piccinno, G.; Ricci, L.; Piperni, E.; Arrè, A.; Bakker, E.; Creedon, A.C.; et al. Gut Microbiome Signatures of Vegan, Vegetarian and Omnivore Diets and Associated Health Outcomes across 21,561 Individuals. Nat Microbiol 2025, 10, 1–22. [Google Scholar] [CrossRef] [PubMed]
- Jiang, Z.; Sun, T. yu; He, Y.; Gou, W.; Zuo, L. shi yuan; Fu, Y.; Miao, Z.; Shuai, M.; Xu, F.; Xiao, C.; et al. Dietary Fruit and Vegetable Intake, Gut Microbiota, and Type 2 Diabetes: Results from Two Large Human Cohort Studies. BMC Med 2020, 18, 1–11. [Google Scholar] [CrossRef] [PubMed]
- Muñoz, M.; Guerrero-Araya, E.; Cortés-Tapia, C.; Plaza-Garrido, A.; Lawley, T.D.; Paredes-Sabja, D. Comprehensive Genome Analyses of Sellimonas Intestinalis, a Potential Biomarker of Homeostasis Gut Recovery. Microb Genom 2020, 6, 1–11. [Google Scholar] [CrossRef] [PubMed]
- Kase, B.E.; Liese, A.D.; Zhang, J.; Murphy, E.A.; Zhao, L.; Steck, S.E. The Development and Evaluation of a Literature-Based Dietary Index for Gut Microbiota. Nutrients 2024, 16, 1–20. [Google Scholar] [CrossRef] [PubMed]
- Vacca, M.; Celano, G.; Calabrese, F.M.; Portincasa, P.; Gobbetti, M.; De Angelis, M. The Controversial Role of Human Gut Lachnospiraceae. Microorganisms 2020, 8, 1–25. [Google Scholar] [CrossRef] [PubMed]
- Muralidharan, J.; Moreno-Indias, I.; Bulló, M.; Lopez, J.V.; Corella, D.; Castañer, O.; Vidal, J.; Atzeni, A.; Fernandez-García, J.C.; Torres-Collado, L.; et al. Effect on Gut Microbiota of a 1-y Lifestyle Intervention with Mediterranean Diet Compared with Energy-Reduced Mediterranean Diet and Physical Activity Promotion: PREDIMED-Plus Study. American Journal of Clinical Nutrition 2021, 114, 1148–1158. [Google Scholar] [CrossRef] [PubMed]
Figure 1.
Alpha diversity comparison between cohorts colonised by Blastocystis spp. Boxplots show (A) richness (number of observed genera), (B) Shannon diversity index, and (C) Simpson diversity index (1 – D) among individuals from the FACSA (university students) and PAVILA (institutionalised children) cohorts. Points represent individual samples; horizontal lines denote medians. FACSA individuals exhibited significantly higher richness and diversity across all indices compared to PAVILA (p < 0.05 for all tests, Wilcoxon rank-sum).
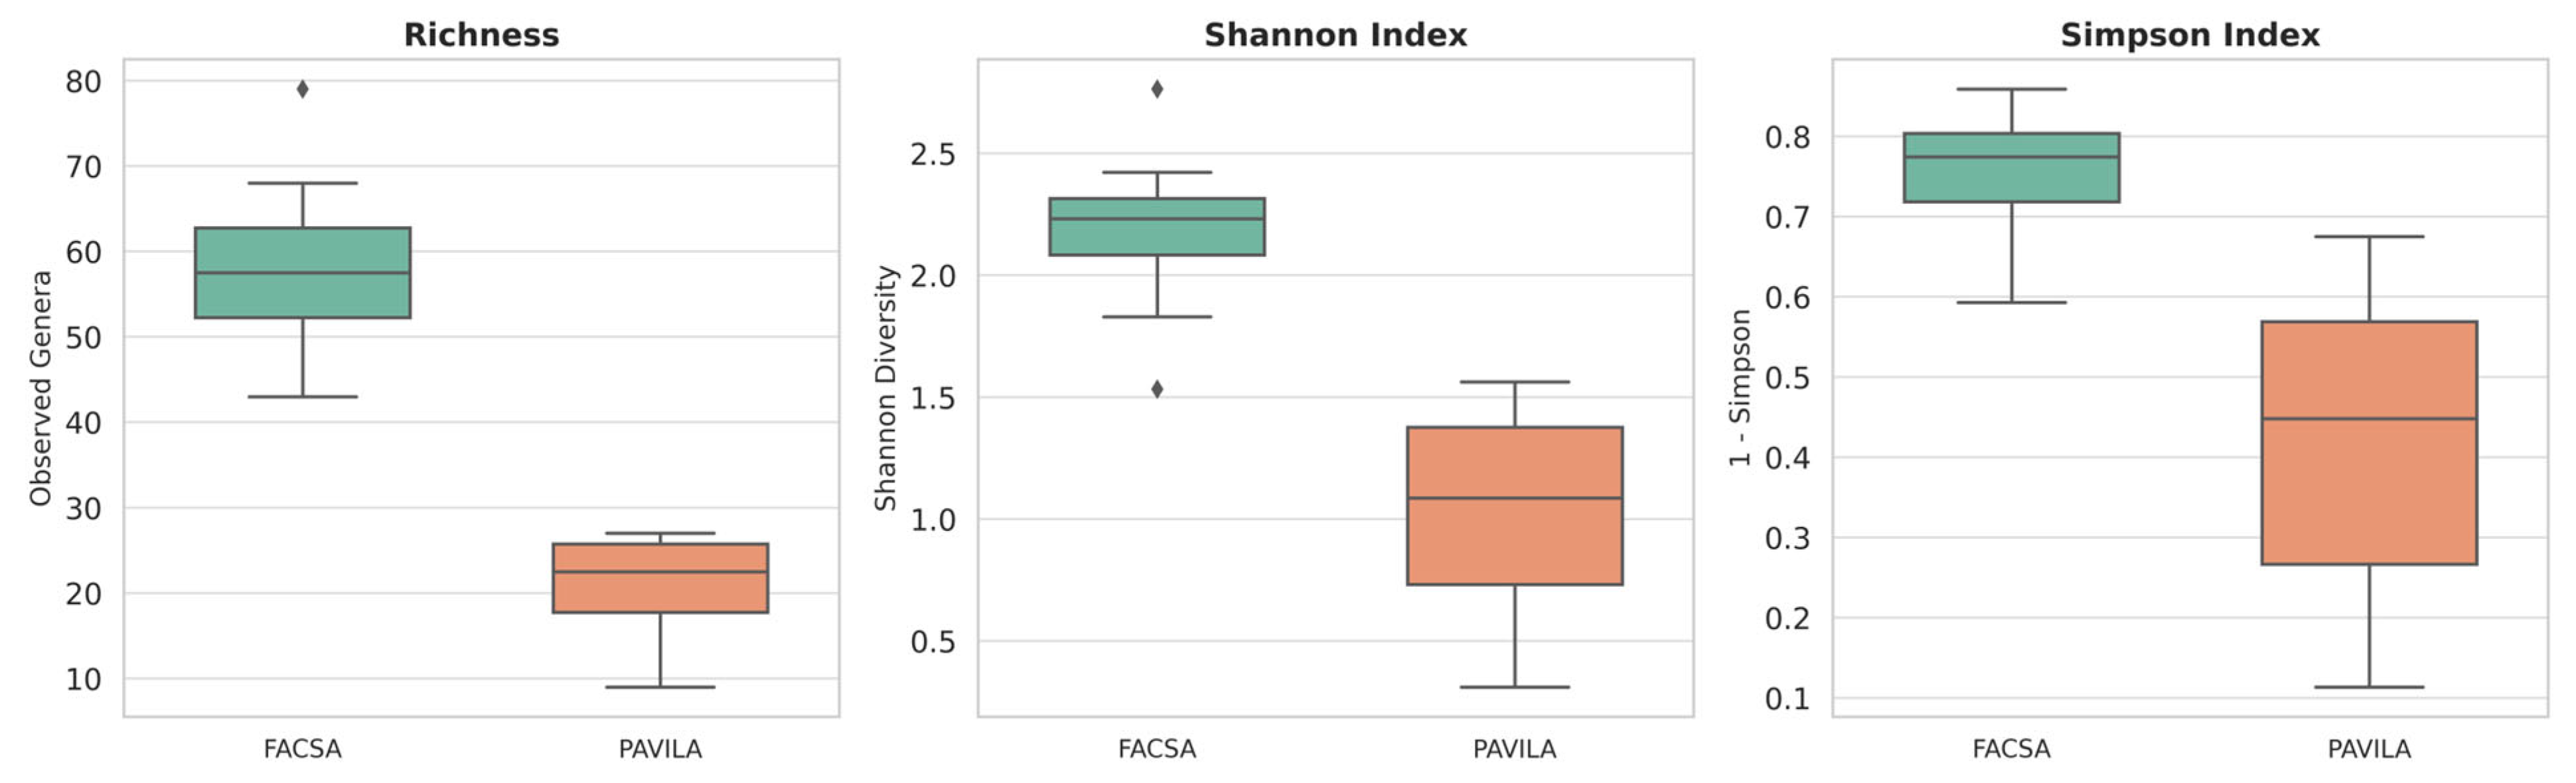
Figure 2.
Principal Coordinates Analysis (PCoA) based on Bray-Curtis dissimilarities of genus-level microbiota profiles in FACSA and PAVILA cohorts. Each point represents an individual sample, and ellipses indicate 95% confidence intervals around group centroids. The first two PCoA axes explain 50.76% and 14.35% of the total variance, respectively. Group separation was statistically significant (PERMANOVA, F = 3.33, R² = 0.217, p = 0.018).
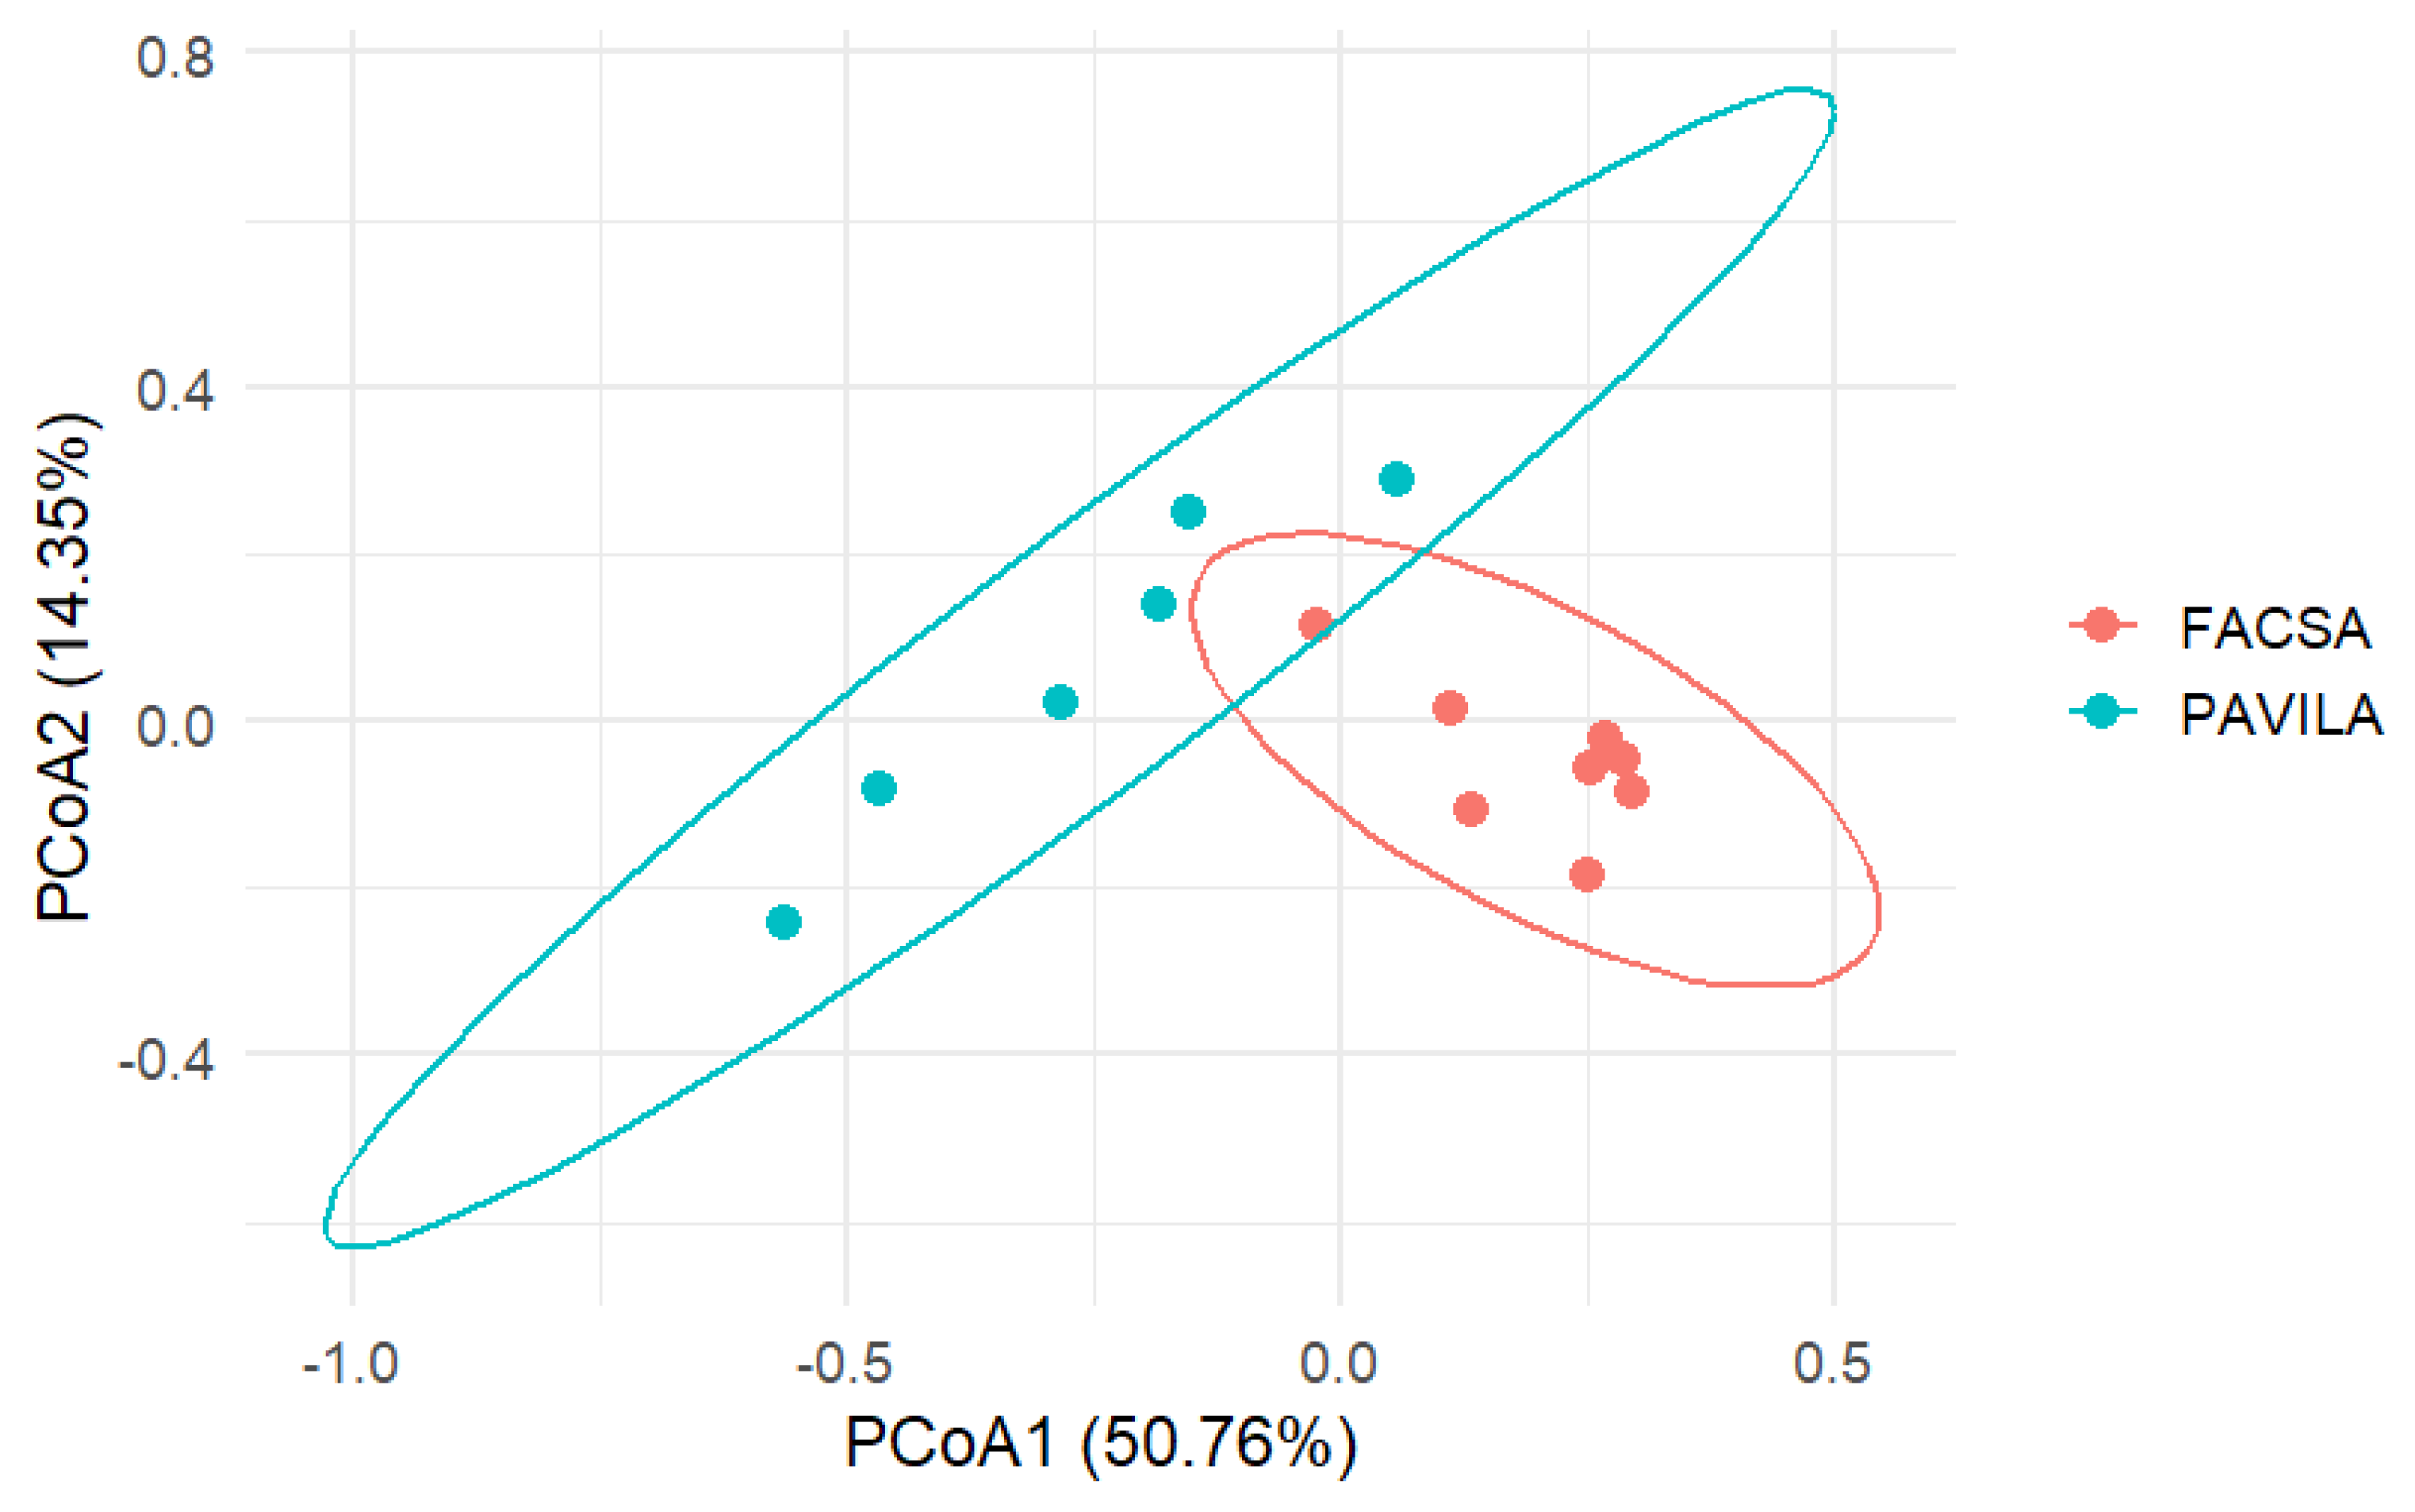
Figure 3.
Principal coordinates analysis (PCoA) biplot showing the top 10 bacterial genes that are most aligned with Bray-Curtis dissimilarity axes. Arrows indicate genus direction and magnitude of correlation. Samples are coloured by cohort (FACSA = orange, PAVILA = blue) and enclosed by 95% confidence ellipses.
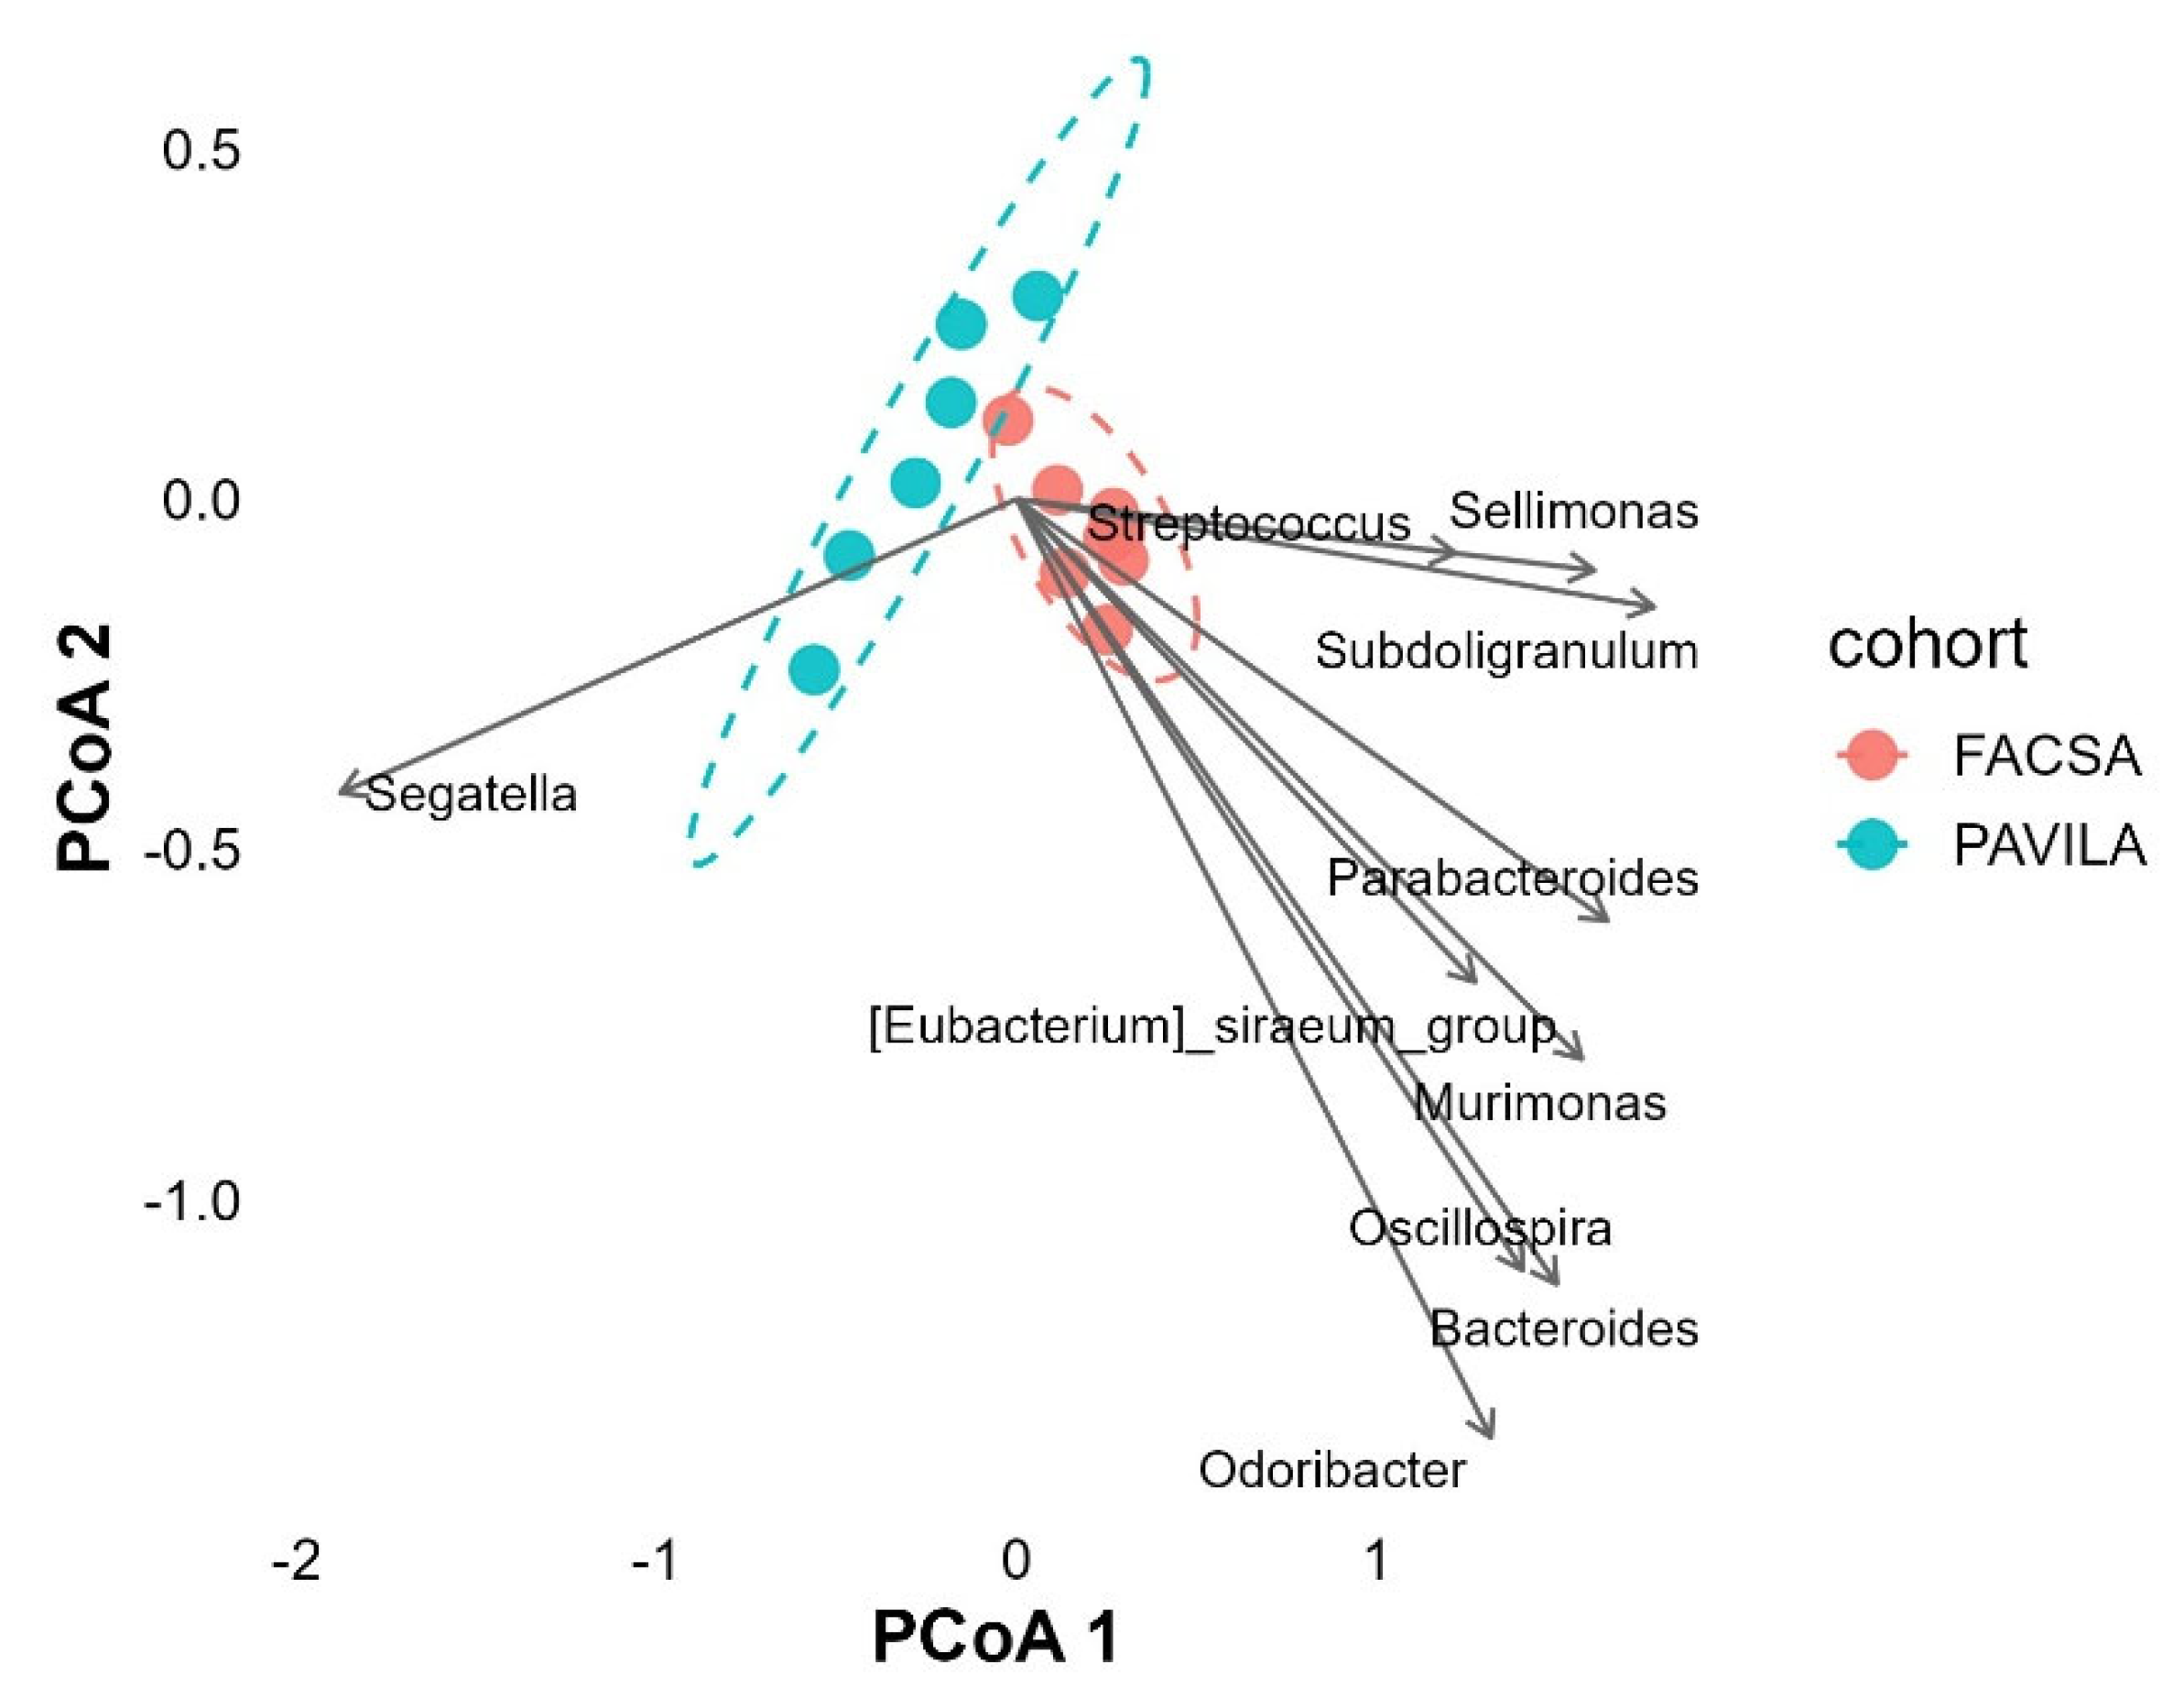
Figure 4.
Principal coordinates analysis (PCoA) of gut microbiota profiles at the genus level based on Bray–Curtis dissimilarity among individuals colonised by Blastocystis from two cohorts. The HEI-2020 total diet quality score colours points. The first two PCoA axes explain 50.76% and 14.35% of the variance, respectively. A transparent ordination gradient is visible, with samples exhibiting higher dietary quality (red tones) clustering toward the right of the PCoA1 axis. In contrast, samples with lower HEI-2020 scores (represented by blue and purple tones) are positioned to the left. PERMANOVA confirmed a significant association between microbial composition and dietary quality (R² = 0.26, p = 0.016), indicating that the host diet strongly influences the gut microbiota structure, even in the presence of Blastocystis colonisation.
Figure 5.
Biplot of the top 10 genera significantly associated with gut microbiota composition based on HEI-2020 diet quality scores (envfit, p < 0.1). The plot is based on Bray–Curtis dissimilarities and the first two PCoA axes, which explain 50.76% and 14.35% of the total variance, respectively. Arrows indicate the direction and strength of the association between each taxon and the compositional gradient. Genera such as Sellimonas and Subdoligranulum were aligned with higher HEI-2020 scores, while Segatella was associated with lower-quality diets.
Figure 6.
db-RDA constrained by Protein Foods Score. Arrows represent the 10 most correlated genera aligned with Bray-Curtis ordination. Ellipses represent 95% confidence intervals by cohort.
Figure 6.
db-RDA constrained by Protein Foods Score. Arrows represent the 10 most correlated genera aligned with Bray-Curtis ordination. Ellipses represent 95% confidence intervals by cohort.
Figure 7.
Distance-based redundancy analysis (db-RDA) of genus-level microbiota profiles in Blastocystis-colonised individuals, constrained by the vegetable intake component of the HEI-2020. Bray–Curtis dissimilarities were calculated after the Hellinger transformation. The first canonical axis (CAP1) explained 100% of the constrained variation. It separated the two cohorts, with FACSA (orange) projecting to the right, indicating higher vegetable intake, and PAVILA (green) to the left. Arrows represent the ten genera most strongly associated with the ordination axes (envfit, p < 0.1). Genera such as Sellimonas, Aculatibacter, Murimonas, and Alistipes were associated with higher vegetable intake, whereas Segatella was associated with lower scores in the PAVILA cohort.
Table 1.
HEI-2020 component scores by Blastocystis status in the FACSA cohort.
| Component |
Blastocystis Present n=8 |
Blastocystis Absent=38 |
p-value | Adjusted p-value |
| Energy intake | 2812.75 ± 721.59 | 2728.89 ± 950.18 | 0.522 | 0.642 |
| Caloric activity | 2490.50 ± 622.20 | 2449.11 ± 650.75 | 0.805 | 0.882 |
| Fruits | 4.01 ± 1.21 | 2.82 ± 1.65 | 0.071 | 0.298 |
| Whole fruits | 1.56 ± 0.96 | 1.38 ± 1.74 | 0.195 | 0.390 |
| Vegetables | 2.53 ± 1.25 | 1.81 ± 0.77 | 0.172 | 0.390 |
| Legumes | 2.83 ± 0.79 | 3.35 ± 1.42 | 0.184 | 0.390 |
| Whole grains | 9.03 ± 2.43 | 7.75 ± 3.41 | 0.331 | 0.530 |
| Dairy | 4.12 ± 2.39 | 3.78 ± 2.47 | 0.503 | 0.642 |
| Protein foods | 3.32 ± 0.41 | 3.21 ± 0.53 | 0.485 | 0.642 |
| Seafood/plant protein | 3.28 ± 1.72 | 3.21 ± 1.64 | 0.835 | 0.882 |
| Fatty acid ratio | 4.77 ± 1.43 | 3.16 ± 2.20 | 0.020* | 0.163 |
| Refined grains | 9.18 ± 1.25 | 8.08 ± 2.32 | 0.262 | 0.466 |
| Added sugars | 1.10 ± 2.03 | 2.40 ± 2.58 | 0.193 | 0.390 |
| Saturated fat | 8.33 ± 2.12 | 6.15 ± 3.03 | 0.075 | 0.298 |
| Total HEI-2020 | 64.03 ± 2.36 | 56.67 ± 9.91 | 0.005* | 0.079 |
HEI-2020 component scores (mean ± SD) by Blastocystis status in the FACSA cohort. No statistically significant differences were found after p-value adjustment. Adjusted p-value corrected by the Benjamini-Hochberg method.Significance: * ≤ 0.05, ns > 0.05.
Table 2.
HEI-2020 component scores by Blastocystis status in the PAVILA cohort.
| Component |
Blastocystis Present n=8 |
Blastocystis Absent n=29 |
p-value | Adjusted p-value |
| Energy intake | 4678.75 ± 2245.32 | 3175.45 ± 1459.14 | 0.140 | 0.681 |
| Caloric activity | 2070.25 ± 396.57 | 2148.70 ± 752.25 | 0.981 | 0.981 |
| Fruits | 2.67 ± 2.06 | 3.50 ± 1.45 | 0.225 | 0.681 |
| Whole fruits | 2.29 ± 2.06 | 2.30 ± 1.77 | 0.961 | 0.981 |
| Vegetables | 0.55 ± 0.49 | 1.70 ± 0.72 | 0.001** | 0.018* |
| Legumes | 2.65 ± 1.98 | 3.40 ± 1.68 | 0.426 | 0.681 |
| Whole grains | 7.86 ± 3.51 | 6.41 ± 3.71 | 0.468 | 0.681 |
| Dairy | 4.57 ± 1.79 | 4.66 ± 3.05 | 0.788 | 0.901 |
| Protein foods | 2.72 ± 0.66 | 2.91 ± 0.63 | 0.654 | 0.805 |
| Seafood/plant protein | 2.62 ± 0.51 | 1.72 ± 1.82 | 0.246 | 0.681 |
| Fatty acid ratio | 4.58 ± 3.41 | 3.43 ± 3.35 | 0.445 | 0.681 |
| Refined grains | 7.78 ± 3.41 | 6.48 ± 3.21 | 0.412 | 0.681 |
| Added sugars | 2.79 ± 2.74 | 1.37 ± 3.24 | 0.065 | 0.520 |
| Saturated fat | 6.69 ± 4.80 | 6.09 ± 3.76 | 0.607 | 0.805 |
| Total HEI-2020 | 57.13 ± 7.20 | 53.78 ± 11.78 | 0.434 | 0.681 |
HEI-2020 component scores (mean ± SD) by Blastocystis status in the PAVILA cohort. A significant difference was observed in the 'Vegetables' component after p-value adjustment. Adjusted p: p value corrected by the Benjamini-Hochberg method. Signif.: ** ≤ 0.01, * ≤ 0.05, ns > 0.05
Table 3.
PERMANOVA results evaluating the association between each dietary component (HEI-2020) and gut microbiota composition.
Table 3.
PERMANOVA results evaluating the association between each dietary component (HEI-2020) and gut microbiota composition.
| Diet Component (HEI-2020) | R² | F | p-value |
| Protein foods score | 0.232 | 3.63 | 0.017* |
| Total vegetable score | 0.167 | 2.40 | 0.044* |
| Total fruit score | 0.132 | 1.82 | 0.117 |
| Whole fruit score | 0.135 | 1.88 | 0.117 |
| Legume score | 0.097 | 1.29 | 0.260 |
| Refined grains score | 0.092 | 1.21 | 0.279 |
| Whole grain score | 0.075 | 0.97 | 0.408 |
| Saturated fats score | 0.070 | 0.91 | 0.421 |
| Sodium score | 0.071 | 0.92 | 0.464 |
| Seafood and plant protein score | 0.064 | 0.82 | 0.482 |
Disclaimer/Publisher’s Note: The statements, opinions and data contained in all publications are solely those of the individual author(s) and contributor(s) and not of MDPI and/or the editor(s). MDPI and/or the editor(s) disclaim responsibility for any injury to people or property resulting from any ideas, methods, instructions or products referred to in the content. |
© 2025 by the authors. Licensee MDPI, Basel, Switzerland. This article is an open access article distributed under the terms and conditions of the Creative Commons Attribution (CC BY) license (http://creativecommons.org/licenses/by/4.0/).
Copyright: This open access article is published under a Creative Commons CC BY 4.0 license, which permit the free download, distribution, and reuse, provided that the author and preprint are cited in any reuse.


