Submitted:
11 July 2025
Posted:
15 July 2025
You are already at the latest version
Abstract
Climate change has resulted in declining water availability and increased water risk in various regions of Chile, a phenomenon also observed in other countries. A potential approach to address this situation is territorial planning, which could mitigate water vulnerability by managing water demand and protecting ecosystems that provide essential services such as drinking water supply and watershed regulation. The present study examines the role of Regional Land Use Plans (PROTs) in modifying water vulnerability levels through spatial management strategies. Four catchments are analyzed considering the current land use and zoning proposed by the PROTs. The results indicate that in three catchments the vulnerability indicator exhibits an increase under the proposed zoning, while in one catchment there is a slight decrease. The findings suggest a discrepancy between the development objectives articulated in the plans and the proposed land use patterns. Despite incorporating guidelines for water resource management within the PROTs, implementing these guidelines does not necessarily reduce vulnerability. This study posits the necessity of transitioning towards spatial planning methodologies that systematically incorporate hydrological criteria.
Keywords:
water security
; vulnerability
; spatial planning
; water scarcity
1. Introduction
According to Fuentes et al., [1] Territorial Ordering defines the principles established by a country to use the territory; therefore, it is understood as a policy. Similarly, Bustos et al., [2] describe it as “the disciplinary articulation that establishes the conceptual body, parameters and criteria that enable the development of human activities, and of these with the natural environment, compatible and sustainable”. In particular, the Chilean State, in the guide of the Undersecretariat for Regional and Administrative Development (SUBDERE, its acronym in Spanish) for the elaboration of the Regional Land Use Plans (PROTs, its acronym in Spanish) adopted the definition of the European Spatial Planning Charter: “the spatial expression of the economic, social, cultural and ecological policies of society (...) whose objective is a balanced development of the regions and the physical organization of space according to a guiding concept” [3]. This paper will consider the definition of the European Spatial Development Charter.
Territorial Planning lacks a legal definition in Chile and is associated with urban planning [1,4,5]. However, in the context of this paper, spatial planning will be understood as “the process of regulating the usage of a territory defined at different levels (regional, inter-communal and local), to achieve the objectives outlined by the Territorial Ordering in the physical territory, which is, in short, the realization of the aims described by a Territorial Ordering policy” [1].
The binding or normative planning instruments in Chile, available in the legislation, correspond to the Territorial Planning Instruments [4,5]. These instruments are the Regional Urban Development Plan, the Intercommunal or Metropolitan Regulatory Plan, the Communal Regulatory Plan, the Sectional Plan, and the Urban Boundary [5]. The Territorial Planning Instruments are mainly concerned with the urban sector. In contrast, in the rural sector, there is a binding analogue corresponding to the Intercommunal Regulatory Plan [1], which is restricted to specific sectors of the rural sector. Its action is limited and is inclined towards urban and infrastructure aspects [6].
The Regional Development Strategies are associated with the regional territory, both urban and rural, and are indicative instruments that, based on strategic objectives and regional guidelines, promote economic and social development but are not aimed at specific territorial planning [7].
As a consequence of the absence of a comprehensive instrument at the regional level, in coherence with the Regional Development Strategies, the government promotes the Regional Land Use Plans (PROTs), which by definition guide the use of the region’s territory to achieve its sustainable development through strategic guidelines and macro-zoning [8,9]. These PROTs have a binding character regarding the location for providing infrastructure and productive activities in areas not included in urban planning, along with identifying areas for their preferential location” [9]. It is the only territorial planning instrument with a spatial expression that covers the rural territory, thus contributing to territorial planning and organization [7].
To date, and in the absence of developed and implemented PROTs, the different productive activities are arranged in the territory based on criteria of availability, private property (land and water) and economic factors rather than the territory’s carrying capacity [10]. With, in some cases, infrastructure projects and interventions in the territory being assessed individually by the Environmental Impact Assessment System [11], or practically without assessment in the case of agricultural activity [12].
The use of the territory to achieve sustainable development implies, among other things, considering the possible hazards to which the territory is exposed and identifying its vulnerability to them [10,13]. A relevant threat in our country is drought, currently called mega-drought, due to its extension over time [14].
In this context, given the decrease in water availability and the increase in water risk suffered by our country because of Climate Change [14,15,16], the effects of the threat of drought are becoming more recurrent in various areas of the country. This situation and the sustained increase in demand place us in a state of scarcity [17], which can be conceptualized as a threat derived from drought. Territories are vulnerable to this water situation, which can be tackled from various angles [18,19]. One of them is territorial planning, which could reduce the territory’s sensitivity to scarcity through the orientation of land use in space. For this work, vulnerability will be understood as the predisposition to be negatively affected [20,21]. These results from three main elements: Exposure, sensitivity, and the capacity to respond and adapt [21].
In this scenario, PROTs could contribute to the solution by reducing the levels of water vulnerability through the spatial management of water demand and, consequently, the management and protection of ecosystems that provide ecosystem services, including the provision of water [22]. In this sense, Carter et al. [23] indicate that territorial planning is a relevant tool in achieving objectives and addressing challenges related to the environment and, specifically, to water resources. In turn, the National Land Use Planning Policy of Costa Rica states that it is possible to reduce vulnerability through land use planning processes, exposing its potential in terms of its preventive approach associated with exposure and resilience [24].
The elaboration of the PROTs does not necessarily consider criteria oriented towards reducing the vulnerability to water scarcity, so the zoning of planned land use could have negative or positive effects. The potential of PROTs as tools to help mitigate this vulnerability and increase water security has not been evaluated, and their effects are unknown.
Parallel to understanding these concepts, and of equal importance, is to review how water security is understood. The term was most likely first used by the Global Water Partnership [25]. Although in the first discussions in which the term was used, it was in the context of concerns about water scarcity [26]. Today, the concept has evolved, and hence its definition, to such an extent that it is combined with other areas such as Integrated Water Resources Management (IWRM) [27]. As a result, IWRM has linked science, management, policy, and governance through an integrative debate on the means to achieve water security. However, because IWRM debates focus on specific case studies, the definition of water security has inevitably been case-dependent and primarily influenced by geography [27,28,29].
For a better understanding, this paper will take the definition of Water Security of the Framework Law on Climate Change, which defines Water Security as the possibility of access to water in adequate quantity and quality, considering the natural particularities of each basin, for its sustenance and use over time for human consumption, health, subsistence, socio-economic development, conservation and preservation of ecosystems, promoting resilience against threats associated with droughts and floods and the prevention of pollution [30,31]. In addition, this law contemplates a strategic instrument that seeks to address the adverse effects of climate change on water resources to safeguard water security; these are the strategic water resource plans.
The legal definition recognizes water uses that must be sustained in a Water Security scenario, these are i) human consumption and health; ii) socio-economic development; iii) conservation and preservation of ecosystems; and iv) resilience of the system to water-related hazards. The operationalization of the definition in indicators for its evaluation has been structured through four dimensions related to the uses and conditions of resilience mentioned above. For this reason, this study conceptualizes water security through four dimensions (see Figure 1): three focusing on consumptive and non-consumptive water uses and the fourth on associated risks. Each dimension has a further level of disaggregation, giving rise to sub-dimensions, at which level vulnerability indicators are applied.
In other words, the term Water Security is related to Vulnerability through the concept of Risk, corresponding to one of the four dimensions of Water Security. Risk, in turn, comprises three concepts: hazard, exposure and vulnerability. In addition, the concept of risk in the context of water security implies its management and the reduction of vulnerability [32], as well as the definition of an adequate or tolerable level of risk [31,33].
Considering the water situation in Chile, the question arises of whether PROTs, as planning instruments, contribute to better water security in watersheds. To answer this question, this paper takes four regions of Chile.
2. Materials and Methods
To approach this study, PROTs from four regions of Chile were used as case studies, representing four distinctive zones of this country: North, Centre, South and Extreme South. The selected regions are Atacama, Metropolitana de Santiago (from now on Metropolitana), the Los Ríos region, and the Aysén del General Carlos Ibáñez del Campo region (from now on Aysén), respectively (see Figure 2).
The reason for choosing these four regions is to cover different scenarios regarding water resource availability and productive activities. In this sense, the territory presented as a case study is not a conditioning or limiting element, as the objective is to understand the effects of the macro zoning of the PROT on water security through vulnerability indicators independent of the territory and its baseline conditions.
The selected regions exhibit hydrologically concerning precipitation and temperature projections. Projections indicate a decrease in precipitation of 5% to 15% in the Metropolitan, Los Ríos, and Aysén regions. In the Atacama region, however, projections are less specific [34]. A temperature increase of at least 1°C is projected for 2030-2060 compared to 1985-2015 (considering scenario 8.5) in the Atacama, Metropolitan, and Los Ríos regions. In the case of the Aysén Region, however, projections are uncertain [34]. In critical drought situations, Chilean water institutions issue declarations of water scarcity zones. From 2010 to 2024, the Atacama Region submitted 13 declarations of scarcity, the Metropolitan Region submitted 79, the Los Ríos Region submitted 2, and the Aysén Region submitted 1 [35]. A comparative analysis of the decrees reveals that the Atacama and Metropolitan Regions are experiencing more critical conditions.
About productive activities, in the Atacama Region, agriculture and mining are the activities with the highest water consumption at the regional level. In the Metropolitan Region, the activities with the highest water demand correspond to agriculture, drinking water, and electricity generation, the latter corresponding to non-consumptive demand. In the Los Ríos Region, the activities with the highest water demand correspond to industry, drinking water and the agricultural sector. In this region, there are also non-consumptive demands associated with electricity generation. Finally, in the Aysén Region, the most water-demanding activities are drinking water, mining and the agricultural sector; in this region, there are non-consumptive demands associated with aquaculture. The activities in the selected regions present the diversity of activities with the highest water demand in Chile [17].
In addition, the respective Regional Governments of each region have the necessary information to carry out the assessment proposed in this document. It should be noted that the plans of the Atacama, Metropolitan, and Los Ríos regions are not in force [9].
Once the representative regions of each zone had been selected, a specific selection was made. Because the aim was to carry out a vulnerability assessment at the basin level, work was carried out in the Copiapó River basin, the Maipo River basin, the Valdivia River basin, and the Aysén River basin.
All data used in this work is freely accessible and is available on the respective referenced websites. The methodology focuses mainly on obtaining the percentage value of the Water Security vulnerability indicator in two scenarios, one of the current uses (current territorial model without PROT) and another of the use proposed in the PROT (from now on PROT scenario); both scenarios will be obtained for each river basin (one per region), to subsequently compare the scenarios and see the effect that their respective PROTs have on them. It should be noted that the current territorial model corresponds to the land use scenario indicated in the PROTs in their diagnoses.
The formula for the Water Security vulnerability indicator (Equation (1)) [31] relates the water demand to the water availability of the basin under natural conditions; in other words, it describes what is extracted from the system to what is generated by the system itself.
Where V corresponds to the level of vulnerability associated with Water Security (percentage), and D corresponds to the annual demand of the uses under evaluation, in this study, agriculture, livestock, industry, mining, and ecological flow. Disp85% corresponds to the physical availability of water (average annual flow) with a probability of exceedance of 85%. This probability is associated with the return period containing 85% of the mean annual flow [36].
The base information used to calculate the indicators was obtained from state databases, technical reports, and scientific information.
Water Resource Availability
To estimate water availability with an 85% probability of exceedance, the denominator of the vulnerability indicator (Equation (1)), information from the CAMELS-CL explorer platform [37,38], was used, with data from at least 40 years. To approximate the availability under natural conditions, we opted to estimate the basin runoff through rainfall [39], using the empirical formula of Peñuelas (Equation (2)) [40] for the runoff of each basin.
Where P is the precipitation, and D is the deficit. In the second interval of the equation, Dmax corresponds to 0.5 m since all the precipitation runs off.
The runoff approximation satisfies the requirements for calculating the indicator [39]. And it is within the scope of this study. The use of fluviometric stations is discarded, as this would mean using stations both at the headwaters of all the tributaries of the basins and at the outlet of the basins, and to the latter should be added the upstream Water Use Rights (water abstractions). This approach assumes that all the Water Use Rights of the Public Water Cadastre are in use, which would overestimate the availability of the basin; it assumes that the Public Water Cadastre is complete and does not consider the inflows in the intermediate or lower basin.
Water Demand
The water demand estimation for the different land uses was based on approximating the consumption of the productive sectors, such as agriculture, mining, industry, and livestock. They are considering their production or surface area in the case of agriculture. The reason for using this approach is to establish a direct correlation between water consumption and the area allocated to agriculture, as well as water consumption and production for mining, industry, and livestock. The details of each productive sector are shown in the Supporting Information (SI).
- Agriculture. The methodology for calculating water demand is based on the study “Diagnosis of water demand in Northern Chile” [41], schematically presented in Figure 3. This methodology allows for estimating the Gross Irrigation Demand (GID) at the level of a given geographical unit, in this case, the river basin.
The Irrigated Area (IA) per crop was obtained through crop proportions [42,43]. Of the regions identified in the current and PROT scenarios. It should be noted that only the crop groups and types with the highest percentage representation in the region or province are considered (For more details, see SI).
Monthly crop coefficients (Kc) were used from various Water Road Project Evaluation Study references [44]. And Estimation of Current Demand and Future Projections [17]. Potential evapotranspiration (mm/month) (PEt) was obtained from the CAMELS-CL explorer platform [37,38], and used from 1979 to 2019.
Effective precipitation (EP) is the “fraction of rainfall that will be available to meet at least part of the water needs of plants”. It corresponds to the precipitated water stored in the root zone and available for use by the plant [41,45]. The formulas indicated by FAO are used to calculate EP (Equation (3)) [45].
Where, EP is the Effective Precipitation measured in millimeters per month (mm/month), and AP is the Average Precipitation measured in millimeters per month (mm/month). The latter was obtained between 1979 and 2019 from the CAMELS-CL explorer platform [37,38].
The Net Unit Demand (NUD) corresponds to the water needs of each basin according to crops (m3/month) [46]. For its calculation, the potential evapotranspiration (PEt), the crop coefficient (Kc), the effective precipitation (EP), and the irrigated area (IA) per crop type in the basin (m2) are required, following Equation (4). The “n” corresponds to the number of crops present in the catchment.
Irrigation efficiency (IE) was extracted from the Estimation of Current Demand and Future Projections [17]. Corresponding to 2015. This average value changes depending on the type of irrigation farmers own and the surfaces associated with these.
The Gross Irrigation Demand (GID) (m3/month) (Equation (5)) represents the amount of water that must be provided to the crop through the irrigation system, considering the water losses that the latter generates due to its inefficiencies [47].
It is important to note that the demand estimation for the four configurations of land use proposed by the PROTs does not consider climate change projections concerning PEt and Precipitation. The estimate is theoretical and aims to identify the flows that should be extracted for irrigation. This does not mean that these flows are abstracted for agricultural use.
- 2.
- Mining. The methodology used in estimating water demand corresponds to that published in the study on estimating current market and future projections of the DGA [17]. The estimate integrates the demands of large-scale copper mining, non-copper metal mining (gold, silver, and iron), and non-metallic mining.
In the study mentioned above, the estimation is based on three main aspects: regional mineral production and/or mineral production, which the mining companies report, the unit rate of water consumption (cubic meters of water per ton of ore processed), and finally the ore grade (concentration of ore present in the rocks and mineralized material of a deposit).
For the calculation at the river basin level, regional production was disaggregated based on the spatial location of active sites. Georeferenced cadastral information on active mining sites as of 2015 was obtained from DGA [17]. The estimation in the context of this study considers only the water demand of mining sites without desalinated water. This is because the vulnerability indicator comprises the relationship between demand and natural water availability in the basin without considering external sources.
The unit rates and copper ore grade used in calculating the PROT scenario land use configuration demand was taken from the COCHILCO statistics yearbook [48]. Precisely, the most current existing information by region was selected. The data indicated in the DGA’s Current Demand and Future Projections Study was used for Iron, Gold, and Zinc mining [17]. This demand is not estimated in the Valdivia River basin, as no reported mining operations exist (See Table S1 in SI).
- 3.
- Industry. The estimation of industrial water demand used the methodology of the DGA’s Estimation of Current Demand and Future Projections Study [17]. The study indicates that in our country, two realities are associated with water consumption in the industrial sector. The first concerns the industries that the sanitation companies supply. Therefore, their consumption is considered within the water demand of the sanitation companies, and the second corresponds to the industries that are supplied with water for their production from their sources, i.e., that capture water either from surface water or groundwater independent of the urban distribution system. There are no records for the latter, so the study proposes an indirect approximation through the records of industrial effluents (Pollutant Release and Transfer Register of the Ministry of the Environment).
Industrial use is a specific use, so the increase or decrease does not directly influence the increase or decrease in demand in the area allocated for industrial uses; therefore, for the calculation of industrial water demand in the PROT scenario, the demand projection for the year in which the Regional Development Strategies or PROT is in force is used, a projection based on the sectoral Gross Domestic Product made in the DGA study [17]. This study presents the geo-referencing of the industries that allowed the selection of those belonging to the basins under study.
Industries with non-consumptive water use (hydroelectric, fish farming) are not considered in the calculation of water demand since the calculation of the indicators is carried out at the river basin level, and only those uses that correspond to the extraction of water from the system (consumptive use) are of interest. This demand is not estimated in the Copiapó River basin as no information is associated with the basin in the industrial effluent register [17].
- 4.
- Livestock. The methodology used in estimating water demand corresponds to that published in the DGA’s Current Demand Estimation and Future Projections Study [17]. The estimate includes cattle, pigs, goats, poultry production, and other less-represented areas in Chile.
The demand estimate considers the livestock’s unit consumption per head [49,50,51]. And the number of livestock in the study area [42,52]. For those species without information, 10% of the live weight or usual values for each species are considered [17]. A quantity of water of 0.3 l/day for water for personnel is also considered.
It is essential to point out that the use of land to maintain livestock activity is considered within the analysis of agricultural activity. The agricultural estimate corresponds to the theoretical value of irrigation; therefore, those areas destined for forage are considered. Natural meadows were not considered in calculating agrarian demand because they do not correspond to irrigated land (rainfed). The number of head projections of the DGA study was considered to estimate the demand of the PROT scenario [17].
Ecological Flow
The ecological flow corresponds to the Water Security sub-dimension “protection and conservation of ecosystems.” The ecological flow was estimated based on Law [53], specifically the calculation rules associated with watercourses with ecological flow definitions corresponding to 10% of the average annual flow. It is calculated through runoff, using the average rainfall of the basin and the empirical formula of Peñuelas [40].
3. Results and Discussion
The availability, corresponding to the denominator of the vulnerability indicator, was estimated through runoff. This decision was made because the ideal information corresponds to the natural flow, information that is currently very difficult to calculate, and the cost of generating it is high, considering the scope of this work.
Given that the focus of the analysis is the change in water demand due to the implementation of the PROT, the water availability of the basin is a constant value between both scenarios under evaluation (current use scenario and PROT scenario). In this context, it is essential to make it explicit that the availability in the future scenario does not consider the impacts of climate change. It is also important to point out that other water sources were not considered when estimating the availability; therefore, the amounts of water from desalination plants currently in operation were not considered, nor were projections of their construction and execution in the territory.
The methodological adjustments associated with demand are structured based on the dimensions of water security set out in Figure 1. Each dimension presents sub-dimensions in which the water footprint of the specific use is related to the existing water availability for the use in question. In this assessment context and given that the analysis is at the basin level and annual temporality, methodological adjustments were made to calculate a single indicator at the basin level, considering the sum of the demands of the uses included in this analysis (current use and PROT zoning). The dimensions and sub-dimensions considered in the calculation of the indicator are set out below:
- Dimension 1. Water is of adequate and accessible quality and quantity for human consumption.
This dimension includes human consumption and subsistence activities. Neither use is considered from the perspective of the PROTs or the proposed zoning. The growth of cities or towns is not considered within the PROTs, being limited in most cases to maintaining current urban limits. This responds to the hierarchy of territorial planning instruments in our country, where the PROT does not have attributions for urban limits, with specific instruments existing in this area, such as urban boundaries and communal and intercommunal regulatory plans.
Regarding family subsistence activities, this use is also not explicitly considered in the land uses. Within the subsistence activities, we have agriculture and livestock farming, both considered in dimension 2 of sustainable, productive development.
After the above analysis, it was decided not to consider human consumption in both urban and rural areas and subsistence activities in the analysis because there is no surface area variation between current use and PROT zoning in spatial terms. Although the population trend is increasing, there is no intentionality (except for the Aysén region, which states in its development objectives “to increase the population based on a pattern of human settlements”) from the Regional Development Strategies regarding this issue or the growth of cities.
- Dimension 2. Water must be of adequate and accessible quality and quantity to ensure sustainable, productive development.
Within this dimension, there are two sub-dimensions: the first is limited to extractive uses (consumptive) and the second to non-extractive uses (non-consumptive). The extractive uses considered in the battery of indicators are mining, industry, agriculture, and forestry.
Concerning mining and industry, these uses are of an ad hoc nature, and the surface area available for these uses (if they are incorporated in the zoning) is not directly related to their demand. In these cases, the water demand is associated with the specific industry’s production level and not with the surface area made available or used by the use. The categories named “mining interest” in the zoning do not imply that all of them are used for mining activity, nor that there is mining development in the same period. This is why the approach to mining and industrial use will not be related to the surface area allocated to each. Still, methodologies and assumptions will be used to estimate the current demand and projections in the DGA study [17]. These uses are included in the analysis due to the intentionality of growth and momentum recognized in the Regional Development Strategies and because they correspond to activities of regional relevance.
As for agriculture, water demand is closely related to the surface area and the irrigation system of the crops, so it was estimated through a theoretical approximation. Unlike other mining and industrial uses, this approach does not consider databases of water abstracted for production, which, in that case, is water for irrigation. This approach finds estimates of the water requirements of a crop in consideration of historical climatic information and production characteristics (type of irrigation, crop, etc.). Livestock use is not explicit in the description of the indicator; however, it will be considered since it is of national relevance. Like mining and industrial use, livestock use was estimated through the production projections contained in the DGA study [17]. which only finds the drinking consumption of the animals, as the water demand associated with the cultivation of fodder is considered within the agricultural use.
Consideration of the green footprint in the calculation of water demands was ruled out, given that the effective precipitation used in the evapotranspiration process is not considered in the water availability; based on the methodological approach for estimating this availability, the approximation of availability corresponds to the estimate of runoff from the basin through precipitation from the basins under study; therefore the consideration of the green footprint would imply an overestimation of the demand. In this sense, forestry consumption is discarded from the accounting of water demand, both plantations and the use of preservation and conservation (native forests). This study is limited to the variation in water demand associated with water abstractions. The effects of the proposed PROT planning on water availability are beyond the scope of this study.
The sub-dimension of non-extractive uses considers aquaculture, tourism, and energy. These uses were not considered in this study because the scale of analysis is the river basin, and therefore, non-consumptive uses do not influence the water balance. This analysis becomes valuable when indicators are assessed at river basin sections or stretches.
- Dimension 3. Water bodies in quantity and quality guarantee human health, the environment, and different uses.
This dimension comprises two sub-dimensions, the first called ecosystem protection and conservation, and the second called pollution control. The sub-dimension of protection and preservation of ecosystems points to the consideration of ecological flow, this being the water demand necessary for the maintenance of ecosystems. The ecological flow was included as water demand in the calculation of the indicator, for which purpose it was estimated from the estimated runoff. It should be noted that the approximation established in Chilean law was considered an approximation that seeks the constant passage of a minimum ecological flow.
The analysis does not consider the second sub-dimension corresponding to pollution control, as it is associated with the grey footprint, which corresponds to the water required to dissolve pollutants. It is not considered because this use does not alter the water balance at the river basin level, as the dilution flows correspond to volumes of water in the natural source used downstream by other water users.
The objective of the application of the indicator is to identify how the indicator varies concerning the changes proposed from a current use to a proposed use, established based on the zoning proposed in the PROT and the intentions set out in the Regional Development Strategies. Therefore, the data recovered from the current and proposed use mapping (the two moments of analysis) is the surface area destined for use. Likewise, from the Regional Development Strategies, the productive activities indicated as part of the regions’ development are identified, thus identifying the intentionality of growth associated with these activities (land uses).
It is essential to point out that the values obtained from the calculation of the indicators correspond to orders of magnitude that allow for a comparison of moments of analysis, i.e., the value taken by the indicator at the current moment (current use) is used exclusively in contrast with the second moment of analysis corresponding to the zoning proposed in the PROT (future horizon) in the basin.
Table 1 shows the results of applying the vulnerability indicator for the current use scenario and the future scenario given by the proposed PROT zoning. As discussed in the methodology, the vulnerability indicator relates water demand and availability with a probability of exceedance of 85%. When the indicator takes the value of 100%, it indicates that water demand equals availability with an 85% probability of surplus, i.e., all available water is consumed under a low flow scenario. Values less than 100% indicate a less vulnerable situation, as water demand is less than available. Scenarios with values greater than 100% indicate situations with water vulnerability, meaning that demand exceeds availability. The Water Security study from which this indicator originates proposes a qualitative scale where an indicator with a value greater than 100% corresponds to a severe level of vulnerability, a value between 85% and 100% indicates a moderate level of vulnerability, and a value less than 85% indicates low vulnerability [31].
The approach followed in this study considers the assessment of the state of territorial vulnerability to water scarcity without considering elements of sensitivity and resilience that would explain the level of vulnerability registered in each territory. This approach is practical when considering the demand-availability relationship, which is relative and applicable only when comparing scenarios in the same territory. However, for a larger scale and more complex assessment, it is recommended that elements be incorporated to evaluate the sensitivity of the basins to the hazard and the response and adaptation capacity.
The values shown in Table 1 correspond to orders of magnitude because the numerical value is constructed based on water demand and availability estimates. Nevertheless, the order of magnitude is sufficient for this study.
The Copiapó and Maipo river basins are in severe vulnerability in both scenarios. In the case of the Copiapó river basin, water demand exceeds water availability by 24 and 27 times, with an 85% probability of surplus in the current and future scenarios, respectively. This implies an increase in vulnerability of 9.35% in the Copiapó River basin from the current scenario to the one projected with the use of the PROT. This change in vulnerability levels could be seen as a minor increase. However, the current situation of the basin is already critical (severe vulnerability level), and the scenario coming from the PROT increases this situation. In the Maipo River basin, the availability is exceeded by more than 2.5 times in both scenarios. The percentage change from the current scenario to the PROT scenario is approximately 11.8%, corresponding to an increase in the severity of the basin’s vulnerability. It is important to remember that the estimates do not consider the effects of climate change. This situation could be even more severe given the projected decrease in rainfall (impact on availability) and temperature increase (increase in evapotranspiration) [54].
In the Copiapó river basin, the Regional Development Strategies catalogue the water resource as a driving force and address it from multiple spheres (physical, regulatory, and management). In the case of the Maipo River basin, water is considered a barrier to unsustainability. This recognition of water resources in the region’s development is not in line with the future effects that the implementation of their PROTs would entail. This is visualized in the zoning methodologies used in the four PROTs, which incorporate risks from exposure.
The Valdivia River basin has a low vulnerability level in both scenarios. In this basin, the ecological flow has satisfied its water requirements (based on the Chilean conceptualization of ecological flow). This may be due to the region’s high water availability, the type of territorial development promoted, and development based on protecting its identity, river region, and natural values. The indicator shows a low percentage change and is within the range defined as low vulnerability. However, the assessment indicates that PROT zoning in the Valdivia River basin increases baseline vulnerability.
In the Copiapó, Maipo, and Valdivia River basins, the percentage growth of the vulnerability indicator increases by 9.4, 11.8, and 3.4, respectively; the only basin studied that has a slight tendency to decrease is the Aysén basin.
The evaluation presents opportunities for improvement related to the sources of information, for example, the incorporation of climate change projections, and the use of coupled hydrological models that consider both surface water and groundwater. However, it is essential to note that not all watersheds in Chile have coupled hydrological models and the necessary information for their implementation [55]. Demand estimation could be improved by collecting information at the local level, specifically, irrigation efficiency and use coefficients in industry and mining.
5. Conclusions
In general terms, there are no significant numerical variations between the current scenario and the one proposed by the PROTs in the four basins included in this study. However, very relevant information can be derived. Firstly, by comparing the water demand of each sector between scenarios, it is possible to appreciate the repercussions of the different intentions set out in the Regional Development Strategies in the basins. The demand (both Water Demand and Anthropogenic Water Demand) in three of the four basins increased, except for the Aysén River basin, understanding that this region prioritizes its development around water resources based mainly on the development of research and productive activities such as tourism and aquaculture (non-consumptive uses). Despite this, the vulnerability indicator, with and without consideration of ecological flow, does not manage to mark a considerable difference between scenarios.
The future scenario established by the PROT in both basins, Río Copiapó and Río Maipo, presents a higher value in the vulnerability indicator, indicating that the PROT proposal and the intentionality set out in the Regional Development Strategies have negative repercussions on the level of vulnerability to water scarcity. Even though water is considered relevant for development in both regions, in this scenario and climate change projections, it is worthwhile to continue researching and looking for development mechanisms that increase people’s quality of life but maintain low vulnerability to different hazards.
Changes in productive processes that imply increases in water efficiency could help maintain the values of the vulnerability indicator; however, given development aspirations and the pressure on water resources, it is very likely that water efficiency will not be sufficient in the long term. In this sense, it is essential to diversify the strategies of the State and the private sector to reduce water use, increase productivity, and reduce the vulnerability of watersheds (reduce sensitivity and increase resilience). This work is based on the Chilean reality. However, this problem is not foreign to the rest of the world.56 Although all countries have different realities, they present similar needs, and the level of response can be extrapolated.
It should be noted that using PROTs to manage the demand for water resources does not a priori ensure an increase in water security since, for this to be achieved, it is necessary to provide the inclusion of other factors, such as the correct analysis and proposal of planning criteria, which are crucial to reducing vulnerability and which unfortunately have not been taken into account in the four river basins. The PROTs analyzed in this work do not incorporate direct and explicit planning criteria. However, this comprehensive analysis has allowed us to recognize elements that have the potential to be used in the PROTs to reduce vulnerability and thus ensure water security. Some relevant elements that should be considered are the ERD (Regional development strategy) and the location conditions for the different activities. The ERD functions as the navigation chart of the regions, delineating the development aspirations that contribute to more resilient territories in the face of the effects of climate change (decreases in water availability). Furthermore, when the ERD stipulates the context and objective to address the water condition, indicators should be incorporated to assess that impact during the development of the PROTs and their implementation. These indicators should reflect the level of water scarcity. Moreover, in the context of the prevailing climate crisis, it is imperative to adopt a risk-based approach in these instruments and to encompass hazards from two perspectives: firstly, exposure to these hazards, and secondly, the sensitivity and resilience of the regions concerned. The results presented above demonstrate the impact of land-use changes given development objectives. In this sense, it is essential to investigate the possibilities of incorporating location conditions for different activities in the PROT, depending on the territorial context in which they are located. It is necessary to understand that all PROTs coexist with greater or equal hierarchy regulations, which strongly limit the instrument’s potential.
It is important to note that this assessment could be applied to other plans that have an impact or consequence on water consumption in the basins, e.g., inter-communal regulatory plans and strategic water resource plans, in order to foresee the consequences and take the necessary safeguards.
Supplementary Materials
The following supporting information can be downloaded at: Preprints.org, methodological details of agriculture and mining (Table S1).
Author Contributions
Conceptualization, K.S-U., A.V. and R.F.; methodology, K.S-U., R.B-G., A.V and R.F.; validation, K.S-U. and R.B-G.; formal analysis, K.S-U.; investigation, K.S-U. and R.B-G.; writing—original draft preparation, K.S-U. and R.B-G.; writing—review and editing, K.S-U., R.B-G., A.V and R.F.; visualization, K.S-U. and R.B-G.; supervision, R.F.; project administration, K.S-U.; funding acquisition, R.F. All authors have read and agreed to the published version of the manuscript.
Funding
This research was funded by FONDECYT, grant number 1241631.
Data Availability Statement
The data that support the findings of this study are available from the corresponding author upon reasonable request.
Acknowledgments
The author (RF) thanks the financial support of the National Agency for Research and Development (ANID) through FONDECYT project 1241631.
Conflicts of Interest
The authors declare no conflicts of interest.
Abbreviations
| PROTs | Regional Land Use Plans, its acronym in Spanish |
| SUBDERE | Undersecretariat for Regional and Administrative Development, its acronym in Spanish |
| IWRM | Integrated Water Resources Management |
| GID | Gross Irrigation Demand |
| IA | Irrigated Area |
| Kc | Crop coefficients |
| PEt | Potential evapotranspiration |
| EP | Effective precipitation |
| IE | Irrigation Efficiency |
| AP | Average Precipitation |
| NUD | Net Unit Demand |
| DGA | General Department of Water, its acronym in Spanish |
| ERD | Regional Development Strategy, its acronym in Spanish |
References
- Fuentes, M. Legal and Doctrinal Analysis of Land Use and Planning in Chile, Characteristics, Relationship and Differences. Sustainability, Agri, Food and Environmental Research 2015, 3, 12–21. [Google Scholar] [CrossRef]
- Bustos, N. Territorial Planning in Chile: Elements for Discussion. Rev. De Geogr. Norte Gd. 1998, 49–53. [Google Scholar]
- Ministerio de Obras Públicas y Urbanismo. European Spatial Development Charter. Madrid 1983.
- Ministerio de Vivienda y Urbanismo. General Law on Urban Planning and Construction; Santiago, Chile, 1976. https://www.bcn.cl/leychile/navegar?idNorma=13560 (accessed 2024-09-15).
- Ministerio de Vivienda y Urbanismo. Sets New Text of the General Ordinance of the General Law on Urban Planning and Construction; Santiago, Chile, 1992. https://www.bcn.cl/leychile/navegar?idNorma=8201 (accessed 2024-09-15).
- Infante, P. Environmental (Un)Justice in Chile and Main Mechanisms to Mitigate Inequality: Land Use Planning and Rights of Vulnerable Communities. Revista de Derecho Ambiental 2016, (6), 143–163. [Google Scholar]
- Precht, A.; Reyes, S.; Salamanca, C. Land Use Planning in Chile; Ediciones UC: Santiago, Chile, 2016. [Google Scholar]
- SUBDERE. Land Use Plan: Contents and Procedures, First Edit.; Torrealba y Asociados: Santiago, Chile, 2011. [Google Scholar]
- Ministerio del Interior y Seguridad Pública. Law 21074. Strengthening the Regionalisation of the Country; Santiago, Chile, 2018. https://www.bcn.cl/leychile/navegar?idNorma=1115064 (accessed 2025-05-21).
- Lagos, M.; Hidalgo, R.; Arenas, F. Natural Hazards in Land Use Planning. Public Agenda items 2010, 5, 1–11. [Google Scholar]
- Huneeus, S.; Toro, S.; Luna, J. P.; Sazo, D.; Cruz, A.; Alcatruz, D.; Castillo, B.; Bertranou, C.; Cisterna, J. Delayed and Approved: A Quantitative Study of Conflicts and the Environmental Impact Assessments of Energy Projects in Chile 2012–2017. Sustainability 2021, 13, 6986. [Google Scholar] [CrossRef]
- Ministerio del Medio Ambiente. Decree 40. Approves the Regulation of the Environmental Impact Assessment System; Santiago, Chile, 2013. https://www.bcn.cl/leychile/navegar?idNorma=1053563 (accessed 2024-09-15).
- SUBDERE. Natural Hazards Analysis Guide for Land Use Planning, First Edit.; Torrealba y Asociados: Santiago, Chile, 2011. [Google Scholar]
- Centro de Ciencia del Clima y la Resiliencia. Report to the Nation. The 2010-2015 Megadrought: A Lesson for the Future; CR2: Santiago, Chile, 2015. [Google Scholar]
- Garreaud, R. D.; Alvarez-Garreton, C.; Barichivich, J.; Pablo Boisier, J.; Christie, D.; Galleguillos, M.; LeQuesne, C.; McPhee, J.; Zambrano-Bigiarini, M. The 2010-2015 Megadrought in Central Chile: Impacts on Regional Hydroclimate and Vegetation. Hydrol Earth Syst Sci 2017, 21, 6307–6327. [Google Scholar] [CrossRef]
- Boisier, J. P.; Alvarez-Garreton, C.; Cordero, R. R.; Damiani, A.; Gallardo, L.; Garreaud, R. D.; Lambert, F.; Ramallo, C.; Rojas, M.; Rondanelli, R. Anthropogenic Drying in Central-Southern Chile Evidenced by Long-Term Observations and Climate Model Simulations. Elementa: Science of the Anthropocene 2018, 6. [CrossRef]
- Hídrica Consultores; AQUATERRA Ingenieros. Estimation of Current Demand, Future Projections and Characterisation of the Quality of Water Resources in Chile; Dirección General de Aguas. División de Estudios y Planificación: Santiago, Chile, 2017. [Google Scholar]
- He, C.; Liu, Z.; Wu, J.; Pan, X.; Fang, Z.; Li, J.; Bryan, B. A. Future Global Urban Water Scarcity and Potential Solutions. Nat Commun 2021, 12, 4667. [Google Scholar] [CrossRef] [PubMed]
- Donoso, G. Overall Assessment of Chile’s Water Policy and Its Challenges. In Water Policy in Chile; Donoso, G., Ed.; Springer International Publishing: Cham, 2018. [Google Scholar] [CrossRef]
- Urquiza, A.; Cadenas, H. Socio-Ecological Systems: Theoretical and Conceptual Elements to Understand the Debate on Water-Related Vulnerability. L’Ordinaire des Amériques 2015, 218, 2–18. [Google Scholar] [CrossRef]
- IPCC. Climate Change 2014: Impacts, Adaptation and Vulnerability. Summaries, Frequently Asked Questions and Multi-Chapter Boxes. Contribution of Working Group II to the Fifth Assessment Report of the Intergovernmental Panel on Climate Change; Field, C. B., Barros, V. R., Dokken, D. J., Mach, K. J., Mastrandrea, M. D., Bilir, T. E., Chatterjee, M., Ebi, K. L., Estrada, Y. O., Genova, R. C., Girma, B., Kissel, E. S., Levy, A. N., MacCracken, S., Mastrandrea, P. R., White, L. L., Eds.; 2014.
- Millennium Ecosystem Assessment. Ecosystems and Human Well-Being: A Framework for Assessment. A Report of the Conceptual Framework Working Group; Island Press: Washington, DC, USA, 2003. [Google Scholar]
- Carter, J. G. Spatial Planning, Water and the Water Framework Directive: Insights from Theory and Practice. Geographical journal 2007, 173, 330–342. [Google Scholar] [CrossRef]
- Ministerio de Vivienda y Asentamientos Humanos. National Land Use Planning Policy 2012 to 2040; República de Costa Rica, 2012.
- Varady, R. G.; Zuniga-Teran, A. A.; Garfin, G. M.; Martín, F.; Vicuña, S. Adaptive Management and Water Security in a Global Context: Definitions, Concepts, and Examples. Curr Opin Environ Sustain 2016, 21, 70–77. [Google Scholar] [CrossRef]
- Starr, J. R. Water Wars. Foreign Policy 1991, No. 82, 17–36. [Google Scholar] [CrossRef]
- Cook, C.; Bakker, K. Water Security: Debating an Emerging Paradigm. Global Environmental Change 2012, 22, 94–102. [Google Scholar] [CrossRef]
- Zeitoun, M.; Allan, J. A. (Tony); Mohieldeen, Y. Virtual Water ‘Flows’ of the Nile Basin, 1998–2004: A First Approximation and Implications for Water Security. Global Environmental Change 2010, 20, 229–242. [Google Scholar] [CrossRef]
- Xia, J.; Zhang, L.; Liu, C.; Yu, J. Towards Better Water Security in North China. Water Resources Management 2007, 21, 233–247. [Google Scholar] [CrossRef]
- Ministerio del Medio Ambiente. Law 21455. Framework Law on Climate Change; Santiago, Chile, 2022. https://www.bcn.cl/leychile/navegar?idNorma=1177286 (accessed 2024-09-15).
- Fuster, R.; Escobar, C.; Astorga, K.; Silva, K.; Aldunce, P. Study of Water Security in Chile in a Context of Climate Change for the Elaboration of the Plan for the Adaptation of Water Resources to Climate Change. Ministerio de Medio Ambiente, Laboratorio de Análisis Territorial de la Universidad de Chile: Santiago, Chile 2017.
- Hoekstra, A. Y.; Buurman, J.; van Ginkel, K. C. H. Urban Water Security: A Review. Environmental Research Letters 2018, 13. [Google Scholar] [CrossRef]
- Grey, D.; Garrick, D.; Blackmore, D.; Kelman, J.; Muller, M.; Sadoff, C. Water Security in One Blue Planet: Twenty-First Century Policy Challenges for Science. Philosophical Transactions of the Royal Society A: Mathematical, Physical and Engineering Sciences 2013, 371. [CrossRef]
- Bambach, N.; Morales-Moraga, D.; Meza, F. Tendencias y Proyecciones de Cambio Climático. In Cambio climático en Chile: Ciencia, Mitigación y Adaptación.; Castilla, J., Meza, F., Vicuña, S., Marquet, P., Monteros, J., Eds.; 2019; pp 85–98.
- Dirección General de Aguas. Scarcity Decrees. https://dga.mop.gob.cl/derechos-de-agua/proteccion-de-las-fuentes/decretos-de-escasez-2/. https://dga.mop.gob.cl/derechos-de-agua/proteccion-de-las-fuentes/decretos-de-escasez-2 (accessed 2025-05-10).
- Espíldora, B.; Brown, E.; Cabrera, G.; Isensee, P. Elements of Hydrology; Centro de Recursos Hidráulicos, Departamento de Obras Civiles, Facultad de Ciencias Físicas y Matemáticas, Universidad de Chile. Santiago: Santiago, Chile, 1975. [Google Scholar]
- Alvarez-Garreton, C.; Mendoza, P. A.; Pablo Boisier, J.; Addor, N.; Galleguillos, M.; Zambrano-Bigiarini, M.; Lara, A.; Puelma, C.; Cortes, G.; Garreaud, R.; McPhee, J.; Ayala, A. The CAMELS-CL Dataset: Catchment Attributes and Meteorology for Large Sample Studies-Chile Dataset. Hydrol Earth Syst Sci 2018, 22, 5817–5846. [Google Scholar] [CrossRef]
- Centro de Ciencia del Clima y la Resiliencia. CAMELS-CL explorer. https://camels.cr2.cl/ (accessed 2024-09-15).
- Arumí, J. L.; Jara, J.; Salgado, L. Hydrological Analysis; Facultad de Ingeniería Agrícola, Universidad de Concepción: Concepción, Chile, 2000. [Google Scholar]
- Stöwhas, L. Fundamentals of Applied Hydrology; Editorial USM, 2017.
- Laboratorio de Análisis Territorial (LAT). Diagnosis of Water Demand in the North of Chile; Comisión Nacional de Riego: Santiago, Chile, 2013. [Google Scholar]
- Instituto Nacional de Estadística. Agricultural Census 2007. https://www.ine.gob.cl/estadisticas/economia/agricultura-agroindustria-y-pesca/censos-agropecuarios (accessed 2024-09-15).
- Oficina de Estudios y Políticas Agrarias. Fruit and Wine Cadaster. https://www.odepa.gob.cl/estadisticas-del-sector/catastros-fruticolas (accessed 2021-04-11).
- Laboratorio de Análisis Territorial (LAT); Advanced Mining Technology Cente (AMTC). Project Evaluation of a National Water Road - Phase 1: Inventory of Water Supply and Demand across the Chilean Geography; Santiago, Chile, 2019.
- FAO. Manual on Rainwater Harvesting and Use. Experiences in Latin America. Serie: Zonas Áridas y Semiáridas 2000, 13, 224.
- Allen, R. G.; Pereira, L. S.; Raes, D.; Smith, M. Crop Evapotranspiration: Guidelines for Determining Crop Water Requirements; FAO: Roma, 2006. [Google Scholar]
- Reckmann, O.; Hirzel, J.; Antunez, A. Technological Irrigation Node in the Dry Land O’higgins Region Phase II. Boletín INIA 2009, (190), 120.
- Ocaranza, J. Yearbook of Statistics on Copper and Other Minerals 2000 - 2019; COCHILCO: Santiago, Chile, 2019. [Google Scholar]
- Romero, O.; Bravo, S. Fundamentals of Sheep Production in the Araucanía Region. Boletín INIA 2012, (245), 207.
- Dirección General de Aguas; Fundación Chile. Water Footprint Report in Chile. Priority Sectors of the Rapel River Basin. Final Report.; 2016.
- Ministerio de Obras Públicas. Decree 177. Approves Uses Not Contemplated in the Table of Equivalence between Water Flows and Uses of Decree No. 743 of 2005 and Rectifies the Definition of Use in Hydroelectric Generation by Run-of-River Power Plants; Santiago, Chile, 2012. https://www.bcn.cl/leychile/navegar?i=1041160 (accessed 2024-09-15).
- Oficina de Estudios y Políticas Agrarias. Livestock Surveys. https://bibliotecadigital.odepa.gob.cl/handle/20.500.12650/69781/browse?type=dateissued (accessed 2024-09-15).
- Ministerio del Medio Ambiente. Approves regulations for the determination of the Minimum Ecological Flow; Santiago, Chile, 2013. https://www.bcn.cl/leychile/navegar?idNorma=1053200 (accessed 2024-09-15).
- IPCC. Summary for Policymakers. In Climate Change 2022 – Impacts, Adaptation and Vulnerability. Contribution of Working Group II to the Sixth Assessment Report of the Intergovernmental Panel on Climate Change; H.-O. Pörtner, D.C. Roberts, E.S. Poloczanska, K. Mintenbeck, M. Tignor, A. Alegría, M. Craig, S. Langsdorf, S. Löschke, V. Möller, A. Okem, Eds.; Cambridge University Press, 2022; pp 3–34. [CrossRef]
- Dirección General de Aguas. National Water Balance Update. SIT N° 417. Carried out by Universidad de Chile and Pontificia Universidad Católica de Chile: Santiago, Chile 2017, p 378.
- Fragkou, M.; Dias Tadeu, N.; Empinotti, V.; Fuster, R.; Oré, M.; Rojas, F.; Urquiza, A.; Wagner, L. Chapter 8: Water Scarcity in Latin America. In Routledge Handbook of Latin America and the Environment.; Bustos, B., Mauro, S. E.-D., García-López, G., Milanez, F., Ojeda, D., Eds.; Taylor and Francis., 2023; p 11. [CrossRef]
Figure 1.
Dimensions and sub-dimensions of Water Security.
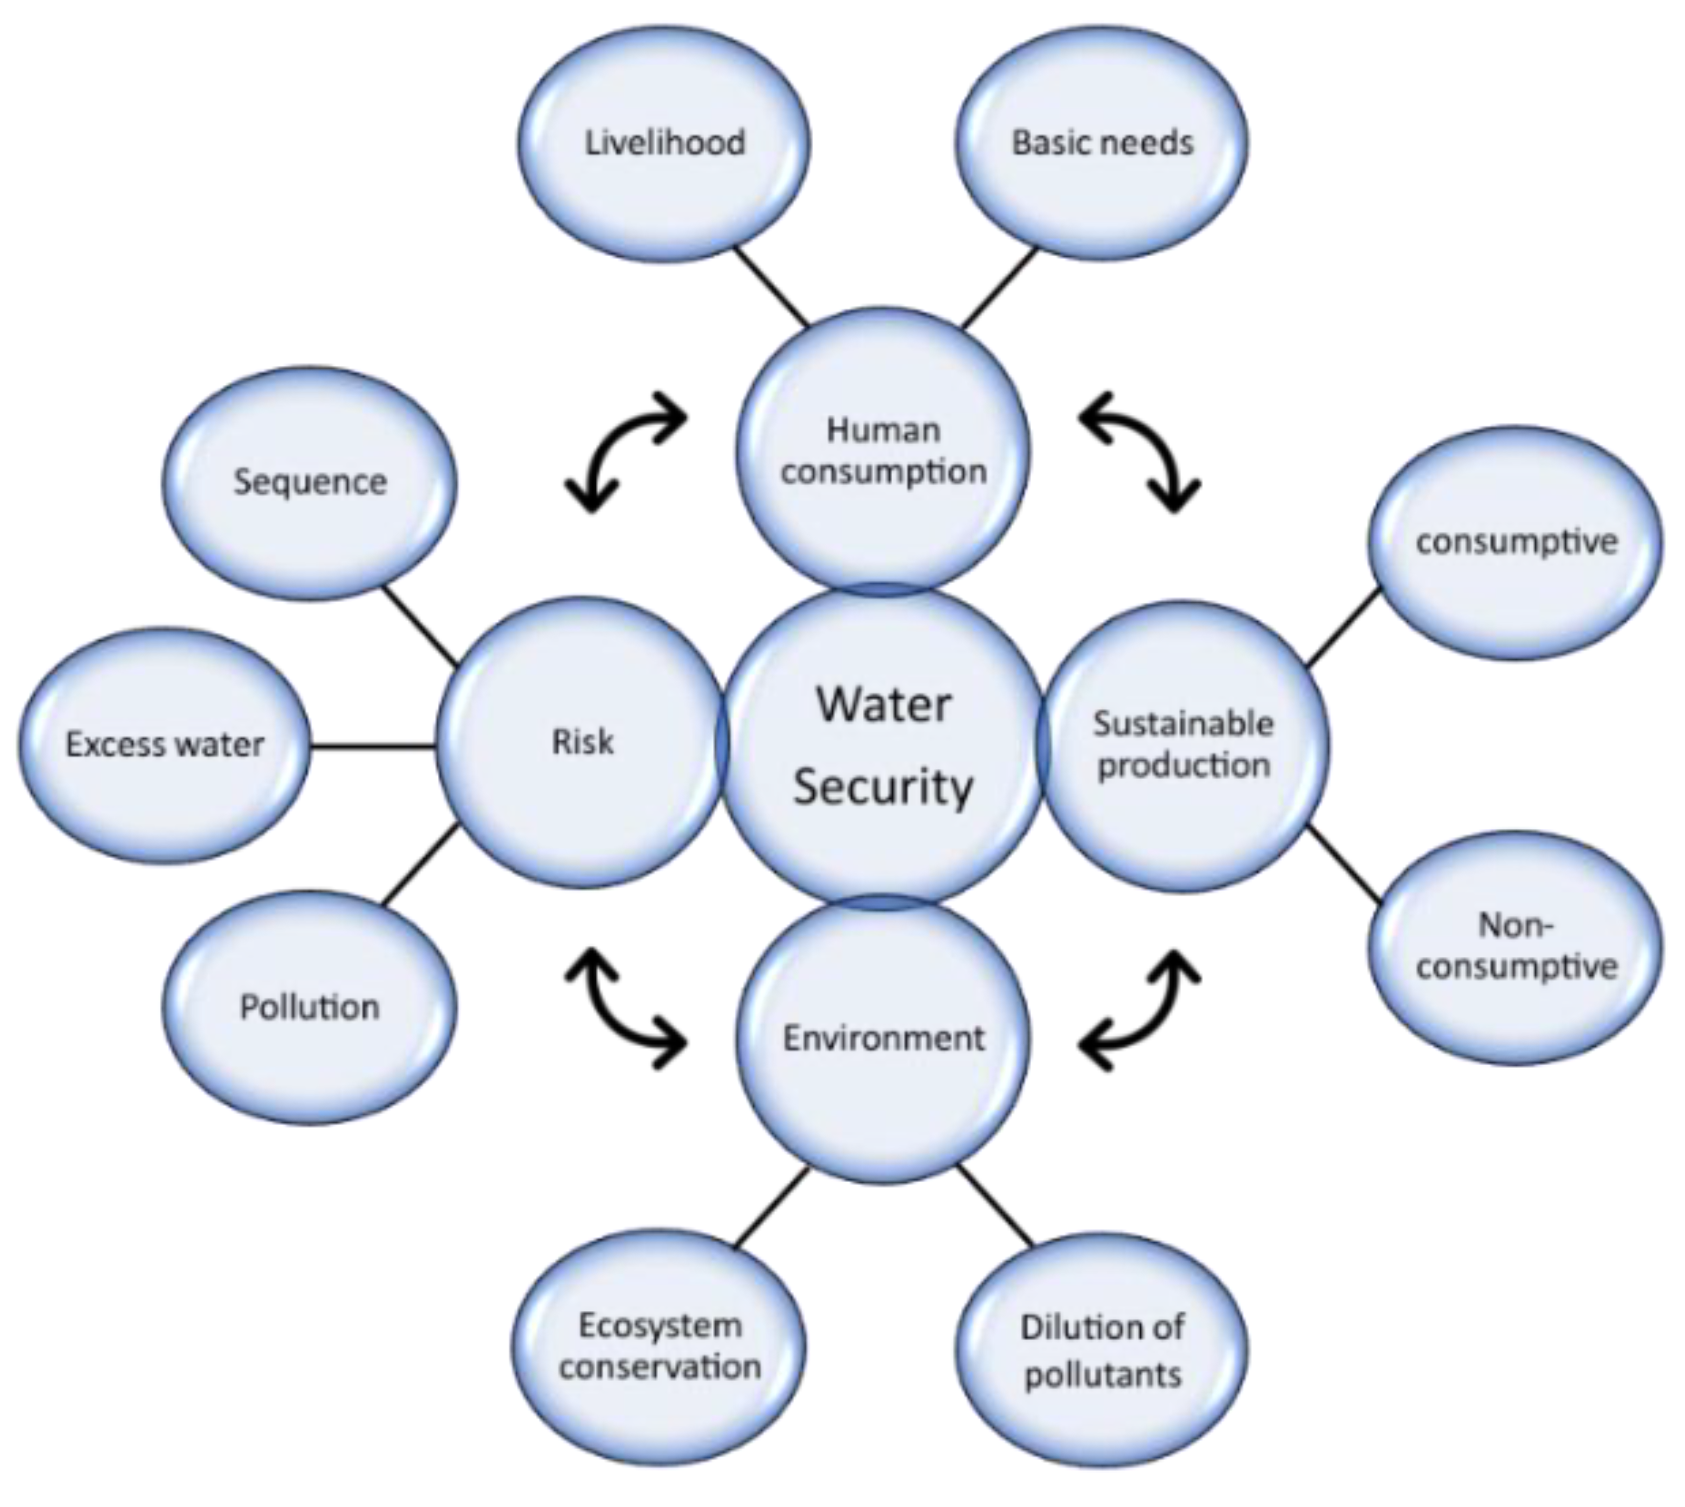
Figure 2.
Regions and basins correspond to the case studies.
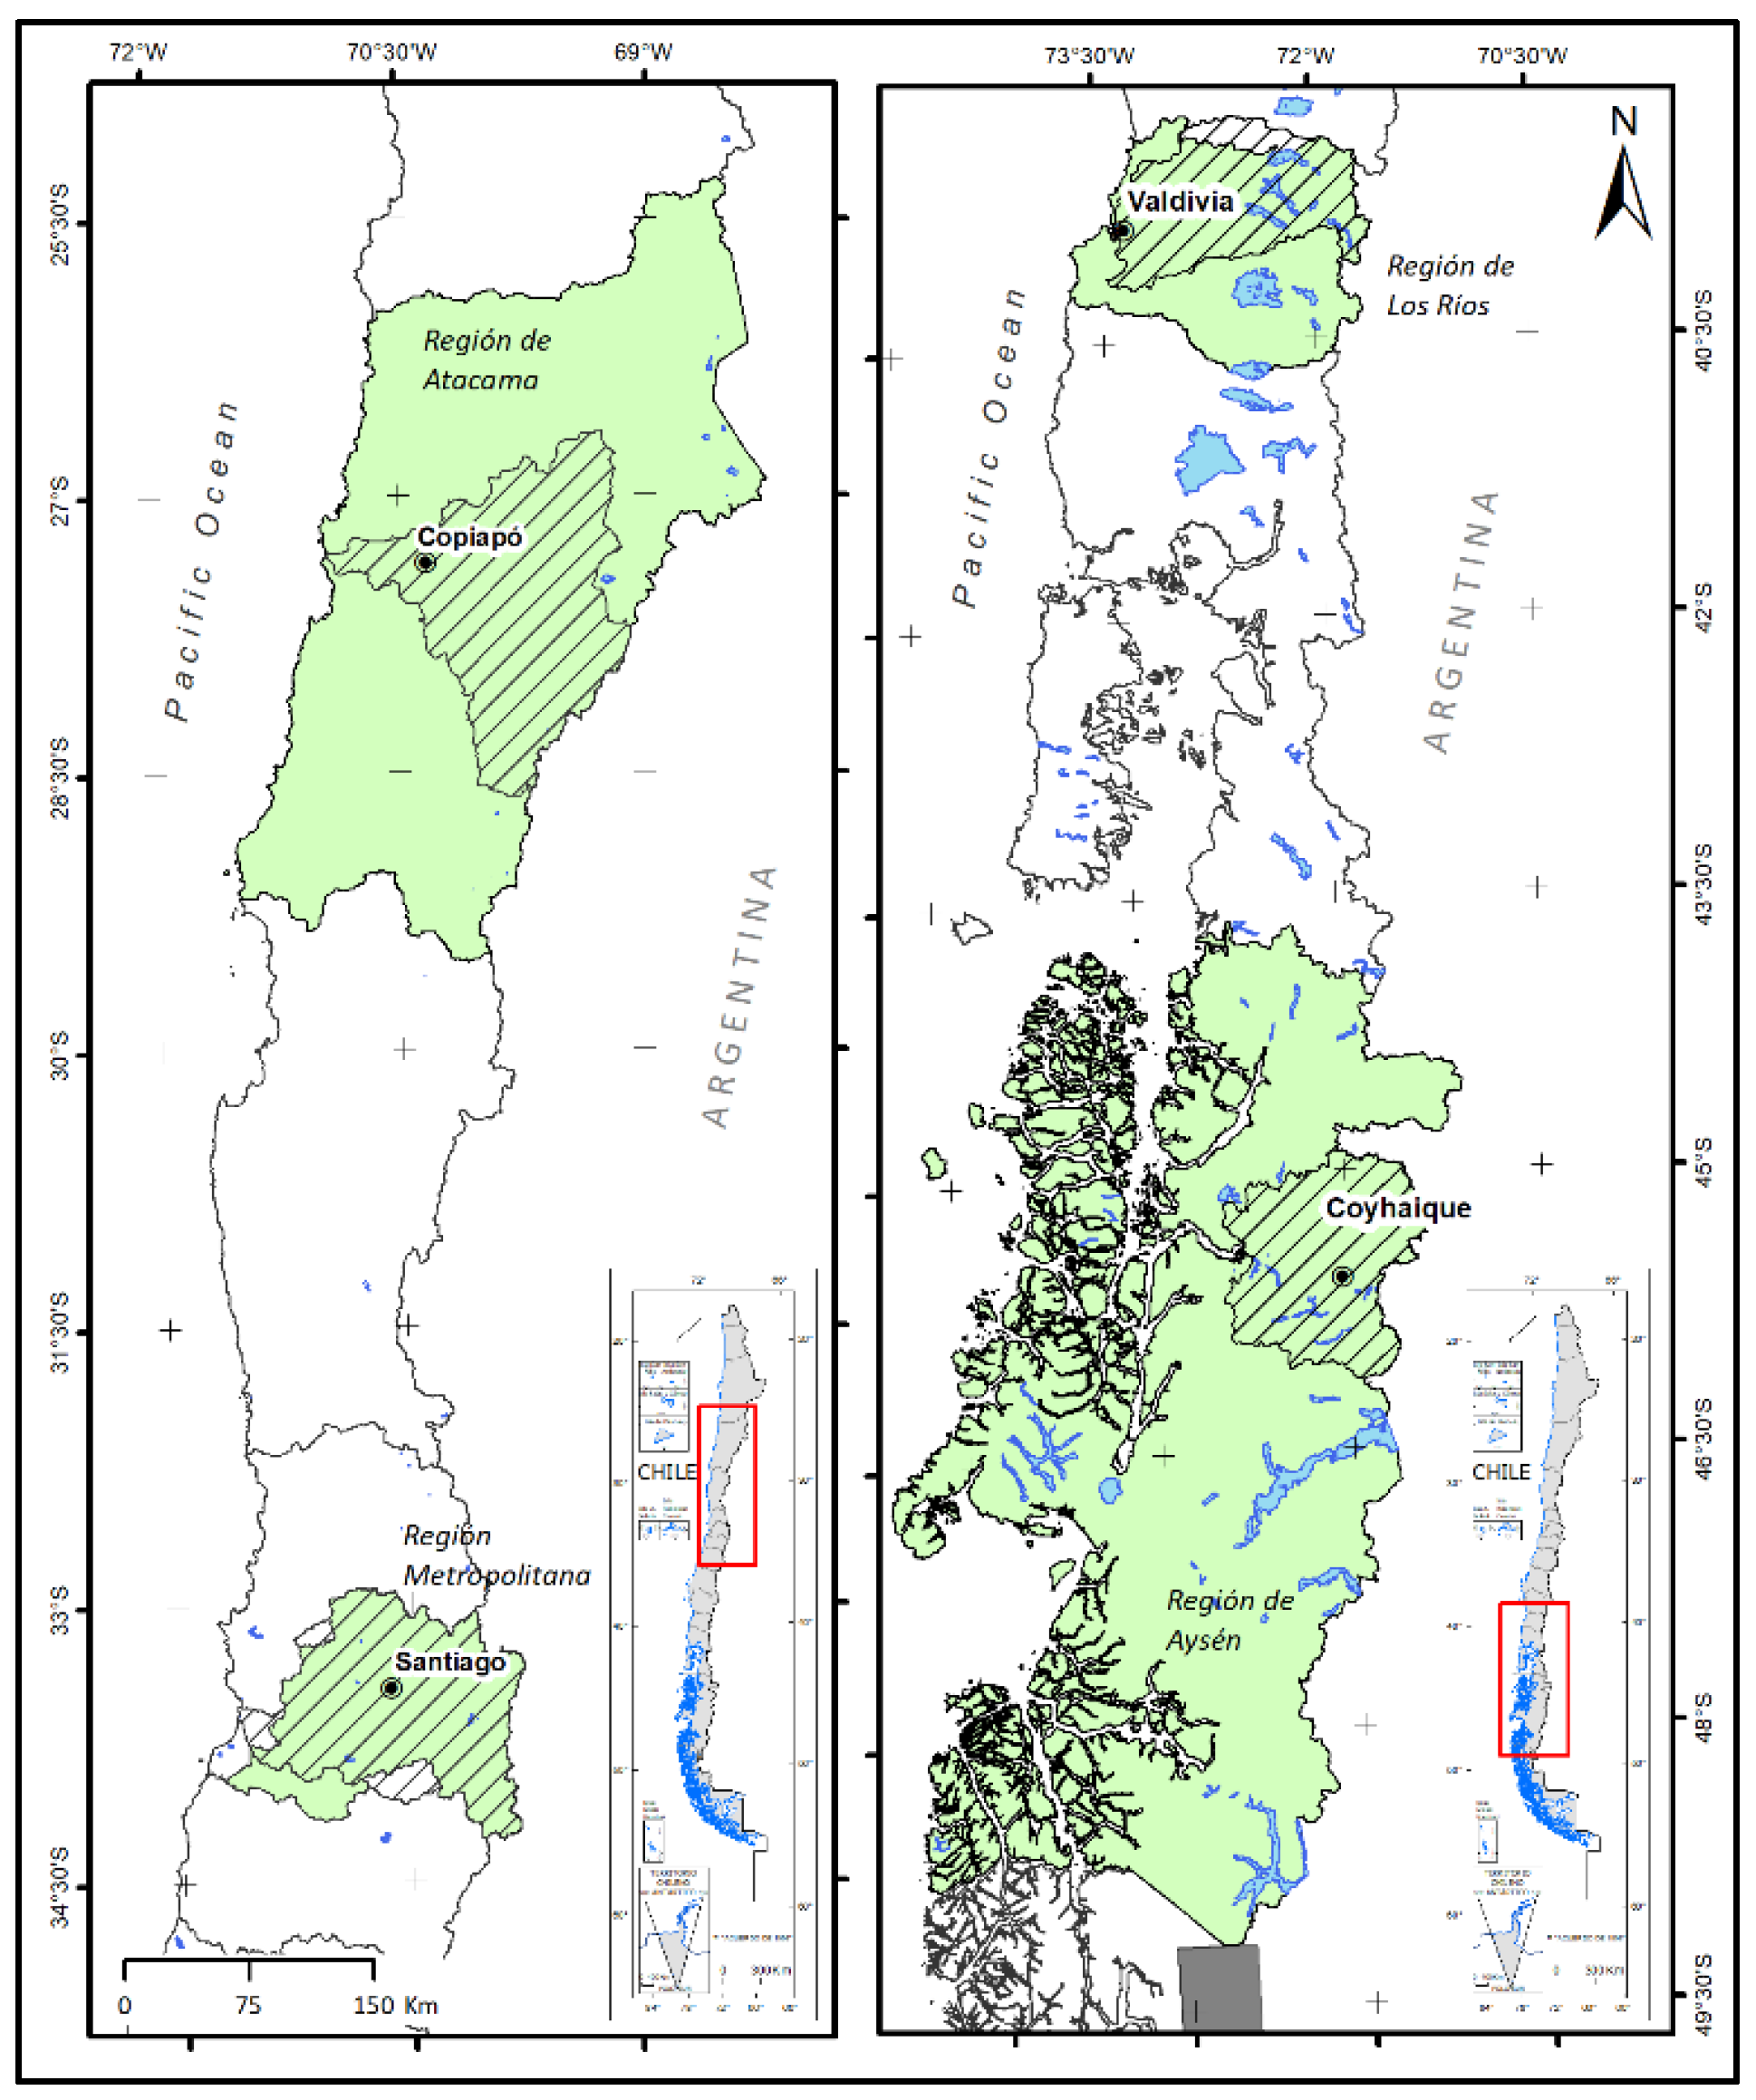
Figure 3.
Representative schematic of the methodology for estimating crop water demand.
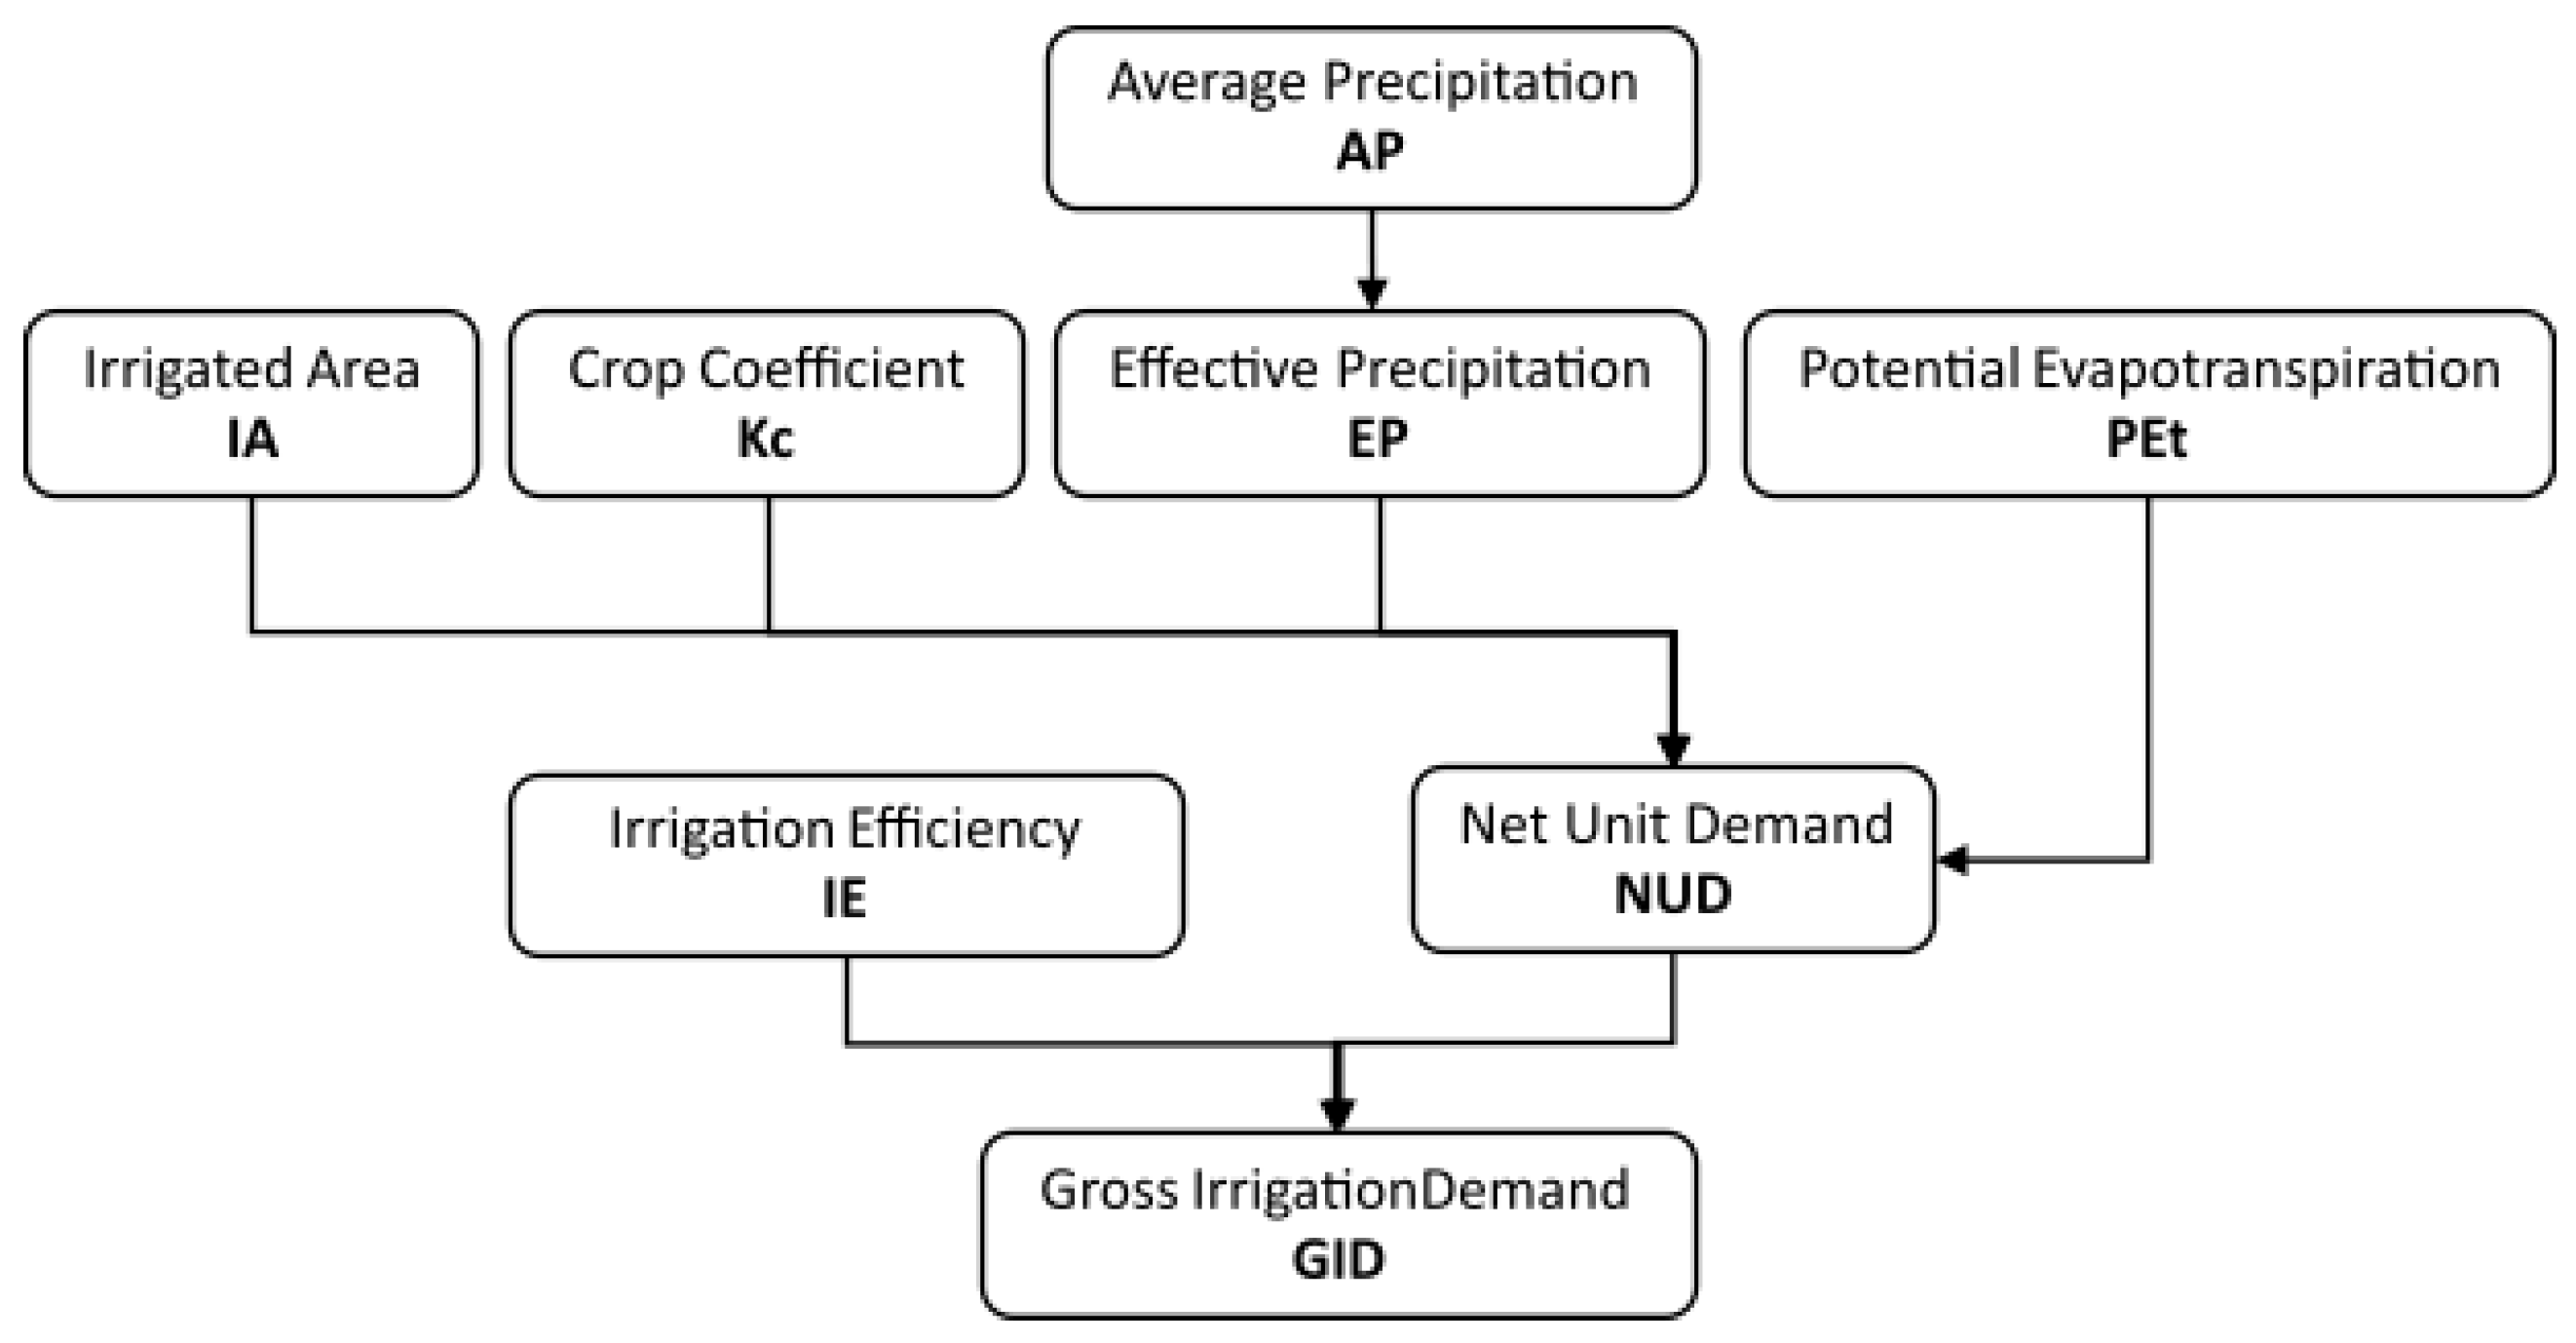

Table 1.
Result of estimation of vulnerability indicators in current use and PROT scenarios (pro-posed zoning).
Table 1.
Result of estimation of vulnerability indicators in current use and PROT scenarios (pro-posed zoning).
| Item | Current use scenario | PROT Scenario | ||||||
|---|---|---|---|---|---|---|---|---|
| Copiapó River Basin |
Maipo River Basin |
Valdivia River Basin |
Aysén River Basin |
Copiapó River Basin |
Maipo River Basin |
Valdivia River Basin |
Aysén River Basin |
|
| Agricultural Demand (m3/s) | 3.8 | 66.9 | 10.9 | 16.8 | 4.1 | 75.1 | 15.0 | 16.5 |
| Mining Demand (m3/s) | 0.6 | 0.5 | - | 0.03 | 0.6 | 0.6 | - | 0.02 |
| Livestock Demand (m3/s) | 0.002 | 0.4 | 0.06 | 0.02 | 0.002 | 0.5 | 0.1 | 0.04 |
| Industrial Demand (m3/s) | - | 1.2 | 0.9 | 0.0007 | - | 1.7 | 1.2 | 0.001 |
| Ecological Flow (m3/s) | 0.09 | 7.2 | 123.6 | 70.1 | 0.09 | 7.2 | 123.6 | 70.1 |
| Water Demand* (m3/s) | 4.4 | 76.2 | 135.5 | 86.9 | 4.8 | 85.2 | 140.1 | 86.6 |
| Anthropogenic Water Demand** (m3/s) | 4.3 | 69.0 | 11.9 | 16.8 | 4.8 | 78.0 | 16.4 | 16.5 |
| Availability with an 85% Probability of Exceedance | 0.2 | 30.5 | 486.1 | 281.1 | 0.2 | 30.5 | 486.1 | 281.1 |
| Vulnerability Indicator (%) | 2474.8 | 250.3 | 27.9 | 30.9 | 2706.3 | 279.8 | 28.8 | 30.8 |
| Vulnerability Indicator (without ecological flow) (%) | 2423.3 | 226.7 | 2.4 | 6.0 | 2654.8 | 256.2 | 3.4 | 5.9 |
*Water demand considers the sum of all estimated demands of productive activities and the ecological flow. **Anthropic water demand comprises the sum of estimated demands of productive activities without the ecological flow.
Disclaimer/Publisher’s Note: The statements, opinions and data contained in all publications are solely those of the individual author(s) and contributor(s) and not of MDPI and/or the editor(s). MDPI and/or the editor(s) disclaim responsibility for any injury to people or property resulting from any ideas, methods, instructions or products referred to in the content. |
© 2025 by the authors. Licensee MDPI, Basel, Switzerland. This article is an open access article distributed under the terms and conditions of the Creative Commons Attribution (CC BY) license (http://creativecommons.org/licenses/by/4.0/).
Copyright: This open access article is published under a Creative Commons CC BY 4.0 license, which permit the free download, distribution, and reuse, provided that the author and preprint are cited in any reuse.


