Submitted:
11 July 2025
Posted:
14 July 2025
You are already at the latest version
Abstract
In renal transplant recipients (RTRs), kidney graft failure and cardiovascular disease are prevalent and associated with morbidity and mortality. Objectives:The objective of the study was to evaluate biomarkers, such as cardiac troponin T (cTnT) and N-terminal pro-B-type natriuretic peptide (NT-proBNP), to identify RTRs who are at greater risk of experiencing unfavorable outcomes, including all-cause mortality, renal, and cardiovascular (CV) events, as well as to assess the influence of these biomarkers on overall and death-censored graft survival. Patients and methods: A total of 342 stable RTRs were enrolled in this study, with a mean follow-up time of 48.4 months and a median follow-up time of 54 months. The probability of death, CV, and renal events at 4.9 years was calculated using Kaplan-Meier analysis for the group defined by cTnT and NT-proBNP levels above the cutoff values. Results: The probability of death and CV events was 23%, 20%, and 29%, 19%, for cTnT and NT-proBNP levels above the cutoff values, respectively. The probability of renal events, overall graft survival, and death-censored graft survival was 68%, 38%, 25%, and 63%, 41%, 27%, respectively. Conclusion: These data suggest that cTnT and NT-proBNP could potentially identify patients at high risk for death, CV, and renal events, as well as for overall graft survival and death-censored graft survival.
Keywords:
all-cause mortality
; biomarker
; cardiovascular disease
; kidney transplantation
1. Introduction
While long-term graft survival has not changed significantly, improvements in immunosuppressive regimens have enhanced short-term graft survival [1]. However, graft failure within 5 years occurs in 1 out of 5 renal transplant recipients (RTRs) [2,3,4]. In addition, cardiovascular disease (CVD) is highly prevalent in patients after kidney transplantation and significantly affects morbidity and death [5,6]. In addition to the standard risk factors (diabetes, obesity, hyperlipidemia, age), cardiovascular (CV) complications in RTRs are also linked to nontraditional factors unique to this population, including renal function, proteinuria, immunosuppressive therapy, length of dialysis therapy, inflammation, anemia, and elevated arterial stiffness [7,8,9].
The use of biomarkers to identify RTRs who are more likely to experience unfavorable outcomes could improve patient care for these individuals. The assessment of cardiac troponin I (cTnI) and T (cTnT) has the potential to predict adverse outcomes and is used to diagnose acute myocardial infarction and coronary ischemia [10,11,12]. However, elevations in cardiac troponins have been reported in several other acute and chronic conditions and are not exclusive to acute myocardial infarction [13]. Elevated levels of cardiac troponin have been reported in patients with chronic kidney disease (CKD). This may restrict the use of cTnT or cTnI assays for diagnosing acute myocardial events in patients with reduced glomerular filtration rate (GFR), but it may also highlight the predictive value of troponins for CV complications in CKD patients [14,15]. B-type natriuretic peptide (BNP) and N-terminal pro-B-type natriuretic peptide (NT-proBNP) have emerged as established biomarkers for heart failure (HF) [12]. Since BNP and NT-proBNP are responsive to volume overload, their levels are elevated in CKD [16]. Jarolim et al. showed that baseline BNP concentrations were associated with all-cause mortality, CV, and renal events in stable RTRs receiving folic acid and vitamin B supplementation [17]. Furthermore, BNP was more strongly linked to adverse outcomes in this population than cTnI, which had a stronger link to all-cause mortality. Conversely, an increase in cTnT within 3 weeks to a year following kidney transplantation was associated with worse patient survival rates, and a subset of patients at high risk for death or CV events was identified by the failure of cTnT levels to normalize posttransplant [18].
The objective of the study was to further evaluate the predictive value of NT-proBNP and cTnT for important clinical outcomes in RTRs. The primary endpoint was all-cause mortality, while the secondary endpoints included adverse CV and renal events, overall graft survival, and death-censored graft survival.
2. Materials and Methods
This study enrolled 342 stable RTRs, who were transplanted between 1994 and 2018 and attended the outpatient unit of the Department of Nephrology at Charité-Universitätsmedizin Berlin, Germany, between February and July 2018. All patients provided written informed consent, and the study was conducted in accordance with the Declaration of Helsinki. The study was approved by the local ethics committee (EA 1/252/17). We analyzed demographic data, immunosuppression status, and available clinical information, including transplant characteristics, hypertension, diabetes, and CVD, as previously described [19]. Data on laboratory test results, such as serum creatinine, estimated glomerular filtration rate (eGFR) calculated using the CKD-EPI equation, cTnT, and NT-proBNP levels, were obtained from the medical records at the start of the observation period. Increased serum level of creatinine was defined as concentration >1.2 mg/dL (>106.1 µmol/L) and the reference range for eGFR was described as ≥60ml/min/1.73m2. Abnormalities in serum levels of cTnT and NT-proBNP were defined as concentrations >14 ng/L and >125ng/L, respectively.
Definition of Outcomes
The primary endpoint of the study was all-cause mortality. Secondary endpoints included renal and CV events. Renal events were defined as a return to dialysis or an increase of at least 30% in serum creatinine, while CV events were characterized by incidents of stroke, myocardial infarction, or severe peripheral artery disease.
Moreover, overall graft survival was assessed, with graft loss defined as a return to dialysis or death with a functioning graft. Death-censored graft survival was also evaluated, where graft loss was defined as a return to dialysis, with death treated as a censoring event.
Follow-Up
The participants were followed up through the hospital system (T-Base) in February 2023, and the occurrence of death, CV, and renal events during this observation period was recorded [20].
Statistical Analyses
Due to the presence of extreme values in the variables determining cTnT (ng/L) and NT-proBNP (ng/L) levels, winsorization was applied [21]. Extreme observations that significantly deviated from the overall distributions could have biased the analysis and potentially led to incorrect generalizations of the conclusions. Asymmetric winsorization was applied to the right tail of the distribution. The 95th percentile was used as the boundary, which helped balance the influence of outliers while maintaining the integrity of the data. Before winsorization, the maximum value, skewness, and kurtosis for cTnT were 183 ng/L, 3.77, and 21.5, respectively; after winsorization, these values were 48.95 ng/L, 1.29, and 0.73. For NT-proBNP, the baseline values were 51,672 ng/L, 10.55, and 133.19, respectively; after processing, the values were 3,376 ng/L, 1.91, and 2.44.
Descriptive statistics of the analyzed cohort are presented for the entire group and by quartiles of cTnT and NT-proBNP concentrations. Patient characteristics were compared using descriptive statistics: means and standard deviations for continuous variables, and counts and frequencies for categorical variables. Differences in cohort characteristics were tested using the one-way ANOVA and the Kruskal-Wallis rank-sum test for continuous variables with normal and nonnormal distributions, respectively. For categorical variables, Pearson’s chi-squared test and Fisher’s exact test were used for factorial variables with counts greater than or equal to 5, and less than 5, respectively. The Kaplan-Meier model and log-rank test were used to estimate probabilities and test for differences in outcomes based on the stratified cohort using the cutoff values.
Nonlinear relationships between the endpoints and the investigated substances were analyzed using thin-plate regression splines (TPRS) within a multivariate Cox regression model, applied in a generalized additive model (GAM) environment. In addition to the primary variable expressed as a spline, each Cox model included variables to control for demographic structure: age as a TPRS spline, sex, and a proxy variable for patient domain status, which included the history of CAD and the value of eGFR.
Cut-off points were determined by identifying risk-neutralizing concentrations with a hazard ratio (HR) of 1 for the endpoints studied. Using the estimated splines, overall HRs were calculated based on the cut-off points and quartiles, while conditional HRs were calculated for the intervals defined by these cut-off points and quartiles. Analyses were performed in the R environment, version 4.1.3, using the mgcv library.
Changes in HRs were analyzed for each combination of pairs of outcomes and primary variables, resulting in 10 distinct models.
3. Results
Study Population Characteristics
Table 1 and Table 2 present the characteristics of the study cohort based on the quartiles of cTnT and NT-proBNP levels in the blood at the start of the observation period. At baseline, the mean time since kidney transplantation was 93 months, with the shortest and longest times being 1 and 384 months, respectively. The mean creatinine value was 1.67 mg/dL, and the mean eGFR was 50 mL/min/1.73 m2. Significant differences in kidney graft function were observed across the four quartile groups for both biomarkers. The prevalence of coronary artery disease (CAD), HF, and diabetes was higher among patients with higher values of cTnT and NT-proBNP.
There were no differences in the immunosuppression regimen across all quartiles of both biomarker groups. Higher levels of troponin T and NT-proBNP were associated with older age. The duration of renal replacement therapy (RRT) before kidney transplantation was longer in patients in the third and fourth quartiles of biomarker levels compared to those with lower levels of cTnT and NT-proBNP. It is worth noting that the majority of RTRs who underwent pre-emptive kidney transplantation were in the first quartile for both biomarker levels.
Patients with higher troponin T concentrations were more likely to be male and to have more CV events at the start of the observation. However, higher NT-proBNP concentrations were associated with a higher proportion of women relative to men.
The mean and median follow-up times were 48.4 and 54 months, respectively. The minimum and maximum observation periods were 5 and 59 months, respectively. The 4.9-year probabilities of occurrence, calculated using Kaplan-Meier analysis, were as follows: death 10% (95% CI: 6%; 13%); CV event 10% (95% CI: 5%; 14%); renal event 45% (95% CI: 34%; 54%); graft failure or death 17% (95% CI: 13%; 21%); and graft failure 11% (95% CI: 8%; 15%).
Next, we developed Cox models for both biomarkers to predict death, CV events, and renal events, adjusted for coronary artery disease (CAD) and the value of eGFR (Table 3).
Abbreviations: CAD—coronary artery disease, HR—hazard ratio, NT-proBNP—N-terminal pro-B-type natriuretic peptide, d.cens.—death censored.
Death
The Cox model identified a neutral troponin T concentration of 12.53 ng/L. Below this concentration, troponin T levels were associated with a −69% (95% CI: −91%; +3%) reduction in the conditional risk of death. Conversely, above this threshold, the conditional risk increased by 555% (95% CI: 80%; 1381%). For NT-proBNP, concentrations below 501.89 ng/L were associated with a −29% (95% CI: −63%; +36%) conditional reduction in the risk of death. Exceeding this concentration, however, resulted in a significant 216% (95% CI: 16%; 758%) increase in conditional risk. Significant effects on conditional risk were observed in the first quartile of troponin T and the fourth quartiles of both substances.
Cardiovascular Events
Patients with troponin T levels below 15.72 ng/L experienced an average CV event risk reduction of −1% (95% CI: −60%; +146%). In contrast, those with levels above the cutoff had an average risk increase of 3% (95% CI: −58%; +156%). Patients with NT-proBNP levels below 670.56 ng/L showed an average risk reduction of −24% (95% CI: −61%; +49%). For the remaining patients, the conditional risk of CV events was 210% higher (95% CI: 30%; 646%). When analyzing the significance of the conditional estimates for both biomarkers, only the highest NT-proBNP concentrations were statistically significant.
Renal Events
Patients with troponin T blood concentrations below 13.94 ng/L experienced an average risk reduction of −36% (95% CI: −62%; +9%) for renal events. However, once the estimated cutoff was surpassed, the risk increased on average by 141% (95% CI: 38%; 322%). NT-proBNP concentrations of 434.42 ng/L and higher were associated with a 169% increased risk of renal events (95% CI: 28%; 470%), while at lower concentrations, the average risk reduction was −29% (95% CI: −52%; +5%). The effects of troponin T and NT-proBNP on renal event risk were statistically significant in the first and fourth quartiles of concentrations.
Graft Loss
Patients with troponin T concentrations below the estimated cutoff point of 13.61 ng/L experienced an average risk reduction of −51% (95% CI: −76%; +1%) for potential return to dialysis, while those above this threshold had a 286% (95% CI: 79%; 741%) increase in risk. In contrast, patients with NT-proBNP levels below 431.05 ng/L showed an average reduction of −36% (95% CI: −62%; +8%) in the risk of potential return to dialysis, while those with higher levels had a 260% (95% CI: 48%; 785%) increase in risk. As with renal events, these effects were statistically significant in the first and fourth quartiles.
Graft Loss or Death
Troponin T levels below 14.45 ng/L were associated with an average risk reduction of −41% (95% CI: −74%; +34%) for renal graft failure or death. Above this threshold, the risk increased by 206% (95% CI: 31%; 610%). In contrast, NT-proBNP levels below 424.30 ng/L were linked to an average reduction of −30% (95% CI: −62%; +30%) in risk, while levels above this threshold were associated with a 180% (95% CI: −4%; +725%) increase in risk. For both troponin T and NT-proBNP, conditional HR estimates were statistically significant only in the highest quartiles.
Summary of Cox Models
It should be noted that the estimated cutoff points using the nonlinear Cox model were, in all cases, located within the third quartile of the concentration range for both biomarkers. In addition, the dynamics of HR changes increased for successive quartiles of biomarker concentrations, with stagnation or a slight decrease in the last quartile (Figure 1). This may indicate a dose-response relationship, where the risk of the events studied does not significantly increase until higher concentrations of troponin T and NT-proBNP are reached. It is important to note that the shapes of the estimated splines for the risk of death and renal events were close to sigmoidal. Initially, the increase in event risk relative to substance concentration was slow, then accelerated between the two inflection points, and slowed again in the final phase. An exception was observed in the risk of CV events for troponin T, where the curve resembled an exponential shape with weak dynamics. There was a gradual increase in risk at lower biomarker concentrations, but the risk of CV events rose more rapidly at higher concentrations. The gradual increase in risk at lower biomarker concentrations transitions into more rapid increments in risk at higher concentrations.
Kaplan-Meier Models
The estimated Kaplan-Meier models for the identified cutoff values showed significant differences between all cutoff value groups over the 4.9-year period (p-values <0.05) (Figure 2). The probability of death at 4.9 years for the group defined by troponin T levels below the cutoff was 0%, while for those above the cutoff, it was 23% (95% CI: 15%; 30%). The range of NT-proBNP levels below the cutoff corresponded to a 3% (95% CI: 0%; 5%) probability of death, whereas patients in the remaining range had a 29% (95% CI: 18%; 38%) probability of death.
The probabilities of CV events in the groups below and above the neutral point for troponin T were 6% (95% CI: 2%; 10%) and 20% (95% CI: 6%; 32%), respectively. Similarly, for the defined lower and higher NT-proBNP concentration ranges, the probabilities of experiencing a CV event were 7% (95% CI: 2%; 12%) and 19% (95% CI: 8%; 30%), respectively.
Over the 4.9-year period, the probabilities of renal events according to troponin T concentration were 26% (95% CI: 16%; 34%) for the lower concentration group and 68% (95% CI: 51%; 79%) for the higher concentration group. For NT-proBNP, the probabilities of renal events for patients below the cutoff concentration were 33% (95% CI: 23%; 41%) and for those above the cutoff were 63% (95% CI: 41%; 77%).
Troponin T concentrations below the estimated cutoff point suggested a 4% (95% CI: 1%; 6%) probability of dialysis (death-censored graft survival), whereas concentrations above the cutoff were associated with a 25% (95% CI: 16%; 33%) probability. For NT-proBNP, the lower concentration group was linked to a 3% (95% CI: 1%; 5%) probability of renal graft failure, while higher concentrations suggested a 27% (95% CI: 18%; 35%) probability.
The probability of returning to dialysis or death (overall graft survival) at follow-up was 3% (95% CI: 1%; 6%) for patients with lower troponin T levels, while those with higher levels had a 38% (95% CI: 29%; 45%) probability. For NT-proBNP, patients with lower concentrations had a 4% (95% CI: 2%; 7%) probability of an event, compared to 41% (95% CI: 31%; 50%) for patients with higher concentrations.
Among all outcomes, only the higher concentration groups for renal events achieved median event times—57 months for both biomarkers.
4. Discussion
Our study aimed to further define the role of cTnT and NT-proBNP as prognostic biomarkers for all-cause mortality, CV, and renal events in real-life stable RTRs. Using Cox regression, we identified cutoff values for both biomarkers and observed associations with outcomes at both the lowest and highest levels of these biomarkers at baseline in our cohort. The probabilities of death and CV events during the 4.9-year follow-up for patients with biomarker levels above the cutoff values were 23% and 29% for cTnT, and 20% and 19% for NT-proBNP, respectively. The probability of renal events in our study exceeded 60% for those whose biomarker levels surpassed the cutoff. Moreover, the probability of returning to dialysis or death, or dialysis alone (death-censored), was 25% and 38% for cTnT, and 27% and 41% for NT-proBNP, respectively, when levels exceeded the cutoff values. We conclude that the assessment of both biomarkers, which are already in routine clinical use, may be valuable for identifying patients at risk of adverse outcomes, including graft survival, even several years after kidney transplantation.
In patients on the waiting list for kidney transplantation, elevated cTnT is a significant predictor of death, with a risk gradient observed for those with higher cTnT levels [18]. Survival following renal transplantation is predicted by pretransplant cTnT concentrations, with a higher risk in individuals with pre-existing CVD or cardiac risk factors. Additionally, 10-year mortality in this population was predicted by after kidney transplantation cTnT levels, with measurements taken 760 days after transplantation being associated with higher mortality, regardless of age, diabetes, pretransplant dialysis, cardiac illness, or allograft function [22].
The notion that therapies improving cardiac health, as shown by decreased cTnT levels, may lead to improved survival was supported by the substantial correlation between cTnT levels 1 year after kidney transplantation and survival in RTRs [15]. Avoiding or minimizing dialysis before transplantation is one of the potential targets for preventive or curative interventions suggested by the identification of characteristics associated with elevated cTnT [23,24].
It is well established that preemptive transplantation is advantageous, and that the duration of dialysis before transplantation is correlated with posttransplant survival. Additionally, we observed lower levels of cTnT and NT-proBNP in patients who received pre-emptive transplants and in those who underwent shorter periods of dialysis before transplantation. In contrast to the cited results, we assessed the biomarkers in the later period (7.5 years) after kidney transplantation, providing further evidence of their role in assessing the risk of death, CV, and renal events after kidney transplantation.
Our findings further indicate a correlation between cTnT levels and kidney transplant function. This finding aligns with existing research that highlights the relationship between allograft function and survival after transplantation. The alterations in cTnT levels may also result from CKD patients’ impaired ability to degrade the cTnT molecule normally due to disturbances in the clearance mechanism. Nevertheless, a decrease in GFR alone is insufficient to elevate cTnT levels (18). Consequently, it is hypothesized that both decreased cTnT clearance and cardiac damage contribute to the elevated cTnT levels observed in certain CKD patients. This hypothesis is consistent with findings that patients with high CV risk—such as those with diabetes, atherosclerotic renal disease, and CKD—exhibit selectively increased cTnT levels [23,25,26].
The interest in utilizing allograft function as an outcome in transplantation therapy trials has been emphasized once again. While there are numerous interpretive challenges associated with this endpoint, measuring cTnT provides insight into the potential effects of decreased GFR on CV risk and could serve as a valuable metric for evaluating the efficacy of interventions aimed at improving graft function. [27,28].
When left ventricular wall stress increases, which can occur in cardiac, renal, or hepatic failure, ventricular myocytes primarily release NPs. International recommendations support NT-proBNP as a classical biomarker for the diagnosis, prognosis, and therapeutic monitoring of patients with CVD, particularly those with HF, based on substantial research conducted on adults [29,30]. In patients with CKD, even those without HF, a decrease in GFR leads to an increase in NPs. Elevated BNP levels may result from increased cardiac release due to blood volume expansion, blood pressure elevation, and cardiac hypertrophy, but also partly from impaired renal clearance. In adult CKD patients, high levels of NPs are strong predictors of CV events and all-cause mortality. Conversely, patients with lower NPs during follow-up exhibit a better prognosis than those with elevated BNP [31].
Wei et al. showed that allograft renal transplantation results in a significant reduction in BNP starting on the first postoperative day. They observed a substantial rebound in BNP levels when allograft dysfunction occurred. In some patients with acute allograft dysfunction, changes in plasma BNP levels appeared several days before changes in blood creatinine. As a result, the authors suggested that plasma BNP could serve as a sensitive biomarker for the clinical detection of allograft dysfunction after kidney transplantation [32]. Moreover, NT-proBNP levels measured 2 or 3 weeks posttransplant by Bodlaj et al. were significantly correlated with the eGFR rate 1 year after transplantation [33]. In the present study, we assessed NT-proBNP during the late period after kidney transplantation and found that this biomarker is associated with the doubling of creatinine or graft survival, defined as renal events. Therefore, for the first time, we provide evidence that this biomarker is useful in evaluating the probability of renal events in the analyzed population.
Among stable RTRs enrolled in a homocysteine reduction clinical trial, Jarolim et al. found a statistically significant correlation between higher BNP and cTnI concentrations and clinical outcomes such as death, CV events, and dialysis-dependent kidney transplant failure. Interestingly, BNP showed a stronger correlation with clinical outcomes than cTnI. Higher BNP quartiles were associated with significantly increased risk ratios for all outcomes, both fatal and nonfatal. In contrast, the results did not show the same substantial correlations with cTnI quartiles as with BNP [17]. In contrast to these data, we assessed molecules such as cTnT and NT-proBNP at baseline, with the transplant vintage and follow-up time being longer in our population than in the aforementioned study. Finally, we showed the significant role of these biomarkers in predicting all-cause mortality, CV, and renal events in RTRs in real-life observations.
The prospective Heterogeneity of Monocytes and Echocardiography Among Allograft Recipients in Nephrology (HOME ALONE) study performed by Emrich et al. followed 177 RTRs for 5.4 ± 1.7 years. At baseline, the patients were 6.9 years after kidney transplantation, with graft function comparable to that of our study population. Additionally, plasma NT-proBNP and cTnT levels were analyzed. The authors established predefined outcomes, such as severe atherosclerotic CV events, all-cause mortality, and hospitalization for acute decompensated heart failure or all-cause death (HF/D). In conclusion, they demonstrated that cTnT and plasma NT-proBNP were independent predictors of these outcomes [34]. These data align with our results regarding the risk of death and CV events. However, we conducted our study in a larger RTR population (342 patients) and explored the role of biomarkers as predictors of renal events, which was not analyzed by Emrich et al. [34].
Finally, in the liver transplantation (LT) population, Kwon et al. assessed the relationship between the risk of postLT mortality and pretransplant BNP levels and/or peak BNP levels within the first three postoperative days (postBNPPOD3) by using serial testing to assess changes in BNP levels before and after transplantation. Specifically, a BNP level >400 pg/mL is recognized as the cutoff for acute HF, and it may serve as an early indicator of HF or suggest the likelihood of overt HF. Regardless of the presence of HF signs and symptoms, the authors of this study demonstrated an association between postBNPPOD3 levels >400 pg/mL and postLT mortality [35].
Limitations
A few limitations of our studies warrant discussion. First, patients in our transplant program were all from a single transplant center. Moreover, we did not conduct a separate analysis based on the type of donor (living or deceased). However, these factors do not affect the results of our analyses, as the relationship between cTnT or NT-proBNP and survival, CV events, and renal events remained significant across the total cohort of RTRs. Second, the biomarkers were measured only once at baseline and SGLT2 (sodium-glucose cotransporter 2) inhibitors were not used. Finally, since these data are observational, we can only speculate about the mechanisms underlying the observed relationships. Nonetheless, these results provide a valuable baseline for future studies that use cTnT or NT-proBNP as targets for intervention.
Pro
It is important to emphasize that we obtained complete data for all participants regarding the primary and secondary endpoints after the follow-up. Moreover, this is the first study to assess the role of cTnT and NT-proBNP in identifying the risk of death, CV and renal events, and overall graft survival during the late period after kidney transplantation, with the mean time in our study population being 93 months.
5. Conclusions
Biomarkers such as cTnT and NT-proBNP appear promising in identifying patients at high risk of death, CV and renal events, and overall graft failure. Our data may be valuable for future research on cardioprotective and nephroprotective interventions in RTRs during the late period after kidney transplantation.
Author Contributions
For research articles with several authors, a short paragraph specifying their individual contributions must be provided. The following statements should be used “Conceptualization, Z.H. A.D.S. and K.B.; methodology, Z.H., F.H; software, Z.H., M.G.N. G.E.; validation, T.M., Z.H. and K.B.; formal analysis, Z.H., T.M. K.B.; investigation, Z.H., F.H.; resources, Z.H., M.G.N. and G.E.; data curation, F.H., K.B, T.M.; writing—Z.H., A.D.S., K.B.; writing—review and editing, A.D.S., K.B.; visualization, Z.H.; supervision, A.D.S, K.B.; project administration, Z.H., F.H.; funding acquisition, A.D.S. , K.B. All authors have read and agreed to the published version of the manuscript.” Please turn to the CRediT taxonomy for the term explanation. Authorship must be limited to those who have contributed substantially to the work reported.
Funding
This research received no external funding.
Informed Consent Statement
Informed consent was obtained from all subjects involved in the study.”
Acknowledgments
none
Conflicts of Interest
The authors declare no conflicts of interest
Abbreviations
The following abbreviations are used in this manuscript:
| RTRs | Renal transplant recipients |
| cTnT | Cardiac Troponin T |
| NTproBNP | N-terminal pro-B-type natriuretic peptide |
| cTnI | Cardiac Troponin I |
| CVD | Cardio-vascular disease |
| CKD | Chronic kidney disease |
| BNP | B-type natriuretic peptide |
| HR | Hazard ratio |
| eGFR | Estimated glomerular filtration rate |
| HF | Heart failure |
| NPs | Natriuretic peptides |
References
- Knoll G. Trends in kidney transplantation over the past decade. Drugs. 2008; 6(suppl 1): 3-10.
- Kabani R, Quinn RR, Palmer S, et al. Risk of death following kidney allograft failure: a systematic review and meta-analysis of cohort studies. Nephrol Dial Transplant. 2014; 29: 1778-1786.
- Mayrdorfer M, Liefeldt L, Wu K, et al. Exploring the Complexity of Death-Censored Kidney Allograft Failure. J Am Soc Nephrol. 2021; 32: 1513-1526.
- Mayrdorfer M, Liefeldt L, Osmanodja B, et al. A single centre in-depth analysis of death with a functioning kidney graft and reasons for overall graft failure. Nephrol Dial Transplant. 2023; 38:1857-1866.
- Wolfe RA, Ashby VB, Milford EL, et al. Comparison of mortality in all patients on dialysis, patients on dialysis awaiting transplantation, and recipients of a first cadaveric transplant. N Engl J Med. 1999; 341: 1725-1730.
- Stoumpos S, Jardine AG, Mark PB. Cardiovascular morbidity and mortality after kidney transplantation. Transpl Int. 2015; 28: 10–21.
- Heleniak Z, Illersperger S, Brakemeier S, et al. Obesity, Fat Tissue Parameters, and Arterial Stiffness in Renal Transplant Recipients. Transplant Proc. 2020; 52: 2341-2346.
- Heleniak Z, Illersperger S, Małgorzewicz S, et al. Arterial Stiffness as a Cardiovascular Risk Factor After Successful Kidney Transplantation in Diabetic and Nondiabetic Patients. Transplant Proc. 2022; 54: 2205-2211.
- Liefeldt L, Budde K. Risk factors for cardiovascular disease in renal transplant recipients and strategies to minimize risk. Transpl Int. 2010; 23: 1191-1204.
- van der Linden N, Klinkenberg LJJ, Bekers O, et al. Prognostic value of basal high-sensitive cardiac troponin levels on mortality in the general population: A meta-analysis. Medicine (Baltimore). 2016; 95: e5703.
- York MK, Gupta DK, Reynolds CF, et al. Natriuretic Peptide Levels and Mortality in Patients With and Without Heart Failure. J Am Coll Cardiol. 2018; 71: 2079-2088.
- Rehman SU, Mueller T, Januzzi JL. Characteristics of the novel interleukin family biomarker ST2 in patients with acute heart failure. J Am Coll Cardiol. 2008; 52: 1458-1465.
- Jarolim P. High sensitivity cardiac troponin assays in the clinical laboratories. Clin Chem Lab Med. 2015; 53: 635-652.
- Apple FS, Murakami MM, Pearce LA, Herzog CA. Predictive value of cardiac troponin I and T for subsequent death in end-stage renal disease. Circulation. 2002; 106: 2941-2945.
- Pfortmueller CA, Funk GC, Marti G, et al. Diagnostic performance of high-sensitive troponin T in patients with renal insufficiency. Am J Cardiol. 2013; 112: 1968-1972.
- Saunders JT, Nambi V, de Lemos JA, et al. Cardiac troponin T measured by a highly sensitive assay predicts coronary heart disease, heart failure, and mortality in the Atherosclerosis Risk in Communities Study. Circulation. 2011; 123: 1367-1376.
- Jarolim P, Claggett BL, Conrad MJ, et al. B-Type Natriuretic Peptide and Cardiac Troponin I Are Associated With Adverse Outcomes in Stable Kidney Transplant Recipients. Transplantation. 2017; 101: 182-190.
- Keddis MT, El-Zoghby ZM, El Ters M, et al. Cardiac troponin T before and after kidney transplantation: determinants and implications for posttransplant survival. Am J Transplant. 2013; 13: 406-414.
- Heleniak Z, Illersperger S, Brakemeier S, et al. The renin-angiotensin-aldosterone system blockade and arterial stiffness in renal transplant recipients - a cross-sectional prospective observational clinical study. Acta Biochim Pol. 2020; 67: 613-622.
- Schmidt D, Osmanodja B, Pfefferkorn M, et al. TBase - an Integrated Electronic Health Record and Research Database for Kidney Transplant Recipients. J Vis Exp. 2021; 13: 170.
- Wilcox, R. Trimming and Winsorization. In: Armitage P, Colton T, eds. Encyclopedia of Biostatistics. John Wiley and Sons, Chichester, UK; 2005: 5531–5533.
- Firth C, Shamoun F, Cha S, et al. Cardiac Troponin T Risk Stratification Model Predicts All-Cause Mortality Following Kidney Transplant. Am J Nephrol. 2018; 48: 242-250.
- Hickson LJ, Cosio FG, El-Zoghby ZM, et al. Survival of patients on the kidney transplant wait list: relationship to cardiac troponin T. Am J Transplant. 2008; 8: 2352-2359.
- Connolly GM, Cunningham R, McNamee PT, et al. Troponin T is an independent predictor of mortality in renal transplant recipients. Nephrol Dial Transplant. 2008; 23: 1019-1025.
- Abbas NA, John RI, Webb MC, et al. Cardiac troponins and renal function in nondialysis patients with chronic kidney disease. Clin Chem. 2005; 51: 2059-2066.
- Hassan HC, Howlin K, Jefferys A, et al. High-sensitivity troponin as a predictor of cardiac events and mortality in the stable dialysis population. Clin Chem. 2014 ; 60: 389-398.
- Meier-Kriesche HU, Baliga R, Kaplan B. Decreased renal function is a strong risk factor for cardiovascular death after renal transplantation. Transplantation. 2003; 27: 1291-1295.
- Cosio FG, Hickson LJ, Griffin MD, et al. Patient survival and cardiovascular risk after kidney transplantation: the challenge of diabetes. Am J Transplant. 2008; 8: 593-599.
- Adamo M, Gardner RS, McDonagh TA, Metra M. The ‘Ten Commandments’ of the 2021 ESC Guidelines for the diagnosis and treatment of acute and chronic heart failure. Eur Heart J. 2022; 43: 440-441.
- Pieske B, Tschöpe C, de Boer RA, et al. How to diagnose heart failure with preserved ejection fraction: the HFA-PEFF diagnostic algorithm: a consensus recommendation from the Heart Failure Association (HFA) of the European Society of Cardiology (ESC). Eur J Heart Fail. 2020; 22: 391-412.
- Han X, Zhang S, Chen Z, et al. Cardiac biomarkers of heart failure in chronic kidney disease. Clin Chim Acta. 2020; 510: 298-310.
- Wei TM, Jin L, Lv LC, et al. Changes in plasma B-type natriuretic peptide after allograft renal transplantation. Nephrology (Carlton). 2007; 12: 102-106.
- Bodlaj G, Hubmann R, Saleh K, et al. Serum levels of N-terminal pro-B-type natriuretic peptide are associated with allograft function in recipients of renal transplants. Wien Klin Wochenschr. 2009. 121: 631-637.
- Emrich IE, Scheuer AL, Rogacev KS, et al. Plasma biomarkers outperform echocardiographic measurements for cardiovascular risk prediction in kidney transplant recipients: results of the HOME ALONE study. Clin Kidney J. 2021; 15: 693-702.
- Kwon HM, Moon YJ, Kim KS, et al. Prognostic Value of B Type Natriuretic Peptide in Liver Transplant Patients: Implication in Posttransplant Mortality. Hepatology. 2021; 74: 336-350.
Figure 1.
Nonlinear estimates of adjusted Cox models with 95% confidence intervals, distribution of observations, and gradational backgrounds for quartiles of troponin T and NT-proBNP concentrations.
Figure 1.
Nonlinear estimates of adjusted Cox models with 95% confidence intervals, distribution of observations, and gradational backgrounds for quartiles of troponin T and NT-proBNP concentrations.
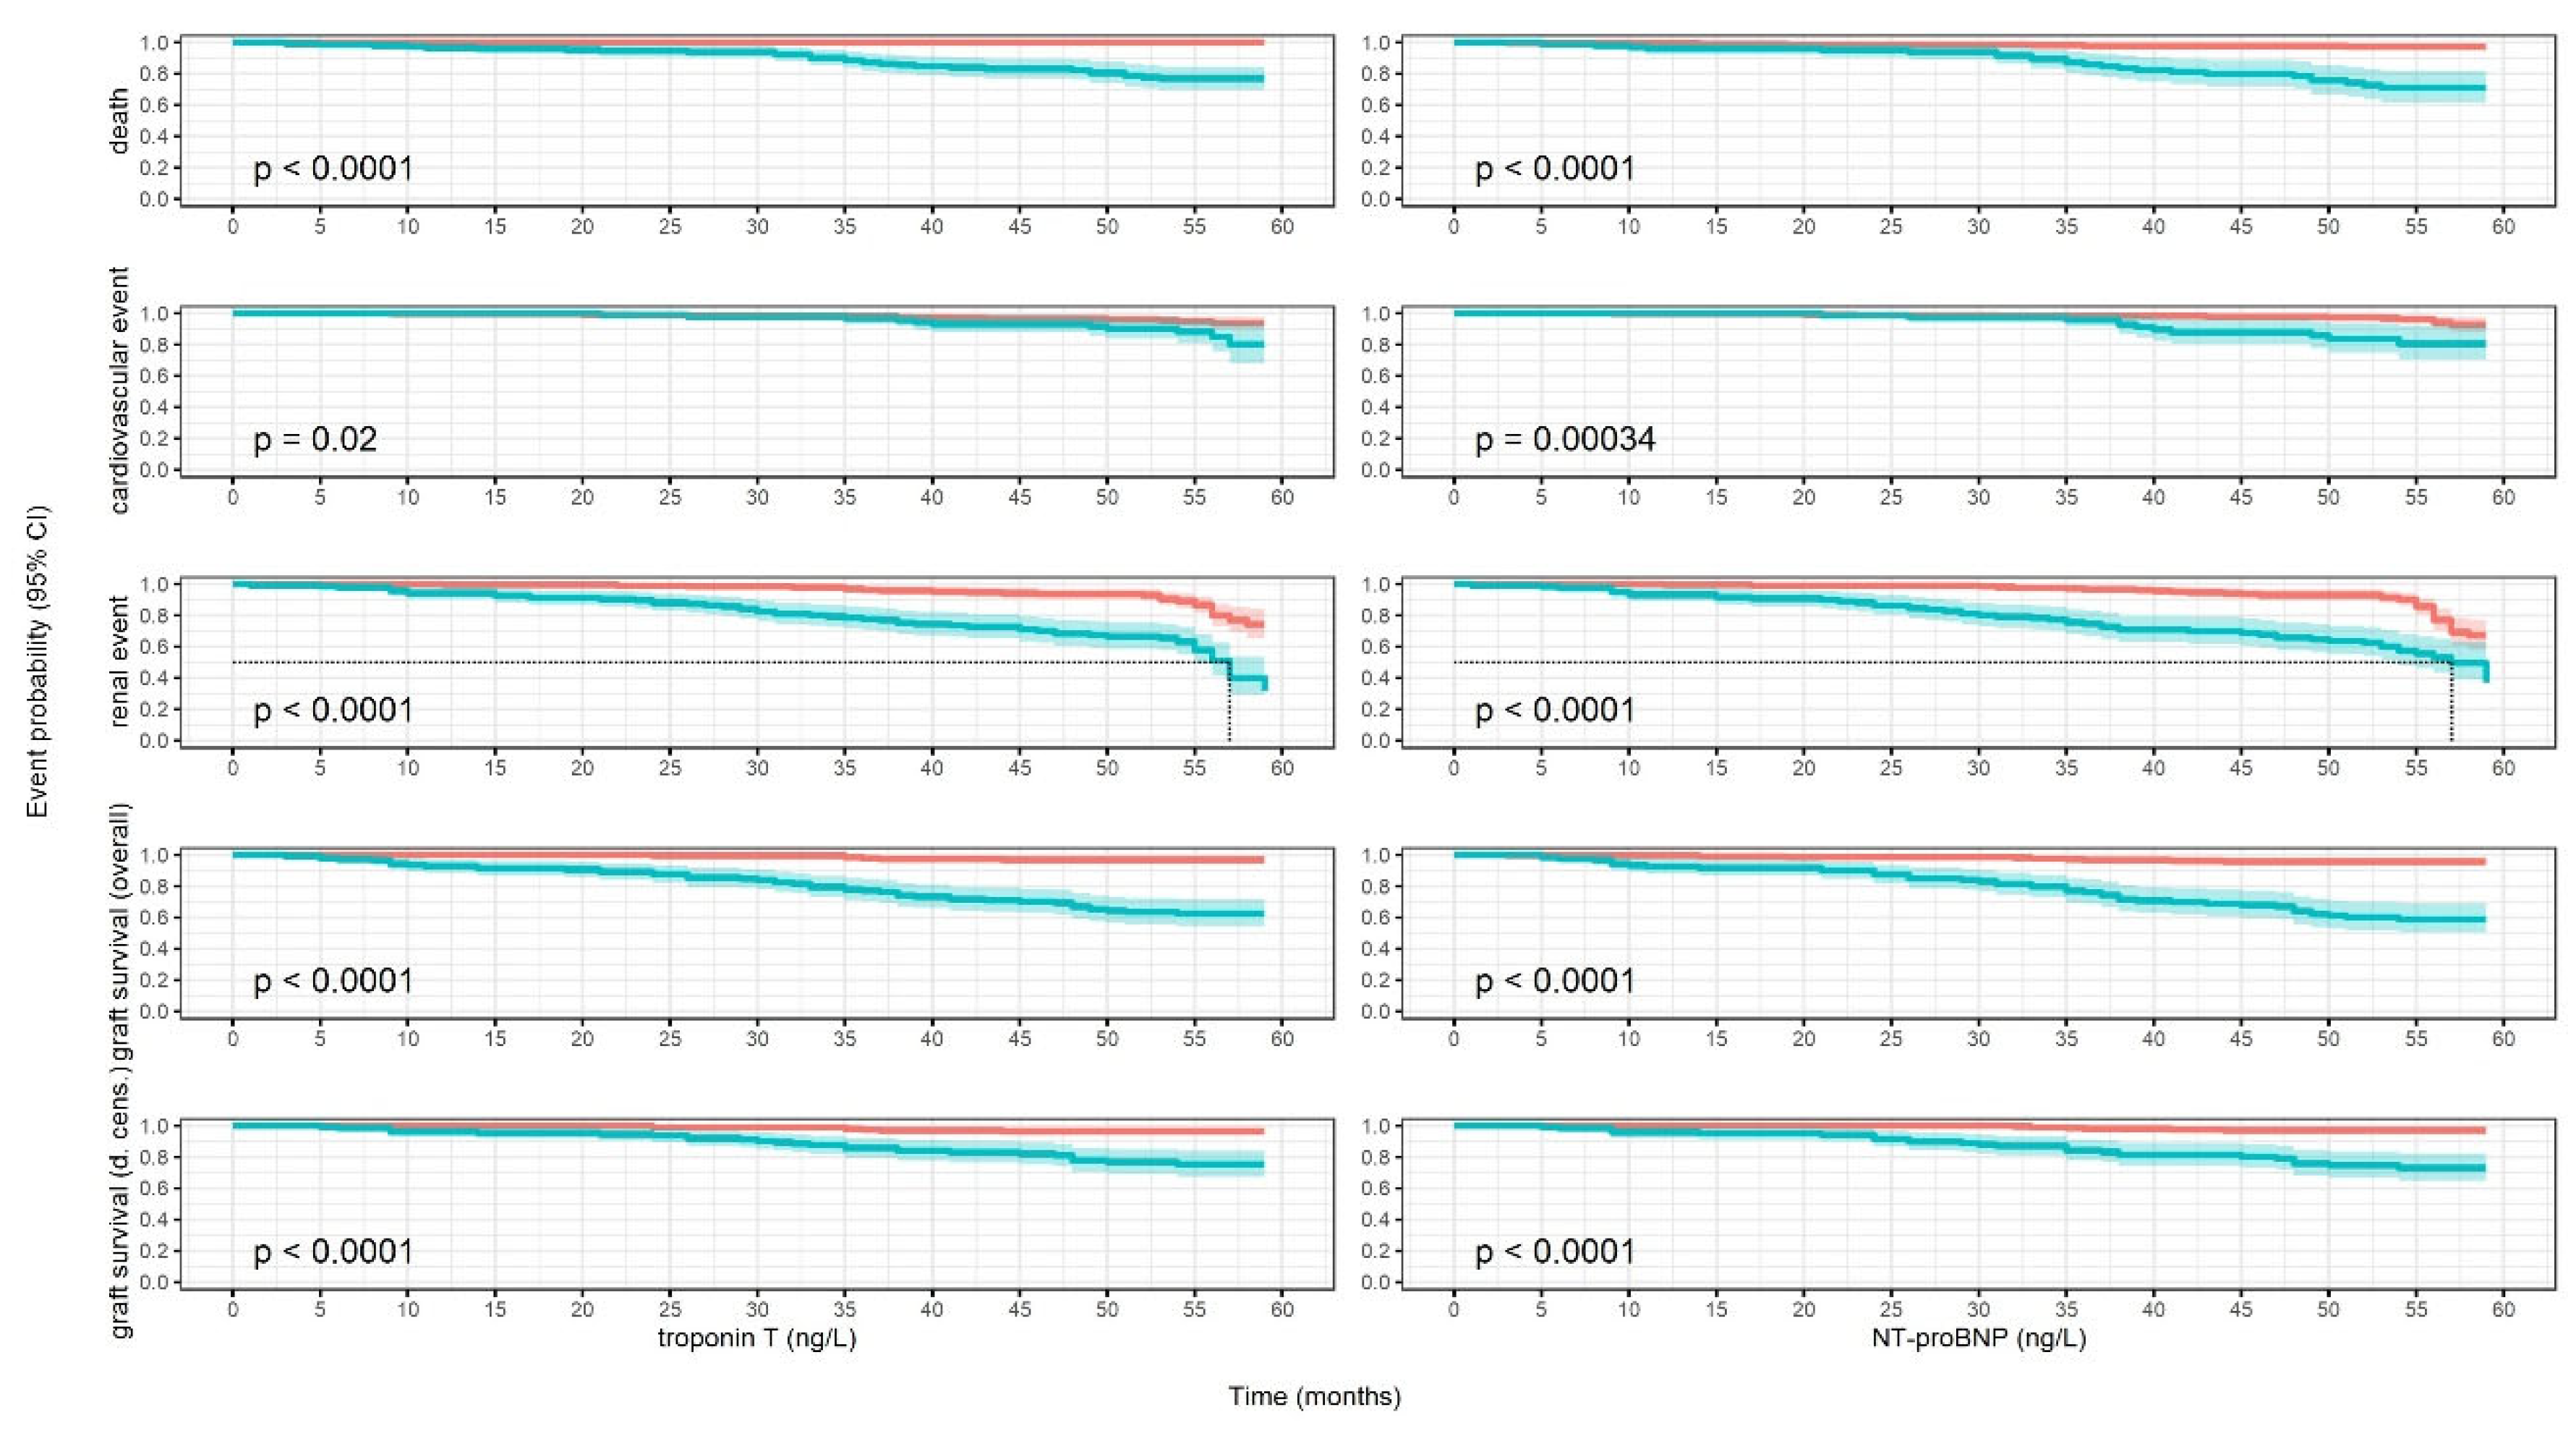
Figure 2.
Kaplan-Meier models survival curve estimates with 95% confidence intervals and log-rank tests. Red: patients with lower substance concentrations; blue: patients with higher substance concentrations.
Figure 2.
Kaplan-Meier models survival curve estimates with 95% confidence intervals and log-rank tests. Red: patients with lower substance concentrations; blue: patients with higher substance concentrations.
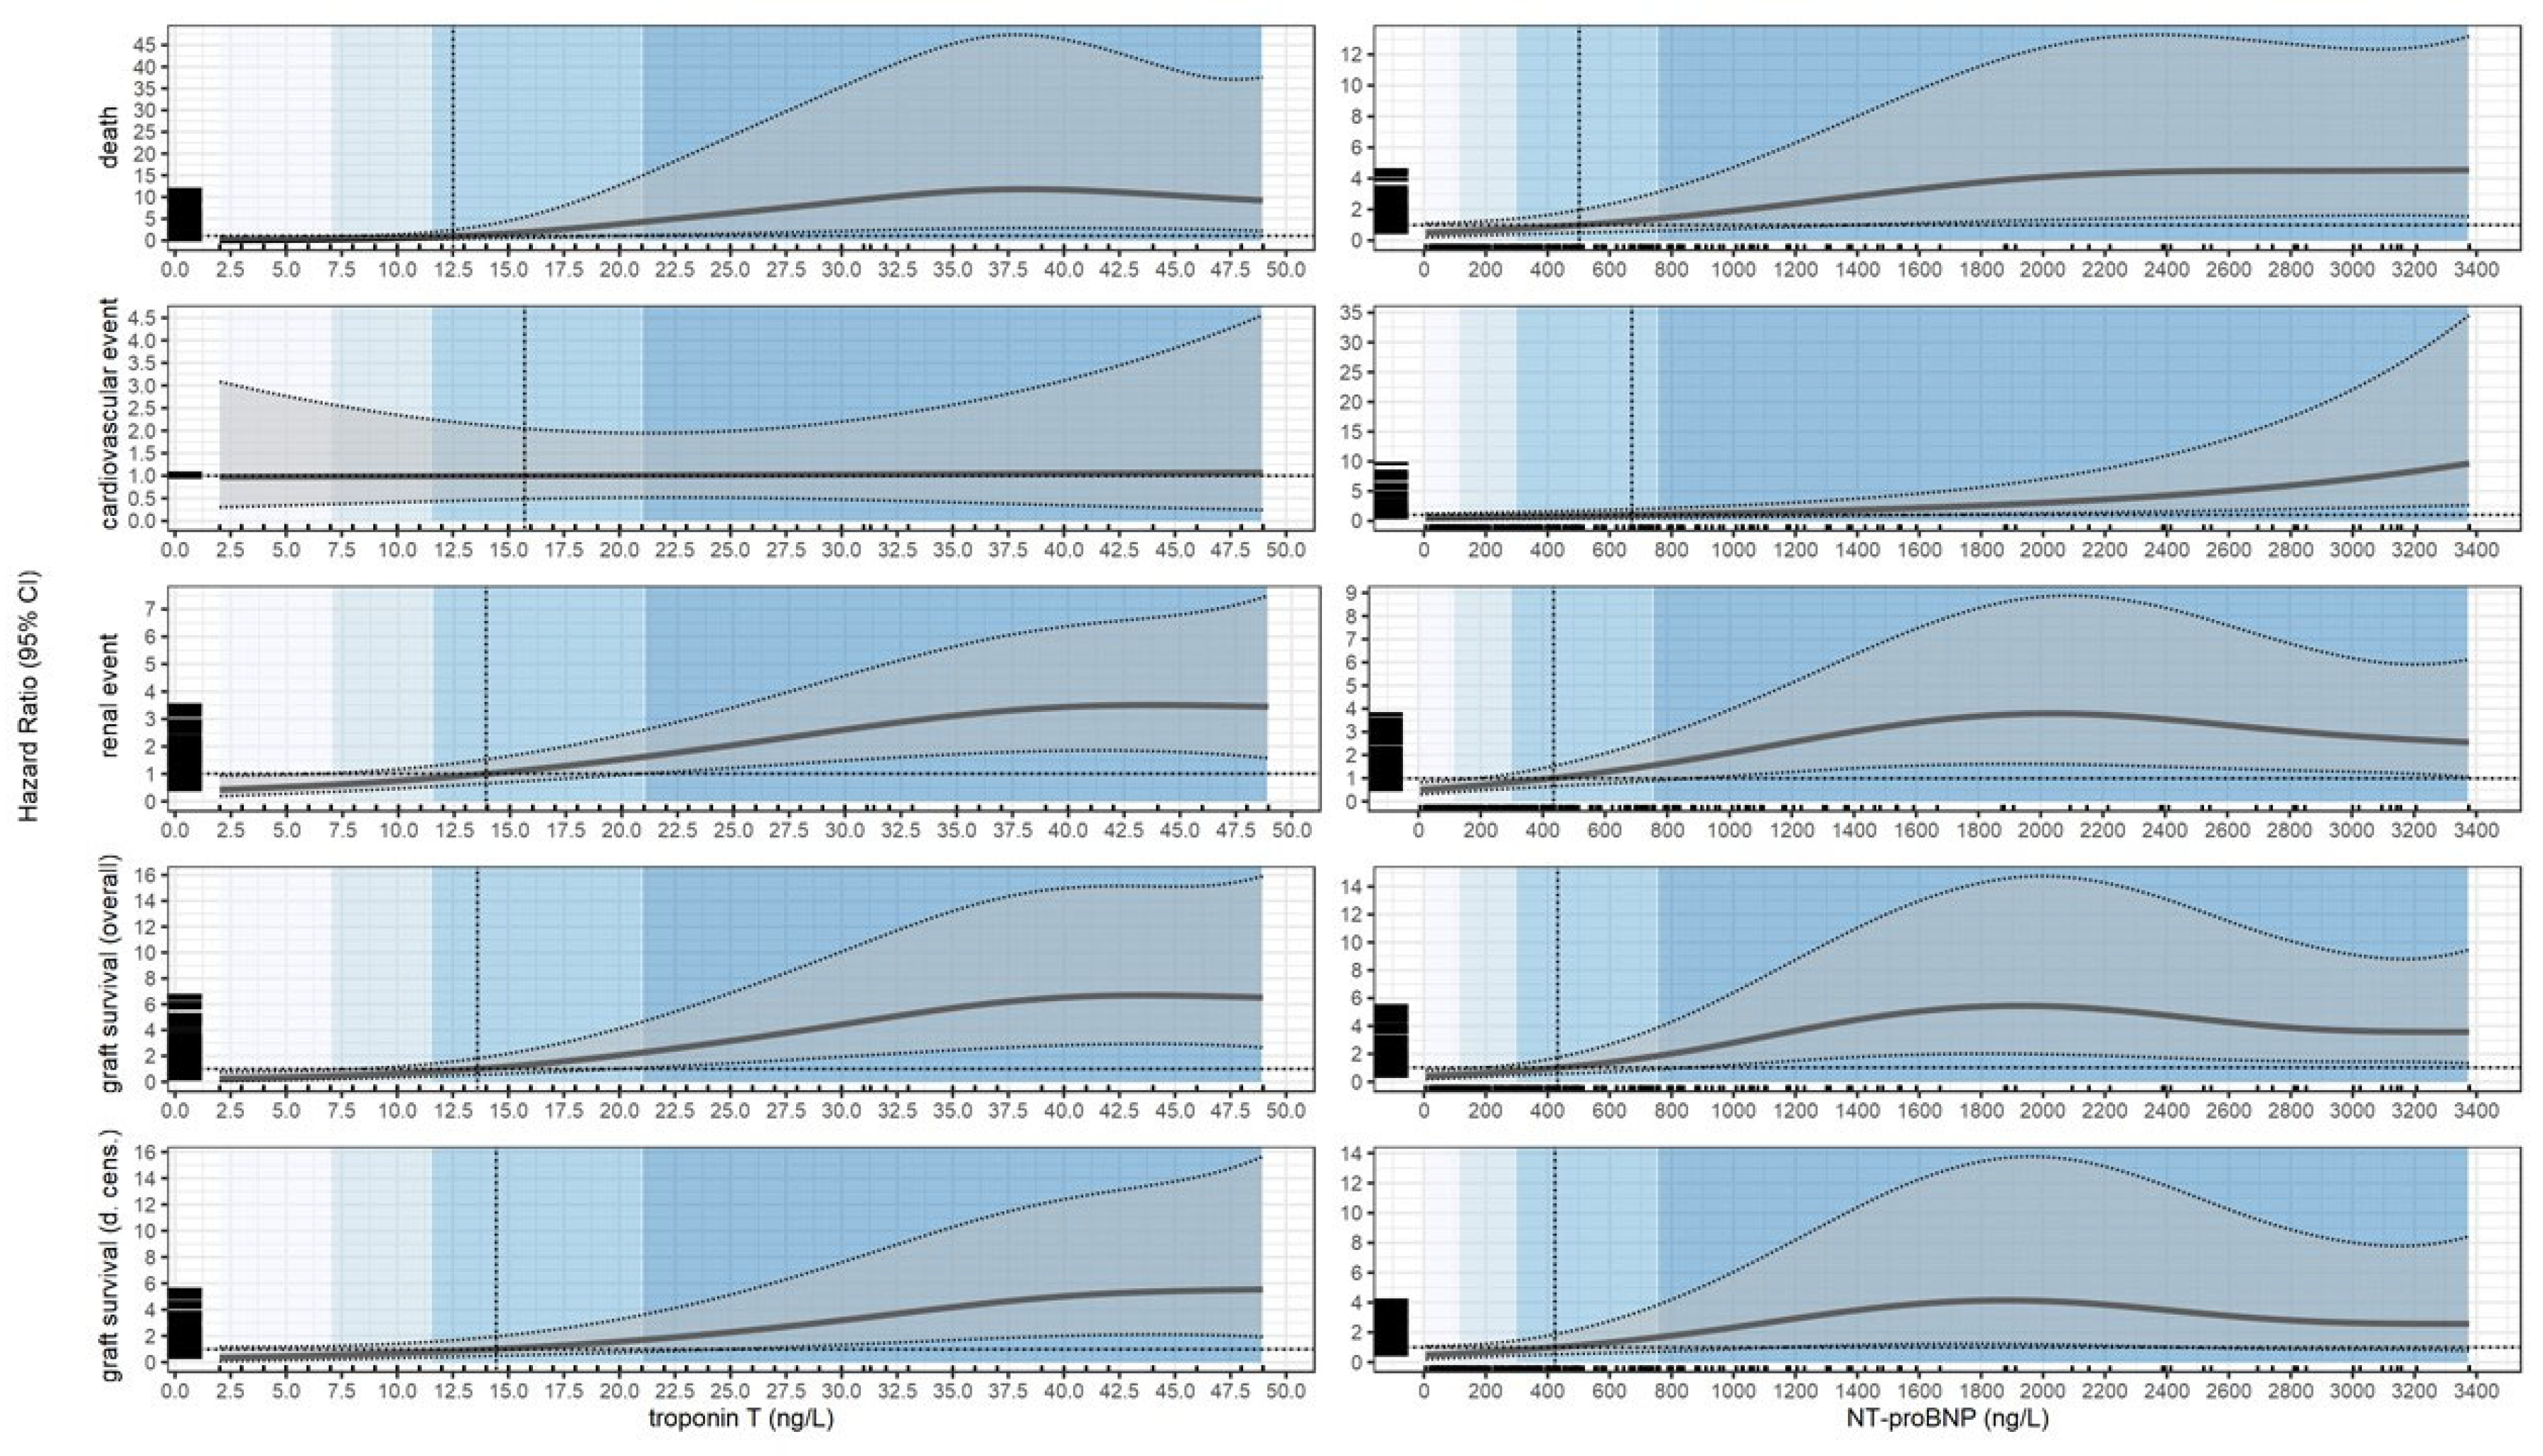

Table 1.
Descriptive statistics of the cohort by Troponin T concentration quartiles.
| Characteristic | Overall, N = 342a | [0,7], N = 108a | (7, 11.5], N = 63a | (11.5, 21], N = 86a | (21, 48.9], N = 85a | p-valueb |
| Age (years) | 53 (14) | 45 (12) | 51 (14) | 55 (13) | 62 (11) | <0.001 |
| Sex | <0.001 | |||||
| Female | 129/342 (38%) | 59/108 (55%) | 22/63 (35%) | 28/86 (33%) | 20 / 85 (24%) | |
| Male | 213/342 (62%) | 49/108 (45%) | 41/63 (65%) | 58/86 (67%) | 65/85 (76%) | |
| BMI (kg/m2) | 25.6 (4.8) | 25.0 (4.7) | 25.9 (5.0) | 25.4 (4.6) | 26.4 (4.8) | 0.086 |
| Total weight (kg) | 76 (17) | 73 (17) | 77 (16) | 76 (17) | 81 (16) | 0.010 |
| DM type 2 (yes) | 45/342 (13%) | 7/108 (6.5%) | 10/63 (16%) | 10/86 (12%) | 18/85 (21%) | 0.023 |
| NODAT (yes) | 21/342 (6.1%) | 7/108 (6.5%) | 3/63 (4.8%) | 6/86 (7.0%) | 5/85 (5.9%) | >0.9 |
| CAD (yes) | 77/342 (23%) | 2/108 (1.9%) | 9/63 (14%) | 16/86 (19%) | 50/85 (59%) | <0.001 |
| Heart failure (yes) | 90/342 (26%) | 19/108 (18%) | 11/63 (17%) | 26/86 (30%) | 34/85 (40%) | 0.001 |
| Hypertension (yes) | 296/342 (87%) | 92/108 (85%) | 53/63 (84%) | 76/86 (88%) | 75/85 (88%) | 0.8 |
| Glomerulonephritis (yes) | 185/342 (54%) | 67/108 (62%) | 31/63 (49%) | 50/86 (58%) | 37/85 (44%) | 0.052 |
| Polycystic kidney disease (yes) | 55/342 (16%) | 12/108 (11%) | 11/63 (17%) | 14/86 (16%) | 18/85 (21%) | 0.3 |
| Tubulointerstitial nephritis (yes) | 69/342 (20%) | 27/108 (25%) | 12/63 (19%) | 12/86 (14%) | 18/85 (21%) | 0.3 |
| Hypertensive nephropathy (yes) | 18/342 (5.3%) | 1/108 (0.9%) | 2/63 (3.2%) | 6/86 (7.0%) | 9/85 (11%) | 0.013 |
| Unknown etiology (yes) | 10/342 (2.9%) | 1/108 (0.9%) | 7/63 (11%) | 2/86 (2.3%) | 0/85 (0%) | <0.001 |
| Time of RRT (months) | 59 (61) | 36 (53) | 67 (76) | 74 (60) | 68 (51) | <0.001 |
| Time post KTx (months) | 93 (80) | 100 (78) | 79 (83) | 89 (77) | 98 (81) | 0.13 |
| Preemptive KTX (yes) n(%) | 47/342 (14%) | 27/108 (25%) | 9/63 (14%) | 4/86 (4.7%) | 7/85 (8.2%) | <0.001 |
| Creatinine (mg/dL) | 1.67 (0.81) | 1.29 (0.37) | 1.51 (0.51) | 1.69 (0.76) | 2.27 (1.06) | <0.001 |
| eGFR CKDEPI (mL/min/1.73m2) | 50 (20) | 62 (17) | 54 (18) | 48 (18) | 35 (17) | <0.001 |
| NT pro BNP (ng/L) | 684 (934) | 231 (357) | 411 (661) | 673 (816) | 1,473 (1,196) | <0.001 |
| Cyclosporine (yes) | 72/342 (21%) | 24/108 (22%) | 11/63 (17%) | 17/86 (20%) | 20/85 (24%) | 0.8 |
| Tacrolimus (yes) | 212/342 (62%) | 75/108 (69%) | 43/63 (68%) | 57/86 (66%) | 37/85 (44%) | <0.001 |
| Steroids (yes) | 176/342 (51%) | 38/108 (35%) | 37/63 (59%) | 45/86 (52%) | 56/85 (66%) | <0.001 |
| MMF (yes) | 150/342 (44%) | 45/108 (42%) | 23/63 (37%) | 44/86 (51%) | 38/85 (45%) | 0.3 |
| MPS (yes) | 170/342 (50%) | 59/108 (55%) | 35/63 (56%) | 40/86 (47%) | 36/85 (42%) | 0.3 |
| Betalacept (yes) | 41/342 (12%) | 8/108 (7.4%) | 6/63 (9.5%) | 9/86 (10%) | 18/85 (21%) | 0.023 |
| Calcium channel blocker (yes) | 157/342 (46%) | 37/108 (34%) | 29/63 (46%) | 48/86 (56%) | 43/85 (51%) | 0.018 |
| ACE inhibitor (yes) | 89/342 (26%) | 25/108 (23%) | 16/63 (25%) | 27/86 (31%) | 21/85 (25%) | 0.6 |
| Statines (yes) | 142/342 (42%) | 34/108 (31%) | 22/63 (35%) | 44/86 (51%) | 42/85 (49%) | 0.011 |
| AT1-R antagonists (yes) | 111/342 (32%) | 28/108 (26%) | 17/63 (27%) | 31/86 (36%) | 35/85 (41%) | 0.093 |
| aMean (SD); n/N (%). | ||||||
|
bOne-way ANOVA; Pearson’s Chi-squared test; Kruskal-Wallis rank sum test; Fisher’s exact test. SI conversion factor: for creatinine to convert mg/dL to µmol/L, multiply by 88.42 Abbreviations: BMI—body mass index, DM—diabetes mellitus, NODAT—new onset diabetes after transplantation, CAD—coronary artery disease, RRT—renal replacement therapy, Ktx—kidney transplantation, eGFR—estimated glomerular filtration rate, NT-proBNP—N-terminal pro-B-type natriuretic peptide, ACE—angiotensin converting enzyme, AT1-R—angiotensin receptor 1. | ||||||
Table 2.
Descriptive statistics of the cohort by NT-proBNP concentration quartiles.
| Characteristic | Overall, N = 342a | [0, 113], N = 87a | (113, 298], N = 84a | (298, 754], N = 85a | (754, 3376], N = 86a | p-valueb |
| Age | 53 (14) | 46 (12) | 50 (13) | 56 (13) | 58 (14) | <0.001 |
| Sex | 0.008 | |||||
| Female | 129/342 (38%) | 20/87 (23%) | 33/84 (39%) | 40/85 (47%) | 36/86 (42%) | |
| Male | 213/342 (62%) | 67/87 (77%) | 51/84 (61%) | 45/85 (53%) | 50/86 (58%) | |
| BMI (kg/m2) | 25.6 (4.8) | 25.8 (4.2) | 25.9 (5.0) | 25.1 (4.7) | 25.6 (5.3) | 0.6 |
| Total weight (kg) | 76 (17) | 79 (16) | 77 (17) | 74 (16) | 75 (18) | 0.2 |
| DM type 2 (yes) | 45/342 (13%) | 11/87 (13%) | 9/84 (11%) | 9/85 (11%) | 16/86 (19%) | 0.4 |
| NODAT (yes) | 21/342 (6.1%) | 8/87 (9.2%) | 5/84 (6.0%) | 3/85 (3.5%) | 5/86 (5.8%) | 0.5 |
| CAD (yes) | 77/342 (23%) | 3/87 (3.4%) | 9/84 (11%) | 22/85 (26%) | 43/86 (50%) | <0.001 |
| Heart failure (yes) | 90/342 (26%) | 17/87 (20%) | 12/84 (14%) | 26/85 (31%) | 35/86 (41%) | <0.001 |
| Hypertension (yes) | 296/342 (87%) | 78/87 (90%) | 69/84 (82%) | 71/85 (84%) | 78/86 (91%) | 0.3 |
| Glomrulonephritis (yes) | 185/342 (54%) | 48/87 (55%) | 55/84 (65%) | 36/85 (42%) | 46/86 (53%) | 0.027 |
| Polycystic kidney disease (yes) | 55/342 (16%) | 11/87 (13%) | 14/84 (17%) | 20/85 (24%) | 10/86 (12%) | 0.14 |
| Tubulointerstitial nephritis (yes) | 69/342 (20%) | 23/87 (26%) | 10/84 (12%) | 17/85 (20%) | 19/86 (22%) | 0.12 |
| Hypertensive nephropathy (yes) | 18/342 (5.3%) | 2/87 (2.3%) | 2/84 (2.4%) | 7/85 (8.2%) | 7/86 (8.1%) | 0.12 |
| Unknown etiology (yes) | 10/342 (2.9%) | 1/87 (1.1%) | 3/84 (3.6%) | 6/85 (7.1%) | 0/86 (0%) | 0.020 |
| Time of RRT (months) | 59 (61) | 46 (69) | 59 (64) | 62 (54) | 71 (52) | <0.001 |
| Time post KTx (months) | 93 (80) | 97 (85) | 86 (77) | 84 (73) | 103 (82) | 0.4 |
| Preempitve KTX (yes) | 47/342 (14%) | 23/87 (26%) | 12/84 (14%) | 8/85 (9.4%) | 4/86 (4.7%) | <0.001 |
| Creatinine (mg/dL) | 1.67 (0.81) | 1.38 (0.38) | 1.40 (0.44) | 1.60 (0.63) | 2.31 (1.14) | <0.001 |
| eGFR CKDEPI (mL/min/1.73 m2) | 50 (20) | 61 (16) | 57 (17) | 48 (19) | 34 (16) | <0.001 |
| Troponin T (ng/L) | 16 (13) | 8 (5) | 12 (10) | 17 (12) | 27 (14) | <0.001 |
| Cyclosporine (yes) | 72/342 (21%) | 15/87 (17%) | 17/84 (20%) | 18/85 (21%) | 22/86 (26%) | 0.6 |
| Tacrolimus (yes) | 212/342 (62%) | 61/87 (70%) | 53/84 (63%) | 54/85 (64%) | 44/86 (51%) | 0.077 |
| Steroids (yes) | 176/342 (51%) | 31/87 (36%) | 40/84 (48%) | 49/85 (58%) | 56/86 (65%) | <0.001 |
| MMF (yes) | 150/342 (44%) | 44/87 (51%) | 33/84 (39%) | 34/85 (40%) | 39/86 (45%) | 0.4 |
| MPS (yes) | 170/342 (50%) | 40/87 (46%) | 45/84 (54%) | 47/85 (55%) | 38/86 (44%) | 0.4 |
| Betalacept (yes) | 41/342 (12%) | 8/87 (9.2%) | 10/84 (12%) | 9/85 (11%) | 14/86 (16%) | 0.5 |
| Calcium channel blocker (yes) | 157/342 (46%) | 38/87 (44%) | 38/84 (45%) | 33/85 (39%) | 48/86 (56%) | 0.2 |
| ACE inhibitor (yes) | 89/342 (26%) | 19/87 (22%) | 21/84 (25%) | 24/85 (28%) | 25/86 (29%) | 0.7 |
| Statines (yes) | 142/342 (42%) | 35/87 (40%) | 35/84 (42%) | 29/85 (34%) | 43/86 (50%) | 0.2 |
| AT1-R antagonists (yes) | 111/342 (32%) | 23/87 (26%) | 24/84 (29%) | 32/85 (38%) | 32/86 (37%) | 0.3 |
| aMean (SD); n/N (%). | ||||||
|
bOne-way ANOVA; Pearson’s Chi-squared test; Kruskal-Wallis rank sum test; Fisher’s exact test. SI conversion factor: for creatinine to convert mg/dL to µmol/L, multiply by 88.42 Abbreviations: BMI—body mass index, DM—diabetes mellitus, NODAT—new onset diabetes after transplantation, CAD—coronary artery disease, RRT—renal replacement therapy, Ktx—kidney transplantation, eGFR—estimated glomerular filtration rate, NT-proBNP—N-terminal pro-B-type natriuretic peptide, ACE—angiotensin converting enzyme, AT1-R—angiotensin receptor 1. | ||||||
Table 3.
Overall and conditional estimates of relative hazard (HR) for quartiles and estimated cutoff points.
Table 3.
Overall and conditional estimates of relative hazard (HR) for quartiles and estimated cutoff points.
| Substance | Event | Quartile | Estimate 1 | p-value | Cutoff | Estimate 2 | p-value |
| Overall HR | |||||||
| Troponin T (ng/L) | Death | 7.00 | 0.29 (0.10; 0.87) | 0.026 | 12.53 | 1.00 (0.42; 2.38) | >0.9 |
| 11.50 | 0.80 (0.35; 1.85) | 0.6 | |||||
| 21.00 | 4.25 (1.22; 14.78) | 0.023 | |||||
| 48.95 | 9.20 (2.26; 37.52) | 0.002 | |||||
| Conditional HR | |||||||
| Troponin T (ng/L) | Death | [2.00, 7.00) | 0.17 (0.04; 0.78) | 0.022 | [2.00, 12.53) | 0.31 (0.09; 1.03) | 0.055 |
| [7.00, 11.50) | 0.49 (0.20; 1.20) | 0.11 | |||||
| [11.50, 21.00) | 2.01 (0.71; 5.75) | 0.2 | [12.53, 48.95] | 6.55 (1.80; 23.81) | 0.004 | ||
| [21.00, 48.95] | 9.03 (2.34; 35.16) | 0.001 | |||||
| Overall HR | |||||||
| NT-proBNP (ng/L) | Death | 113.00 | 0.59 (0.30; 1.15) | 0.12 | 501.89 | 1.00 (0.51; 1.94) | >0.9 |
| 298.50 | 0.76 (0.41; 1.40) | 0.4 | |||||
| 753.50 | 1.41 (0.64; 3.10) | 0.4 | |||||
| 3376.05 | 4.54 (1.57; 13.16) | 0.005 | |||||
| Conditional HR | |||||||
| NT-proBNP (ng/L) | Death | [6.00, 113.00) | 0.54 (0.26; 1.12) | 0.10 | [6.00, 501.89) | 0.71 (0.37; 1.36) | 0.3 |
| [113.00, 298.50) | 0.66 (0.35; 1.26) | 0.2 | |||||
| [298.50, 753.50) | 1.03 (0.52; 2.03) | >0.9 | [501.89, 3376.05] | 3.16 (1.16; 8.58) | 0.024 | ||
| [753.50, 3376.05] | 3.49 (1.25; 9.78) | 0.017 | |||||
| Overall HR | |||||||
| Troponin T (ng/L) | Cardiovascular event | 7.00 | 0.98 (0.37; 2.58) | >0.9 | 15.72 | 1.00 (0.49; 2.04) | >0.9 |
| 11.50 | 0.99 (0.44; 2.25) | >0.9 | |||||
| 21.00 | 1.01 (0.53; 1.94) | >0.9 | |||||
| 48.95 | 1.07 (0.25; 4.55) | >0.9 | |||||
| Conditional HR | |||||||
| Troponin T (ng/L) | Cardiovascular event | [2.00, 7.00) | 0.98 (0.34; 2.80) | >0.9 | [2.00, 15.72) | 0.99 (0.40; 2.46) | >0.9 |
| [7.00, 11.50) | 0.99 (0.41; 2.39) | >0.9 | |||||
| [11.50, 21.00) | 1.00 (0.49; 2.03) | >0.9 | [15.72, 48.95] | 1.03 (0.42; 2.56) | |||
| [21.00, 48.95] | 1.04 (0.40; 2.69) | >0.9 | |||||
| Overall HR | |||||||
| NT-proBNP (ng/L) | Cardiovascular event | 113.00 | 0.63 (0.31; 1.27) | 0.2 | 670.56 | 1.00 (0.52; 1.91) | >0.9 |
| 298.50 | 0.73 (0.37; 1.44) | 0.4 | |||||
| 753.50 | 1.07 (0.56; 2.04) | 0.8 | |||||
| 3376.05 | 9.65 (2.70; 34.49) | <0.001 | |||||
| Conditional HR | |||||||
| NT-proBNP (ng/L) | Cardiovascular event | [6.00, 113.00) | 0.60 (0.29; 1.22) | 0.2 | [6.00, 670.56) | 0.76 (0.39; 1.49) | 0.4 |
| [113.00, 298.50) | 0.68 (0.34; 1.35) | 0.3 | |||||
| [298.50, 753.50) | 0.89 (0.46; 1.70) | 0.7 | [670.56, 3376.05] | 3.10 (1.30; 7.46) | 0.011 | ||
| [753.50, 3376.05] | 3.22 (1.34; 7.77) | 0.009 | |||||
| Overall HR | |||||||
| Troponin T (ng/L) | Renal event | 7.00 | 0.60 (0.36; 1.01) | 0.056 | 13.94 | 1.00 (0.66; 1.52) | >0.9 |
| 11.50 | 0.83 (0.54; 1.28) | 0.4 | |||||
| 21.00 | 1.62 (1.02; 2.58) | 0.042 | |||||
| 48.95 | 3.45 (1.59; 7.48) | 0.002 | |||||
| Conditional HR | |||||||
| Troponin T (ng/L) | Renal event | [2.00, 7.00) | 0.51 (0.27; 0.95) | 0.036 | [2.00, 13.94) | 0.64 (0.38; 1.09) | 0.10 |
| [7.00, 11.50) | 0.70 (0.44; 1.13) | 0.14 | |||||
| [11.50, 21.00) | 1.17 (0.76; 1.80) | 0.5 | [13.94, 48.95] | 2.41 (1.38; 4.22) | 0.002 | ||
| [21.00, 48.95] | 2.83 (1.57; 5.10) | <0.001 | |||||
| Overall HR | |||||||
| NT-proBNP (ng/L) | Renal event | 113.00 | 0.60 (0.41; 0.90) | 0.011 | 434.42 | 1.00 (0.66; 1.51) | >0.9 |
| 298.50 | 0.82 (0.56; 1.18) | 0.3 | |||||
| 753.50 | 1.56 (0.90; 2.70) | 0.11 | |||||
| 3376.05 | 2.55 (1.06; 6.11) | 0.036 | |||||
| Conditional HR | |||||||
| NT-proBNP (ng/L) | Renal event | [6.00, 113.00) | 0.55 (0.36; 0.85) | 0.007 | [6.00, 434.42) | 0.71 (0.48; 1.05) | 0.088 |
| [113.00, 298.50) | 0.70 (0.49; 1.01) | 0.053 | |||||
| [298.50, 753.50) | 1.14 (0.72; 1.79) | 0.6 | [434.42, 3376.05] | 2.69 (1.28; 5.70) | 0.009 | ||
| [753.50, 3376.05] | 2.97 (1.36; 6.42) | 0.006 | |||||
| Overall HR | |||||||
| Troponin T (ng/L) | Graft survival (overall) | 7.00 | 0.44 (0.22; 0.89) | 0.021 | 13.61 | 1.00 (0.56; 1.79) | >0.9 |
| 11.50 | 0.77 (0.44; 1.37) | 0.4 | |||||
| 21.00 | 2.25 (1.11; 4.59) | 0.026 | |||||
| 48.95 | 6.52 (2.68; 15.89) | <0.001 | |||||
| Conditional HR | |||||||
| Troponin T (ng/L) | Graft survival (overall) | [2.00, 7.00) | 0.32 (0.13; 0.79) | 0.013 | [2.00, 13.61) | 0.49 (0.24; 1.01) | 0.052 |
| [7.00, 11.50) | 0.59 (0.32; 1.08) | 0.089 | |||||
| [11.50, 21.00) | 1.35 (0.73; 2.53) | 0.3 | [13.61, 48.95] | 3.86 (1.79; 8.41) | <0.001 | ||
| [21.00, 48.95] | 4.95 (2.20; 11.13) | <0.001 | |||||
| Overall HR | |||||||
| NT-proBNP (ng/L) | Graft survival (overall) | 113.00 | 0.51 (0.30; 0.89) | 0.015 | 431.05 | 1.00 (0.58; 1.72) | >0.9 |
| 298.50 | 0.76 (0.47; 1.24) | 0.3 | |||||
| 753.50 | 1.86 (0.89; 3.86) | 0.10 | |||||
| 3376.05 | 3.57 (1.35; 9.45) | 0.010 | |||||
| Conditional HR | |||||||
| NT-proBNP (ng/L) | Graft survival (overall) | [6.00, 113.00) | 0.46 (0.25; 0.84) | 0.012 | [6.00, 431.05) | 0.64 (0.38; 1.08) | 0.10 |
| [113.00, 298.50) | 0.63 (0.38; 1.02) | 0.060 | |||||
| [298.50, 753.50) | 1.20 (0.66; 2.18) | 0.6 | [431.05, 3376.05] | 3.60 (1.48; 8.85) | 0.005 | ||
| [753.50, 3376.05] | 4.06 (1.62; 10.28) | 0.003 | |||||
| Overall HR | |||||||
| Troponin T (ng/L) | Graft survival (d. cens.) | 7.00 | 0.53 (0.23; 1.21) | 0.13 | 14.45 | 1.00 (0.52; 1.94) | >0.9 |
| 11.50 | 0.78 (0.40; 1.53) | 0.5 | |||||
| 21.00 | 1.69 (0.80; 3.56) | 0.2 | |||||
| 48.95 | 5.53 (1.96; 15.62) | 0.001 | |||||
| Conditional HR | |||||||
| Troponin T (ng/L) | Graft survival (d. cens.) | [2.00, 7.00) | 0.43 (0.16; 1.16) | 0.094 | [2.00, 14.45) | 0.59 (0.26; 1.34) | 0.2 |
| [7.00, 11.50) | 0.64 (0.31; 1.35) | 0.2 | |||||
| [11.50, 21.00) | 1.15 (0.58; 2.29) | 0.7 | [14.45, 48.95] | 3.06 (1.31; 7.10) | 0.009 | ||
| [21.00, 48.95] | 3.74 (1.55; 9.03) | 0.003 | |||||
| Overall HR | |||||||
| NT-proBNP (ng/L) | Graft survival (d. cens.) | 113.00 | 0.59 (0.31; 1.11) | 0.11 | 424.30 | 1.00 (0.54; 1.85) | >0.9 |
| 298.50 | 0.81 (0.46; 1.43) | 0.5 | |||||
| 753.50 | 1.67 (0.73; 3.81) | 0.2 | |||||
| 3376.05 | 2.57 (0.78; 8.41) | 0.12 | |||||
| Conditional HR | |||||||
| NT-proBNP (ng/L) | Graft survival (d. cens.) | [6.00, 113.00) | 0.53 (0.26; 1.07) | 0.080 | [6.00, 424.30) | 0.70 (0.38; 1.30) | 0.3 |
| [113.00, 298.50) | 0.69 (0.38; 1.23) | 0.2 | |||||
| [298.50, 753.50) | 1.17 (0.59; 2.32) | 0.6 | [424.30, 3376.05] | 2.80 (0.96; 8.25) | 0.060 | ||
| [753.50, 3376.05] | 3.10 (1.01; 9.49) | 0.048 | |||||
Asterisks (*) indicate statistical significance at the p < 0.05 level. The analysis was adjusted for age, sex, coronary artery disease (CAD), and the value of estimated glomerular filtration rate (eGFR).
Disclaimer/Publisher’s Note: The statements, opinions and data contained in all publications are solely those of the individual author(s) and contributor(s) and not of MDPI and/or the editor(s). MDPI and/or the editor(s) disclaim responsibility for any injury to people or property resulting from any ideas, methods, instructions or products referred to in the content. |
© 2025 by the authors. Licensee MDPI, Basel, Switzerland. This article is an open access article distributed under the terms and conditions of the Creative Commons Attribution (CC BY) license (http://creativecommons.org/licenses/by/4.0/).
Copyright: This open access article is published under a Creative Commons CC BY 4.0 license, which permit the free download, distribution, and reuse, provided that the author and preprint are cited in any reuse.


