Submitted:
11 July 2025
Posted:
14 July 2025
You are already at the latest version
Abstract
Alcohol consumption has a long-standing global history, while alcohol intolerance is a metabolic disorder syndrome characterized by a range of discomfort-related symptoms. The effective strategies to alleviate alcohol intolerance remain an unmet medical need. In this study, multiple lactic acid bacteria (LAB) probiotic strains were isolated from pickles and evaluated for their alcohol degradation capacity through in vitro catabolic assays. Among them, the strain exhibiting the highest ethanol degradation capacity was identified and designated as Lactobacillus plantarum A2 (LpA2). The ethanol metabolism by LpA2 was subsequently evaluated by co-culture with mouse ileal contents and further validated in a pilot clinical study involving 9 volunteers. Results demonstrated that LpA2 strain possesses a remarkable capability to facilitate ethanol metabolism both in vitro & in vivo. Combined with genomic sequencing data and an excellent safety profile, LpA2 displays promising translational potential as a novel food ingredient or product.
Keywords:
Lactobacillus plantarum
; probiotic
; alcohol metabolism
1. Introduction
The combined effects of cultural exchange, entertainment, and stress relief behaviors contributed to a rising incidence of alcohol-intolerance [1]. The prevalence of alcohol intolerance varies by regions, with rates reported at 8.9% in women and 5.4% in men in Western countries, according to a survey from Cleveland Clinic (U.S.). The highest prevalence, however, is observed in Southeast China [2]. ALDH2 gene deficiency is believed to have originated from a genetic variation of Baiyue people in southern China approximately 2,000 to 3,000 years ago [2]. With the intermixing of ethnic groups, this gene deficiency has spread widely across East Asian populations, resulting in a high prevalence of alcohol intolerance among Han Chinese and other Asian communities. However, beyond genetic predisposition, the widespread drinking culture and increasing awareness of alcohol-related health risks have contributed to a growing demand for improved alcohol metabolic solutions. This demand is no longer limited to individuals with specific genotypes, but is increasingly seen across the broader population. Alcohol consumption disrupts cellular metabolism and generates excessive free radicals, resulting in a sharp rise in blood ethanol levels and symptoms such as fatigue, headache, and nausea [3]. However, 90% of ethanol is metabolized in the liver by alcohol dehydrogenase (ADH) and acetaldehyde dehydrogenase (ALDH) [4,5]. Research on the prevention and treatment of alcohol intolerance has been increasing. The syndrome is characterized by a range of symptoms, including skin warmth and flushing, nausea and vomiting, rapid heartbeat (tachycardia) or heart palpitations, throbbing headache, fatigue, stuffy nose, diarrhea, exacerbation of asthma, and other hangover-like symptoms. The most common alcohol intolerance metabolizing products on the market can be classified into two main categories [6]. The first category consists of products primarily derived from herbal extracts, such as puerarin from Pueraria lobata (Kudzu) flowers and roots, and flavonoids found in Citrus maxima, Lonicera japonica, and Hovenia acerba [7,8,9,10,11,12,13]. The second category includes protein or peptide-based anti-alcohol products, [15,16,17]. While these compounds were generally considered to delay ethanol absorption, it remained unclear whether they exert effects by directly reducing blood ethanol concentration or by accelerating ethanol metabolism. Therefore, it is necessary to explore novel strategies to enhance alcohol degradation and alleviate alcohol intolerance.
Probiotics are defined as single or mixed cultures of live microorganisms that, when administered to animals or humans, confer beneficial effects on the host by improving the characteristics of the native microbiota [18,19]. Probiotics such as Lactobacillus and Bifidobacterium have been shown efficacy in treating various challenging conditions. For instance, Lactobacillus helveticus was shown to attenuate alcoholic-induced liver injury by modulating gut microecology in mice, while Lactobacillus rhamnosus LGG could effectively reduce hepatic steatosis and inflammation in murine models [20]. Eun et al. found that a combination of Bifidobacterium LC67 and Lactobacillus plantarum LC27 could alleviate alcoholic liver injury by restoring hepatic activities of alcohol dehydrogenase and acetaldehyde dehydrogenase [21]. Additionally, Chen et al. proved that Lactobacillus boosted intestinal barrier integrity and ameliorated alcohol-related liver disease [22]. However, these probiotic strains do not directly degrade alcohol. Their primary mechanisms involve indirect pathways, such as regulating gut microbiota, enhancing intestinal barrier function, and promoting liver antioxidant capacity and anti-inflammatory response. As a result, their effectiveness in directly reducing blood alcohol concentration and accelerating alcohol metabolism remained limited.
Fermented foods, which are rich in health-promoting functional compounds and their metabolites, serve as a valuable source of probiotics [23]. For example, fermented kimchi and sour meat have been shown to exhibit various probiotic benefits, including nitrite degradation, cholesterol reduction, and antioxidant activity [24,25]. Cheese also displays antioxidant and lipid-lowering effects, contributing to a reduced risk of cardiovascular disease [26]. Jiangshui, a traditional Chinese fermented beverage, has been shown to reduce uric acid levels in the body [27]. Lactic acid bacteria (LAB) widely exist in various fermented foods. Lactobacillus plantarum K41 isolated from kimchi exhibited a growth rate of 86.3% against Streptococcus mutans, indicating its potential effectiveness in preventing oral diseases such as dental caries [28]. Lactobacillus casei isolated from cheese was shown to inhibit α-glucosidase activity by 68.5%, which may help reduce postprandial blood glucose peaks [29]. Lactobacillus fermentum JL-3 derived from Jiangshui fermentation has been reported to reduce uric acid level by 40% [27]. Based on this evidence, we speculate that lactic acid bacteria have significant application potential in fermented foods. This also provides the rationale for our screening of strains with ethanol-degrading capabilities.
The aim of this study was to identify probiotic strains capable of efficiently degrading ethanol and to evaluate the alcohol-metabolizing potential of a novel strain, Lactobacillus plantarum A2 (LpA2), through both in vitro experiments and a pilot clinical study assessing its hangover-relieving effects. Collectively, the findings provide a solid foundation for the development of probiotic-based interventions aimed at alleviating alcohol intolerance.
2. Materials and Methods
2.1. Strain Screening with Alcohol-Degrading Capability
Pickle samples were obtained from various households in Shanghai, China. A 0.5g portion of each pickle sample was suspended in 4.5 mL of sterile physiological saline, thoroughly shaken to ensure proper dispension, and then serially diluted in ten-fold increments. From each dilution, 100 μL was spreaded evenly onto screening media containing CaCO3, and incubated under anaerobic conditions at 37 ℃ for 36 - 48 hours. Colonies with obvious transparent halos were selected and further purified by streaking on MRS agar plates until uniform single-colony morphology was achieved. The purified isolates were preserved in 50% glycerol at -80 ℃ for storage.
2.2. In Vitro Measurement of the Ethanol Degradation Capacity of Isolated Strains
To evaluate the ethanol degradation capacity of the strain, the isolate was inoculated into MRS liquid medium and cultured at 37 °C with shaking at 200 rpm for 18 - 20 hours. Bacterial growth was monitored by measuring optical density at 600 nm (OD600). The culture was then centrifuged at 10,000 rpm for 5 minutes, and the bacterial pellet was washed twice with equal volume of sterile normal saline (NS) to remove residual medium components. The bacterial suspension was adjusted to a final concentration of 1010 CFU/mL. Ethanol was added to the system to reach a final ethanol concentration of 2 g/L, and the mixture was incubated under anaerobic conditions at 37°C for 4 hours. Following incubation, the solution was centrifuged at 10,000 rpm for 5 minutes to collect the supernatant. After filtration, 20 μL of the supernatant was injected into a high-performance liquid chromatography (HPLC, Agilent Technologies) system to quantify the remaining ethanol. HPLC conditions were as follows: Hi-Plex H column (300 mm × 7.7 mm, Agilent Technologies), with mobile phase of 5 mM H2SO4, at a flow rate of 0.7 mL/min; the column and detector temperature were set at 50 ℃, whereby the refractive index detector (RID) was used by setting wavelength at 265 nm.
2.3. Strain Identification
The isolated strains were streaked onto MRS agar and incubated under anaerobic conditions at 37 ℃ for 24 hours. Colony morphology was observed, and representative single colonies were selected for Gram staining. Cell morphology and staining results were examined by light microscopy. Genome DNA was extracted by Ezup Column Bacteria Genomic DNA Purification Kit (Sangon Biotech, China) for sequencing. Species identification was performed by sequencing the 16S rDNA region of the isolates. The obtained sequences were compared against entries in the GenBank database using NCBI BLAST. Sequences with high homology were selected and aligned by BioEdit. Phylogenetic analysis was conducted using Neighbor-Joining (NJ) method based on 16S rDNA sequence by MEGA software.
2.4. Ex Vivo Measurement of Ethanol Degradation Capacity of Isolated Strain
Thirty male C57BL/6J mice (8 weeks old, 20-22 g) were purchased from Charles River Laboratories Inc., All mice were housed in groups of four per cage under controlled conditions (22 ± 1°C and 60 % – 75 % relative humidity) and fed a standard commercial chow diet. All mice were used for experiments after one week of adaptation. All experimental procedures involving animals were approved by the Experimental Animal Welfare Ethics Committee of Youshu Biotechnology (Shanghai) Co., Ltd., and were conducted in accordance with relevant animal ethical laws and regulations (Animal welfare approval number: YS-m202505003).
Strains LpA2 and Lp-8 were cultured in MRS culture medium at 37 ℃ with shaking at 200 rpm to obtain fresh bacterial suspensions. Thirty mice were randomly divided into three groups, with 10 mice in each group. Mice in the blank control group received 200µL/g of normal saline via oral gavage, while the LpA2 and Lp-8 groups were gavaged with 200µL/g bacterial suspensions at the concentration of 1011CFU/mL. After 30 min, the mice were euthanized and the ileum contents were collected, and an equal mass 4g/L ethanol PBS solution was added (1:1 w/w). The mixtures were incubated under anaerobic conditions at 37℃ for 3 hours. Ethanol content in the co-culture of ileal contents and bacterial suspensions was subsequently quantified by HPLC system.
2.5. Alcohol Metabolism and Retinal Vascular Response After SipSpark™
The experimental product used in this study was a freeze-dried powder containing LpA2, manufactured by Wecare Inc., Suzhou, China and the product name is SipSpark™. Every sachet contains more than 3x10¹¹ CFU/g of probiotics.
A pilot clinical trial was approved by the Institutional Review Board of Shanghai General Hospital and conducted in accordance with the Declaration of Helsinki. Written informed consent was obtained from all participants prior to enrollment. The study was registered on clinicaltrials.gov (ID: NCT03416088). This was a randomized, crossover assignment, single-blind (Outcomes Assessor) and interventional clinical trial with basic science purposes. This study aimed to evaluate the potential alcohol-metabolizing effects of the LpA2 strain in healthy adults. Nine participants were enrolled in this study. Prior to participation, all subjects were thoroughly informed about the objectives and procedures, and written informed consent was obtained.
Inclusion Criteria: Eligible participants were adults aged from 18 to 35 years, with body mass index (BMI) between 18 to 25 kg/m2. Without another eye disease besides ametropia. 1) The spherical equivalent is equal or above minus 3.00 diopters; 2) No smoking or drinking; 3) Average daily caffeine consumption no more than 1 cup of coffee; 4) No diabetes, hypertension, heart disease, liver or kidney dysfunction; 5) No medication taken recently. Exclusion criteria included: 1) Mental disorders such as depression and anxiety; 2) Intellectual disabilities; 3) Female in menstruation, gestation period, perinatal period or lactation period; 4) Unable to cooperate with eye examinations and test procedures; 5) Heart disease, hypertension, diabetes, liver and kidney dysfunction and other chronic diseases; 6) Patients with fever, acute infectious diseases; 7) Other conditions that are not suitable for drinking alcohol or coffee, such as allergic to alcohol or coffee; 8) Participants had the best corrected visual acuity (BCVA) in the worse eye above 20/20, a spherical equivalent of -1.1 D ± 1.5 (SD), and with no other ocular diseases.
The alcohol metabolism test was divided into two phases: pre- and post-intervention. In both phases, participants consumed 300 ml of 13% ethanol within 10 minutes. One sachet of SipSparkTM was taken by each participant half an hour before alcohol consumption. Blood samples were collected at 0 and 30minutes post-ingestion to measure ethanol and acetaldehyde concentrations. Simultaneously, the expiratory alcohol concentration was measured with a breath alcohol testor (model, Ling Hu type 3). Venous blood samples were collected by EDTA-coated tubes and transferred into headspace bottles containing sodium chloride. The contents of ethanol and acetaldehyde were detected by gas chromatography-mass spectrometry (GC-MS, Agilent Technologies). The conditions of analysis were as follows: DB-ALC2 column (30 m × 0.320 mm × 1.20 μm, Agilent Technologies), column flow rate was set at 2.5 mL/min and split ratio at 20:1. The inlet temperature was set at 250 °C, and the oven temperature was set at 40 °C. Equilibration time was set at 2 min, injection time was set at 0.25 min, and cycle time was set at 5 min.
The impact of SipSpark™ on alcohol-related retinal vascular constriction was assessed through a randomized self-controlled approach. One sachet of SipSparkTM was taken by each participant half an hour before alcohol consumption. Spectral-domain optical coherence tomography angiography (SD-OCTA) was performed at baseline and 0.5 h and 2 h after Baijiu consumption.
Images of SD-OCTA (Cirrus, Carl Zeiss Meditec, USA) were collected according to previous studies [30]. Quantitative analysis was performed using custom MATLAB (R2013b) software to convert both segmented and unsegmented angiographic images into binarized and skeletonized images. Parameters including vessel diameter index, vessel area density, and flow impairment region were used to describe the retinal microvascular morphology.
2.6. Statistical Analysis
All data were analyzed by SPSS (version 26.0) and GraphPad Prism (version 9.0). One-way analysis of variance (ANOVA) was used to assess differences among multiple groups. The significant differences comparison between the two groups were conducted using an independent samples T-test. A p-value < 0.05 was considered statistically significant. The effects of SipSparkTM on physiological/biochemical parameters following baijiu consumption were evaluated using a two-way repeated measures ANOVA, which simultaneously assessed the main effects of Group (baijiu-only vs. SipSparkTM-baijiu), Time (0h, 0.5h, and 2h), and interaction.
3. Results
3.1. Isolation and Screening of Alcohol-Degrading Strains
To investigate the alcohol-degradation potential of probiotics, ten LAB strains were isolated from homemade pickles samples using serial dilution and plating method. Their alcohol degradation capacities were subsequently quantified by HPLC. As shown in Table S1, under a 2 g/L ethanol reaction system, strain LpA2 exhibited the highest ethanol degradation efficiency, followed by LpA3. Comparing with several commercially available alcohol-degrading probiotic strains Pediococcus pentosaceus (Pp), Bacillus subtilis (BS), and Lactobacillus plantarum (Lp-8), LpA2 demonstrated a significantly superior ability to degrade ethanol (Figure 1). Notably, LpA2 achieved a 16.25% reduction in ethanol concentration within 4 hours. Therefore, LpA2 was selected for subsequent studies.
3.2. Identification of Strain LpA2
The colony and cellular morphology of strain LpA2 grown on MRS agar plates were shown in Figure 2. Colonies of strain LpA2 appeared milky white, with a smooth surface, no wrinkles, opaque appearance, and neat edges. The cells were found rod-shaped. Gram staining indicated that LpA2 is a Gram-positive bacterium, as evidenced by the purple coloration of cells.
The phylogenetic analysis results were shown in Figure 3. As shown in Figure 3, strain LpA2 and Lactobacillus plantarum TCC 14917 are clustered into the same branch, exhibiting 71% similarity based on the 16S rDNA analysis. Further comparison using whole-genome sequencing revealed that strain LpA2 shares 99.2% Average Nucleotide Identity (ANI) with L. plantarum ATCC 14917, exceeding the 95% species demarcation threshold, thus confirming that LpA2 belongs to the L. plantarum species (Figure 3B). The genome circos diagram of LpA2 was shown in Figure 3C, indicating a total genome length of 3,205,044 bp.
In terms of safety assessment, whole-genome sequencing and bioinformatics analysis identified no known virulence factor genes in LpA2 strain, as verified by VFDB and PATRIC analysis. Additionally, no antimicrobial resistance genes were detected using CARD and ResFinder databases, supporting the safety profile of LpA2 strain for potential probiotic applications.
3.3. Alcohol Degradation Capacity of LpA2 Strain in Mouse Ileal Contents
To assess the ethanol-degrading capacity of strain LpA2 in a physiologically relevant environment, LpA2 was co-cultured with ileal contents collected from mice, and ethanol concentration was quantified using HPLC. The results revealed a significant reduction of 47.8 % in ethanol levels in the co-culture group compared to the control group without probiotics (p = 0.0001, Figure 4). This finding indicates that LpA2 possesses a strong ability to degrade ethanol under conditions simulating the intestinal milieu.
Moreover, the degradation effect was both time- and dose-dependent, suggesting an active metabolic process rather than passive absorption. These results provide strong in vitro evidence that LpA2 can facilitate ethanol clearance in the gut, highlighting its potential as a probiotic intervention for alleviating the alcohol-induced gastrointestinal and systemic effects.
3.4. Alcohol Metabolism and Retinal Vascular Response Post SipSpark™ Consumption
Changes in blood alcohol levels after alcohol consumption were measured at 0 h and 0.5 h. At 0 h post-consumption of alcohol, the average alcohol concentration of 9 participants was 451.26 ± 133.30 μg/mL. At 0.5 h post-intervention with LpA2 powder, the concentration decreased to 264.04 ± 127.04 μg/mL, representing a statistically significant reduction of 41% (p = 0.0152, Figure 5A). In addition, the average acetaldehyde level decreased from 211.14 ± 81.18 μg/mL to 169.89 ± 40.00 μg/mL at 0.5 h post-intervention, repflecting a 19.5 % reduction, although the difference was not significantly different (Figure 5B). The results indicated that LpA2 could accelerate the degradation of alcohol and potentially reduce the accumulation of toxic intermediates such as acetaldehyde, thereby alleviating the physiological burden and hangover symptoms associated with alcohol consumption.
The breath alcohol analysis revealed a significant reduction in ethanol concentration following intervention with LpA2. At 30 minutes post-ingestion of ethanol, participants exhibited markedly lower breath alcohol levels compared to baseline values after consuming the LpA2 product (Figure 6). Such decrease suggests that LpA2 may accelerate ethanol metabolism in vivo. The reduction in breath alcohol was consistent across most participants, reinforcing the potential of LpA2 in mitigating the acute effects of alcohol consumption
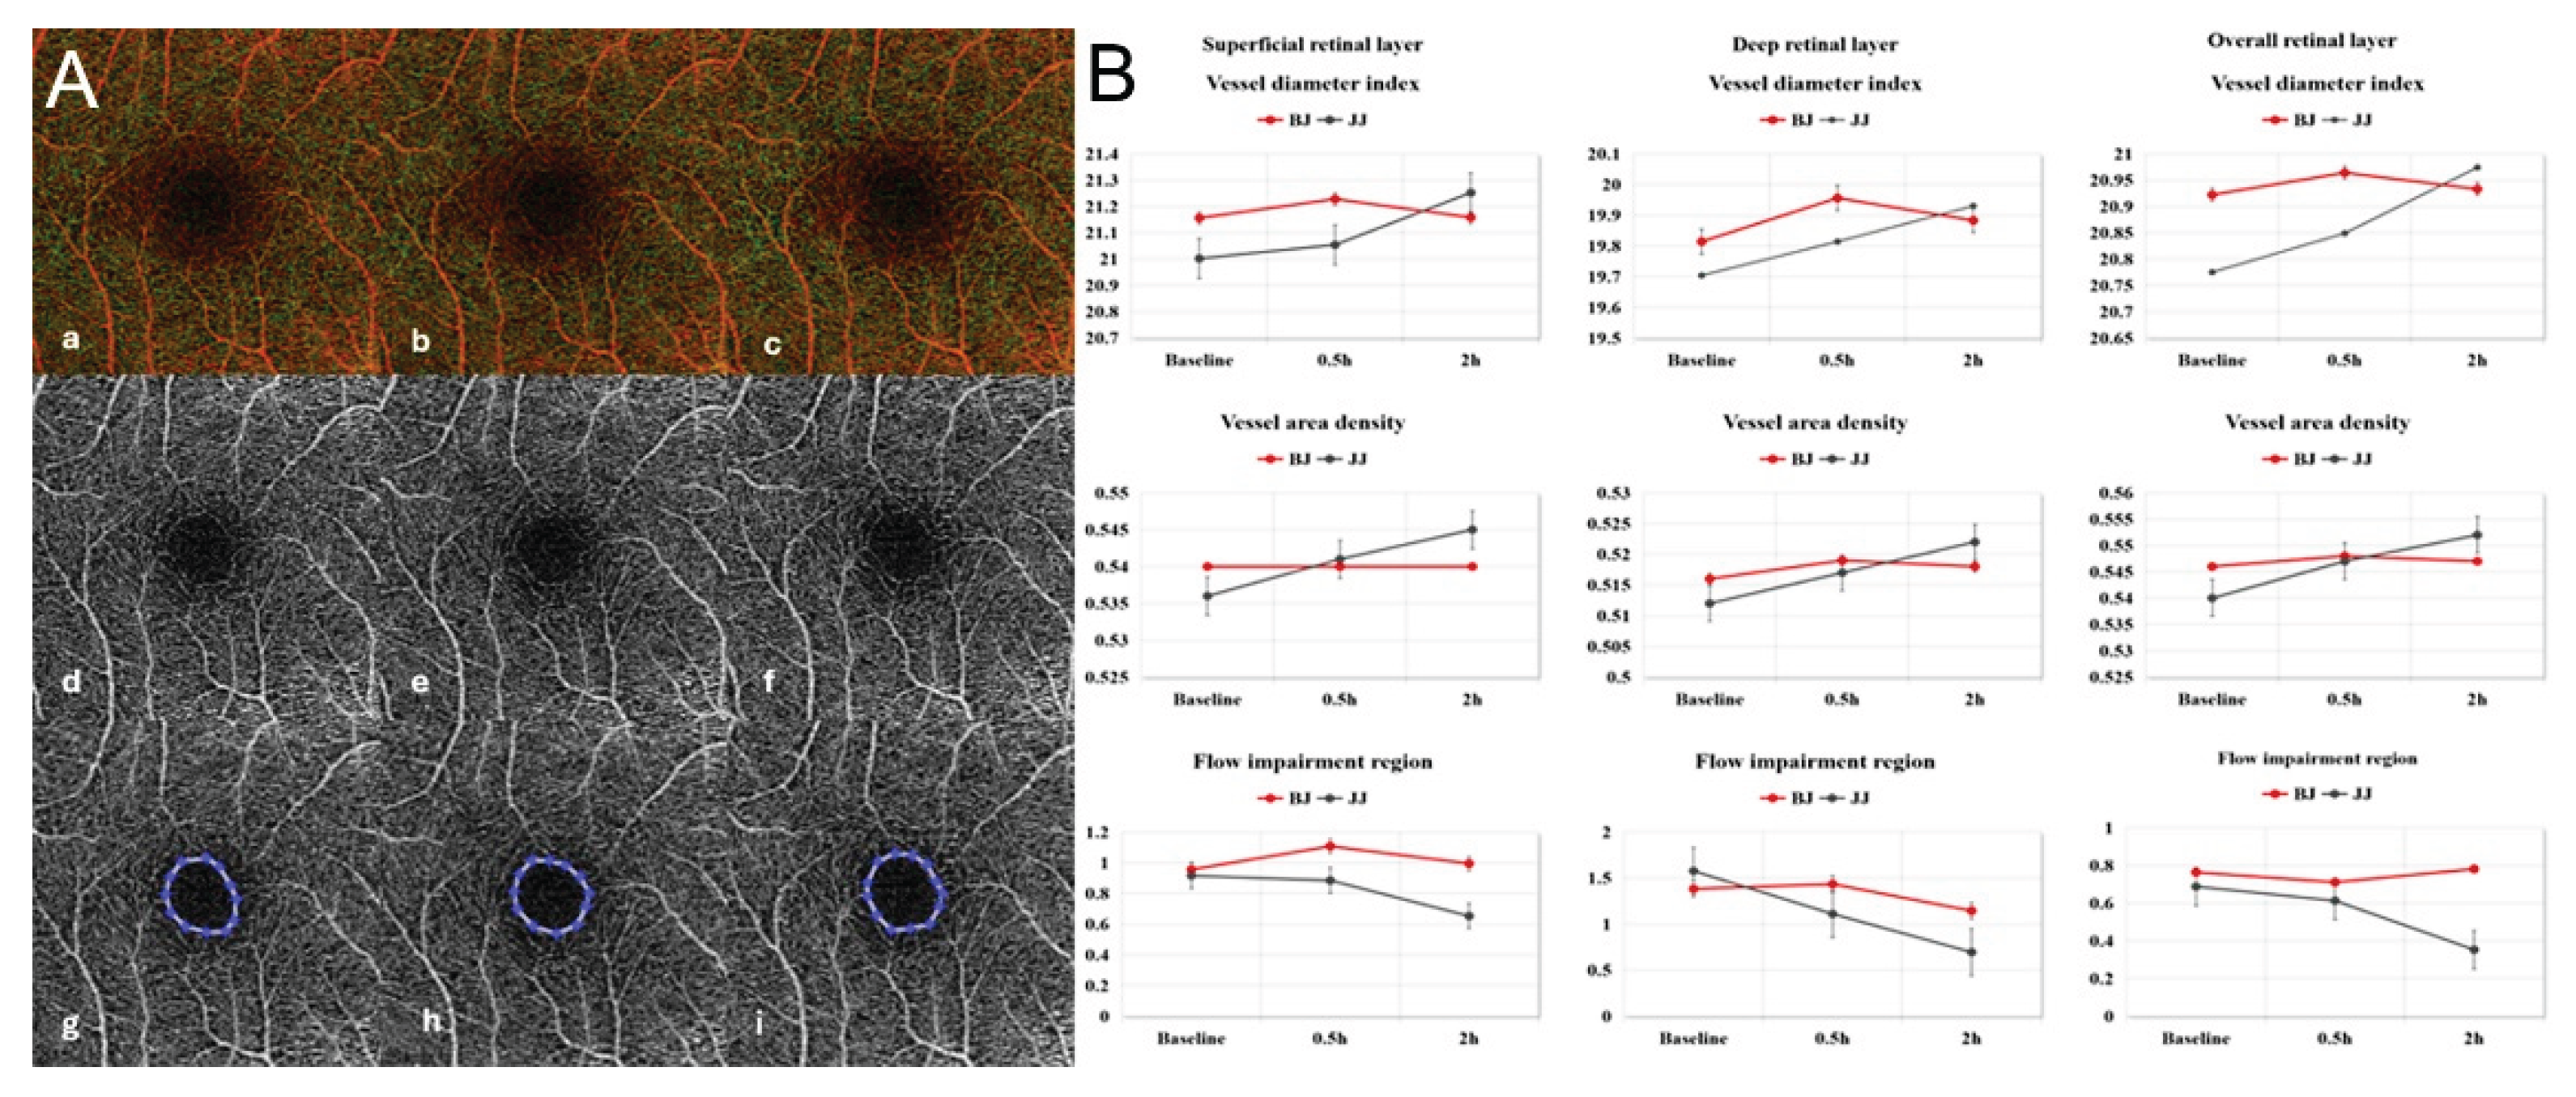
In previous study, we found that after alcohol consumption, vessel diameter index and vessel area density of volunteers increased significantly at 0.5 h after red wine consumption, but decreased significantly at 2 h (unpublished data), which represents the vessel constriction effect of alcohol. In the present research, 2 hours after drinking liquor, the vascular diameter index and vascular area density of the BJ group decreased, and the scope of blood flow damage expanded, while the effects of ethanol disappeared in the JJ group (Table S2, Figure 7). These findings supported that SipSparkTM significantly attenuated such effects by degrading alcohol.
3.5. Safety Evaluation
No serious adverse events were reported throughout the study period. All participants maintained vital signs within the normal range, and no clinically significant abnormalities were observed. Importantly, no participant withdrew from the study due to adverse effects, indicating good tolerability and safety of LpA2 intervention.
4. Discussion
The presence of ethanol in the fermentation matrix likely acted as selective pressure, favoring the survival and enrichment of LAB strains capable of withstanding alcohol stress. Compared to the currently available alcohol-degrading strains, the superior alcohol degradation capacity of LpA2 highlights its excellent potential for translational applications. Ethanol is known to disrupt bacterial membranes, denature proteins, and impair metabolic enzymes. However, certain LAB species have evolved robust membrane structures, stress response systems, and protective metabolic pathways that enable survival in ethanol-rich environments [31,32]. Moreover, baijiu (Chinese white liquor) contains not only ethanol but also a complex mixture of aromatic compounds, fusel oils, and organic acids, which may impose additional oxidative and osmotic stress. The ability of LAB strains to survive under such conditions suggests the presence of multi-stress resistance mechanisms, possibly including increased expression of heat shock proteins, accumulation of compatible solutes such as trehalose, and alterations in membrane fatty acid composition [33,34]. These adaptive features make alcohol-tolerant LAB strains particularly attractive for applications in functional fermented foods and probiotics designed to assist with alcohol metabolism.
Approximately 20 alcohol-tolerant LAB strains were isolated from fermented pickle products containing added baijiu. Among these, the novel probiotic strain LpA2 exhibited the strongest alcohol-degrading capacity (Figure 1). The alcohol metabolism-promoting potential of LpA2 was systematically evaluated through a combination of in vitro assays, co-culture with mouse ileal contents, and a pilot clinical study involving healthy human volunteers. Notably, after oral administration of LpA2-containing probiotic powder, participants showed a significant reduction in booth blood and breath ethanol concentrations. These findings suggest that LpA2 effectively promotes alcohol metabolism and may help alleviate the physiological burden associated with alcohol consumption.
Several previous studies support our findings, demonstrating that fermented products exposed to high ethanol concentrations, such as traditional pickles or rice wine mash, are valuable sources for isolating ethanol-tolerant LAB strains, including L. plantarum, Lactobacillus brevis, and Pediococcus pentosaceus [35,36]. For example, a mutant strain of Leuconostoc mesenteroides has been shown to exhibit enhanced lactic acid tolerance and acid production, attributed to mutations in the ATPase ε subunit and upregulation of intracellular ammonia, which together help maintain intracellular pH homeostasis [37]. Additionally, overexpressing of the GroESL chaperone proteins in Lactococcus lactis significantly improved both heat and solvent tolerance. Under heat and high-salt stress conditions, the GroESL-overexpressing strains showed enhanced survival, underlining the essential role of molecular in stress adaptation [38]. Collectively, these studies highlight that LAB strains, through long-term adaptive evolution, have developed diverse mechanisms to withstand environmental stress. These adaptive traits not only enhance their survivability in harsh environments but also make them highly valuable candidates for applications in food fermentation and probiotic formulations.
Although a significant decrease in blood ethanol concentration was observed following LpA2 intervention, the corresponding reduction in acetaldehyde levels did not reach statistical significance (Figure 5). This discrepancy might be attributed to the intrinsic dynamics of human ethanol metabolism. Notably, the short observational window of 0.5 hours post-ingestion may not adequately reflect the slower kinetics of acetaldehyde clearance, which typically lags behind that of ethanol. Moverover, LAB strains such as L. plantarum primarily metabolize ethanol through ADH activity, resulting in the conversion of ethanol to acetaldehyde [39]. However, many LAB strains exhibit limited ALDH activity, which is essential for the subsequent oxidation of acetaldehyde into acetate. Consequently, although ethanol is efficiently degraded, acetaldehyde may transiently accumulate or persist, leading to incomplete detoxification during the early metabolic phase.
The current study on the preventive and alleviative effect of LpA2 on alcohol intolerance highlights its potential as a novel functional food ingredient. Furthermore, the integration of synthetic biology with intelligent fermentation technologies offers promising avenues for the development of efficient, stable, and precisely controllable probiotic delivery systems. These advancements are expected to facilitate the translational applications of LpA2 from laboratory research to large-scale production within the food industry.
Supplementary Materials
The following supporting information can be downloaded at the website of this paper posted on Preprints.org, Table S1: ETOH degradation ability of 10 strains. Table S2: Quantitive analysis of SD-OCTA parameters.
Author Contributions
B.C., H.L., and X.C. contributed equally to this work and should be considered co-first authors. Conceptualization, B.C. and C.N.; methodology, B.C. and X.C.; formal analysis, investigation, and data curation, B.C., H.L., Z.M., T.X. and Y. X.; writing—original draft preparation, H.L. B.C.; writing—review and editing, X.C.; supervision, C.N.; project administration, B.C., Y. X., H.Z. and C.N. We appreciate the precious advice from Prof. Tian Xu, Westlake University during the research activity planning and execution.
Conflicts of Interest
The authors declare no conflicts of interest.
References
- Ou, Y.; Zhang, W.; Lan, J.; Huang, X.; Li, N. A combination of multi-strain probiotics, prebiotic, and plant extracts improves ethanol-induced hangover outcomes in a zebrafish model. Funct. Foods Health Dis 2024, 14, 728-738. [CrossRef]
- Li, H.; Borinskaya, S.; Yoshimura, K.; Kal'ina, N.; Marusin, A.; Stepanov, V.A.; Qin, Z.; Khaliq, S.; Lee, M.Y.; Yang, Y.; Mohyuddin, A.; Gurwitz, D.; Mehdi, S.Q.; Rogaev, E.; Jin, L.; Yankovsky, N.K.; Kidd, J.R.; Kidd, K.K. Refined geographic distribution of the oriental ALDH2*504Lys (nee 487Lys) variant. Ann. Hum. Genet 2009, 73, 335-45. [CrossRef]
- Zhang, L.L.; Zhang, Y.H.; Liu, S.J.; Song, J.J.; Suo, H.Y. Degradation effects and mechanisms of Limosilactobacillus fermentum on ethanol. Food Funct 2024, 15, 10283-10299. [CrossRef]
- Shukla, S.D.; Aroor, A.R.; Restrepo, R.; Kharbanda, K.K.; Ibdah, J.A. In Vivo Acute on Chronic Ethanol Effects in Liver: A Mouse Model Exhibiting Exacerbated Injury, Altered Metabolic and Epigenetic Responses. Biomolecules 2015, 5, 3280-3294. [CrossRef]
- Hyun, J.; Han, J.; Lee, C.; Yoon, M.; Jung, Y. Pathophysiological Aspects of Alcohol Metabolism in the Liver. Int. J. Mol. Sci 2021, 22, 5717. [CrossRef]
- Nosova, T.; Jousimies-Somer, H.; Jokelainen, K.; Heine, R.; Salaspuro, M.; Acetaldehyde production and metabolism by human indigenous and probiotic Lactobacillus and Bifidobacterium strains. Alcohol Alcohol 2000, 35, 561–568. [CrossRef]
- Gao, X.Q. Effects of Pueraria lobata and Flos Puerariae Lobatae on Alcoholism and Liver Protection and Its Mechanism. Jiangnan University, China, 2013.
- Jung, S.H.; Lee, Y.H.; Lee, E.K.; Park, S.D.; Shim, J.J.; Lee, J.L.; Yoo, H.H. Effects of plant-based extract mixture on alcohol metabolism and hangover improvement in humans: a randomized, double-blind, paralleled, placebo-controlled clinical trial. J. Clin. Med 2023, 12, 5244. [CrossRef]
- Hou, J.L.; Mao, J.N.; Hu, Y. Study on in vitro antioxidant activity of the combination of Pueraria lobata and Hovenia dulcis Thunb. Advances in animal medicine 2020, 41, 63-69. [CrossRef]
- Zhang, G.Z.; Ji, J.W.; Liu, P.P. Study on the preventive and therapeutic effects of pueraria lobata, pueraria lobata and their total flavonoids on alcoholic liver disease in rats. J. Liaoning Univ. Tradit. Chin. Med 2020, 22, 29-32. [CrossRef]
- Ju, J.M. Study on processing technology of Huyou Pueraria fermented beverage and its hangover relieving effect. Nanjing Agricultural University, China, 2020.
- Li, J. Study on the Anti-hangover Effect of Flavonoids Extracts from Seven Physical Raw Materials. South China Agricultural University,China, 2018.
- Xu, Y. Experimental Study on Protective Effects of Flos Puerariae Lobatae, Semen Hoveniae and Their Compatibility on Acute Alcoholic Liver Injury in Mice. Beijing University of Chinese Medicine, China, 2020.
- Moslemi, M.; Jannat, B.; Mahmoudzadeh, M.; Ghasemlou, M.; Abedi, A.S. Detoxification activity of bioactive food compounds against ethanol-induced injuries and hangover symptoms: A review. Food Sci. Nutr 2023, 11, 5028-5040. [CrossRef]
- Zhou, Y.; Chen, Y.; Wang, Q. Study on the Anti-hangover Effect of Soybean Peptide and Its Mechanism. Chin. Herb. Med 2014, 37, 1033-1036. [CrossRef]
- Ma, Z.; Hou, T.; Shi, W.; Liu, W.; He, H. Inhibition of Hepatocyte Apoptosis: An Important Mechanism of Corn Peptides Attenuating Liver Injury Induced by Ethanol. Int. J. Mol. Sci 2015, 16, 22062-22080. [CrossRef]
- Woo, M.; Cha, J.H.; Kim, Y.; Kang, H.T.; Kim, H.; Cho, K.W.; Lee, J.H. Evaluation of the effects of Hangover-releasing agent containing freeze-dried mature silkworm larval powder (SMSP) on alcohol metabolism and hangover improvement. Korean J. Food Sci. Technol 2021, 53, 72-77. [CrossRef]
- Novik, G.; Savich, V. Beneficial microbiota. Beneficial microbiota. Probiotics and pharmaceutical products in functional nutrition and medicine. Microbes Infect 2020. 22, 8-18. [CrossRef]
- Goldin, B.R. Health benefits of probiotics. British Journal of Nutrition 1998, 80, S203-S207. [CrossRef]
- Kim, S.H.; Lee, I.C.; Ko, J.W. Diallyl Disulfide Prevents Cyclophosphamide-Induced Hemorrhagic Cystitis in Rats through the Inhibition of Oxidative Damage, MAPKs, and NF-κB Pathways. Biomol Ther (Seoul) 2015, 23, 180-188. [CrossRef]
- Kwon, E.K.; Kang, G.D.; Kim, W.K. Lactobacillus plantarum LC27 and Bifidobacterium longum LC67 simultaneously alleviate ethanol-induced gastritis and hepatic injury in mice. J. Funct. Foods 2017, 38, 389-398. [CrossRef]
- Chen, L.; Yang, P.; Hu, L.; Yang, L.; Chu, H.; Hou, X. Modulating phenylalanine metabolism by L. acidophilus alleviates alcohol-related liver disease through enhancing intestinal barrier function. Cell Biosci 2023, 13, 24. [CrossRef]
- Castellone, V.; Bancalari, E.; Rubert, J.; Gatti, M.; Neviani, E.; Bottari, B. Eating Fermented: Health Benefits of LAB-Fermented Foods. foods 2021, 10, 2639. [CrossRef]
- Tang, W.; Hu, W.; Wang, J.R.; Wang, J.J.; Wang, Y.P. Identification of a new probiotic Lactobacillus alimentarius W369 from Chinese traditional pickles. Acta Microbiol. Sin 2016, 56, 932-42. [CrossRef]
- Wang, X.H.; Yu, P.; Li, J.R. SinicaIsolation and identification of cholesterol-reducing lactic acid bacteria from indigenously fermented pickles and dried-sausage. Acta Microbiol. Sin 2009, 49, 1438-44. [CrossRef]
- Azat, R.; Liu, Y.; Li, W. Probiotic properties of lactic acid bacteria isolated from traditionally fermented Xinjiang cheese. Zhejiang Univ 2016, 17, 597–609. [CrossRef]
- Wu, Y.; Ye, Z.; Feng, P.; Li, R.; Chen, X.; Tian, X.; Li, X. Limosilactobacillus fermentum JL-3 isolated from “Jiangshui” ameliorates hyperuricemia by degrading uric acid. Gut Microbes 2021, 13. [CrossRef]
- Zhang, G.; Lu, M.; Liu, R.; Tian, Y.; Vu, V.H.; Li, Y.; Liu, B.; Kushmaro, A.; Li, Y.; Sun, Q. Inhibition of Streptococcus mutans Biofilm Formation and Virulence by Lactobacillus plantarum K41 Isolated From Traditional Sichuan Pickles. Front Microbiol 2020, 11, 774. [CrossRef]
- Chen, P.; Zhang, Q.X.; Dang, H.; Liu, X.M.; Tian, F.W.; Zhao, J.X.; Chen, Y.Q.; Zhang, H.; Chen, W. Screening for potential new probiotic based on probiotic properties and α-glucosidase inhibitory activity, Food Control 2014, 35, 65-72. [CrossRef]
- Kim, A.Y.; Rodger, D.C.; Shahidzadeh, A. Quantifying Retinal Microvascular Changes in Uveitis Using Spectral-Domain Optical Coherence Tomography Angiography. Am J Ophthalmol 2016, 171, 101-12. [CrossRef]
- Ingram, L.O.; Buttke, T.M. Effects of alcohols on microorganisms. Adv. Microb. Physiol 1984, 25, 253–300.
- Papadimitriou, K.; Alegría, Á.; Bron, P.A.; de Angelis, M.; Gobbetti, M.; Kleerebezem, M.; Lemos, J.A.; Linares, D.M.; Ross, P.; Catherine, T.; Francescavan, S.; Douwe, V.; Pekka, Ventura.; Marco, Z.M.; Tsakalidou, E.; Kok, J. Stress physiology of lactic acid bacteria. Microbiol. Mol. Biol. Rev 2016, 80, 837–890. [CrossRef]
- Derunets, A.S., Selimzyanova, A.I., Rykov, S.V. et al. Strategies to enhance stress tolerance in lactic acid bacteria across diverse stress conditions. World J Microbiol Biotechnol 2024, 40, 2024. [CrossRef]
- Sun, H.; Park, S.; Mok, J.; Seo, J.; Lee, N.D.; Yoo, B. Efficacy and Safety of Wilac L Probiotic Complex Isolated from Kimchi on the Regulation of Alcohol and Acetaldehyde Metabolism in Humans. Foods 2024, 13, 3285. [CrossRef]
- Hermien, B.V.; Tjakko, A.; Marcel, T.; Peter, A. B.; Michiel, K.; Maria, L. Short- and Long-Term Adaptation to Ethanol Stress and Its Cross-Protective Consequences in Lactobacillus plantarum. Appl Environ Microbiol 2011, 77, 15. [CrossRef]
- Lee, J.S.; Heo, G.Y.; Lee, J.W.; Oh, Y.J.; Park, J.A.; Park, Y.H.; Pyun, Y.R.; Ahn, J.S. Analysis of kimchi microflora using denaturing gradient gel electrophoresis. Int. J. Food Microbiol 2005, 102, 143–150. [CrossRef]
- Ju, S.Y.; Kim, J.H.; Lee, P.C. Long-term adaptive evolution of Leuconostoc mesenteroides for enhancement of lactic acid tolerance and production. Biotechnol Biofuels 2016, 9, 240. [CrossRef]
- Desmond, C.; Fitzgerald, G.F.; Stanton, C.; Ross, R.P. Improved Stress Tolerance of GroESL-Overproducing Lactococcus lactis and Probiotic Lactobacillus paracasei NFBC 338. Appl. Environ. Microbiol 2004, 70, 5929-5936. [CrossRef]
- Jung, S.J.; Hwang, J.H.; Park, E.O.; Lee, S.O.; Chung, Y.J.; Chung, M.J.; Lim, S.; Lim, T.J.; Ha, Y.; Park, B.H. Regulation of Alcohol and Acetaldehyde Metabolism by a Mixture of Lactobacillus and Bifidobacterium Species in Human. Nutrients 2021, 13, 1875. [CrossRef]
Figure 1.
Ethanol degradation ability of strains LpA2, LpA3, Pp, BS and Lp-8 (n=10 per group).C, Control group, blank without bacteria. The significant differences comparison between the two groups were conducted using an independent samples T-test. * (p < 0.05), * * * (p < 0.001).
Figure 1.
Ethanol degradation ability of strains LpA2, LpA3, Pp, BS and Lp-8 (n=10 per group).C, Control group, blank without bacteria. The significant differences comparison between the two groups were conducted using an independent samples T-test. * (p < 0.05), * * * (p < 0.001).
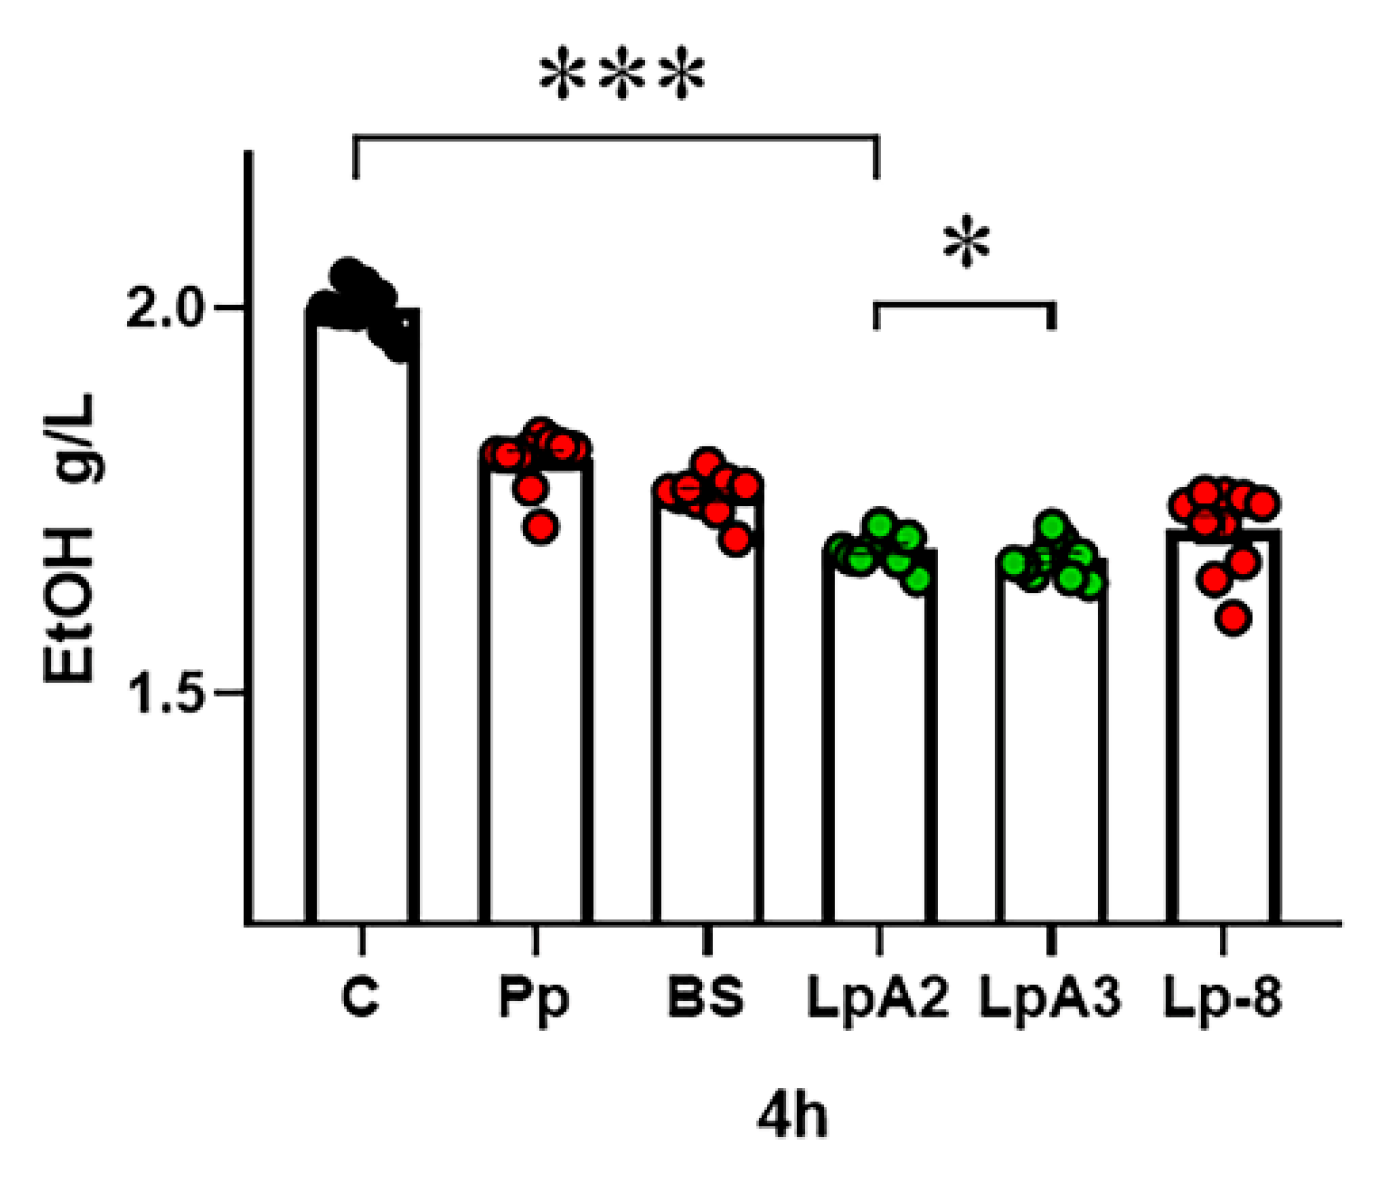
Figure 2.
Morphological characteristics of LpA2. (A) MRS agar, (B) MRS agar with supplementation of CaCO3, (C) cell morphology post gram staining.
Figure 2.
Morphological characteristics of LpA2. (A) MRS agar, (B) MRS agar with supplementation of CaCO3, (C) cell morphology post gram staining.
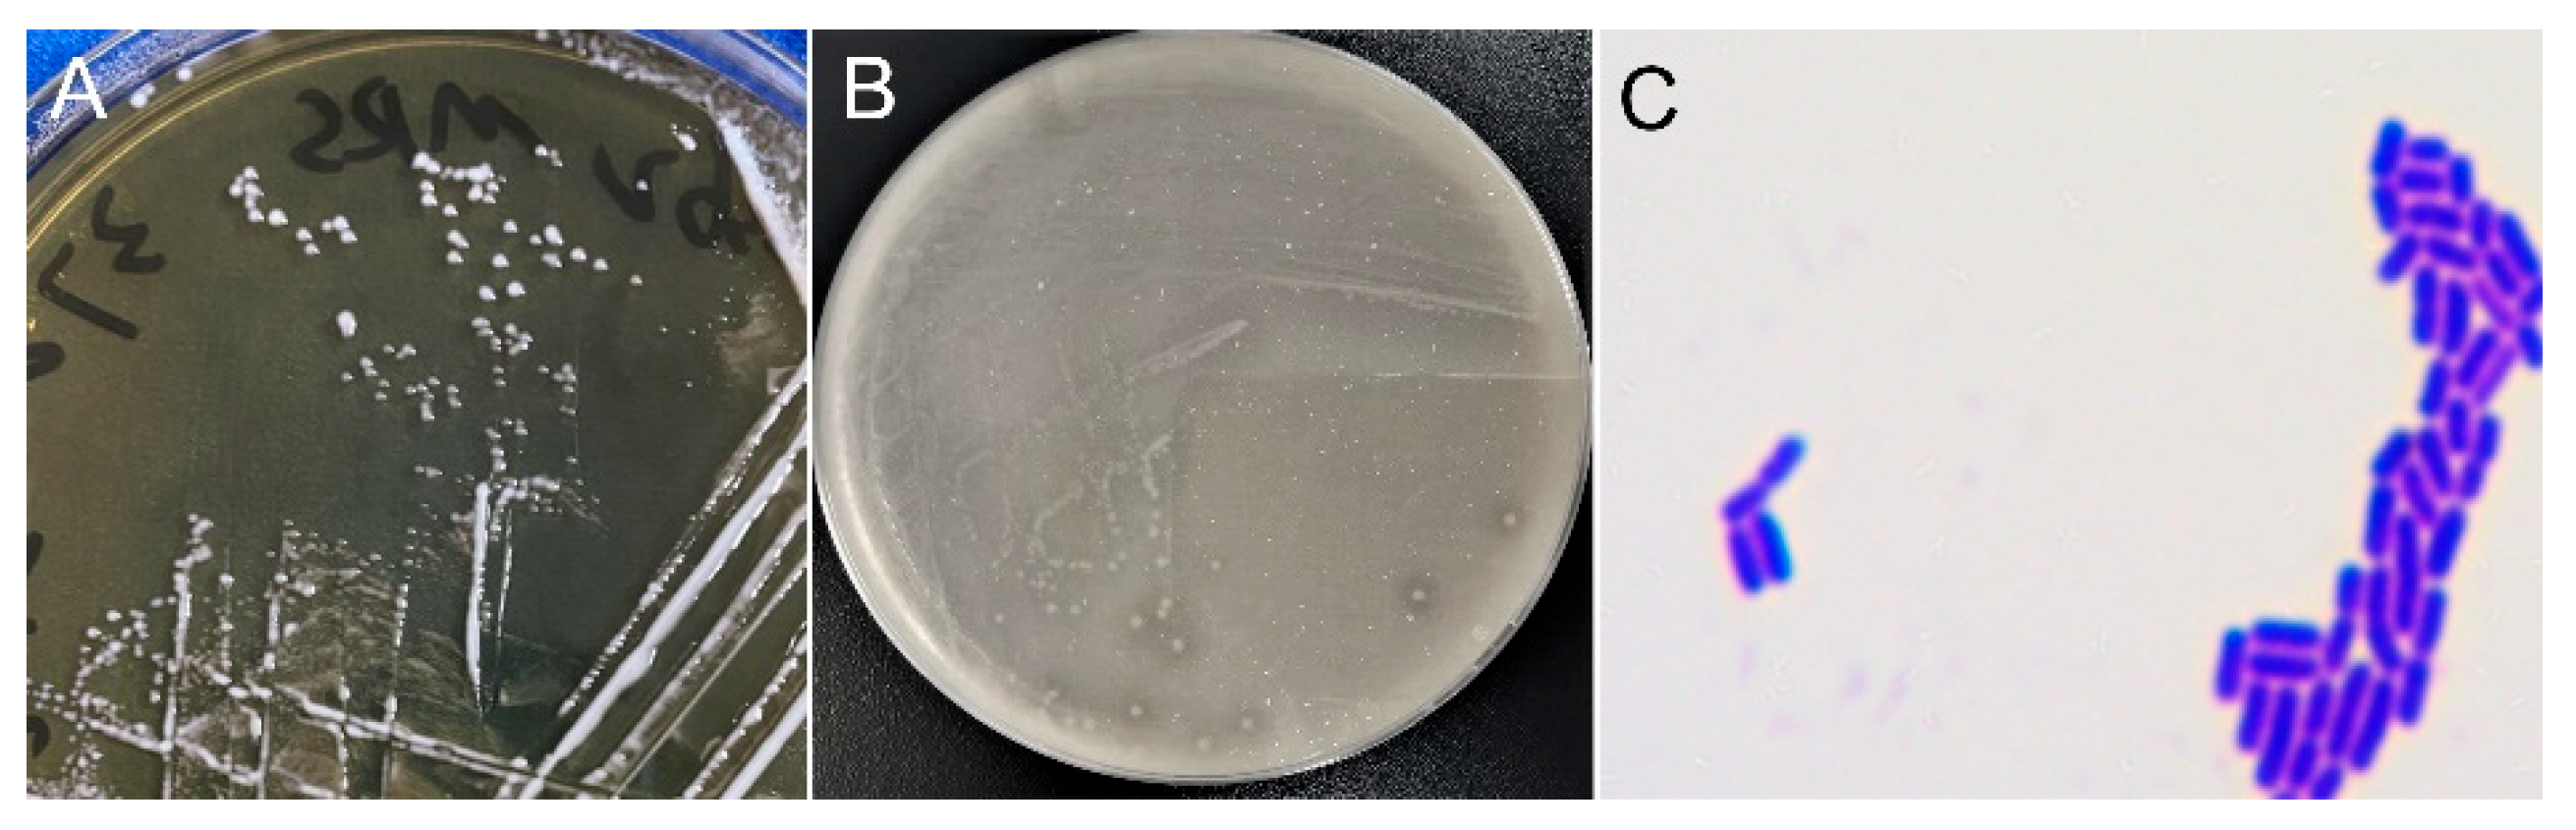
Figure 3.
Molecular biological identification of LpA2. (A) Phylogenetic tree of strain LpA2 based on 16S rDNA gene sequence, (B) Phylogenetic comparison according to the whole gene sequencing of strain LpA2, (C) Genome circos map of strain LpA2.
Figure 3.
Molecular biological identification of LpA2. (A) Phylogenetic tree of strain LpA2 based on 16S rDNA gene sequence, (B) Phylogenetic comparison according to the whole gene sequencing of strain LpA2, (C) Genome circos map of strain LpA2.

Figure 4.
Ethanol quantification results of co-culture of mice ileum contents with LpA2 or Lp-8 strain (n=10 per group). C, control group, blank without bacteria. The significant differences comparison between the two groups were conducted using an independent samples T-test. * * * * (p < 0.0001).
Figure 4.
Ethanol quantification results of co-culture of mice ileum contents with LpA2 or Lp-8 strain (n=10 per group). C, control group, blank without bacteria. The significant differences comparison between the two groups were conducted using an independent samples T-test. * * * * (p < 0.0001).
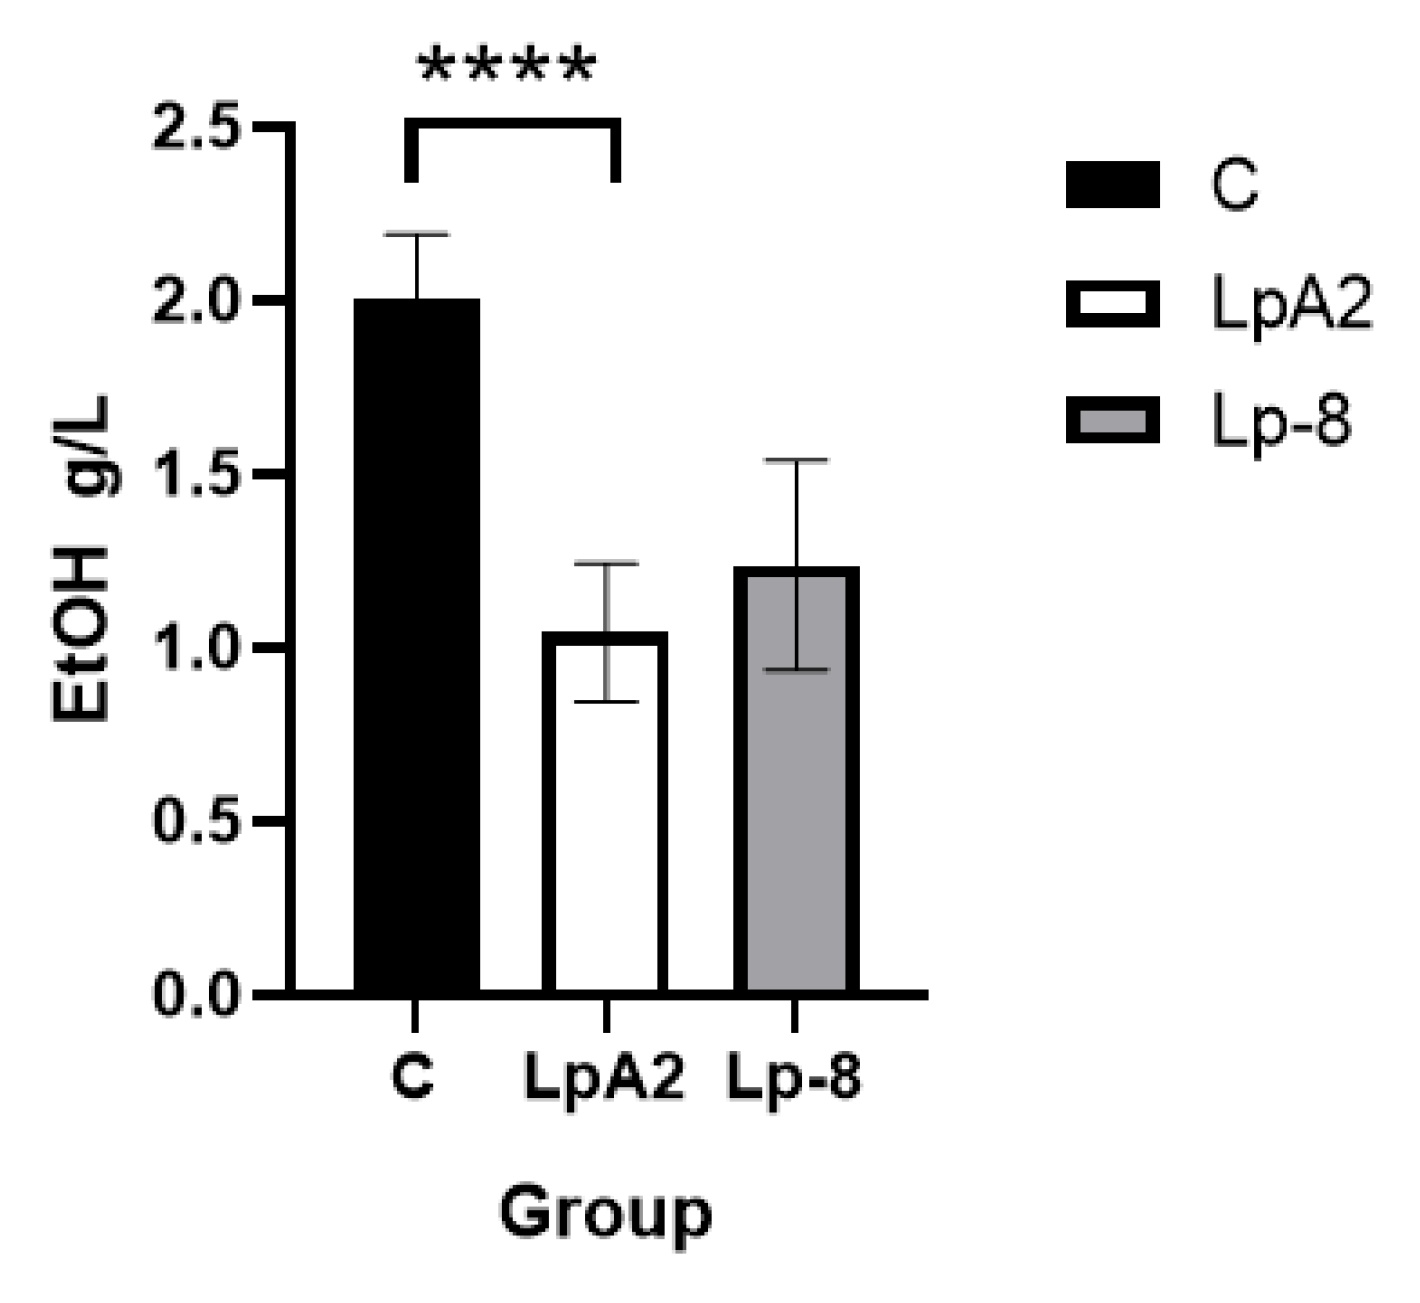
Figure 5.
Concentration of ethanol and acetaldehyde in blood after alcohol challenge test (n=9 per group). (A) Ethanol concentration, (B) Acetaldehyde concentration. The significant differences comparison between the two groups were conducted using an independent samples T-test. * (p < 0.05).
Figure 5.
Concentration of ethanol and acetaldehyde in blood after alcohol challenge test (n=9 per group). (A) Ethanol concentration, (B) Acetaldehyde concentration. The significant differences comparison between the two groups were conducted using an independent samples T-test. * (p < 0.05).
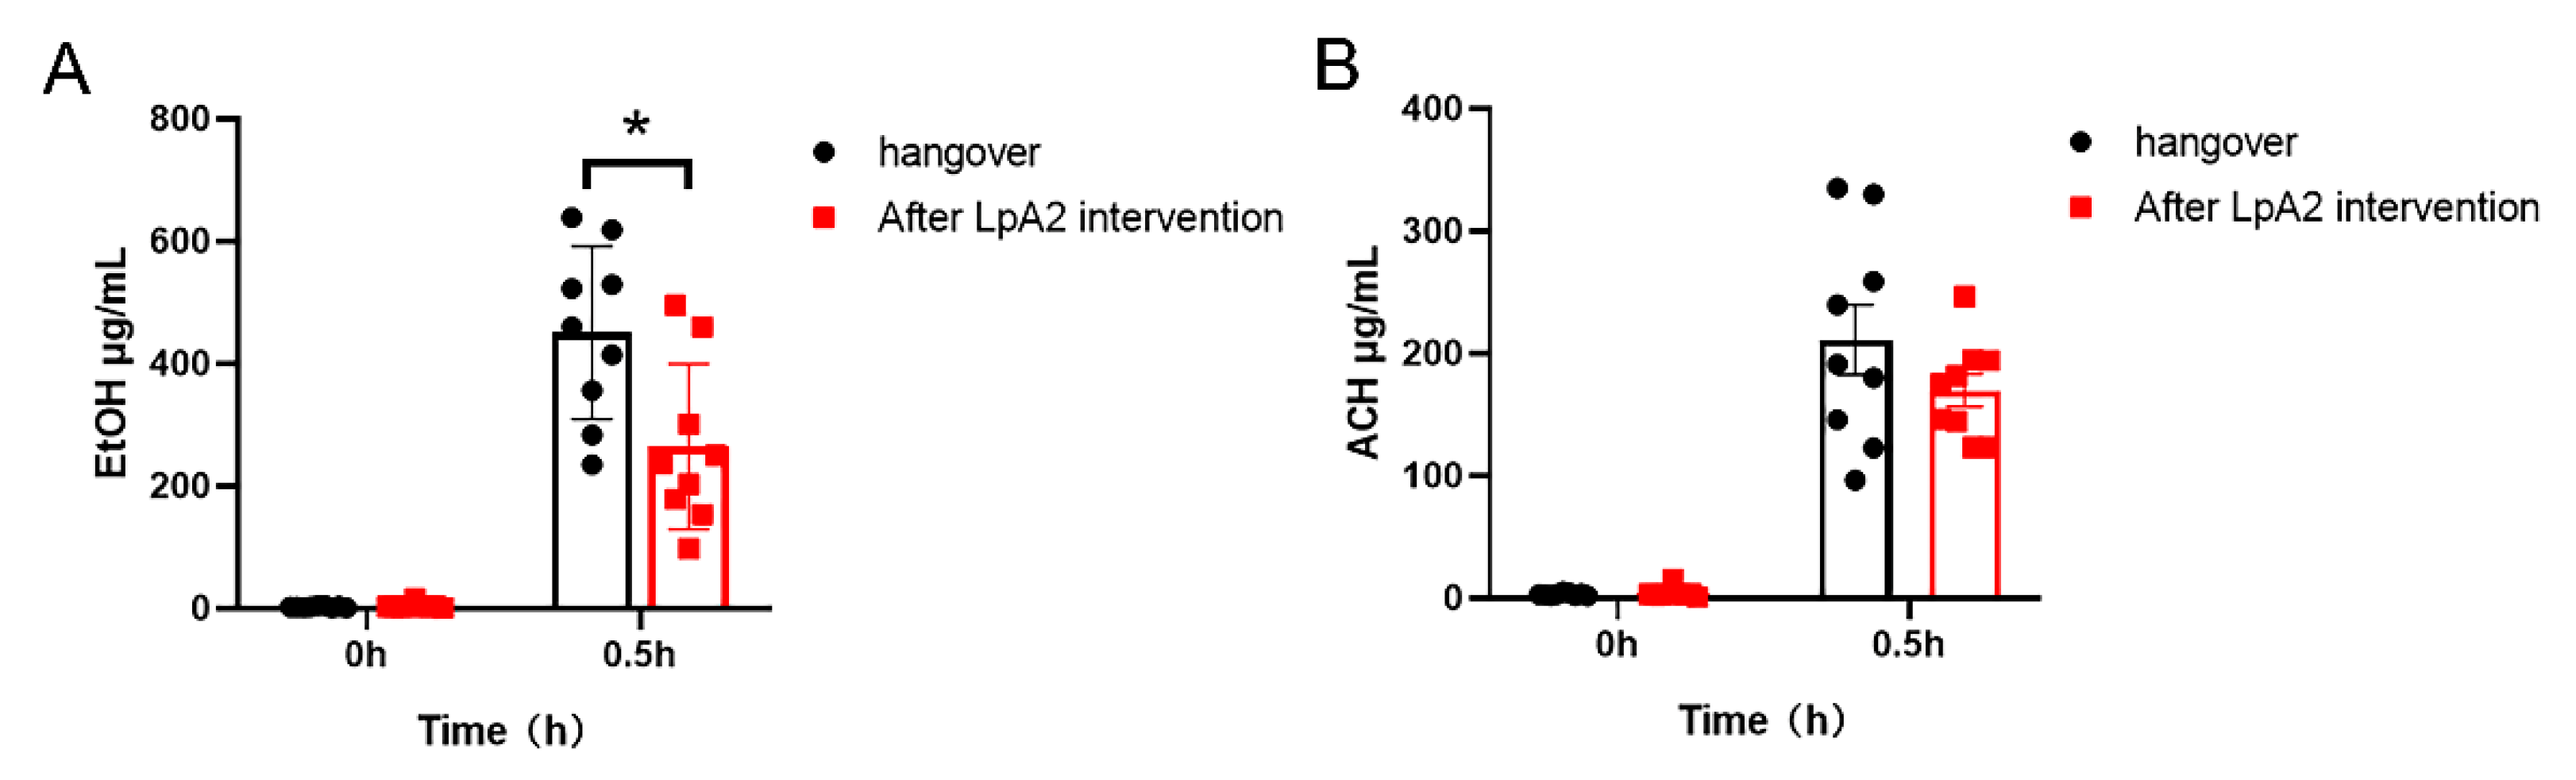
Figure 6.
Test results of breath alcohol concentration among nine participants. (A) average value of the group (n=10 per group), (B) measured value from each individual. Given the established 2100:1 ratio between breath and blood ethanol concentrations, where 1 mg of alcohol in exhaled air corresponds to approximately 2.1 g/L or 0.1% BAC.
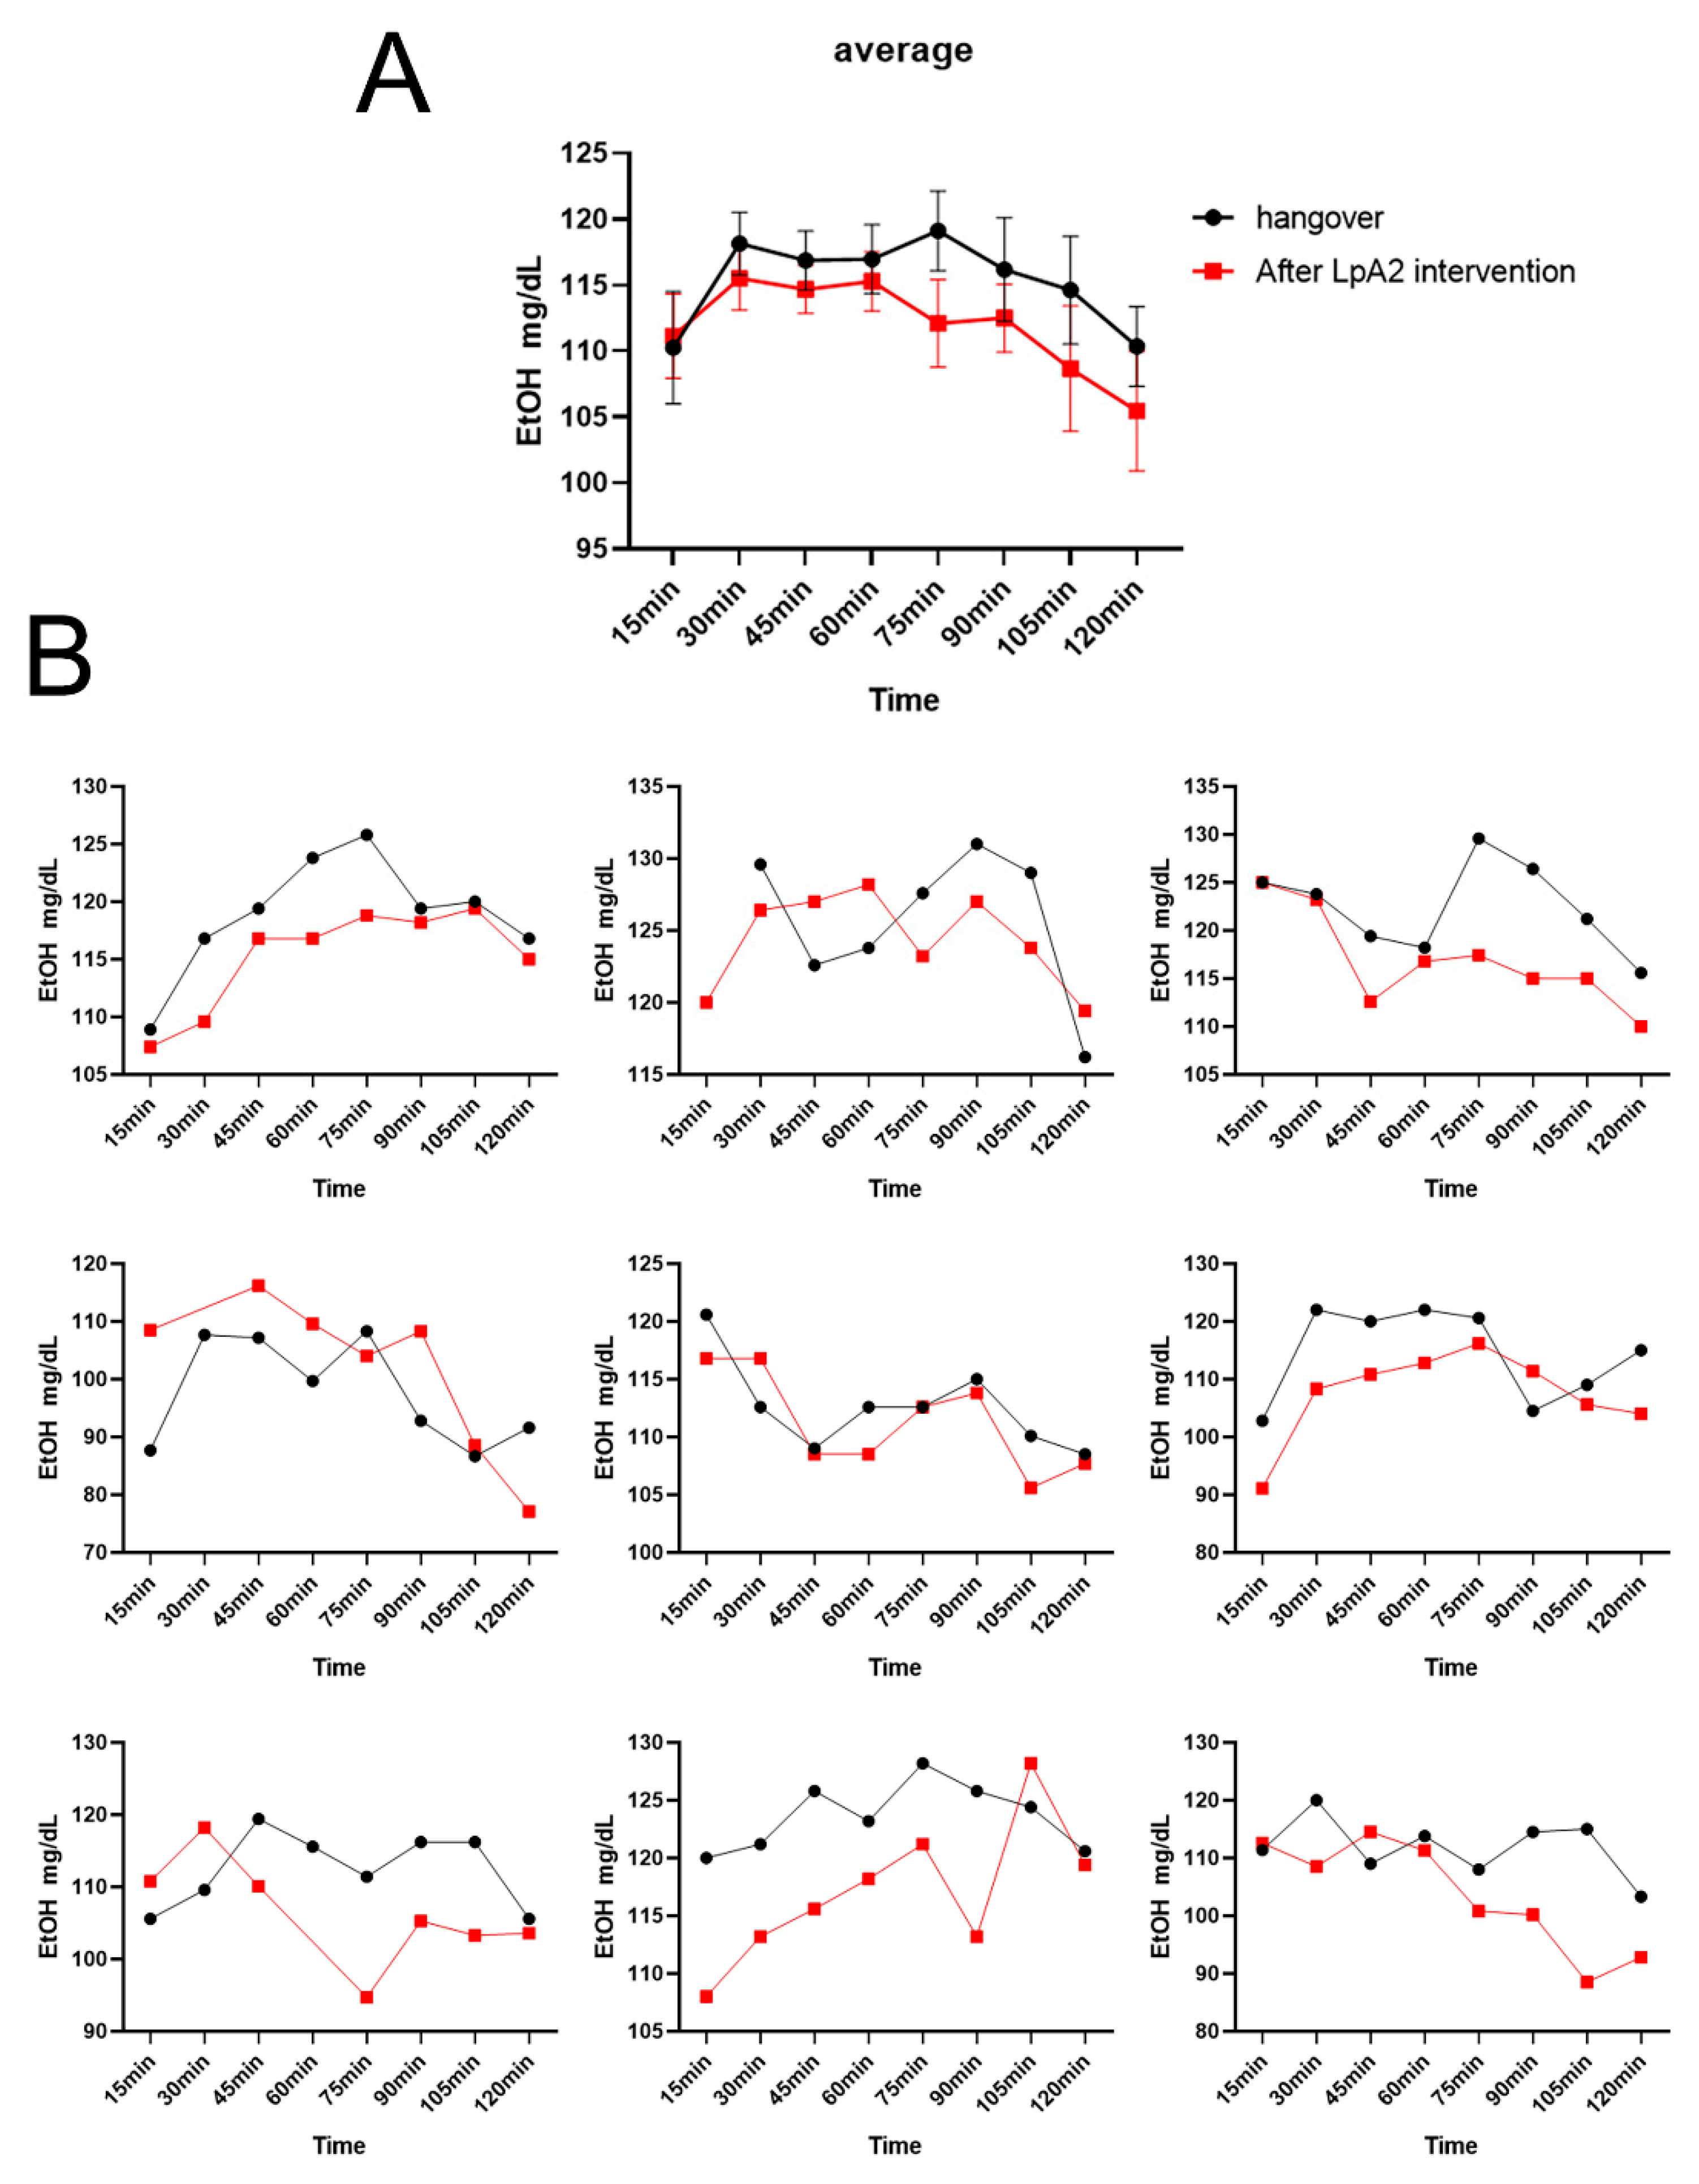
Figure 7.
(A) Fundus photographs and spectral-domain optical coherence tomography angiography (SD-OCTA) scans of the 6 × 6 mm macular area. (a-c) Representative fundus photographs of a participant at 0h, 0.5h and 2h. (d-i) OCTA images of the participant at 0h, 0.5h and 2h. Blue circle shows the FAZ at different time points. The FAZ area enlarged at 2h compared to baseline and 0.5h. (B) Vessel diameter index, vessel area density and flow impairment region among nine participants were detected by SD-OCTA at different time points. BJ, baijiu; JJ, SipSparkTM-baijiu. .
Disclaimer/Publisher’s Note: The statements, opinions and data contained in all publications are solely those of the individual author(s) and contributor(s) and not of MDPI and/or the editor(s). MDPI and/or the editor(s) disclaim responsibility for any injury to people or property resulting from any ideas, methods, instructions or products referred to in the content. |
© 2025 by the authors. Licensee MDPI, Basel, Switzerland. This article is an open access article distributed under the terms and conditions of the Creative Commons Attribution (CC BY) license (http://creativecommons.org/licenses/by/4.0/).
Copyright: This open access article is published under a Creative Commons CC BY 4.0 license, which permit the free download, distribution, and reuse, provided that the author and preprint are cited in any reuse.


