

Submitted:
24 December 2025
Posted:
26 December 2025
You are already at the latest version
Abstract
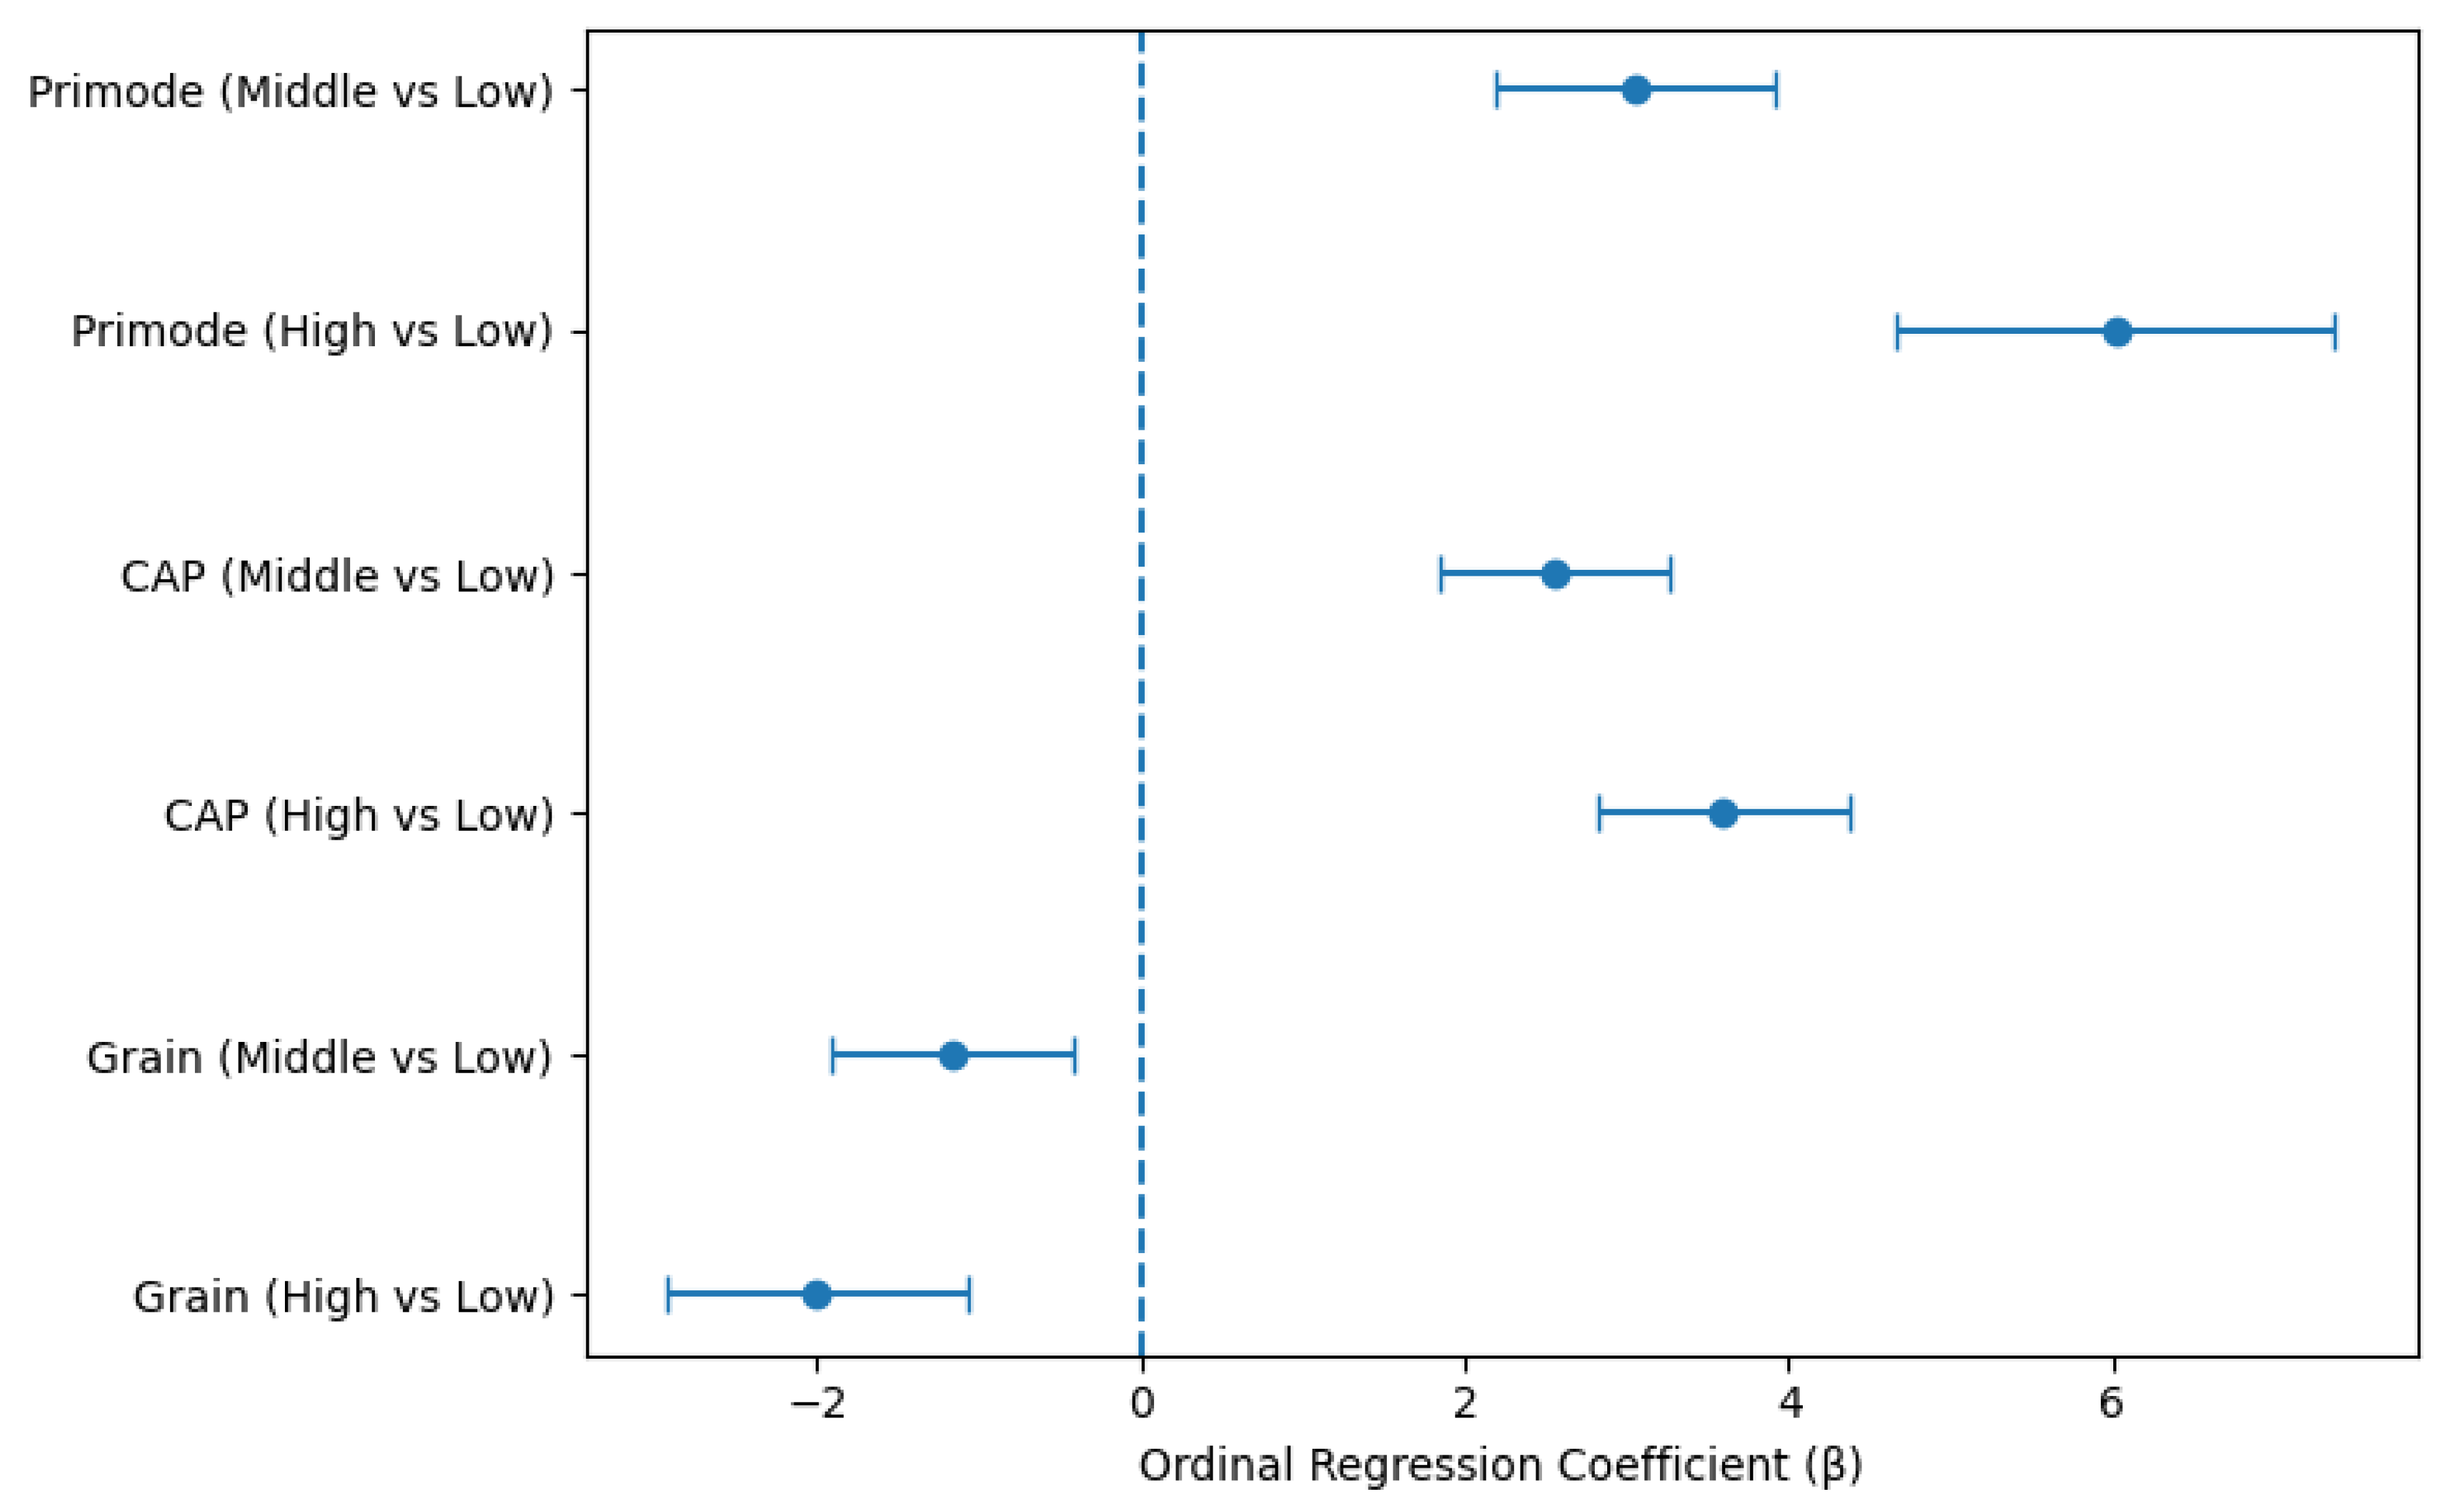
Effort frequently fails to initiate despite explicit intentions and incentives, a phenomenon not fully explained by prevailing motivational or cognitive control models. Cognitive Drive Architecture (CDA) conceptualises effort as conditionally available, governed by structural system states rather than continuous motivational strength. Here, we formally derive Lagun’s Law as a canonical structural relation for effort emergence and examine its empirical tractability using a secondary educational dataset of 480 students. CDA components were operationalised using behavioural, attendance, and contextual proxies and evaluated via multinomial ordinal regression of academic performance. Ignition readiness (Primode) exhibited the largest effects (β = 3.05–6.02, p < .001), followed by motivational amplification (Cognitive Activation Potential; β = 2.55–3.60, p < .001), while resistance-related factors (Grain) showed stable suppressive associations (β = −1.16 to −2.00, p ≤ .002). Stabilisation effects were smaller, and adaptability and entropy components were not robustly detected. These findings do not establish causality but demonstrate that the core structural terms of Lagun’s Law are empirically anchorable in naturalistic data.
Keywords:
1. Introduction
2. Cognitive Drive Architecture: Conceptual Overview
2.1. Domain and Scope of Cognitive Drive Architecture
2.2. Core Structural Variables of Cognitive Drive Architecture
2.3. Why a Formal Law Is Required
3. Derivation of Lagun’s Law
3.1. Structural Postulates Governing Cognitive Drive
3.2. Mathematical Formulation
3.2.1. Notation, Domains, and Dimensional Assumptions
3.3. Canonical Form of Lagun’s Law
3.3.1. Canonical Equation
3.3.2. Interpretation of Each Term
3.3.3. Scope and Qualified Uniqueness
4. Methodology
4.1. Dataset and Study Design
4.2. Variable Operationalization
4.3. Statistical Analyses
4.3.1. Regression Modeling
4.3.2. Structural Equation Modeling
- SEM paths are interpreted as structural consistencies rather than causal mechanisms.
- Model fit indices are treated as screening tools rather than validation criteria.
- Alternative plausible structural configurations are acknowledged.
4.4. Methodological Scope Statement
- causal identification,
- construct validation of CDA variables,
- parameter confirmation of Lagun’s Law, or
- closure of the CDA field.
5. Results
5.1. Sample Characteristics and Descriptive Statistics

| Variable | Mean | SD | Min | 25% | Median | 75% | Max |
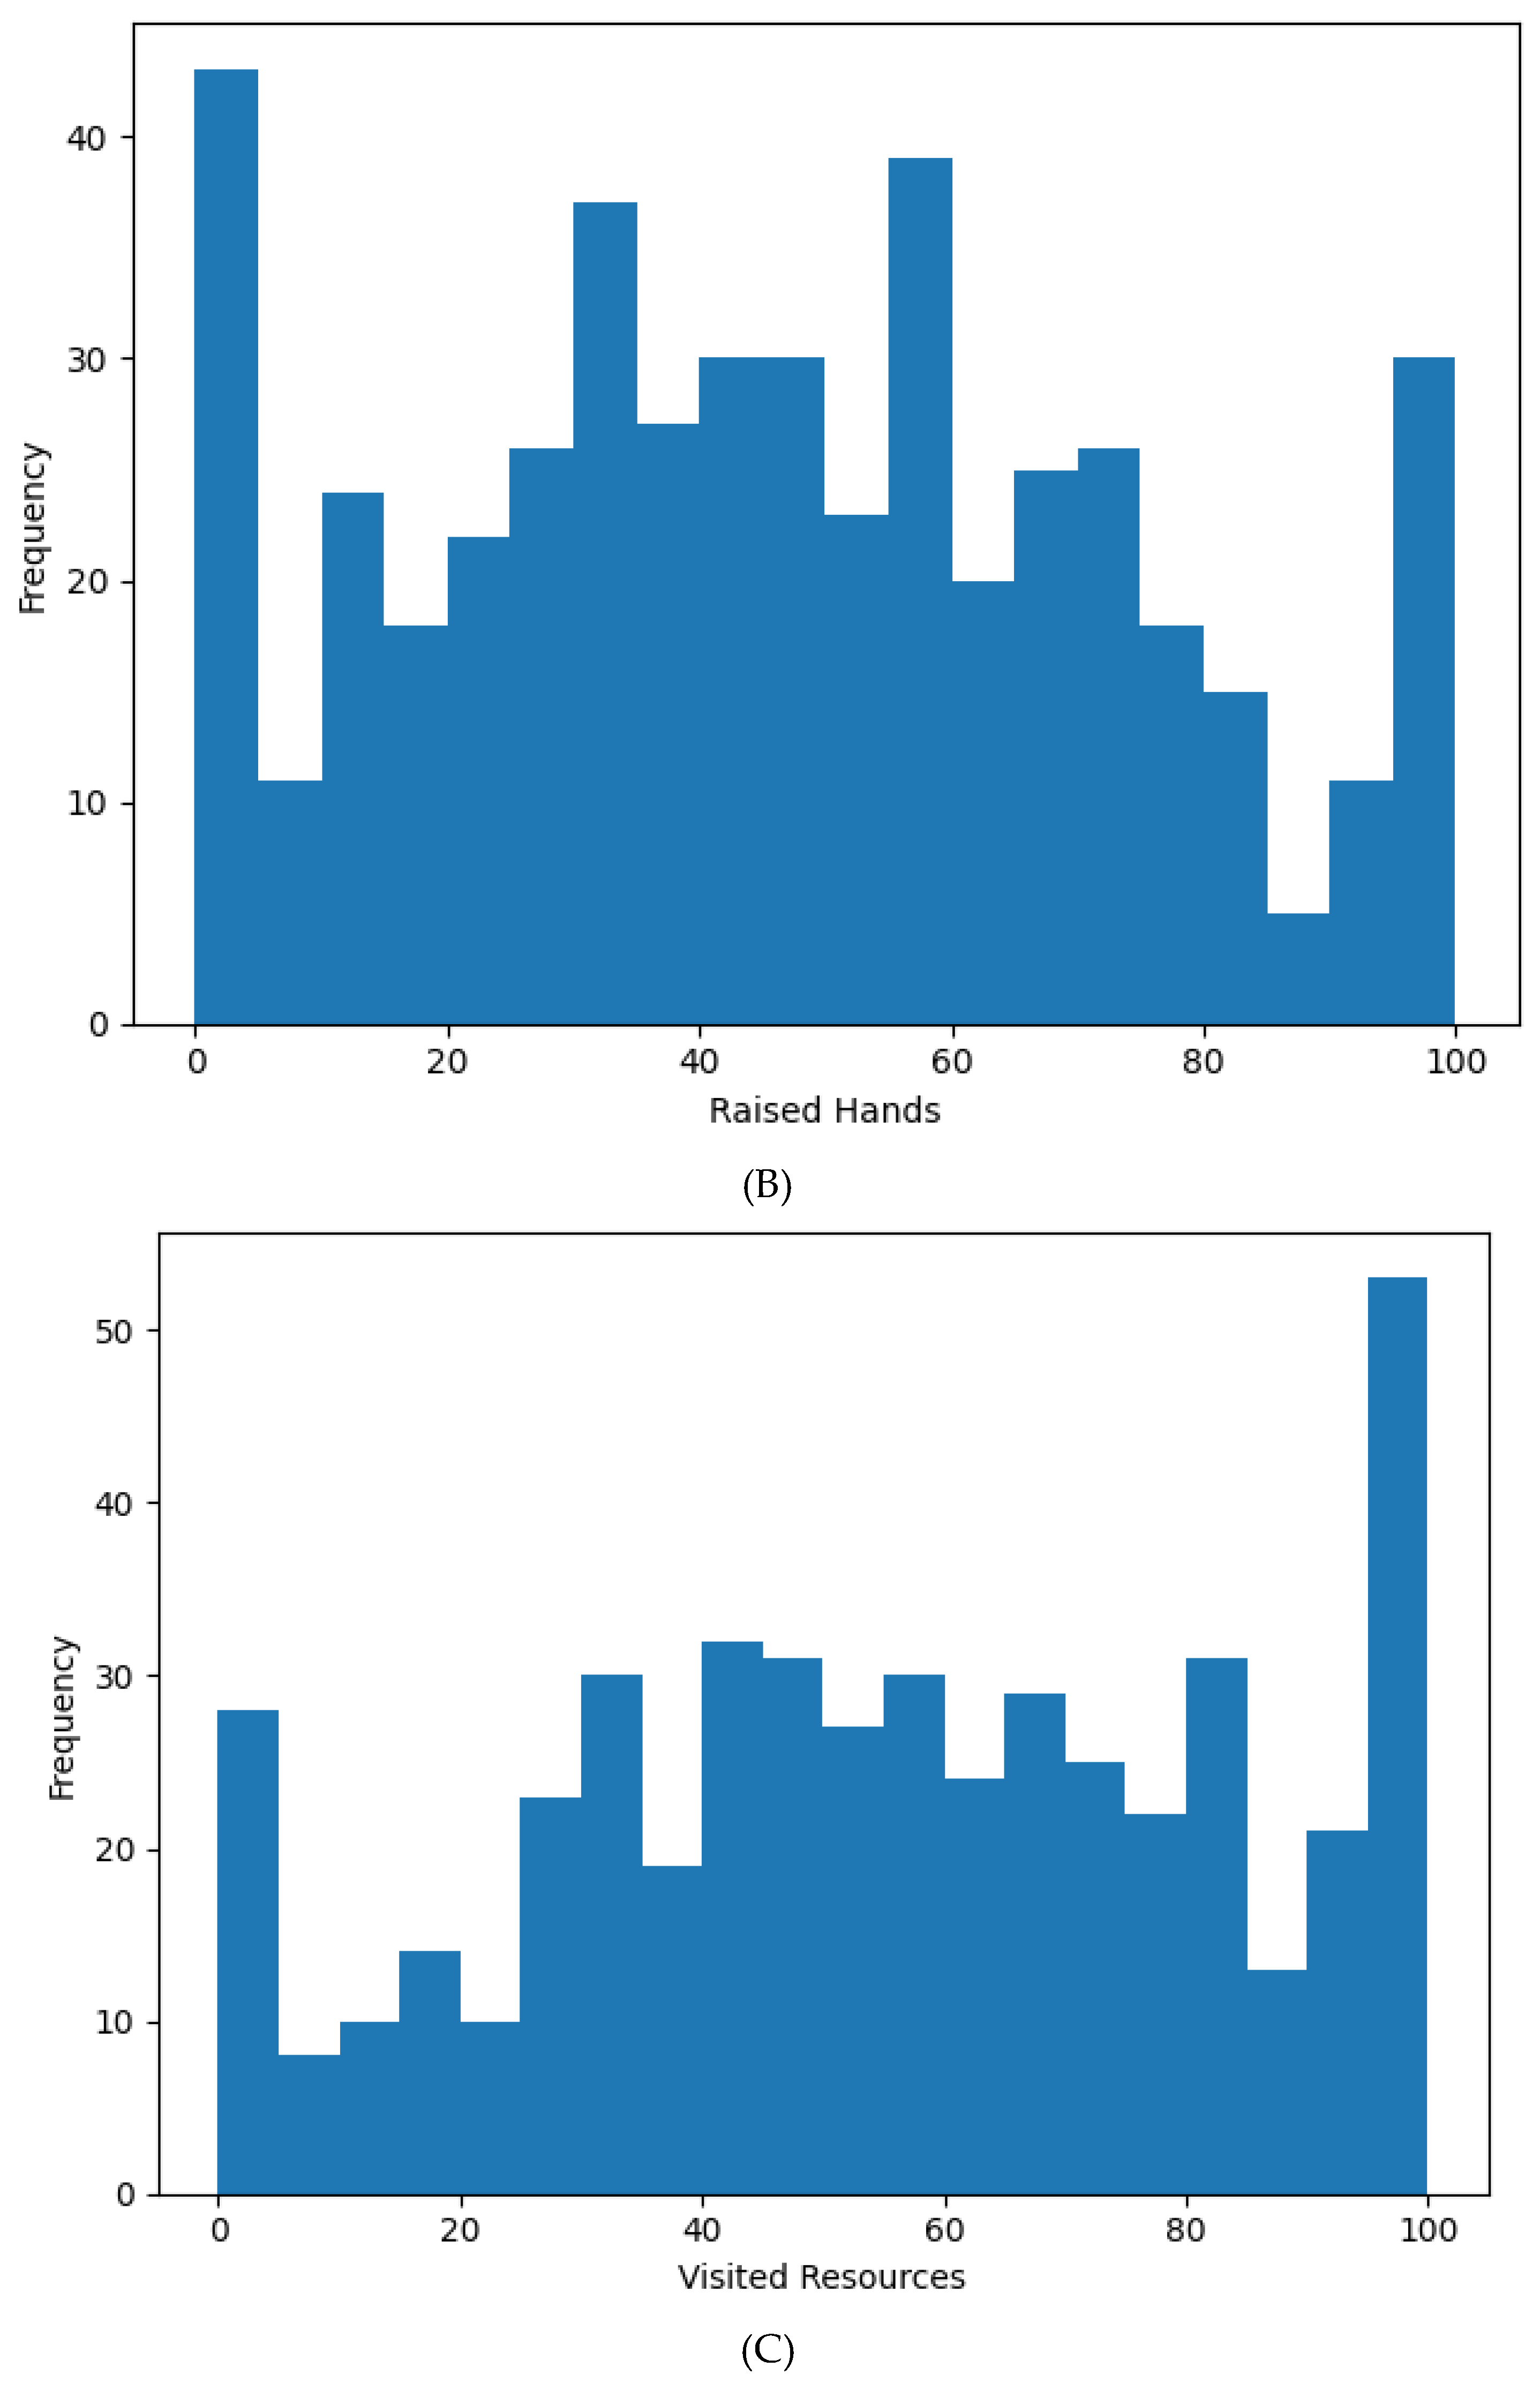
| Raised Hands | 46.78 | 30.78 | 0 | 15.75 | 50 | 75 | 100 |
| Visited Resources | 54.80 | 33.08 | 0 | 20 | 65 | 84 | 99 |
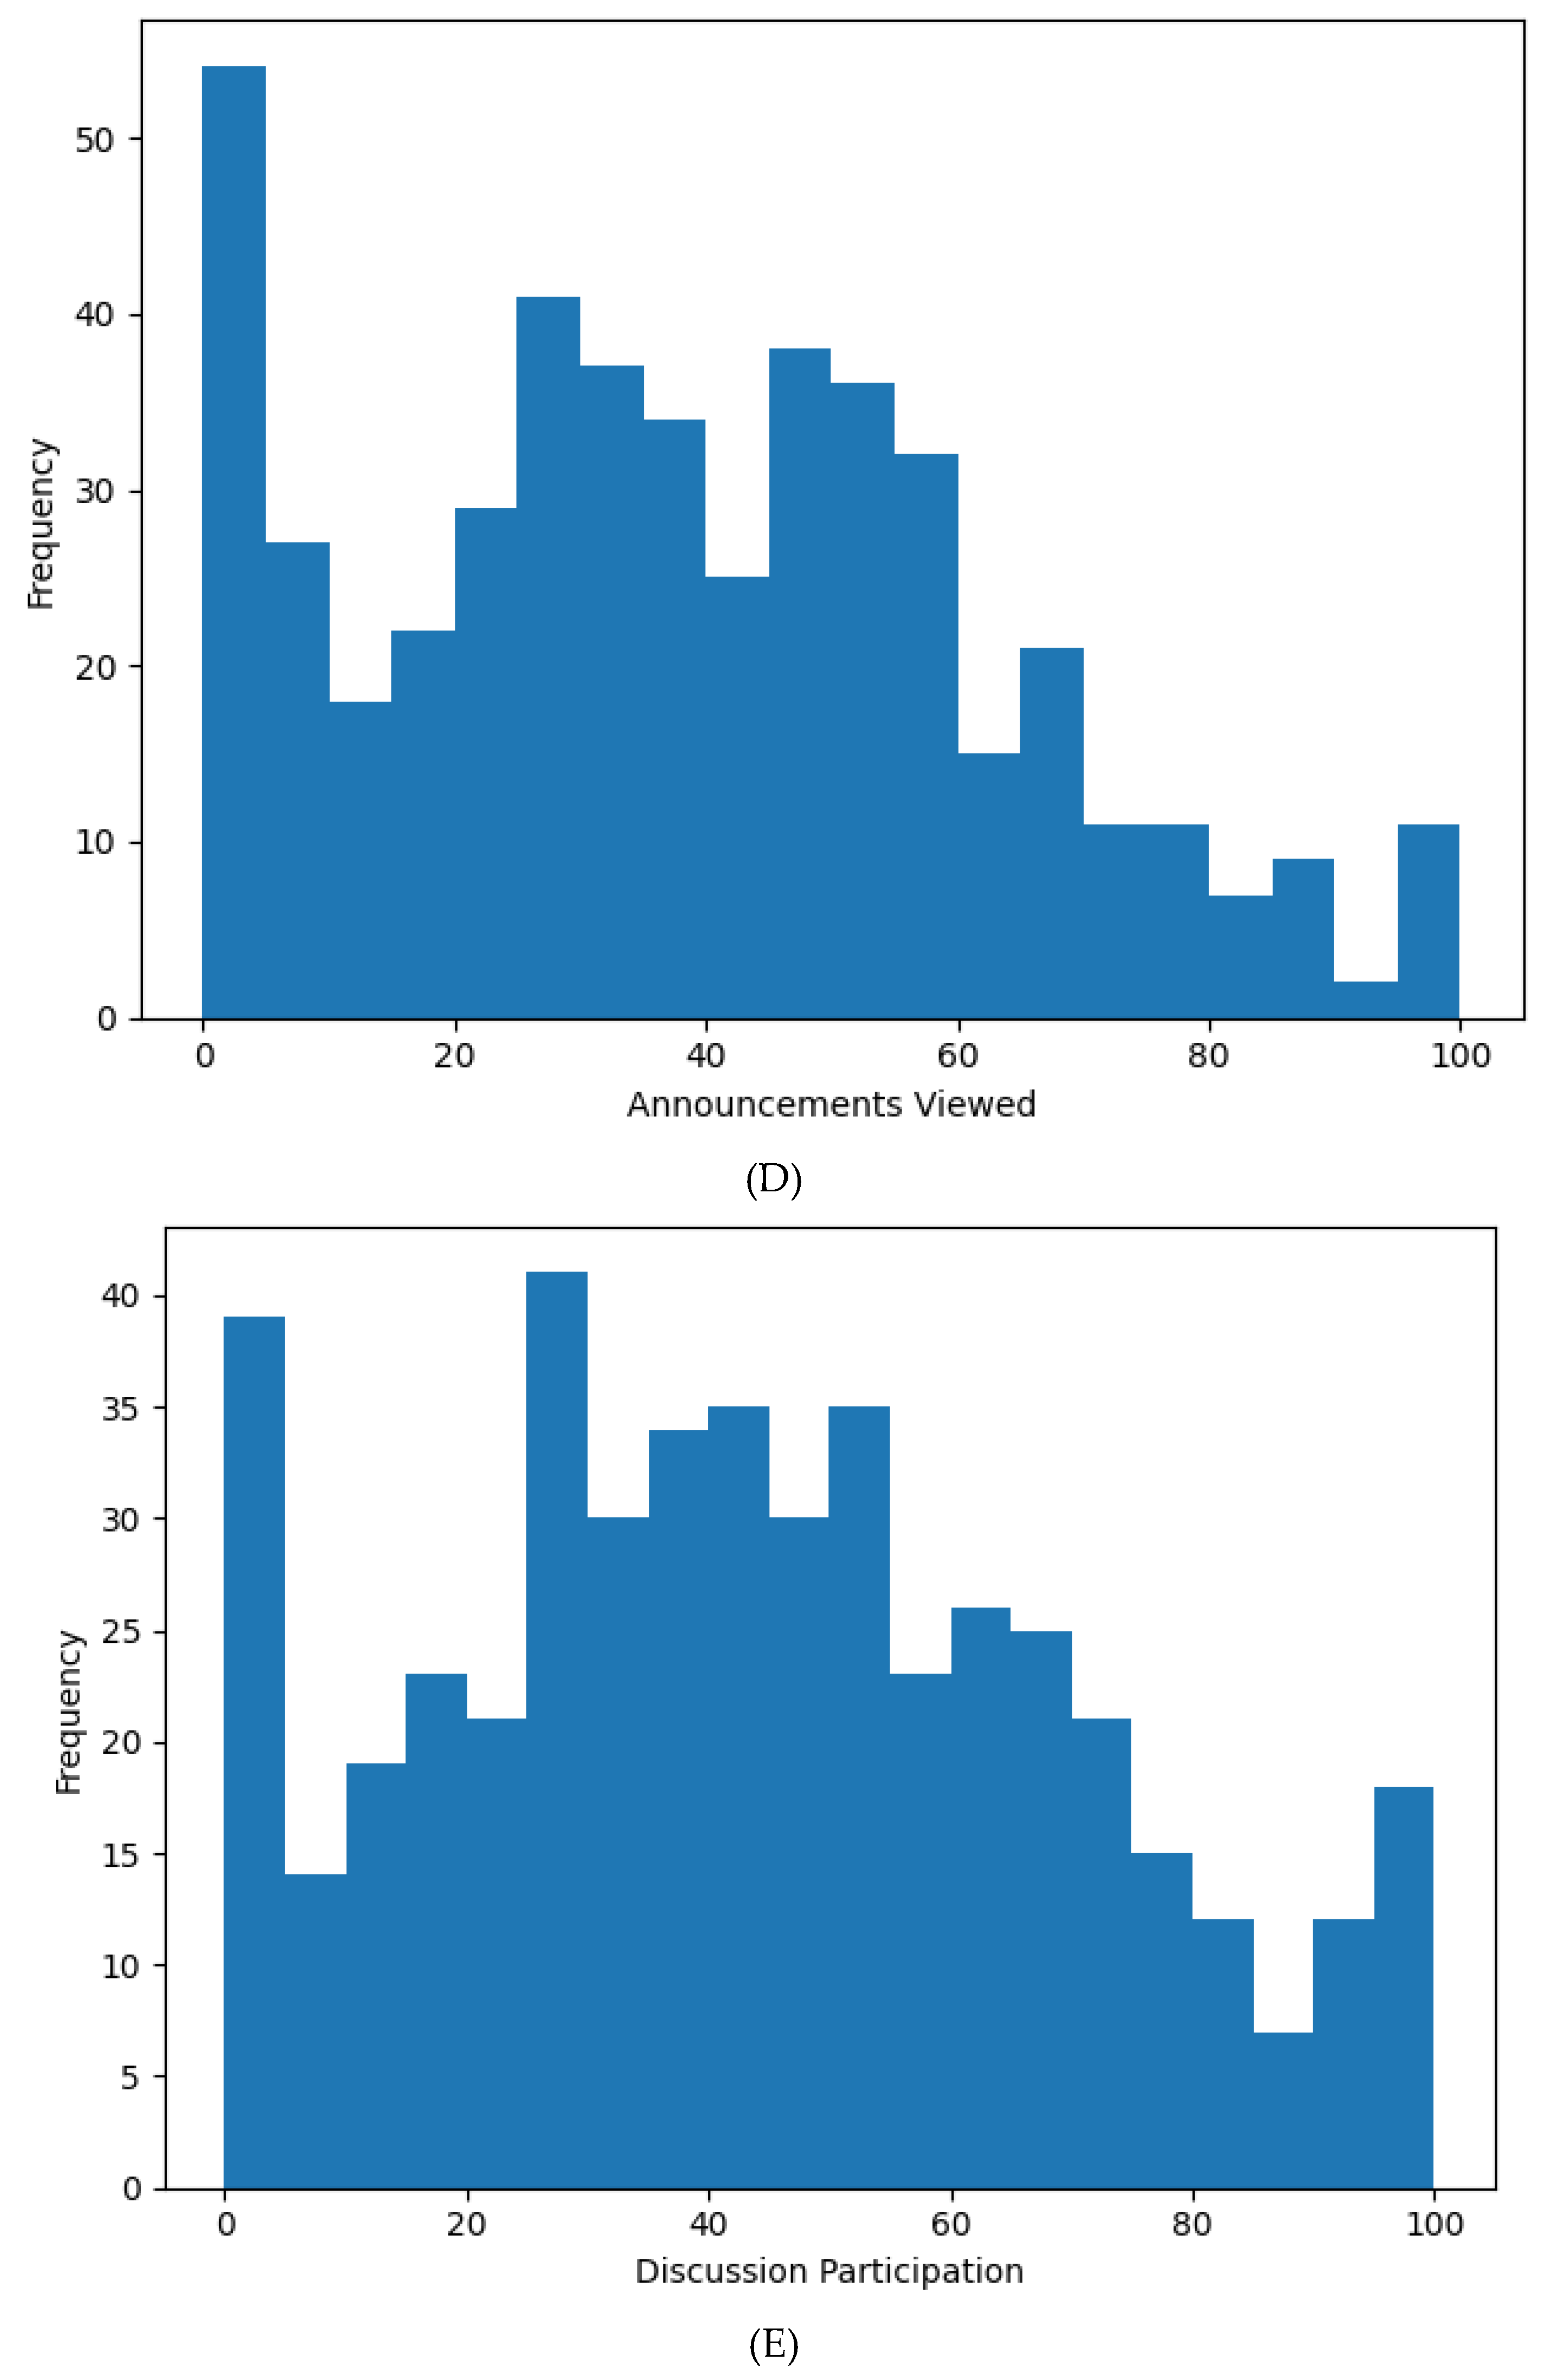
| Announcements Viewed | 37.92 | 26.61 | 0 | 14 | 33 | 58 | 98 |
| Discussion Participation | 43.28 | 27.64 | 1 | 20 | 39 | 70 | 99 |
| Variable | Category | n | % |
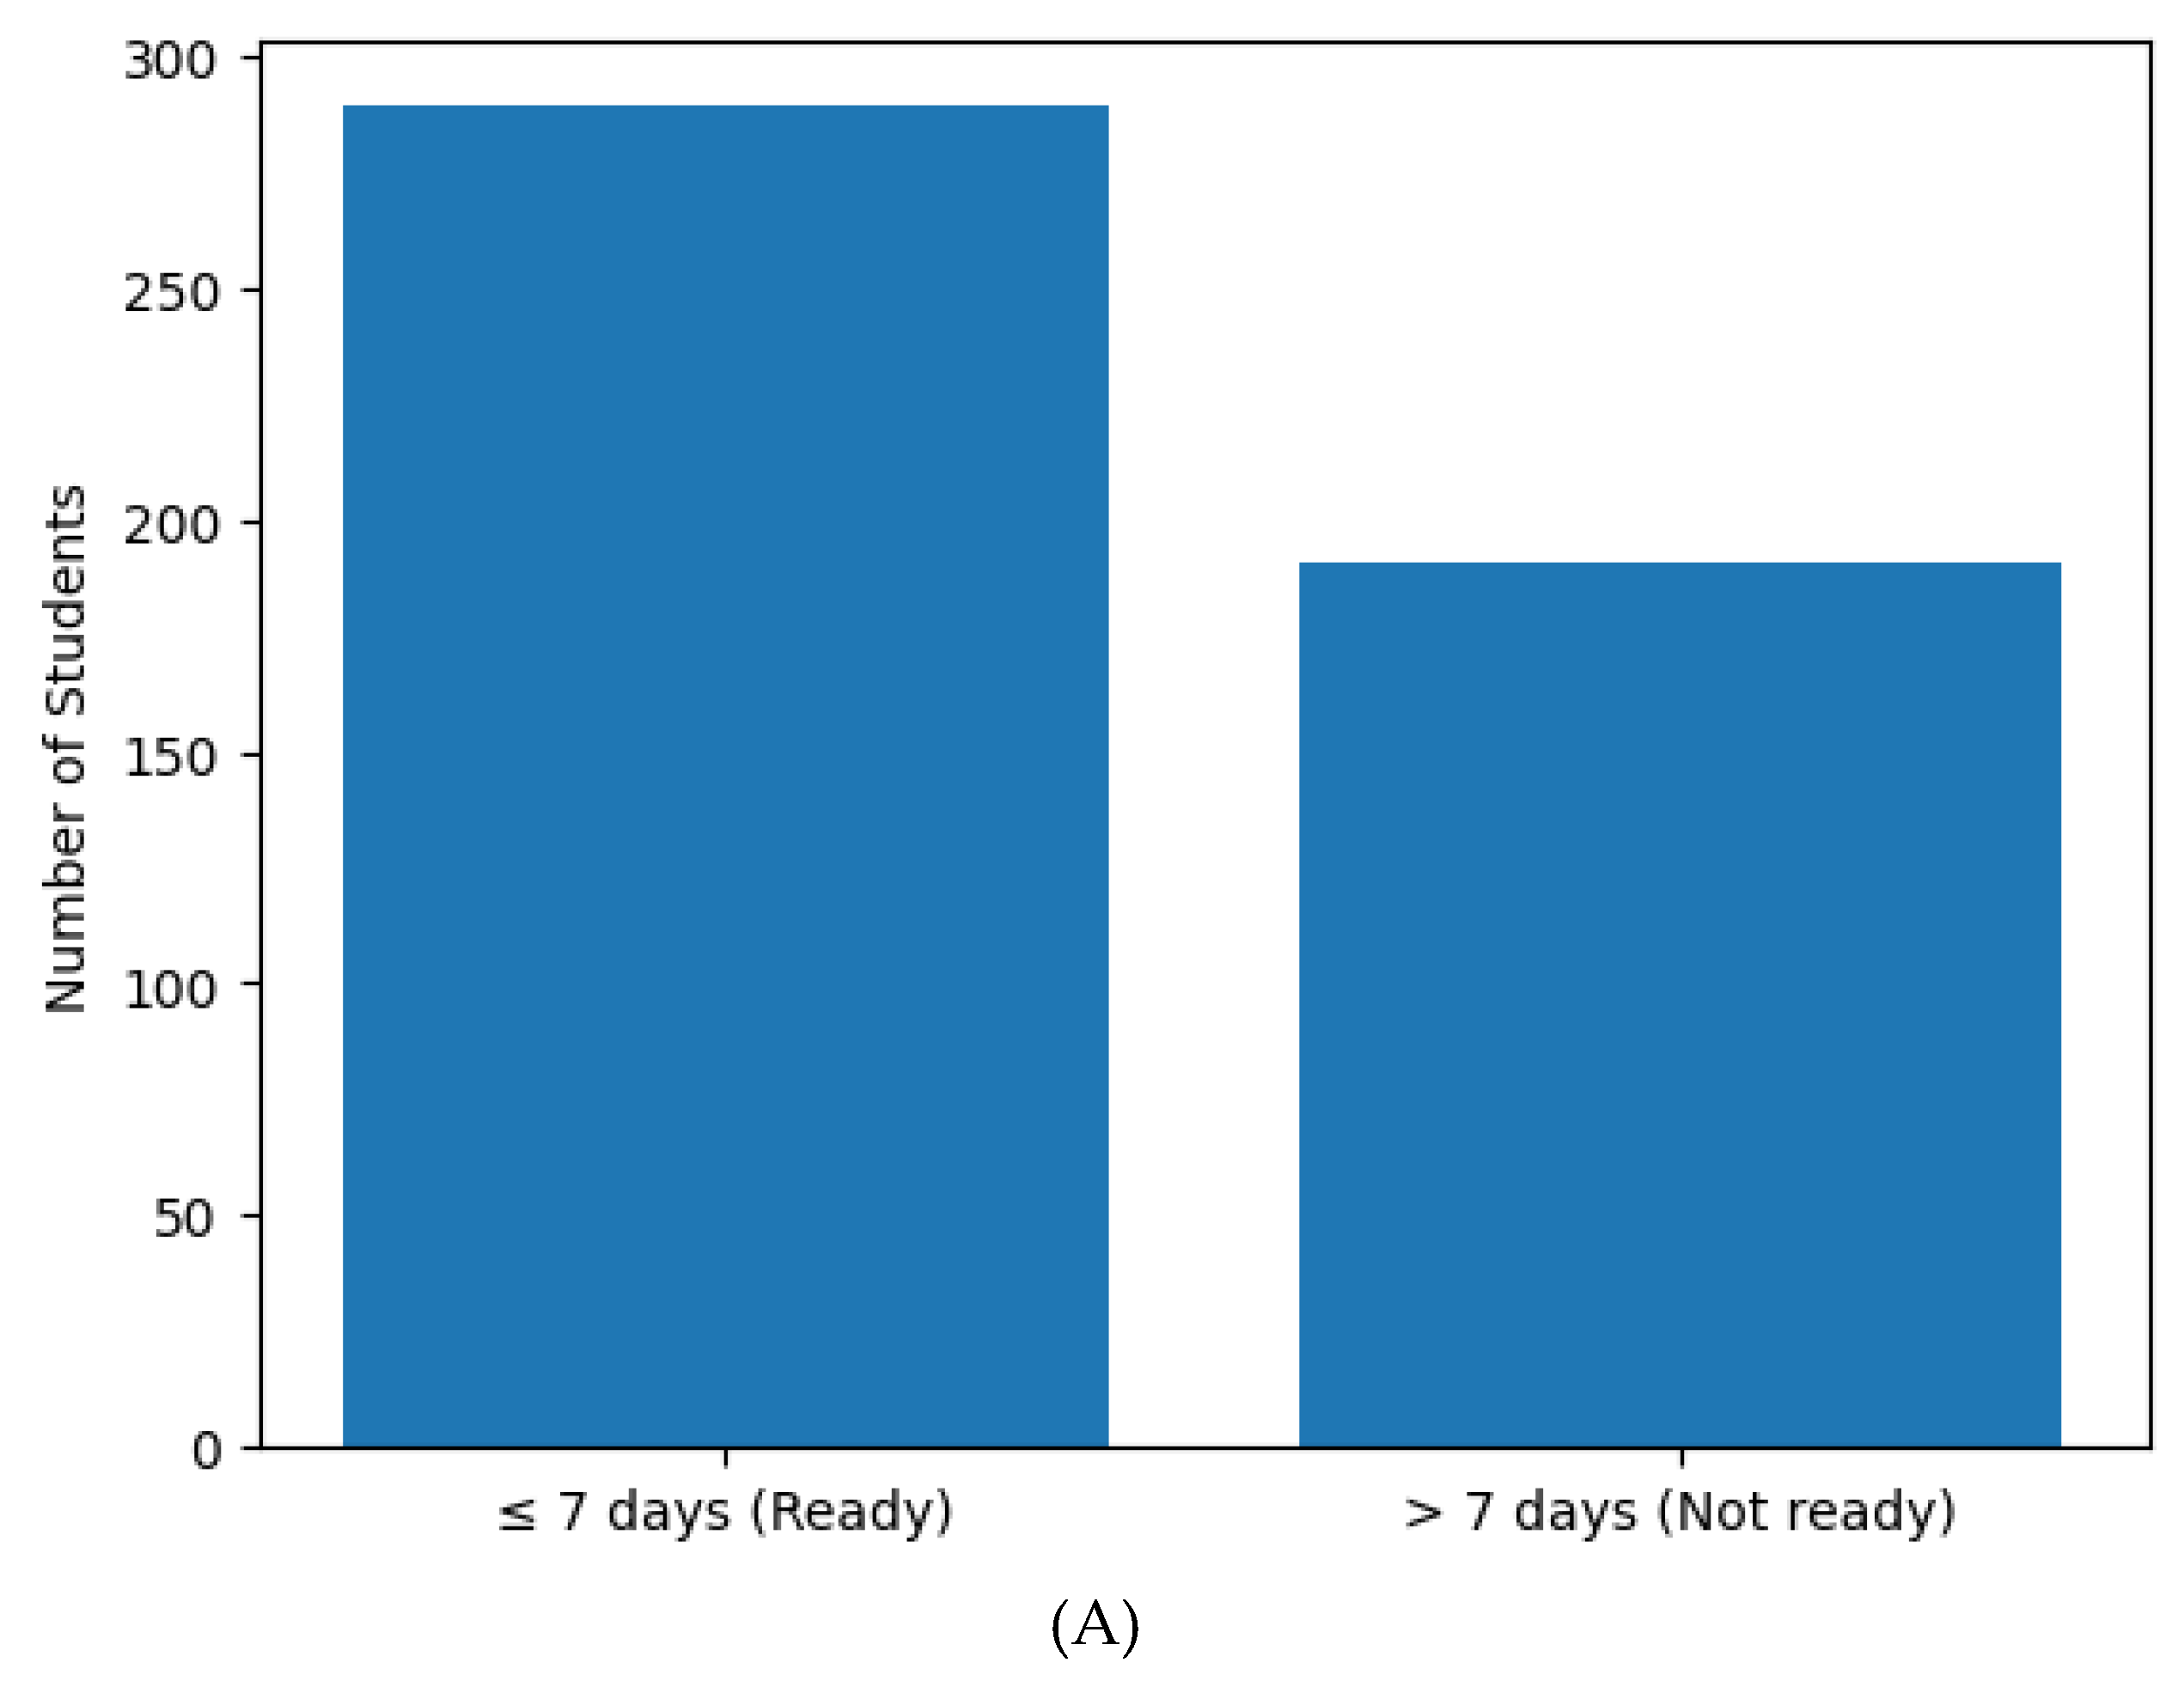
| Student Absence Days (Primode) | ≤ 7 days | 289 | 60.2 |
| > 7 days | 191 | 39.8 |
| Variable | Category | n | % |
| Parent Survey Completion | Completed | 270 | 56.3 |
| Not completed | 210 | 43.7 | |
| Parent Satisfaction | Satisfied | 292 | 60.8 |
| Dissatisfied | 188 | 39.2 |
5.2. Strongly Supported Structural Components
5.2.1. Primode (Ignition Readiness)
5.2.2. Cognitive Activation Potential (CAP)
5.2.3. Grain (Resistance)
5.2.4. Relative Strength and Model Consistency
5.3. Partially Supported Structural Component
5.3.1. Anchory (Stabilization)
5.4. Proxy-Limited and Exploratory Components
5.4.1. Flexion (Task–System Adaptability)
5.4.2. Slip (Structural Entropy)
6. Discussion
6.1. Limitations
7. Conclusions
Funding
Institutional Review Board Statement
Data Availability Statement
Conflicts of Interest
References
- Ajzen, I. The theory of planned behavior. Organizational Behavior and Human Decision Processes 1991, 50(2), 179–211. [Google Scholar] [CrossRef]
- Amrieh, E. A., Hamtini, T., & Aljarah, I. (2015, November). Preprocessing and analyzing educational data set using X-API for improving student's performance. In 2015 IEEE Jordan conference on applied electrical engineering and computing technologies (AEECT) (pp. 1-5). IEEE. [CrossRef]
- Amrieh, E. A.; Hamtini, T.; Aljarah, I. Mining educational data to predict student’s academic performance using ensemble methods. International journal of database theory and application 2016, 9(8), 119–136. [Google Scholar] [CrossRef]
- Atkinson, J. W. Motivational determinants of risk-taking behavior. Psychological Review 1957, 64(6(Pt.1), 359–372. [Google Scholar] [CrossRef] [PubMed]
- Bandura, A. Self-efficacy: Toward a unifying theory of behavioral change. Psychological Review 1977, 84(2), 191–215. [Google Scholar] [CrossRef]
- Baumeister, R. F.; Heatherton, T. F. Self-regulation failure: An overview. Psychological Inquiry 1996, 7(1), 1–15. [Google Scholar] [CrossRef]
- Botvinick, M. M. Conflict monitoring and decision making: reconciling two perspectives on anterior cingulate function. Cognitive, affective & behavioral neuroscience 2007, 7(4), 356–366. [Google Scholar] [CrossRef]
- Deci, E.L.; Ryan, R.M. Intrinsic Motivation and Self-Determination in Human Behavior; Plenum Press: New York, 1985. [Google Scholar] [CrossRef]
- Deci, E. L.; Ryan, R. M. The “What” and “Why” of Goal Pursuits: Human Needs and the Self-Determination of Behavior. Psychological Inquiry 2000, 11(4), 227–268. [Google Scholar] [CrossRef]
- Duckworth, A. L.; Peterson, C.; Matthews, M. D.; Kelly, D. R. Grit: perseverance and passion for long-term goals. Journal of personality and social psychology 2007, 92(6), 1087–1101. [Google Scholar] [CrossRef]
- Eccles, J. S.; Wigfield, A. Motivational Beliefs, Values, and Goals. Annual Review of Psychology 2002, 53, 109–132. [Google Scholar] [CrossRef]
- Ferrari, J. R. Procrastination as self-regulation failure of performance: Effects of cognitive load, self-awareness, and time limits on 'working best under pressure. European Journal of Personality 2001, 15(5), 391–406. [Google Scholar] [CrossRef]
- Inzlicht, M.; Schmeichel, B. J.; Macrae, C. N. Why self-control seems (but may not be) limited. Trends in Cognitive Sciences 2014, 18(3), 127–133. [Google Scholar] [CrossRef] [PubMed]
- Kool, W.; Botvinick, M. The intrinsic cost of cognitive control. Behavioral and Brain Sciences 2013, 36(6), 697–698. [Google Scholar] [CrossRef] [PubMed]
- Kurzban, R.; Duckworth, A.; Kable, J. W.; Myers, J. An opportunity cost model of subjective effort and task performance. The Behavioral and brain sciences 2013, 36(6), 661–679. [Google Scholar] [CrossRef] [PubMed]
- Lagun, N. Lagun's law and the foundations of cognitive drive architecture: A first principles theory of effort and performance. International Journal of Science and Research Archive 2025. [Google Scholar] [CrossRef]
- Lieder, F.; Griffiths, T. L. Resource-rational analysis: Understanding human cognition as the optimal use of limited computational resources. The Behavioral and brain sciences 2019, 43, e1. [Google Scholar] [CrossRef]
- Pessoa, L. How do emotion and motivation direct executive control? Trends in cognitive sciences 2009, 13(4), 160–166. [Google Scholar] [CrossRef]
- Shenhav, A.; Botvinick, M. M.; Cohen, J. D. The expected value of control: an integrative theory of anterior cingulate cortex function. Neuron 2013, 79(2), 217–240. [Google Scholar] [CrossRef]
- Solomon, L. J.; Rothblum, E. D. Academic procrastination: Frequency and cognitive-behavioral correlates. Journal of Counseling Psychology 1984, 31(4), 503–509. [Google Scholar] [CrossRef]
- Steel, P. The nature of procrastination: A meta-analytic and theoretical review of quintessential self-regulatory failure. Psychological Bulletin 2007, 133(1), 65–94. [Google Scholar] [CrossRef]
- Vroom, V.H. Work and motivation; Wiley, 1964. [Google Scholar]
- Westbrook, A.; Frank, M. J.; Cools, R. A mosaic of cost-benefit control over cortico-striatal circuitry. Trends in cognitive sciences 2021, 25(8), 710–721. [Google Scholar] [CrossRef]
- Westbrook, A.; Lamichhane, B.; Braver, T. The Subjective Value of Cognitive Effort is Encoded by a Domain-General Valuation Network. The Journal of neuroscience: the official journal of the Society for Neuroscience 2019, 39(20), 3934–3947. [Google Scholar] [CrossRef]
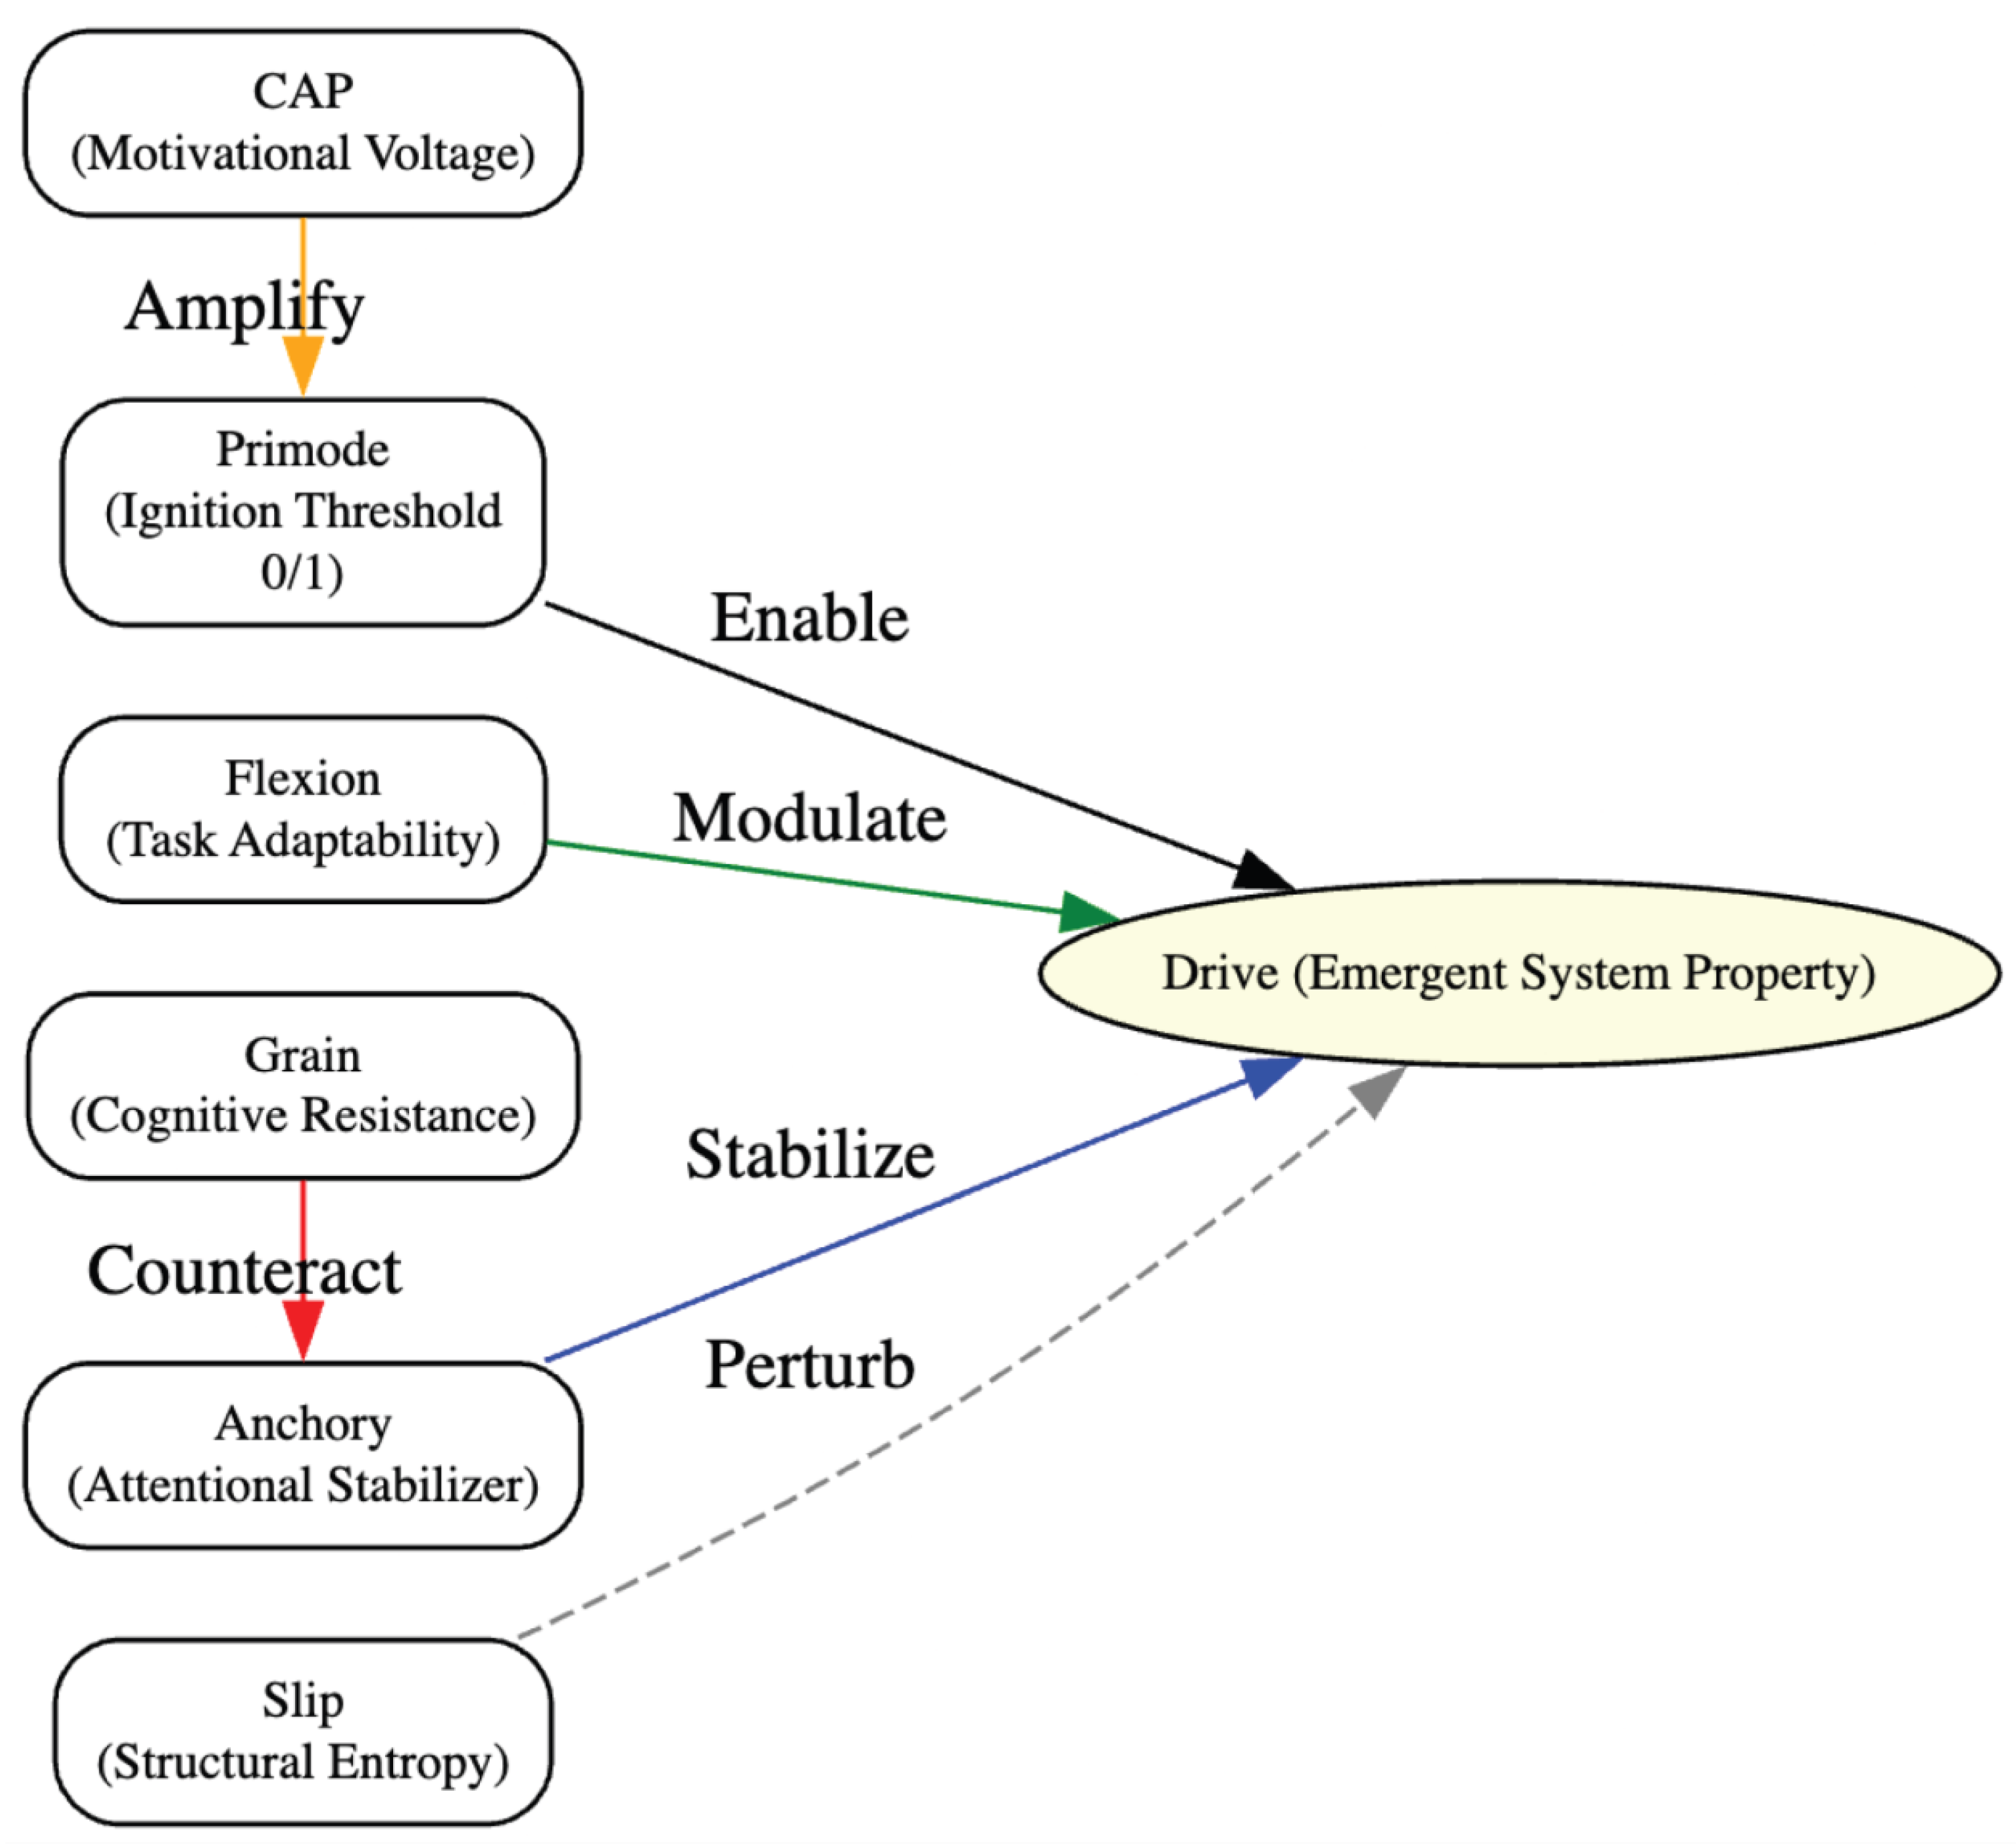
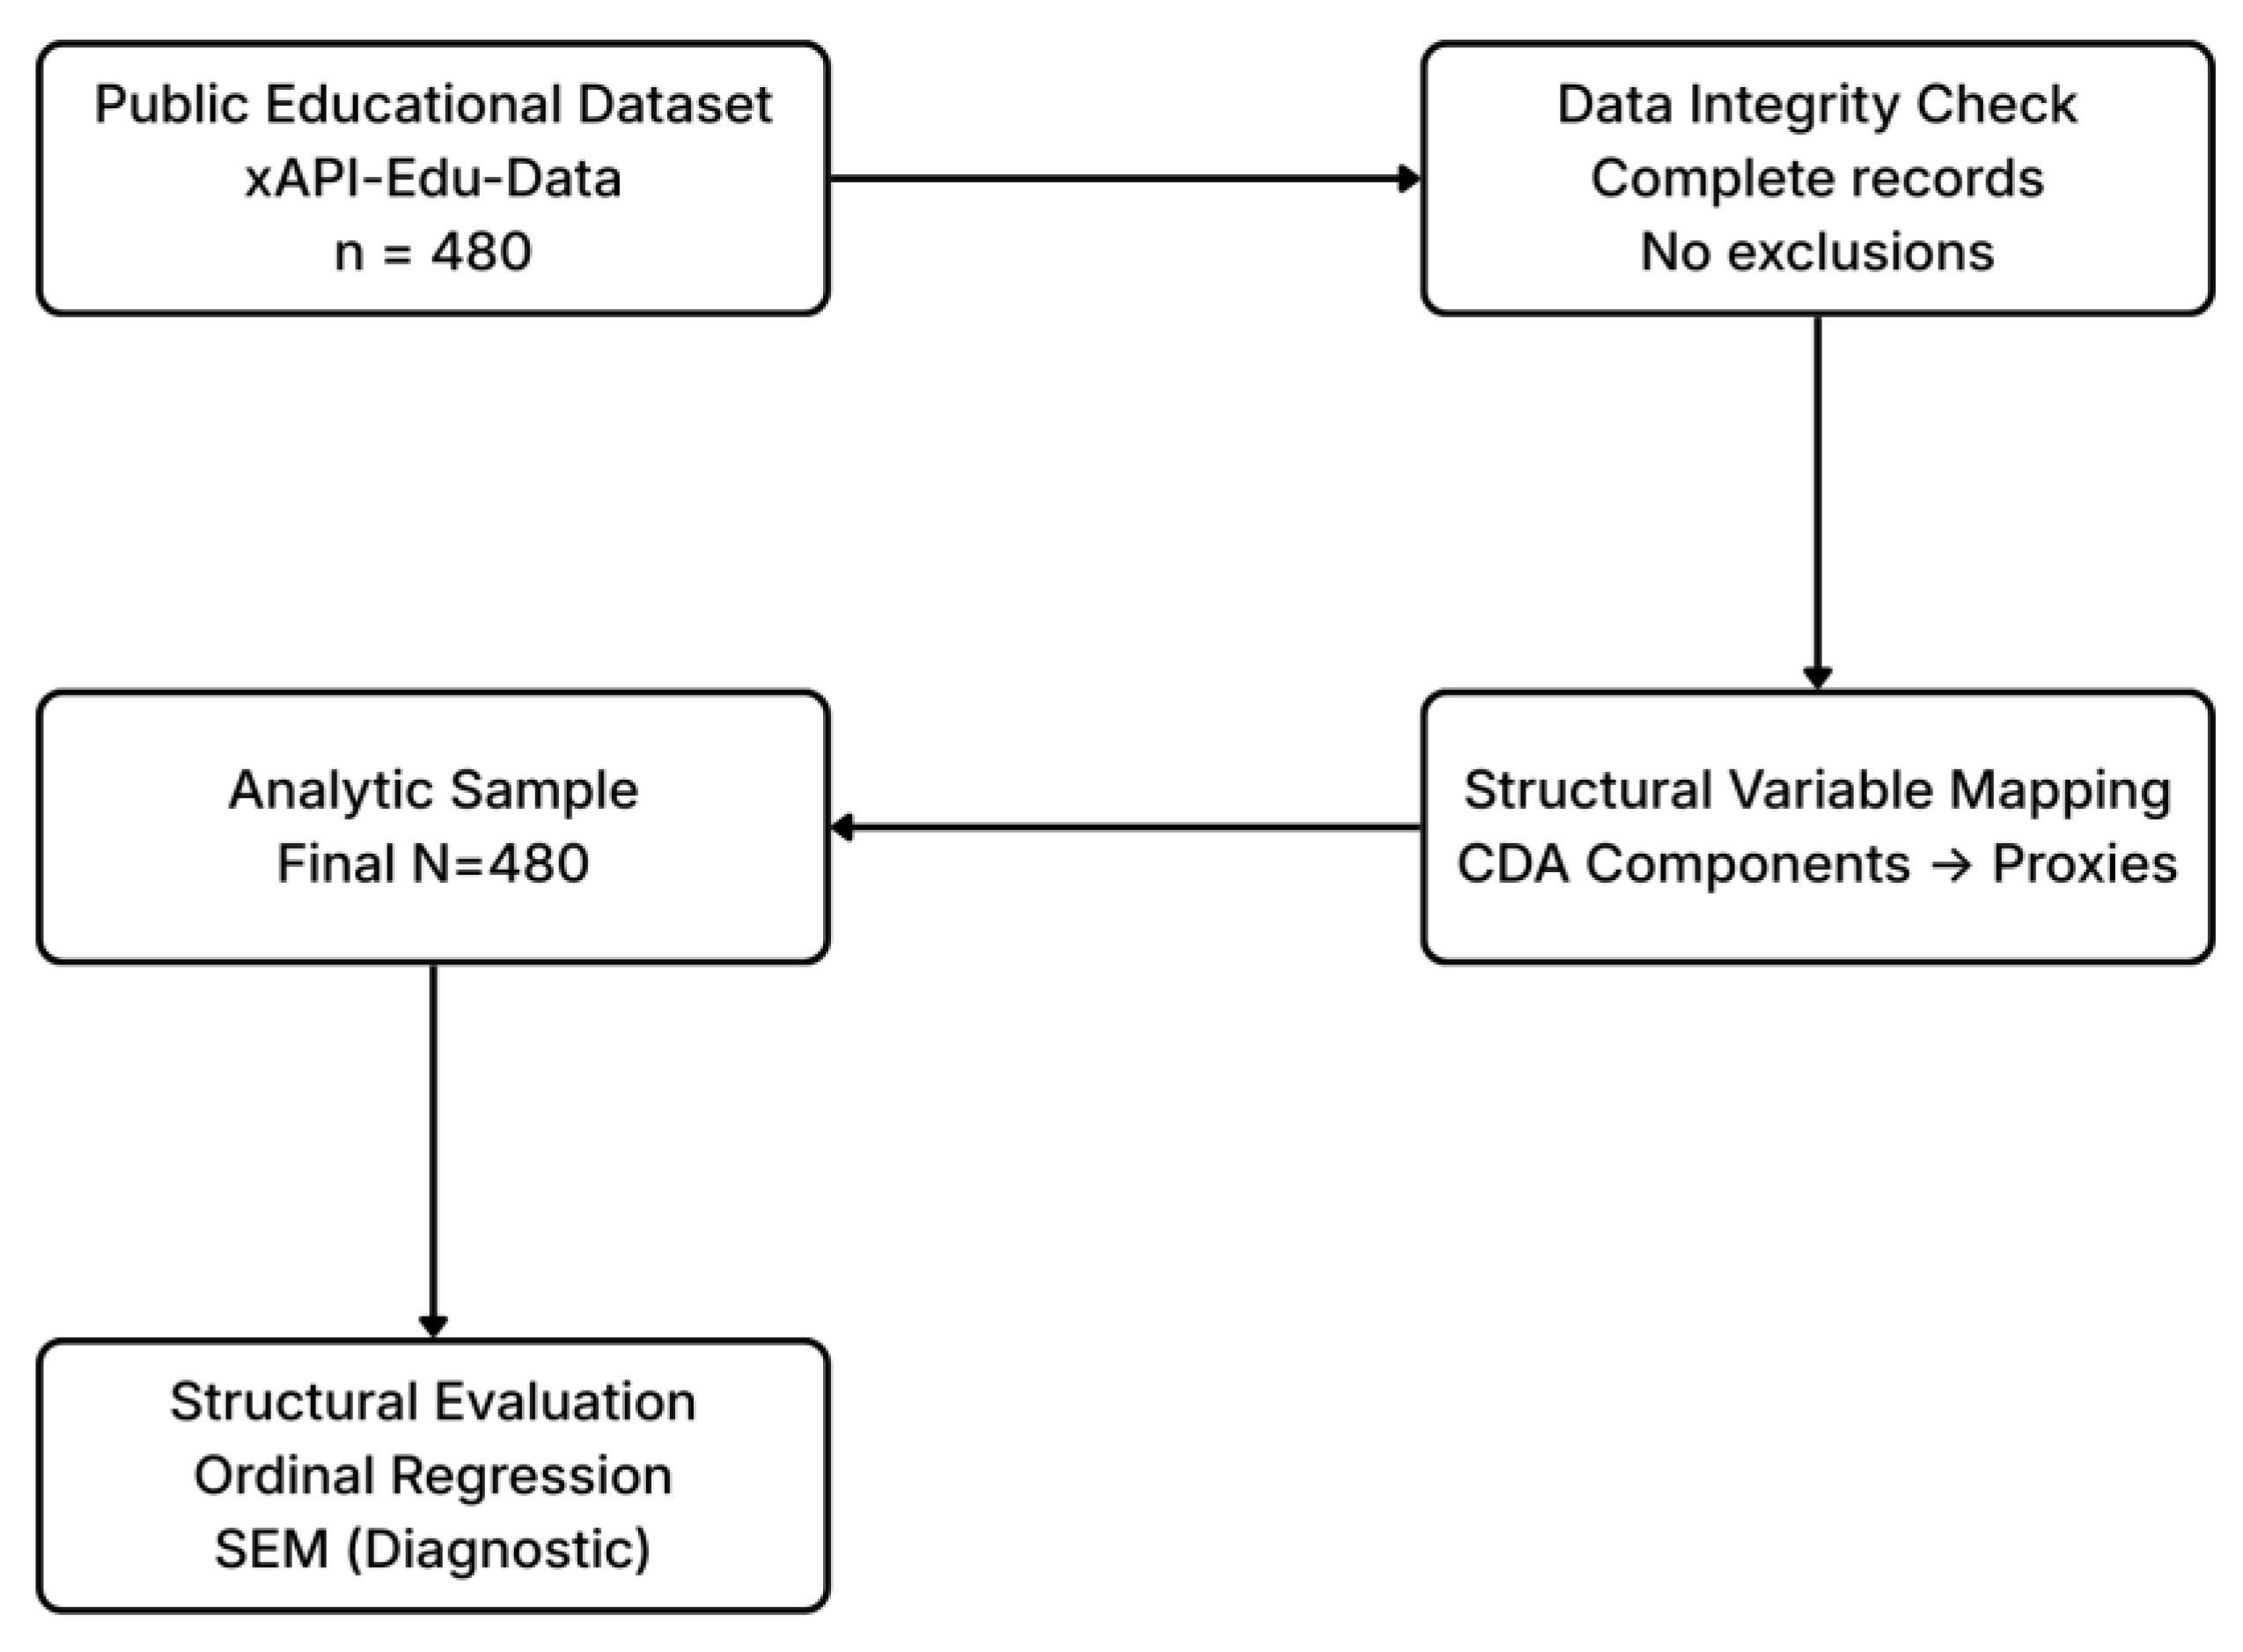
| CDA Variable | Dataset Proxy | Operational Description | Interpretive Scope |
| Primode (Ignition Readiness) | Student Absence Days (≤7 vs. >7) | The attendance threshold used as a coarse indicator of readiness to engage | Binary empirical proxy; reflects availability for engagement rather than internal intention |
| Cognitive Activation Potential (CAP) | Composite of Raised Hand, Resource Visits, Announcement Views | Behavioral engagement frequency reflecting mobilized participation | Captures expressed engagement, not subjective motivation |
| Flexion (Adaptability) | Grade Level × Topic Familiarity | Structural compatibility between task difficulty and learner stage | Reflects curricular alignment rather than cognitive skill |
| Anchory (Stabilization) | Discussion Group Participation | Sustained, interactive engagement over time | Proxy for attentional persistence in the learning environment |
| Grain (Resistance) | Parent Satisfaction / Survey Response | Environmental friction or support external to the learner | Contextual resistance indicator rather than internal effort cost |
| Slip (Structural Entropy) | Within-class performance dispersion | Outcome variability under similar instructional conditions | Captures systemic variability rather than individual error |
| Predictor | Outcome Contrast | β | SE | z | p |
| Primode | Middle vs Low | 3.05 | 0.44 | 6.96 | < .001 |
| Primode | High vs Low | 6.02 | 0.69 | 8.67 | < .001 |
| CAP (z) | Middle vs Low | 2.55 | 0.36 | 7.18 | < .001 |
| CAP (z) | High vs Low | 3.60 | 0.40 | 9.09 | < .001 |
| Grain | Middle vs Low | −1.16 | 0.38 | −3.03 | .002 |
| Grain | High vs Low | −2.00 | 0.47 | −4.25 | < .001 |
| Predictor | Outcome Contrast | β | SE | z | p |
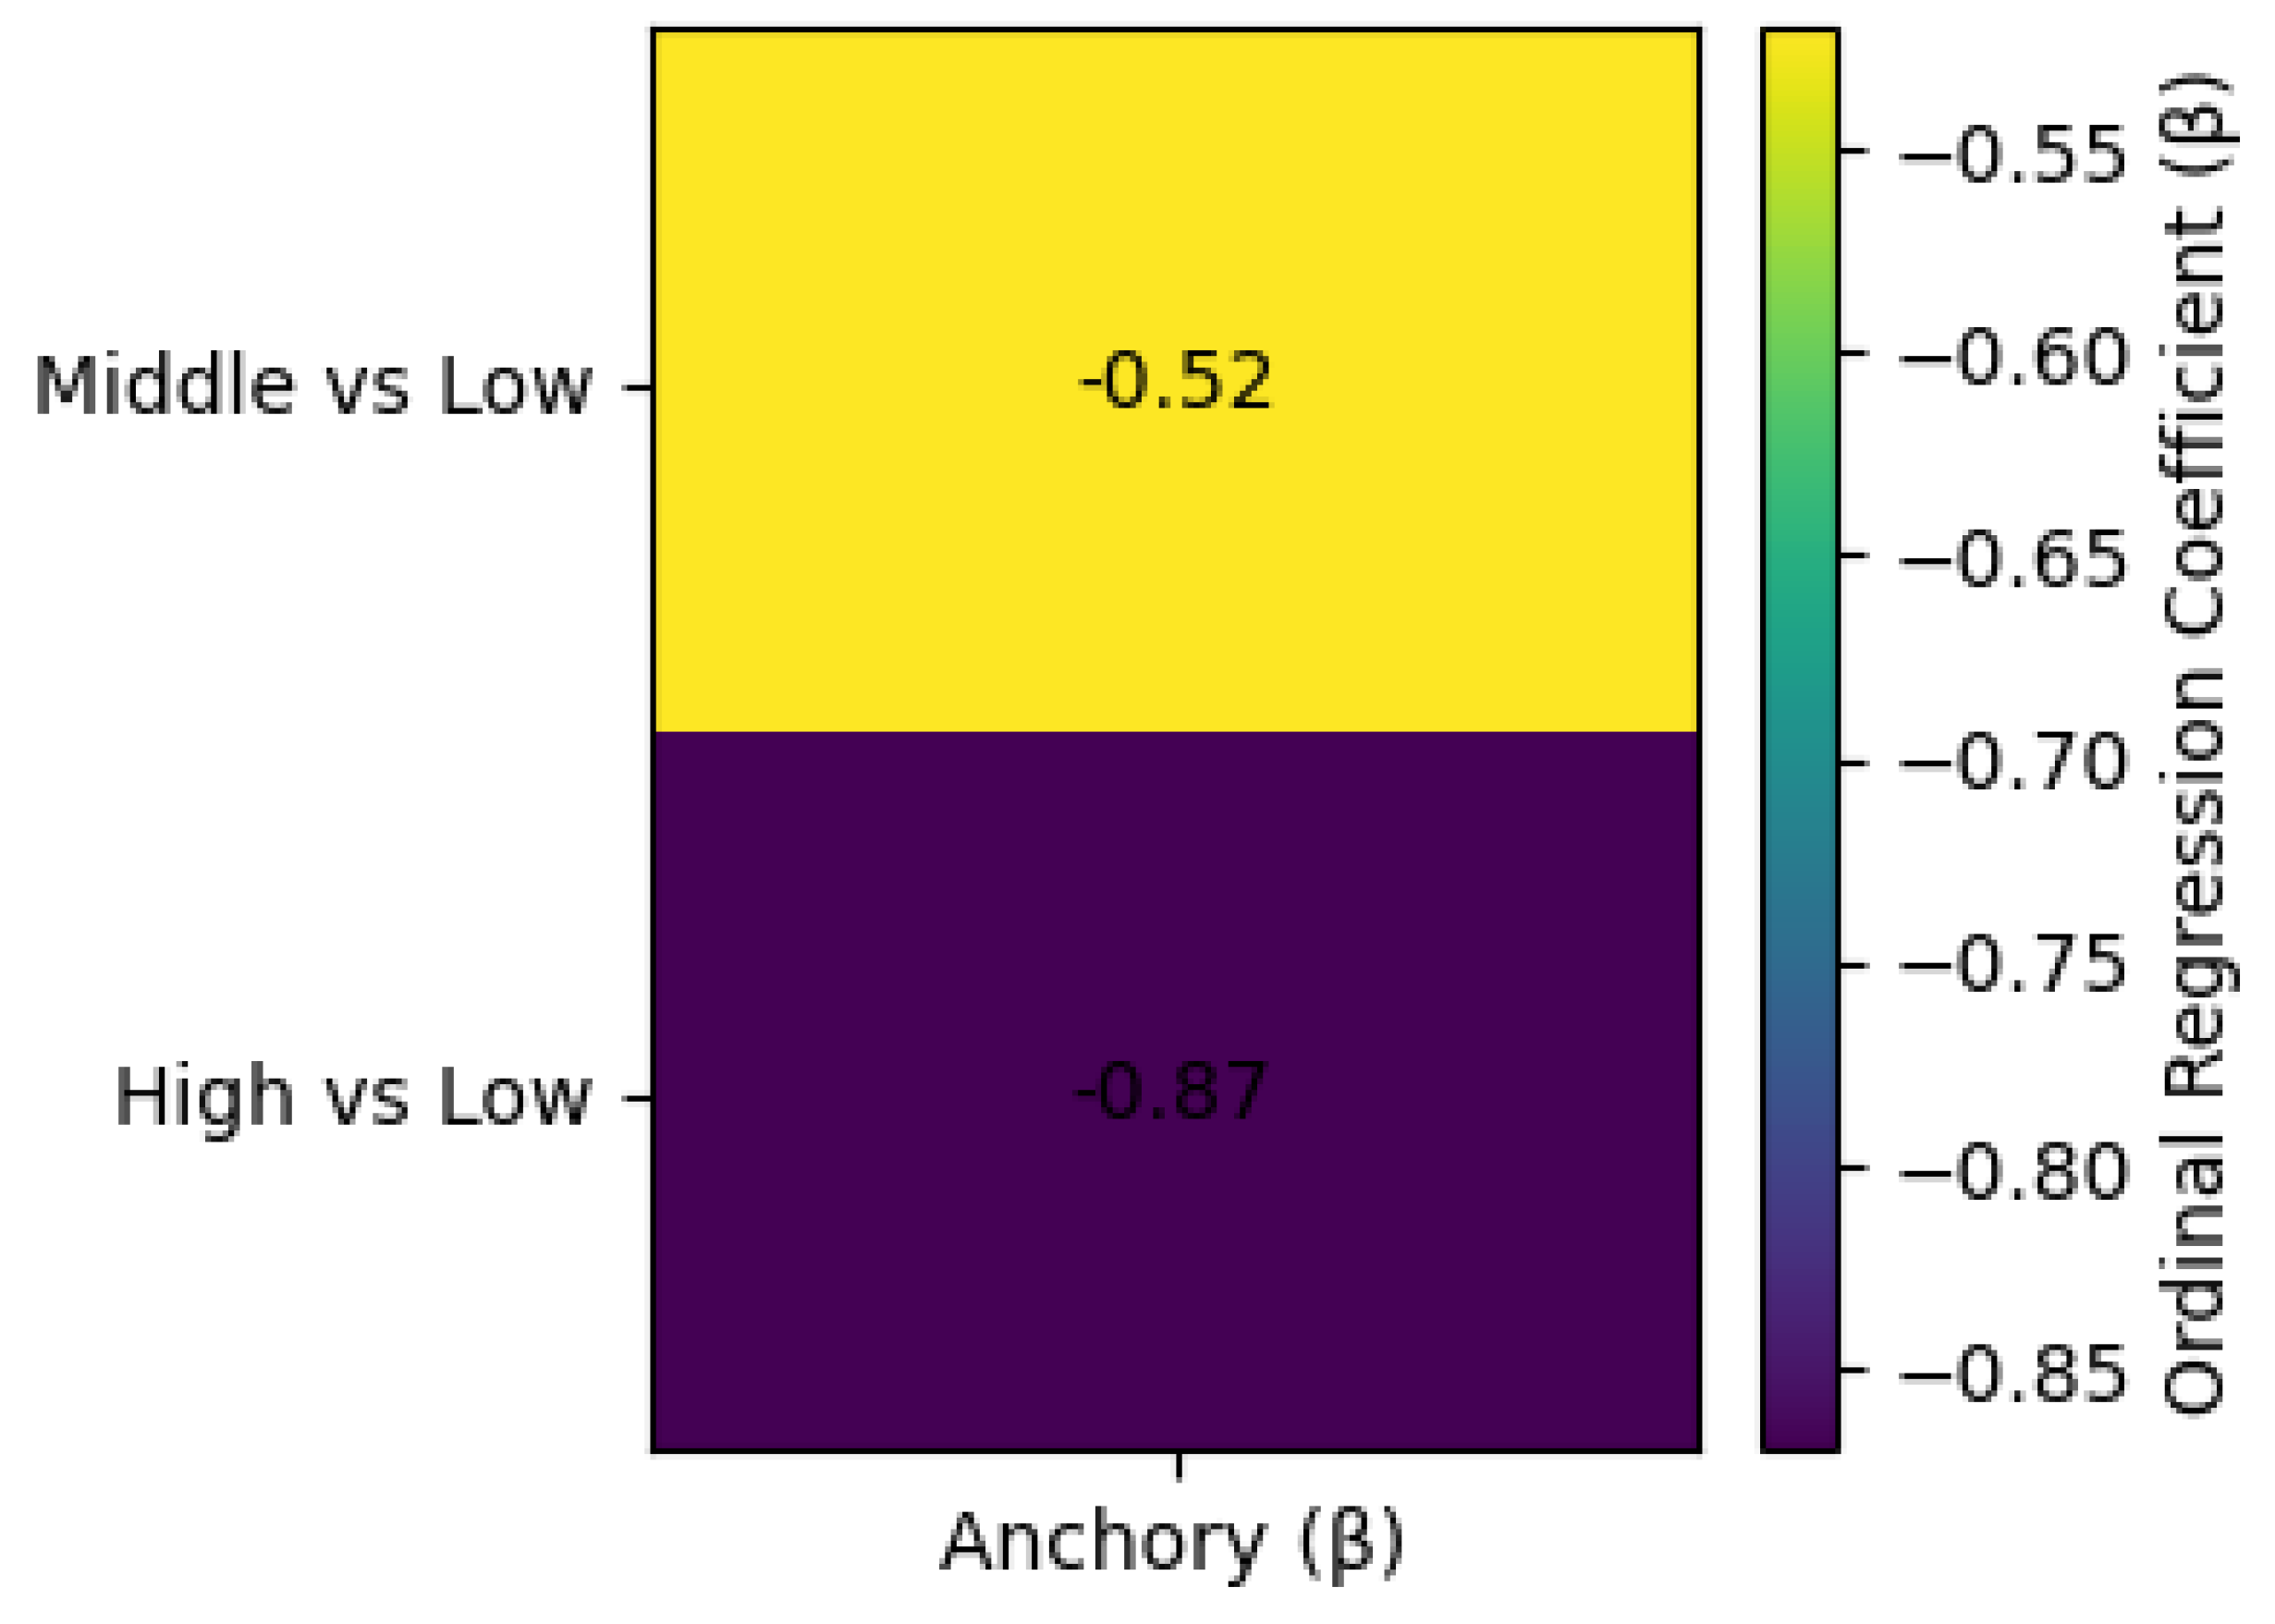
| Anchory (z) | Middle vs Low | −0.52 | 0.24 | −2.14 | .033 |
| Anchory (z) | High vs Low | −0.87 | 0.29 | −2.97 | .003 |
| Predictor | Outcome Contrast | β | SE | z | p |
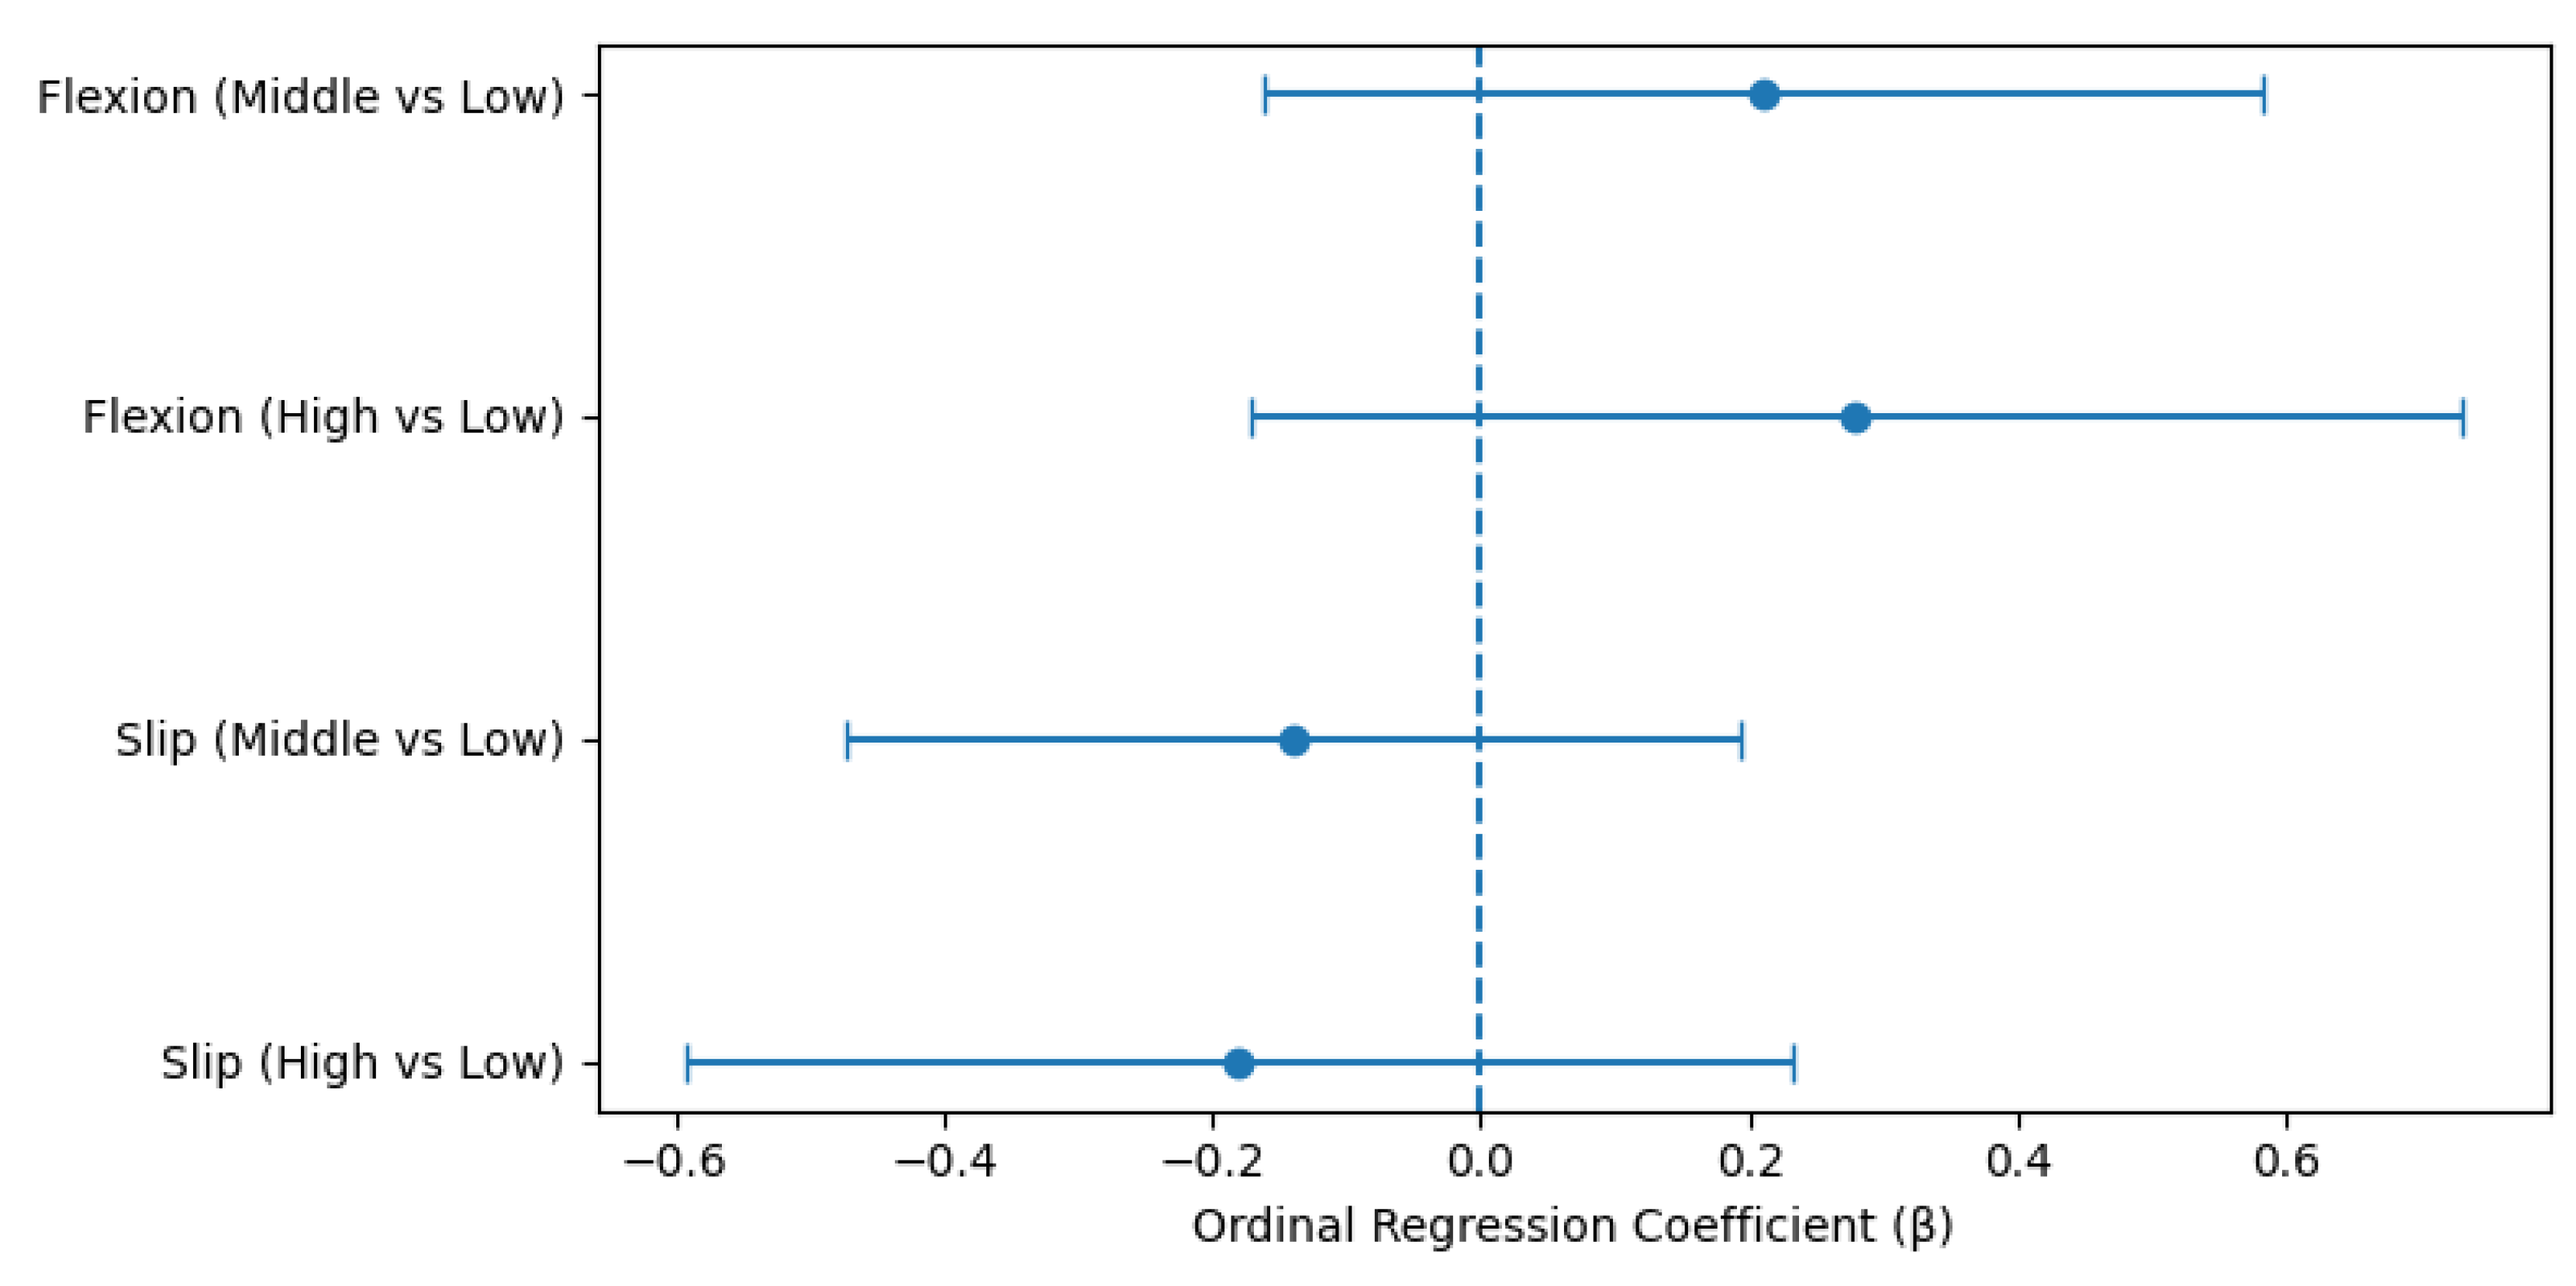
| Flexion | Middle vs Low | 0.21 | 0.19 | 1.11 | .267 |
| Flexion | High vs Low | 0.28 | 0.23 | 1.22 | .224 |
| Slip | Middle vs Low | −0.14 | 0.17 | −0.82 | .412 |
| Slip | High vs Low | −0.18 | 0.21 | −0.86 | .390 |
Disclaimer/Publisher’s Note: The statements, opinions and data contained in all publications are solely those of the individual author(s) and contributor(s) and not of MDPI and/or the editor(s). MDPI and/or the editor(s) disclaim responsibility for any injury to people or property resulting from any ideas, methods, instructions or products referred to in the content. |
© 2025 by the authors. Licensee MDPI, Basel, Switzerland. This article is an open access article distributed under the terms and conditions of the Creative Commons Attribution (CC BY) license (http://creativecommons.org/licenses/by/4.0/).