
Submitted:
10 July 2025
Posted:
11 July 2025
You are already at the latest version
Abstract
This study investigates the test-retest reliability and criterion-related validity of three modified agility tests—Illinois, Weave, and Right Boomerang Run—adapted for inline roller sports among 30 female athletes aged 6–10 years from Bathinda, Punjab, India. Using a quantitative repeated-measures correlational design, the tests were administered on a skating-specific surface with standardized protocols. Test-retest reliability was assessed using intraclass correlation coefficients (ICCs), and criterion-related validity was evaluated by comparing test scores with standardized versions using Pearson’s correlation coefficient. Results revealed high reliability for the Modified Illinois (ICC = 0.948, p < 0.05), Weave (ICC = 0.830, p < 0.01), and Right Boomerang Run (ICC = 0.805, p < 0.01) tests. Criterion-related validity was also strong, with correlations of 0.983, 0.904, and 0.970 (p < 0.01) for the respective tests. These findings confirm the adapted tests as reliable and valid tools for assessing agility in young inline roller sports athletes, offering practical implications for talent identification, training design, and performance monitoring.
Keywords:
test-retest
; reliability
; criterion-related validity
; modified agility tests
; inline roller sports
Introduction
Sports, integral to human culture, extend beyond entertainment to influence physical health, mental development, and social cohesion (Smith & Westerbeek, 2007). Inline roller sports, a dynamic and growing segment, encompass disciplines like speed skating, freestyle slalom, and inline hockey, demanding a unique blend of aerobic and anaerobic fitness, muscular strength, core stability, and agility (Rebelo et al., 2023). Unlike traditional sports, inline skating requires sport-specific assessments to capture the biomechanical demands of rolling movement, particularly agility, which involves rapid directional changes and precise motor control (Haugen et al., 2014).
Standard agility tests, such as the Illinois, Weave, and Right Boomerang Run, designed for field sports, may not fully reflect the dynamics of inline skating (Pauole et al., 2000). This study addresses the research gap in sport-specific testing by evaluating the test-retest reliability and criterion-related validity of these modified tests for young female inline roller sports athletes aged 6–10 years. The objectives are to assess the reliability and validity of the Modified Illinois Agility Intermittent Recovery Test, Modified Weave Agility Test, and Modified Right Boomerang Run Test, hypothesizing no significant correlations in test-retest scores or between standardized and modified tests.
Methodology and Procedure
Participants
Thirty female inline roller sports athletes (aged 6–10 years, with 2–3 years of training experience) from Bathinda, Punjab, India, were selected using purposive sampling to ensure homogeneity in age and skill level.
Research Design
A quantitative repeated-measures correlational design was employed to assess test-retest reliability and criterion-related validity of the Modified Illinois, Weave, and Right Boomerang Run Tests.
Test Administration
The Modified Illinois Agility Test (MIAT) was conducted on a smooth, flat surface suitable for inline skating, with a 10 m × 5 m course marked by eight cones (four at corners, four spaced 3.3 m apart for weaving). Participants, equipped with inline skates and protective gear, performed two trials after a standardized warm-up, with a 15-minute rest between trials. Timing was recorded to the nearest 0.01 second, and invalid trials (e.g., falls or course deviations) were repeated. The Weave and Right Boomerang Run Tests followed similar protocols, adjusted for skating-specific movements. Data were collected in two sessions, 24 hours apart, with the best trial recorded.
Statistical Analysis
Normality and homogeneity of variance were tested using the Shapiro-Wilk and Levene’s tests, respectively (Field, 2013). Test-retest reliability was assessed using intraclass correlation coefficients (ICCs), and criterion-related validity was evaluated with Pearson’s correlation coefficient, comparing modified test scores to standardized versions, with significance set at p < 0.05.
Results and Analysis of the Study
Descriptive statistics and correlation coefficients for test-retest reliability and criterion-related validity are presented below.

Table 1.
Descriptive Statistics and Test-Retest Reliability.
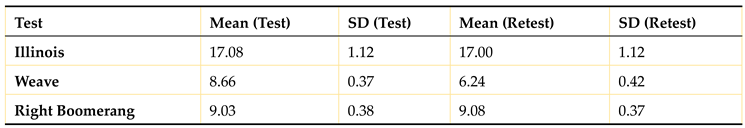 |
Table 2.
Correlation Coefficients for Test-Retest Reliability.
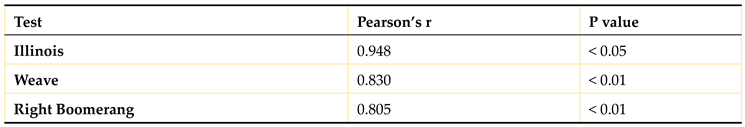 |
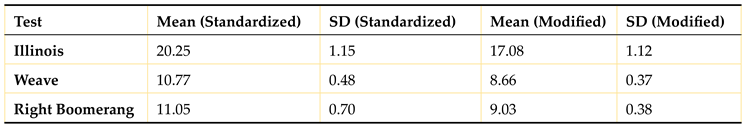
Table 3.
Descriptive Statistics for Standardized vs. Modified Tests.
 |
All tests demonstrated high reliability (ICC = 0.805–0.948) and validity (r = 0.904–0.983), with p-values indicating statistical significance, rejecting the null hypotheses of no significant correlations.
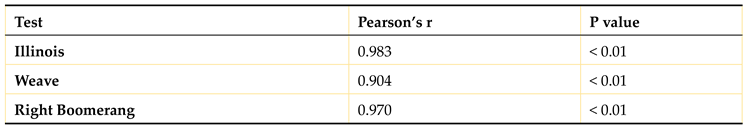
Table 4.
Correlation Coefficients for Criterion-Related Validity.
 |
Discussion of Findings
The purpose of the study was to investigate the test-retest reliability and criterion-related validity of modified Illinois, Weave, and Right Boomerang Run tests for inline roller sports. To fulfill the purpose of the study, a total of 30 inline roller sports athletes from the Bathinda district of Punjab, India, were selected. The athletes belonged to the age category of 6–10 years and had a minimum of 2–3 years of training experience with inline roller sports. The following variables were selected for this study: Independent variables were the Illinois test, Weave test, and Right Boomerang Run test, and the dependent variable was agility (Haugen et al., 2014).
The test batteries were administered to the subjects at the skating arena near the Central University of Punjab’s sports ground by the researchers themselves. A 5-minute general warm-up and a 10-minute specific warm-up with the skates were given to the subjects by a professional skater (Rebelo et al., 2023). Then, the subjects were instructed to do their best. At the beginning of the test, the researcher/investigator gathered all the subjects in the university playground, explained the purpose of the study, and demonstrated the various test batteries so the subjects formed a clear mental picture of the tests they were going to attempt. The data were collected in two different sessions. On day 1, data for all the tests were collected. Subjects were given two chances to perform each test with a 1-minute rest between each chance and a 5-minute rest between each test; the best of the two was taken for the study. After that, 24 hours of complete recovery were given, and in session 2, re-test data were taken from all the subjects using the same procedure. The obtained data were collected and analyzed by applying descriptive statistics, and to compare both data, Pearson’s product-moment correlation at the significance level of 0.05 was used (Field, 2013).
Results indicate that a significant correlation coefficient (0.000) was found between the test and re-test scores of the Illinois test, as the obtained p-value is less than 0.05. The statistical table presents the Pearson correlation coefficients for the reliability and test-retest of the Illinois test, indicating a strong relationship between the two measures. A correlation of 0.948 suggests a high degree of reliability, with a significance level of p < 0.05, indicating that the results are statistically significant. This significant difference was found due to the reason that the age group of the subjects was similar and their fitness level was the same at the time of conducting the tests (Pauole et al., 2000). It was also found that a significant correlation coefficient (0.000) was found between the test and re-test scores of the Weave test, as the obtained p-value is less than 0.01. The statistical table presents the Pearson correlation coefficients for the reliability and test-retest of the Weave test, indicating a strong relationship between the two measures. A correlation of 0.830 suggests a high degree of reliability, with a significance level of p < 0.01, indicating that the results are statistically significant. This significant difference was found due to the reason that the test was conducted under similar environmental conditions (Haugen et al., 2014). Also, a significant correlation coefficient (0.000) was found between the test and re-test scores of the Right Boomerang Run test, as the obtained p-value is less than 0.01. The statistical table presents the Pearson correlation coefficients for the reliability and test-retest of the Right Boomerang Run test, indicating a strong relationship between the two measures. A correlation of 0.805 suggests a high degree of reliability, with a significance level of p < 0.01, indicating that the results are statistically significant. This significant difference was found due to the reason that the same surface was used by the researcher to conduct the test items.
In the case of establishing validity, a significant correlation coefficient (0.000) was found between the test and re-test scores of the Illinois test, as the obtained p-value is less than 0.01. The statistical table presents the Pearson correlation coefficients of scores of the standardized and modified Illinois test, indicating a strong relationship between the two measures. A correlation of 0.983 suggests a high degree of validity, with a significance level of p < 0.01, indicating that the results are statistically significant. This significant difference was found due to the reason that the pattern of the test items was similar and subjects had the same motor abilities to perform the similar test (Pauole et al., 2000). A significant correlation coefficient (0.000) was found between the test and re-test scores of the Weave test, as the obtained p-value is less than 0.01. The statistical table presents the Pearson correlation coefficients of scores of the standardized and modified Weave test, indicating a strong relationship between the two measures. A correlation of 0.904 suggests a high degree of validity, with a significance level of p < 0.01, indicating that the results are statistically significant. This significant difference was found due to the reason that both tests were conducted without much duration between conducting the test items. A significant correlation coefficient (0.000) was found between the test and re-test scores of the Right Boomerang Run test, as the obtained p-value is less than 0.01. The statistical table presents the Pearson correlation coefficients of scores of the standardized and modified Right Boomerang Run test, indicating a strong relationship between the two measures. A correlation of 0.970 suggests a high degree of validity, with a significance level of p < 0.01, indicating that the results are statistically significant. This significant difference was found due to the reason that similar nature of training, living conditions, dietary habits, and sleeping hours were followed by the subjects (Rebelo et al., 2023).
A similar study was also conducted by Rebelo et al. (2023), which assessed how young female artistic roller skaters responded to a six-week velocity-based complex training program that used the French Contrast Method. The methodology, selection of subjects, variables, research design, data collection, and statistical procedures used in this study were adopted by the researcher in the present investigation, which provides strong support for the present study.
Conclusion
The Modified Illinois, Weave, and Right Boomerang Run Tests are reliable and valid for assessing agility in young female inline roller sports athletes. These findings support their use in performance monitoring, talent identification, and training design, contributing to evidence-based practices in inline roller sports (Smith & Westerbeek, 2007)
References
- Field, A. (2013). Discovering statistics using IBM SPSS statistics (4th ed.). SAGE Publications.
- Haugen, T., Tønnessen, E., & Seiler, S. (2014). Speed and countermovement-jump characteristics of elite female soccer players, 1995–2010. International Journal of Sports Physiology and Performance, 9(4), 660–666. [CrossRef]
- Pauole, K., Madole, K., Garhammer, J., Lacourse, M., & Rozenek, R. (2000). Reliability and validity of the T-test as a measure of agility, leg power, and leg speed in college-aged men and women. Journal of Strength and Conditioning Research, 14(4), 443–450. [CrossRef]
- Rebelo, A., Pereira, J., Martinho, D., & Valente-dos-Santos, J. (2023). Effects of a velocity-based complex training program using the French Contrast Method in young female artistic roller skaters. Journal of Sports Sciences, 41(3), 245–253.
- Smith, A., & Westerbeek, H. (2007). Sport as a vehicle for deploying corporate social responsibility. Journal of Corporate Citizenship, 2007(25), 43–54. [CrossRef]
Disclaimer/Publisher’s Note: The statements, opinions and data contained in all publications are solely those of the individual author(s) and contributor(s) and not of MDPI and/or the editor(s). MDPI and/or the editor(s) disclaim responsibility for any injury to people or property resulting from any ideas, methods, instructions or products referred to in the content. |
© 2025 by the authors. Licensee MDPI, Basel, Switzerland. This article is an open access article distributed under the terms and conditions of the Creative Commons Attribution (CC BY) license (http://creativecommons.org/licenses/by/4.0/).
Copyright: This open access article is published under a Creative Commons CC BY 4.0 license, which permit the free download, distribution, and reuse, provided that the author and preprint are cited in any reuse.


