Submitted:
10 July 2025
Posted:
11 July 2025
You are already at the latest version
Abstract
The article explores the popularity of ride-sharing in Dhaka City and validates the ASE model with personal innovativeness and perceived trust. Data was collected from Dhaka citizens aged 18 to 65, and 355 valid responses were used for the study. The analysis found all proposed hypotheses to be significant, with attitude and social influence having the highest and lowest effects.
Keywords:
ASE model
; adoption behavior
; ride-sharing
; security concerns
; partial least squares (PLSSEM)
Introduction
More and more people around the world are using ride-sharing services for safety reasons, which has big effects on places like Bangladesh. The current situation in Bangladesh shows that the ride-sharing market is growing quickly, with Uber and Pathao leading the way. But worries about security are still a big reason why more people don’t accept it. This answer will talk about how ride-sharing is doing now in Bangladesh, how it could make things safer, how the ASE model can be used, and what the goals of this study are.
Ride-sharing services are quickly becoming a popular option to traditional forms of transportation, especially among young people who value ease of use and freedom (Islam et al., 2019). • Uber and Pathao have over 75% of the market because they got in early and offer a wide range of services (Islam et al., 2019). Users are worried about safety, including careless driving and abuse, even though they are very popular (Cynthia et al., 2019).
Adding strong safety features like tracking in real time and emergency reaction options can greatly boost user trust (Cynthia et al., 2019). Educating drivers and customers about safety measures can reduce risks linked with ride-sharing (Sakib & Mia, 2019)
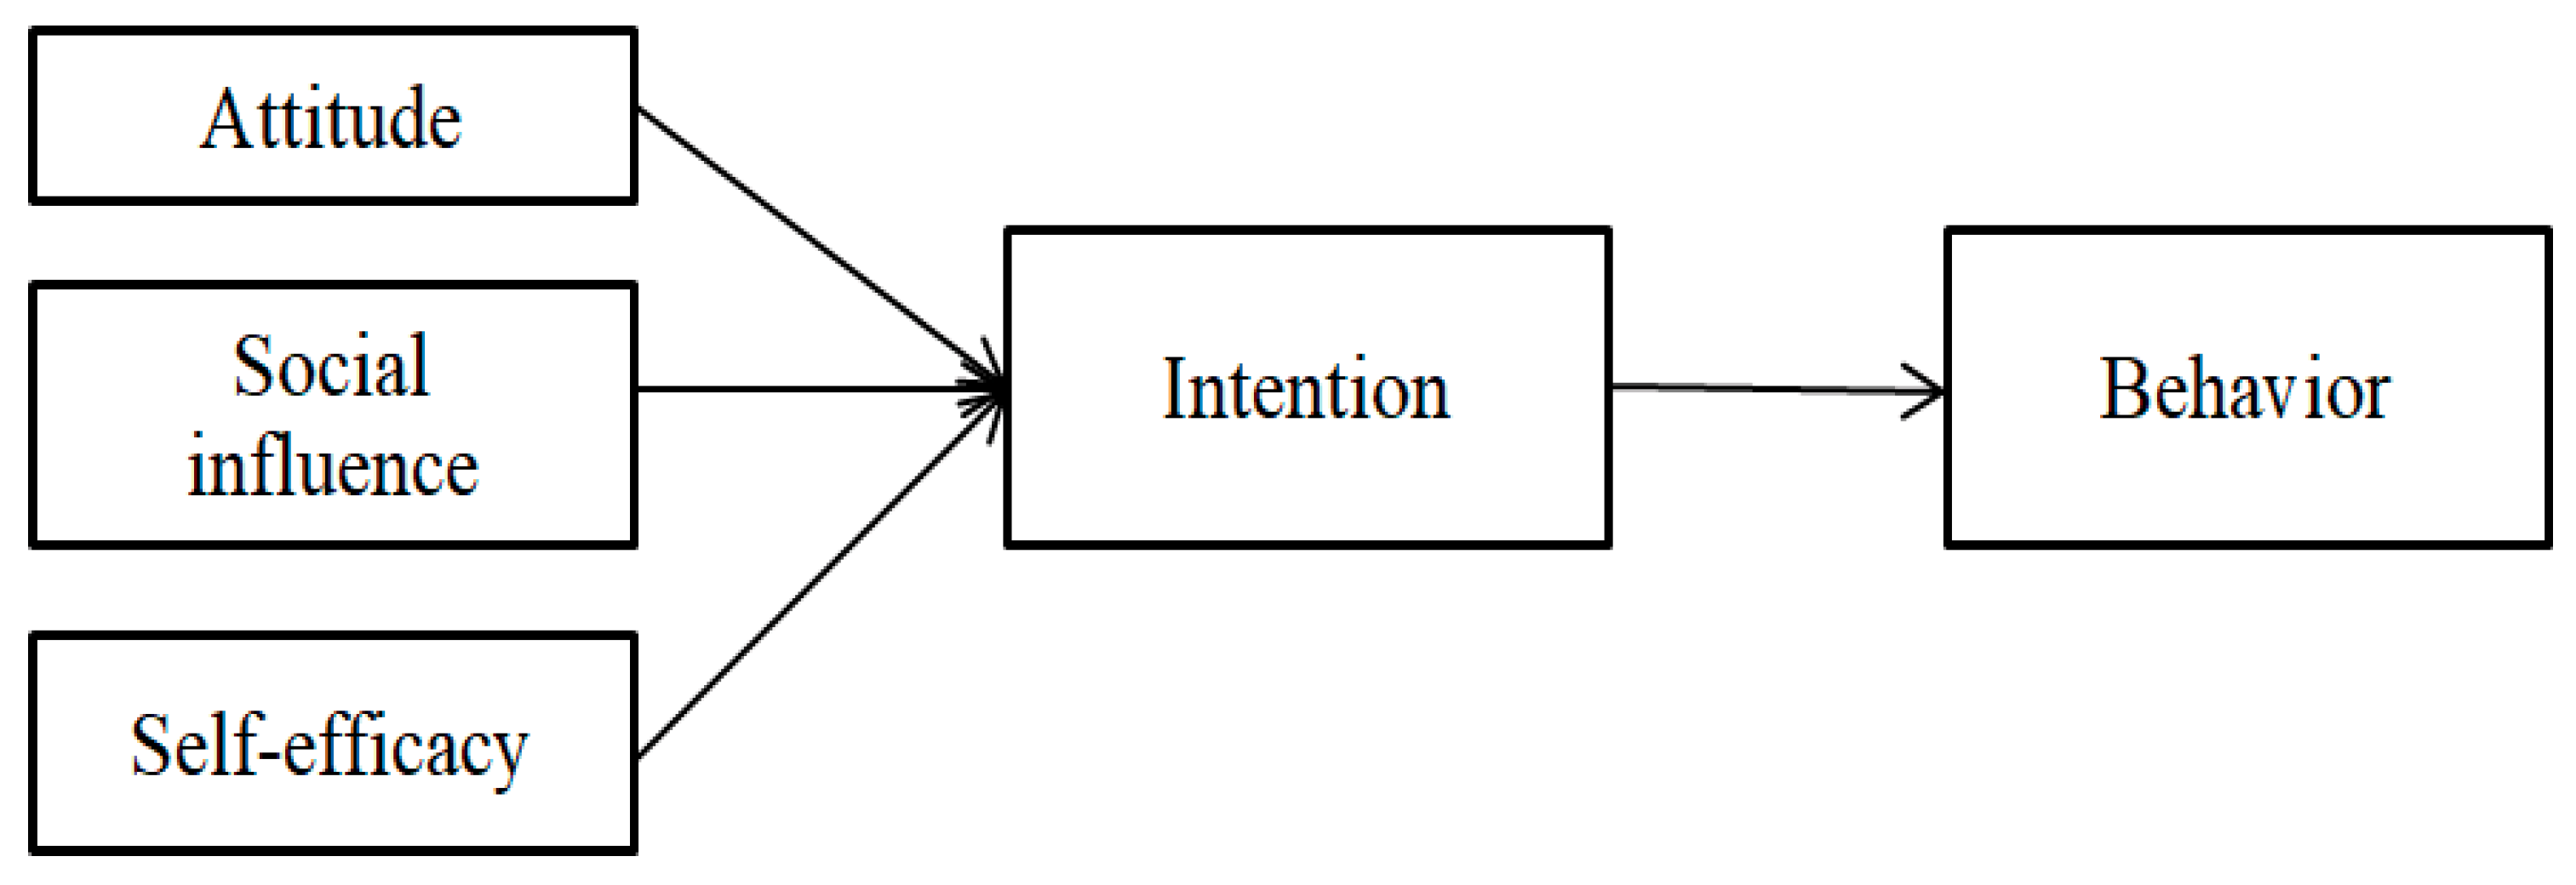
The ASE (Attitude, Social Influence, and Environment) model can be applied to understand user behavior and improve the acceptance of ride-sharing services by solving security issues (Hasan et al., 2021). By focusing on user views towards safety and the social factors that affect their decisions, ride-sharing companies can tailor their services to meet user standards.
To examine the current views of ride-sharing services in Bangladesh, particularly regarding security (Cynthia et al., 2019). To find methods for improving safety and user trust in ride-sharing platforms (Sakib & Mia, 2019). While ride-sharing services present a potential answer for urban transportation in Bangladesh, the constant security concerns show the need for ongoing changes and user education. Addressing these problems is important for creating a better and more effective ride-sharing atmosphere.
Background
The research on factors affecting ride-sharing uptake, especially from a security viewpoint, shows a complex world based in extended technology acceptance models (TAM) and related behavioral theories. Several studies stress the importance of perceived value and ease of use as key factors in users’ acceptance and continued use of ride-sharing services (Triani et al., 2025; Lu & Shi., 2025; Maruf). For instance, research evidence shows that perceived value greatly impacts views toward ride-sharing platforms, which in turn affects behavioral plans (Triani et al., 2025; Lu & Shi., 2025).
Environmental and external factors also play a vital role in shaping user behavior. The effect of external cues, such as green worries and social factors, has been shown to support the acceptance of ride-sharing services among specific groups like students (Raza et al., 2023). These factors help to creating a good approach towards ride-sharing as a healthy transportation option.
Security-related factors are widely accepted as crucial in ride-sharing acceptance. Compliance with information security rules and knowing the factors that affect security behavior are important, especially in the context of sharing private information like passwords (Alraja et al., 2023). Such security worries can act as hurdles or drivers to ride-sharing growth, based on users’ views and company policies.
Figure 1.
ASE Model.
Behavioral extensions, such as the theory of planned behavior (TPB), have been combined into models to better understand cessation and continued use. For example, perceived danger and perceived worth have been found as important factors affecting visitors’ choices to continue or stop using integrated ride-hailing services (Lu & Shi., 2025). These factors are closely linked to security views, as worries over privacy breaches and data security can negatively affect perceived worth and increase perceived risk.
Furthermore, human traits and emotional intelligence also affect security-related actions. Leaders with high emotional intelligence can create environments that promote security obedience and trust, which are vital for ride-sharing platforms’ security goals (Coronado-Maldonado & Benítez-Márquez., 2023). Additionally, personal factors such as age, gender, and schooling may reduce the impact of security views on behavioral plans (Wu et al., 2025).
In summary, the studied literature shows that ride-sharing acceptance and security are linked, with perceived value, ease of use, surrounding effects, perceived risk, and individual traits acting as key factors. The broader models, including TAM and TPB, provide a complete framework for understanding these processes, especially when applying analysis tools like SmartPLS to measure the impact of these factors (implied across multiple studies). Addressing security issues within this framework is important for improving user trust and promoting the broad acceptance of safe ride-sharing services.

Table 1.
Recent quantitative studies on ASE.
| No | Reference | Year | Journals | Country | Sample Type | Sample Size | Citation | Applica- tion |
| 1 | Goossens et al. (2019) | 2019 | Midwifery | Belgium, Sweden, and Ireland | Reproductive- Aged Men | 304 | 4 | Health |
| 2 | Rodríguez-Calvillo et al. (2011) | 2011 | Health Policy | Spain and UK | General Practitioners | 486 | 31 | Health |
| 3 | Schell rt et al. (2013) | 2013 | BMC Health Services Research | Netherlands | Insurance Physicians | 42 | 08 | Health |
| 4 | Lotrean et al. (2013) | 2013 | Child: care, health and development | Romania and Netherlands | Junior High School Students | 504 | 10 | Health |
| 5 | Alamri. (2022) |
2022 | MDPI | Saudi Arabia | Postgraduate and Undergraduate student | 540 | 20 | Education |
| 6 | Ahmed et al. (2022) |
2022 | Amfiteatru Economic | Romania | Adult | 380 | 8 | Marketing |
| 7 | Yusuf et al. (2023) | 2023 | ASE | Turkey | Student | 47 | Health | |
| 8 | Jattamart and Kwangsawad (2020) | 2020 | IJA | Thailand | Undergraduate Student | 400 | 1 | Health |
Hypotheses and model development
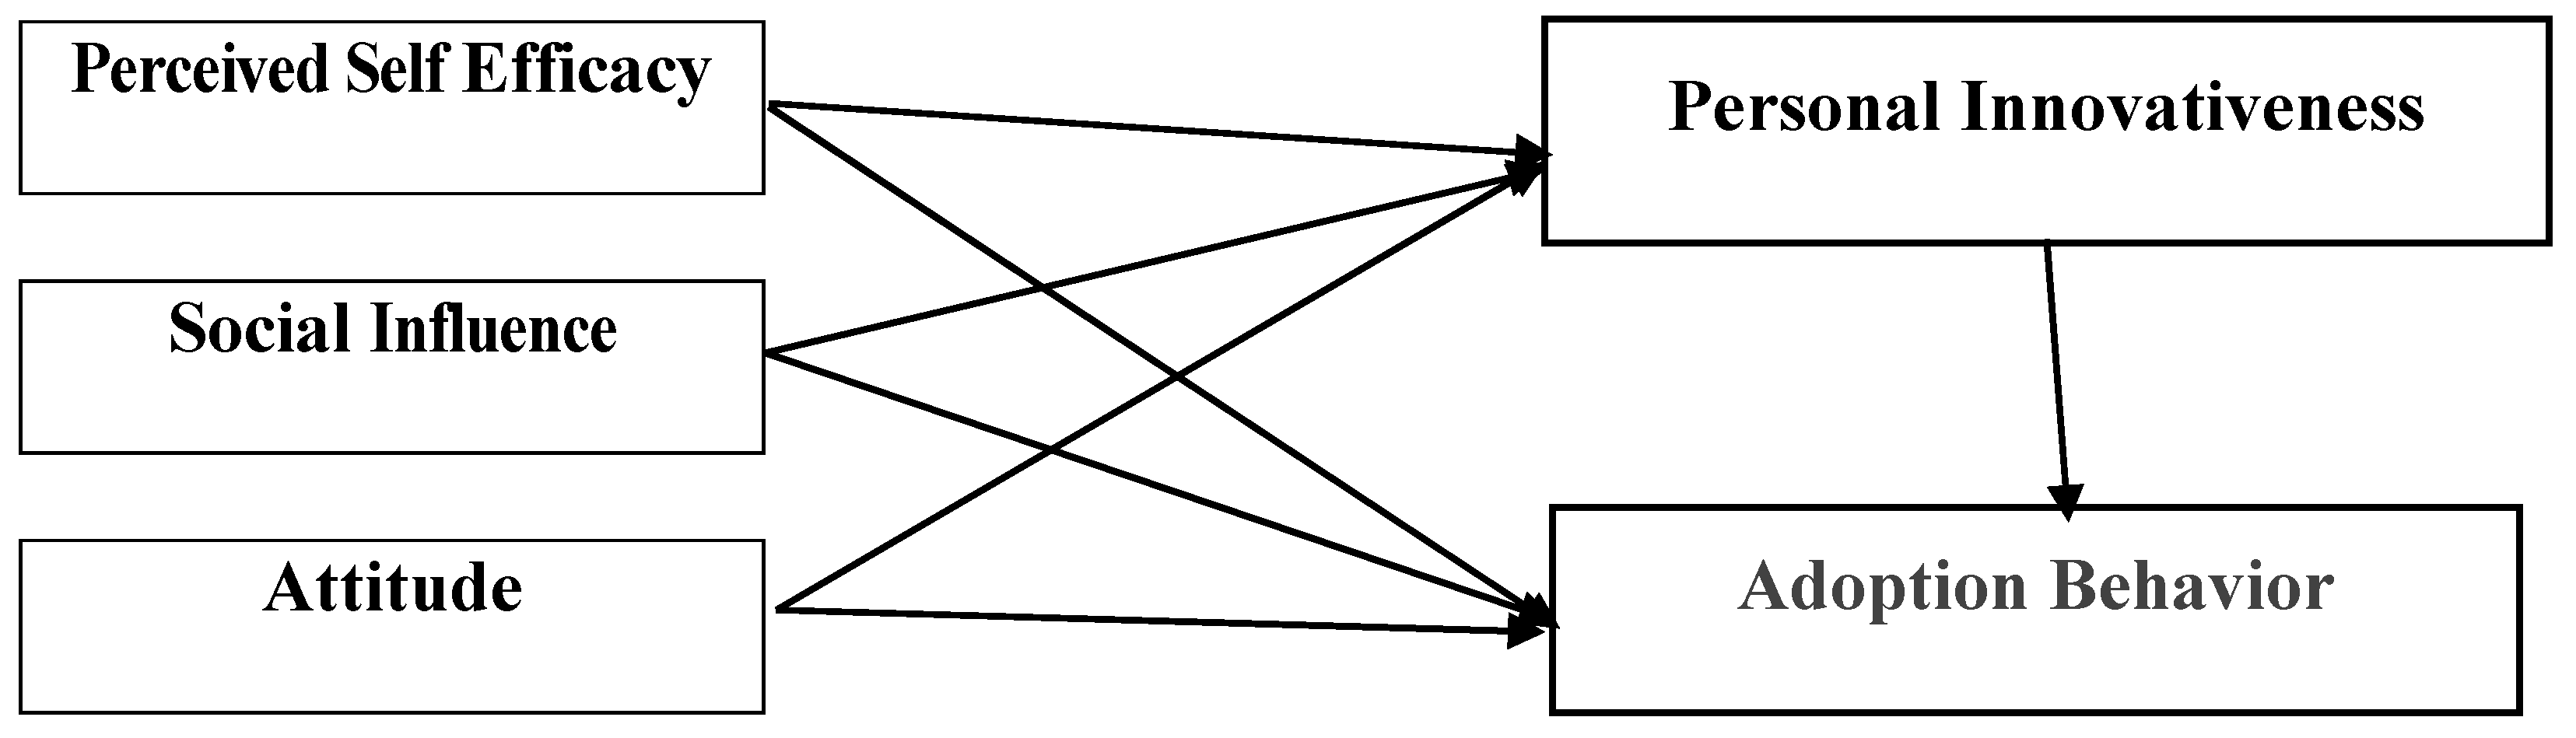
The acceptance of ride-sharing services, especially in the context of security, is affected by different psychological, technical, and social factors. This study extends the Attitude–Social Influence–Self-Efficacy (ASE) model by adding Personal Innovativeness and Perceived Trust to better understand the behavioral patterns of users in Dhaka City. The following theories are created based on available research.
H1: Attitude Negatively influences the Adoption Behavior to Ride Sharing for security reason.
Although attitude generally plays a positive part in technology acceptance, in the context of security issues, a negative attitude—driven by fear of personal risk, data protection, or driver behavior—may hinder adoption. Users who perceive ride-sharing as unsafe may fight its use, despite recognizing its ease (Zhou et al., 2009). Thus, a more critical or careful attitude could lead to lower acceptance rates.
H2: Attitude positively influences the Personal Innovativeness to Ride Sharing for security reason.
Positive user views toward technology can encourage personal innovativeness by increasing willingness to trying new platforms, including those built with security-enhancing features. When individuals view ride-sharing as socially normal or helpful, they may become more ready to explore it, especially when security measures are viewed as appropriate (Agarwal & Prasad, 1998).
H3: Personal Innovativeness positively influences the Adoption Behavior to Ride Sharing for security reason.
Users high in personal innovativeness are more likely to accept new technologies and services, including ride-sharing platforms that offer advanced safety features such as real-time tracking and emergency contacts. Prior studies suggest that creators are early users and more accepting of risk (Im et al., 2003).
H4: Perceived Self Efficacy positively influences the Adoption Behavior to Ride Sharing for security reason.
Perceived self-efficacy, or one’s trust in their ability to use technology safely and effectively, plays a key part in behavior. Users who think they can navigate ride-sharing apps and handle possible threats (e.g., using SOS features) are more likely to adopt them (Bandura, 1986).
H5: Perceived Self Efficacy positively influences the Personal Innovativeness to Ride Sharing for security reason.
Individuals who believe in their own technological skills are more likely to discover and accept new systems. High self-efficacy adds to testing and openness, pushing users to try new safety-enhanced ride-sharing services (Yi et al., 2006).
H6: Social Influence positively influences the Adoption Behavior to Ride Sharing for security reason.
Social rules and group behavior greatly affect technology uptake. If people watch peers or leaders supporting ride-sharing—especially platforms with high-security standards—they are more inclined to adopt it themselves (Venkatesh et al., 2003).
H7: Social Influence positively influences the Personal Innovativeness to Ride Sharing for security reason.
When individuals are exposed to new behaviors or good comments from peers regarding safe ride-sharing apps, their desire to try increases. Social pressure, especially from trusted sources, can improve innovativeness (Moore & Benbasat, 1991).
Methodology
To verify the changed tools, a pre-test and pilot poll were performed with 8 and 35 subjects respectively. Feedback from participants led to the removal of one item from the poll. The remaining items showed good reliability and validity. Data was gathered from people aged 18 to 65+ using random sampling. A total of 400 people were asked, with 355 genuine answers taken for research, resulting in a response rate of 88.75%. The poll was performed online from April 6 to July 29, 2023. The poll included items adapted from earlier studies on personal innovativeness and usage purpose linked to technology. Involving 208 men and 147 women, mainly aged 18 to 65, with a large number of students taking part, the study utilized an independent sample t-test and Harmans single factor for data analysis. All poll questions were replied to, removing any missing data. The ASE system was analyzed through structural equation modeling with Smart PLS 3.3.3. The measurement model’s validity and reliability were confirmed through factor loading, CR, and AVE studies.
Result
Partial Least Squares Structural Equation Modeling (PLS-SEM) is a statistical method used to examine complicated interactions between known and hidden factors. It is particularly useful for predictive modeling and theory building when the study model is complicated, includes multiple categories and markers, or when the sample size is relatively small (Hair et al., 2019).
PLS is a variance-based SEM method, as compared to covariance-based SEM (such as AMOS or LISREL). Unlike traditional SEM methods, PLS does not require data to be normally distributed and can handle multicollinearity among markers. It focuses on increasing the explained variance of dependent variables (R²) and is highly suitable for exploratory research and studies with formative or reflective measurement models.
Table 2.
Demographic data.
| Category | Group | Frequency | Percentage |
| Gender | Women | 147 | 29.73% |
| Men | 208 | 70.27% | |
| Age (InYears) | 18 to 25 | 70 | 19.5% |
| 26 to 30 | 91 | 25.3% | |
| 31 to 35 | 75 | 20.9% | |
| 36 to 40 | 51 | 14.2% | |
| 41 to 45 | 21 | 5.85% | |
| 46 to 50 | 10 | 2.79% | |
| 51 to 55 | 19 | 5.29% | |
| 56 to 60 | 9 | 2.51% | |
| 61 to 65 | 5 | 1.39% | |
| Above 65 | 8 | 2.23% | |
| PhD | 13 | 3.66% | |
| Masters | 70 | 19.7% | |
| Bachelors | 113 | 31.8% | |
| Diploma | 54 | 15.2% | |
| Higher Secondary Certificate | 36 | 10.1% | |
| Secondary School Certificate | 12 | 3.38% | |
| No recognized academic degree | 11 | 3.1% | |
| Other degrees | 46 | 13% | |
| Marital Type | Married | 221 | 62.3% |
| Single | 134 | 37.7% | |
| Profession | Freelancing | 28 | 7.89% |
| Business | 81 | 22.8% | |
| Student | 85 | 23.9% | |
| Private job | 54 | 15.2% | |
| Public job | 55 | 15.5% | |
| Don’t work | 40 | 11.3% | |
| Other jobs | 12 | 3.38% |
Figure 2.
Proposed study model and Hypothesis.
Partial least squares
The suggested conceptual model was assessed using SmartPLS version 3.3.3, a widely used tool in academic study. To rate the measuring model, we studied indicator validity, indicator reliability, convergent validity, and internal consistency reliability. These were analyzed using Variance Inflation Factor (VIF), Factor Loadings (FL), Average Variance Extracted (AVE), and Composite Reliability (CR). According to standard guidelines, suitable limits are: FL ≥ 0.7, AVE ≥ 0.5, CR ≥ 0.7, and VIF < 5. All constructs met these conditions, as described in Table 3.
Discriminant validity was tested using the Fornell-Larcker criterion, which says that the square root of AVE for each construct should be bigger than the association with other constructs. Table 4 shows that all factors showed good discriminant validity.
As shown in Table 5, the coefficient of determination (R²) was 65.5% for Adoption Behavior (AB) and 71.1% for Personal Innovativeness (PI), showing a good level of prediction accuracy for the model.
Regarding effect size (f²), numbers of 0.35, 0.15, 0.02, and 0.01 show big, medium, small, and very small effects, respectively. Table 7 shows that one of the relationships had a significant effect size.
Overall, 6 out of the 7 theories were found to be statistically important, as noted in Table 6. The structural model results are visually represented in Figure 4.
Figure 3.
Research Measurement Model Results from the Smart PLS Tool.
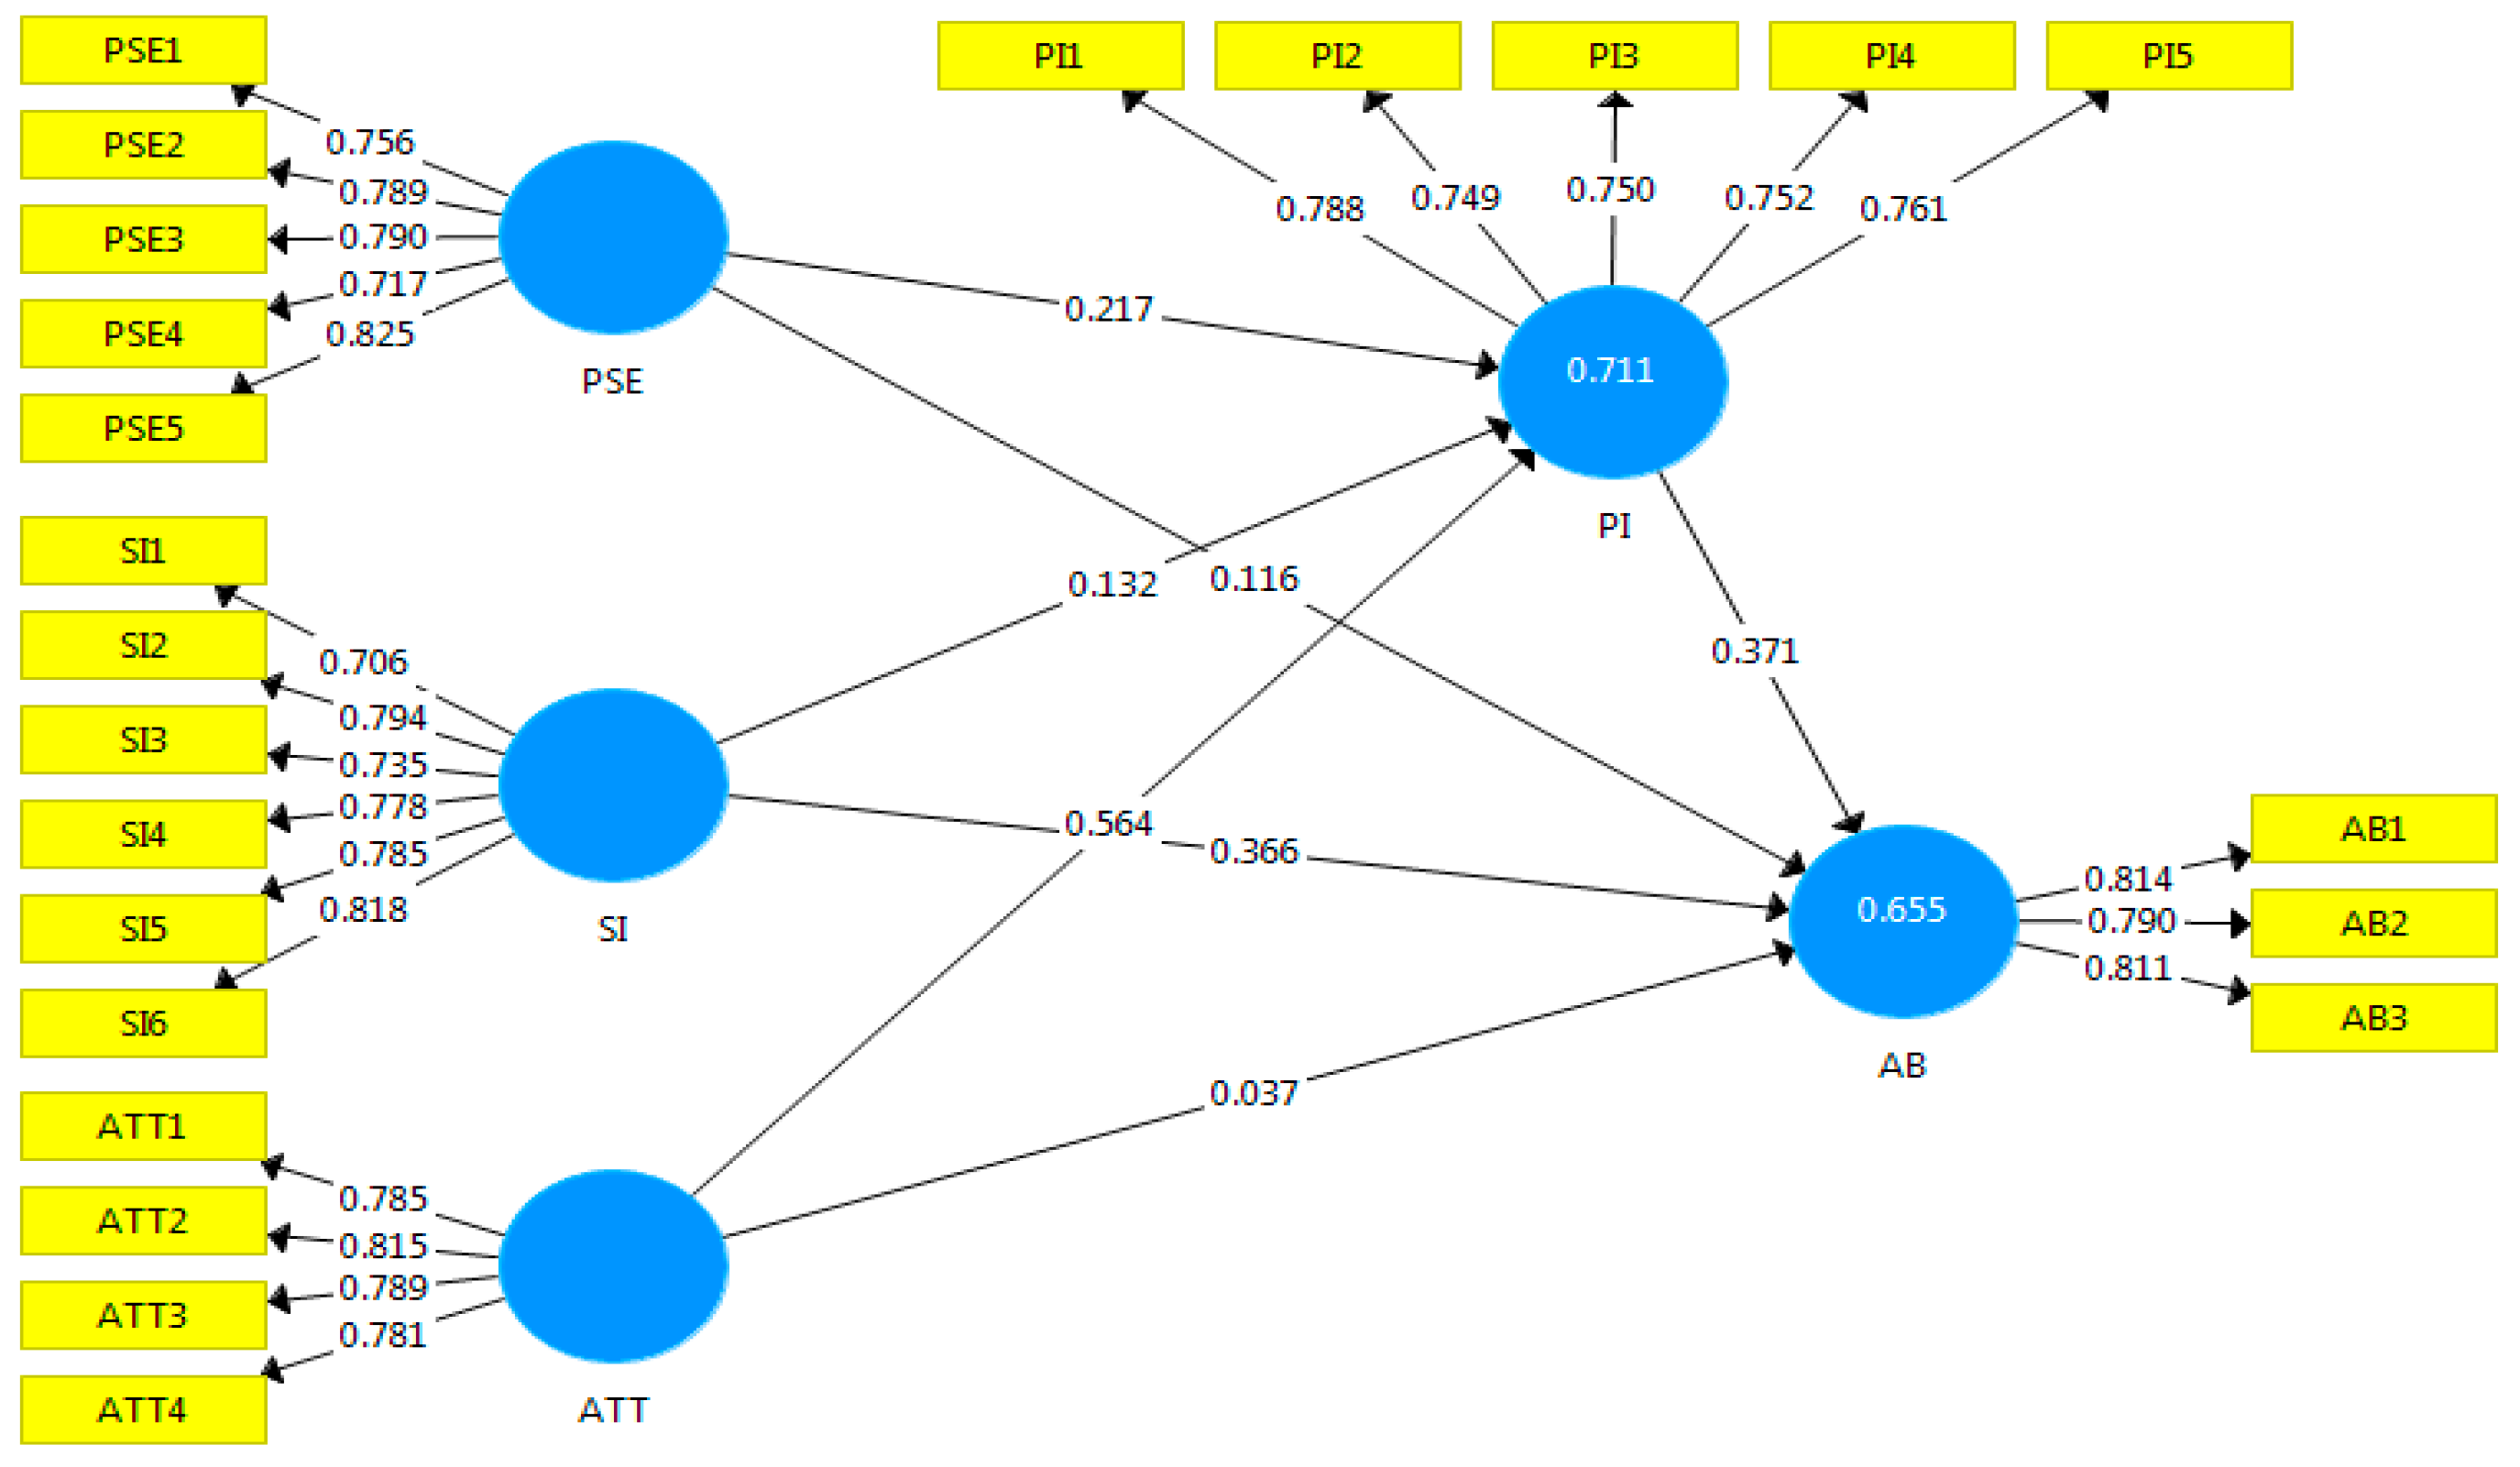
Figure 4.
Research Structural Model Results from Smart PLS Tool.
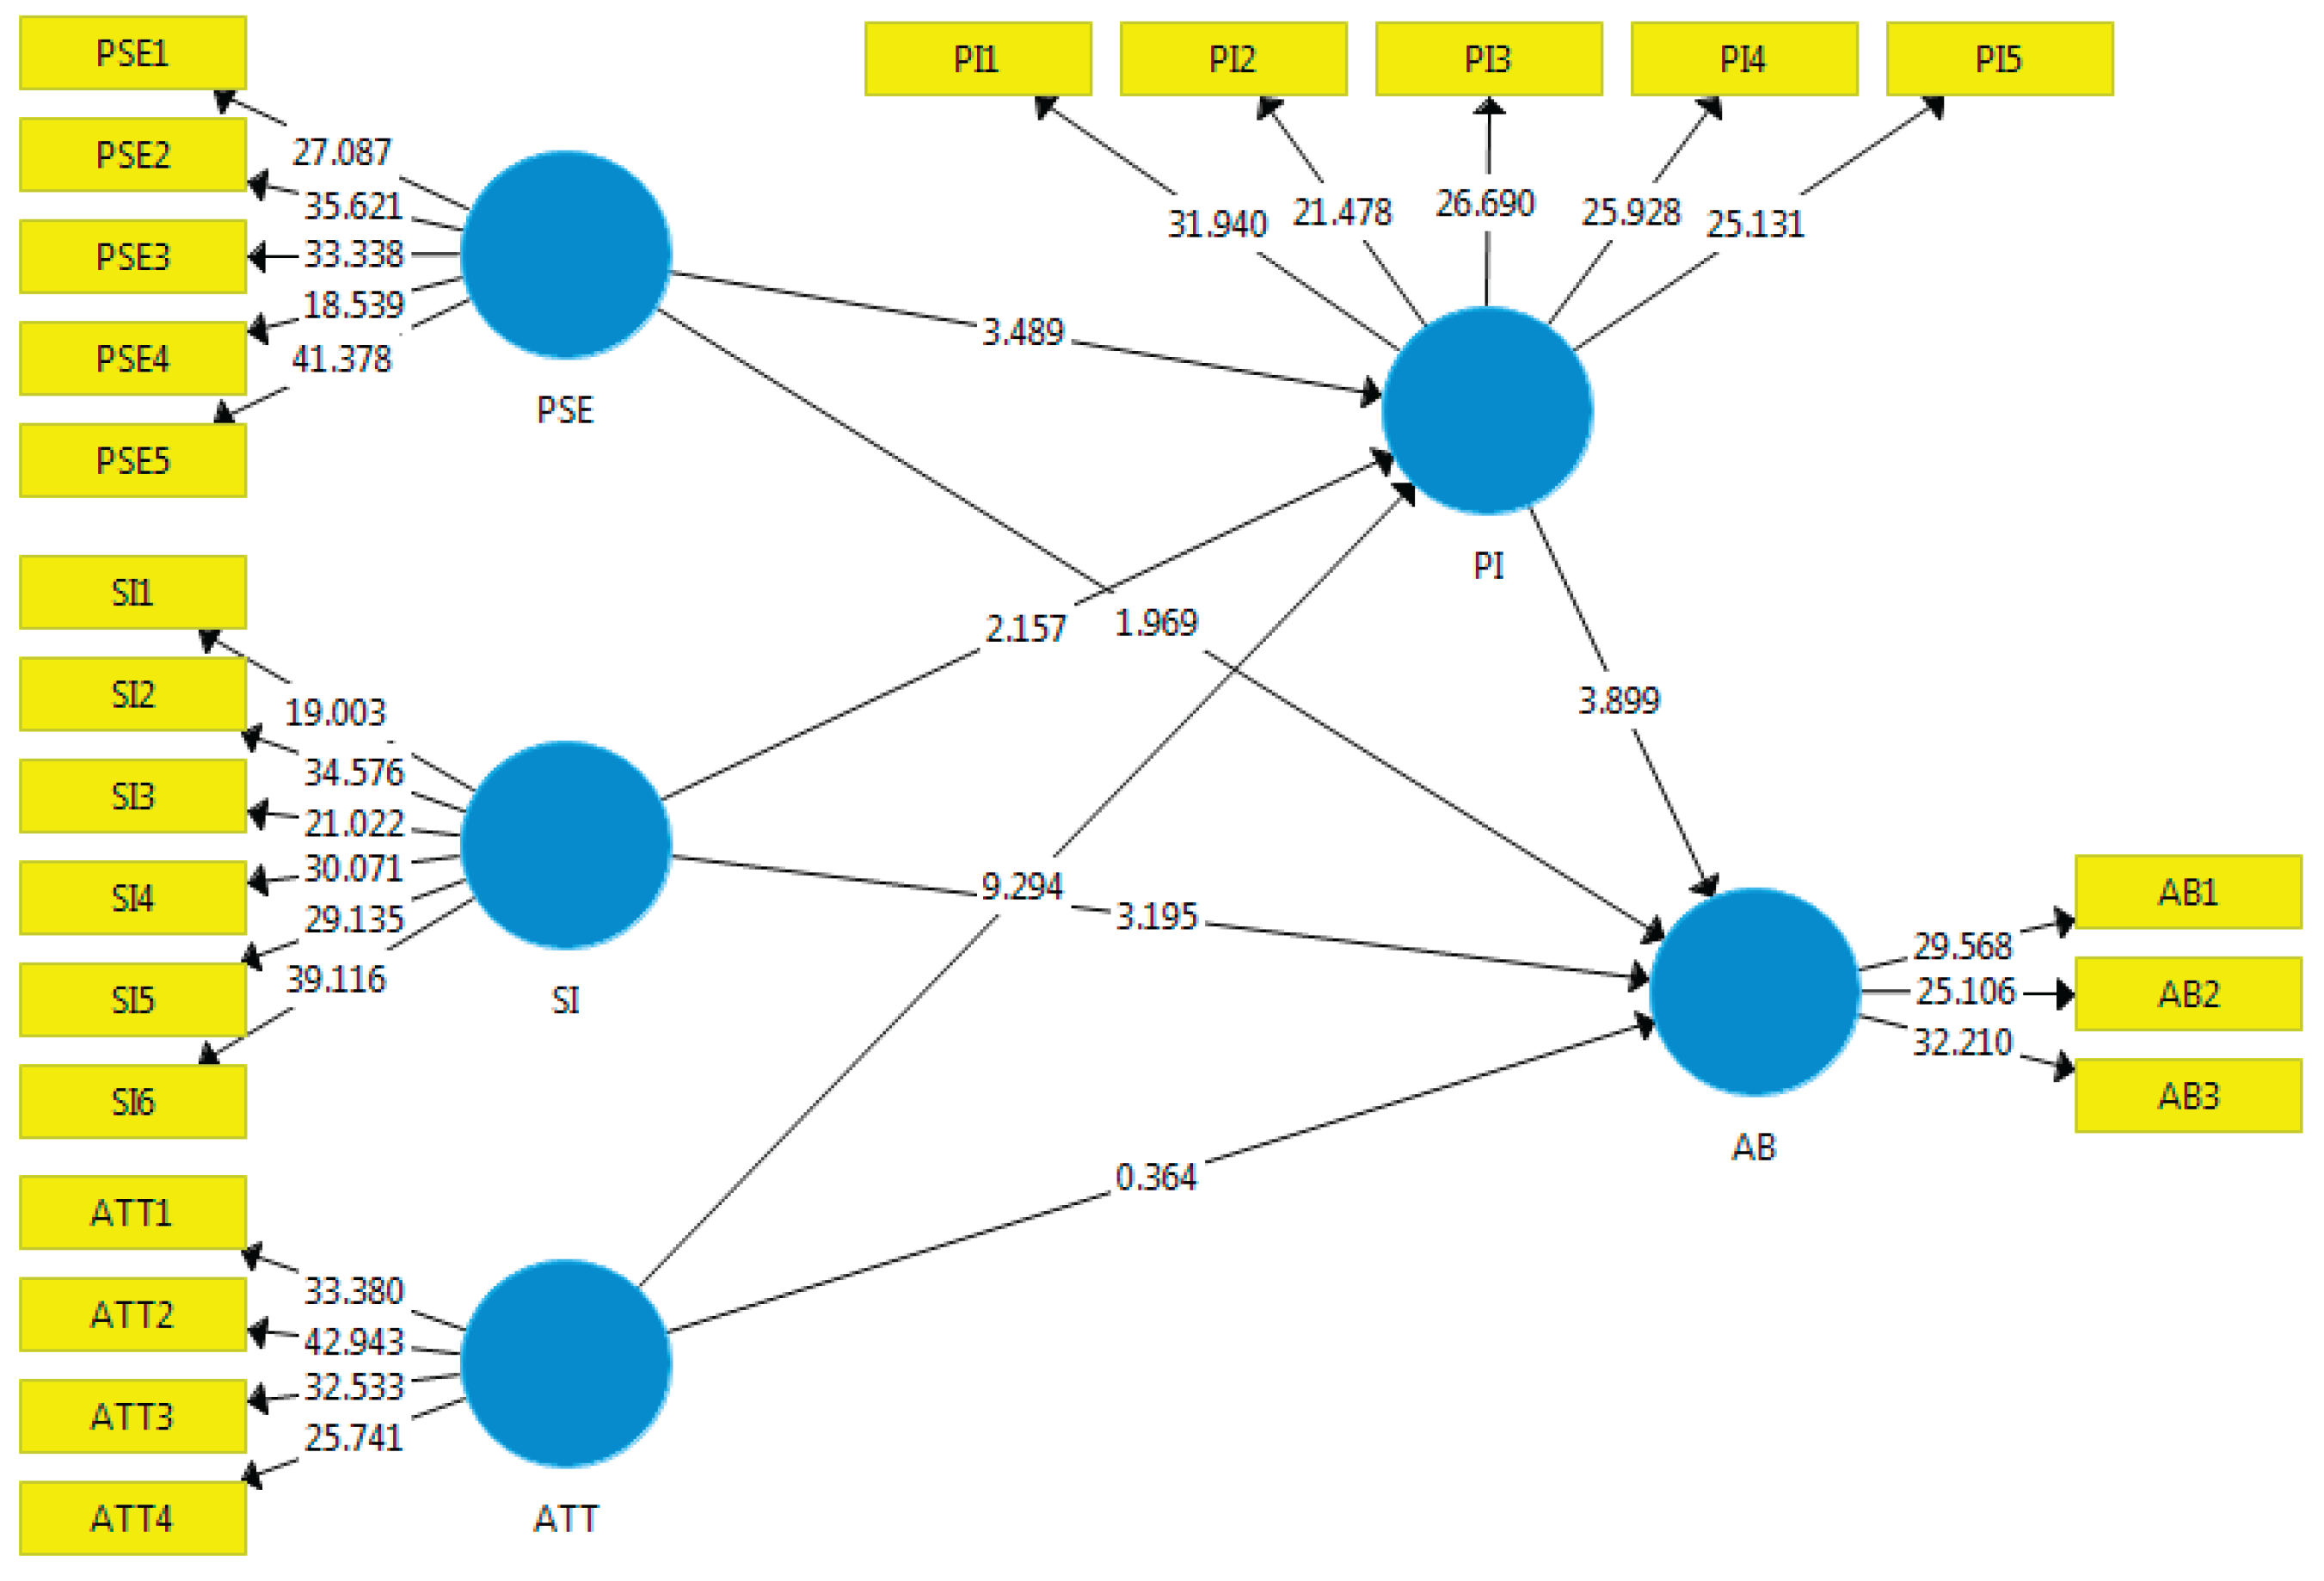
Table 3.
Factor loadings, CR, and AVE.
| Variables | Indicators | Factor Loadings | VIF Values | Composite Reliability (CR) | AVE Values |
| Adaption behavior | AB1 | 0.814 | 1.514 | 0.846 | 0.648 |
| AB2 | 0.790 | 1.385 | |||
| AB3 | 0.811 | 1.429 | |||
| Attitude | ATT1 | 0.785 | 1.532 | 0.871 | 0.628 |
| ATT2 | 0.815 | 1.757 | |||
| ATT3 | 0.789 | 1.615 | |||
| ATT4 | 0.781 | 1.631 | |||
| Personal Innovativeness | PI1 | 0.788 | 1.713 | 0.872 | 0.578 |
| PI2 | 0.749 | 1.644 | |||
| PI3 | 0.750 | 1.608 | |||
| PI4 | 0.752 | 1.667 | |||
| PI5 | 0.761 | 1.629 | |||
| Perceived Self Efficacy | PSE1 | 0.756 | 1.710 | 0.883 | 0.603 |
| PSE2 | 0.789 | 1.969 | |||
| PSE3 | 0.790 | 1.804 | |||
| PSE4 | 0.717 | 1.872 | |||
| PSE5 | 0.825 | 1.951 | |||
| Social Influence | SI1 | 0.706 | 1.480 | 0.897 | 0.593 |
| SI2 | 0.794 | 1.969 | |||
| SI3 | 0.735 | 1.730 | |||
| SI4 | 0.778 | 1.932 | |||
| SI5 | 0.785 | 1.964 | |||
| SI6 | 0.818 | 2.068 |
Result discussion and Analysis
This study examined the factors affecting the acceptance behavior (AB) of ride-sharing services in Dhaka, especially for security worries, through a modified ASE model using SmartPLS 3.3.3. Out of the seven theories suggested, six were found to be statistically significant.
According to H1, attitude does not significantly influence adoption behavior (β = 0.037, p = 0.716, f² = 0.001), showing that users’ general feelings or opinions toward ride-sharing are not sufficient drivers of real usage behavior when security is a worry. This result is inconsistent with past studies that stressed mood as a key predictor of technology adoption (Ajzen, 1991). One possible cause could be the frequency of perceived dangers and real-life events in urban settings like Dhaka, which outweigh positive views.
Table 4.
Discriminant Validity.
| Variables | AB | ATT | PI | PSE | SI |
| AB | 0.805 | ||||
| ATT | 0.699 | 0.793 | |||
| PI | 0.747 | 0.817 | 0.760 | ||
| PSE | 0.680 | 0.704 | 0.713 | 0.776 | |
| SI | 0.748 | 0.759 | 0.722 | 0.749 | 0.770 |
Table 5.
R square.
| Variables | R Square | R Square Adjusted |
| AB | 0.655 | 0.651 |
| PI | 0.711 | 0.708 |
Table 6.
Hypothesis development.
| Variables | Original Sample (O) | Sample Mean (M) | Standard Deviation (STDEV) | T Statistics (|O/STDEV|) | P Values | Decision |
| ATT -> AB | 0.037 | 0.047 | 0.101 | 0.364 | 0.716 | Not supported |
| ATT -> PI | 0.564 | 0.563 | 0.061 | 9.294 | 0.000 | Supported |
| PI -> AB | 0.371 | 0.368 | 0.095 | 3.899 | 0.000 | Supported |
| PSE -> AB | 0.116 | 0.116 | 0.059 | 1.969 | 0.050 | Supported |
| PSE -> PI | 0.217 | 0.218 | 0.062 | 3.489 | 0.001 | Supported |
| SI -> AB | 0.366 | 0.359 | 0.114 | 3.195 | 0.001 | Supported |
| SI -> PI | 0.132 | 0.133 | 0.061 | 2.157 | 0.032 | Supported |
Hypothesis H2 was supported, showing that attitude positively affects personal innovativeness (β = 0.564, p < 0.001, f² = 0.419). This suggests that individuals who hold good views toward ride-sharing are more likely to be open to trying new and safe technological solutions, aligned with results by Kasilingam (2020), where users’ attitude shaped their innovativeness and technology ready.
H3 tested the link between personal innovativeness and adoption behavior, and was supported (β = 0.371, p < 0.001, f² = 0.115). This matches with Agarwal & Prasad, 1998, stressing that creative people are more likely to accept new digital solutions, especially if they are viewed to improve personal safety during rides.
Table 7.
Effect size.
| Relationship | Effect Size (f²) | Interpretation |
| ATT → AB | 0.001 | Very Small |
| ATT → PI | 0.419 | Large |
| PI → AB | 0.115 | Medium |
| PSE → AB | 0.014 | Very Small |
| PSE → PI | 0.065 | Small |
| SI → AB | 0.126 | Medium |
| SI → PI | 0.020 | Small |
Hypothesis H4 confirmed that perceived self-efficacy (PSE) significantly impacts adoption behavior (β = 0.116, p = 0.050, f² = 0.014). This shows that users with better trust in their ability to use ride-sharing apps safely are more likely to adopt them. The result aligns with Bandura’s (1986) self-efficacy theory and Verkijika & De Wet (2018), proving self-efficacy as an important factor in mobile application acceptance.
Hypothesis H5 showed that perceived self-efficacy also positively affects personal innovativeness (β = 0.217, p = 0.001, f² = 0.065). This finding supports the view that individuals who feel confident in handling apps are more likely to explore and adopt newer, more safe ride-sharing choices.
Social impact (SI) plays a major part in this situation. As per H6, social impact positively affects adoption behavior (β = 0.366, p = 0.001, f² = 0.126). This shows that users are likely to accept ride-sharing services if they see their friends or trusted contacts doing so. This result is backed by Venkatesh et al. (2003), who stressed social rules as a factor in the Unified Theory of Acceptance and Use of Technology (UTAUT).
Lastly, H7 confirmed that social effect significantly impacts personal innovativeness (β = 0.132, p = 0.032, f² = 0.020). This fits with earlier study showing that support from social groups can create openness to new technologies, especially in collectivist countries like Bangladesh (Hofstede, 2001).
The R² values show that 65.5% of the variation in adoption behavior (AB) and 71.1% in personal innovativeness (PI) are explained by the model, reflecting significant explanatory power. Discriminant validity was also proven, as per the Fornell-Larcker criterion.
Limitations and Future Works
Despite the useful insights given, this study is subject to several drawbacks. First, the use of a random selecting method reduces the generalizability of the results, as the sample may not fully represent the wider group of ride-sharing users in Dhaka or other regions. Second, the study relied on self-reported data, which may be affected by answer bias or social preference effects. Third, the study focused solely on Dhaka City, possibly missing regional or cultural differences that could impact ride-sharing behavior in other parts of Bangladesh or similar developing countries. Additionally, while the extended ASE model included personal innovativeness and perceived trust, other possibly relevant variables—such as perceived risk, service quality, or previous ride-sharing experience—were not considered.
Future research could address these limits by applying probability selection methods to improve the representativeness of the sample and by performing comparison studies across different places or countries to explore geographic and cultural differences. Moreover, ongoing studies could be performed to track changes in user behavior and views over time, especially as ride-sharing technologies and safety features improve. Future models could also be expanded to include additional categories such as perceived risk, user happiness, and service stability to gain a more complete understanding of user behavior. Finally, combining qualitative methods, such as interviews or focus groups, may provide deeper insights into user concerns and motivations, particularly around safety and trust in the context of ride-sharing.
Theoretical and Practical Contribution
This study makes a significant contribution to the existing literature by extending the Attitude-Social Influence-Self Efficacy (ASE) model through the inclusion of two additional constructs—personal innovativeness and perceived trust—to better understand ride-sharing behavior in the context of urban security concerns. By empirically supporting the extended ASE model in Dhaka City, this study offers new insights into the psychological and social factors that shape consumers’ willingness to engage in ride-sharing services. The result that attitude has the biggest effect while social influence has the smallest offers subtle theoretical implications for the differing impact of ASE components in rising countries. Furthermore, the merging of trust—particularly in a security-sensitive environment—addresses a gap in current models that often ignore the role of perceived risk and safety in the acceptance of shared mobility services. From a practical approach, the results of this study offer useful insights for ride-sharing companies, lawmakers, and technology developers. The strong impact of attitude suggests that information efforts stressing the benefits, safety measures, and cost-effectiveness of ride-sharing can successfully improve user acceptance. The relatively smaller effect of social influence suggests that group pressure or social rules may not be as important in decision-making within this demographic, indicating a need for more personalized and trust-based marketing strategies. Additionally, the presence and importance of perceived trust show the necessity for service providers to improve security features, such as driver background checks, emergency contact systems, and user verification procedures. These improvements can build customer trust and encourage wider usage, especially among hesitant users in highly crowded urban areas like Dhaka.
Conclusion
Having a safe and secure place to live is a basic need for everyone, and security problems in ride-sharing have a major effect. Research shows that explaining and adopting security measures can help recover trust, which then lowers the negative effects on continued usage. Another study suggests that the platform plays a crucial part in building trust, which affects buyers’ behavior. An Indian study also found that trust greatly affects users’ plans to use shared ride-hailing services. These results offer suggestions to ride-sharing companies on how to regain consumers’ trust after security events. The possible effect of ride-sharing services on urban transportation has been a focus in the literature, with worries about privacy and security in centralized ride-sharing settings addressed in some studies (source) (Baza et al., 2021). To address these issues, new technologies like blockchain-powered ride-sharing services such as DACSEE and Arcade City are rising, offering better security and privacy. Additionally, I have created a model that correctly predicts the behavioral goals of mobile learning. This model considers different factors at both broad and micro levels that impact the acceptance of m-learning, based on ASE models and external factors affecting the m-learning setting. The study used 355 data points from students, with 44 data points tested in a pilot study. ASE models were adopted, with each P value showing a significant coefficient value range of 0.1 to 0.7. Furthermore, q square values ranged from 0.411 to 0.404, and r square values ranged from 0.655 to 0.711.
Appendix A
| Variable | No | Items | Adapted from |
| Attitude | ATT1 | Using a ride-sharing service is a good idea for security purpose | Iranmaneshet al. (2017) |
| ATT2 | Using a ride-sharing service is a wise idea for security purpose | ||
| ATT3 | I like the idea of using a ride-sharing service for security purpose | ||
| ATT4 | Using a ride-sharing service is a pleasant experience for security purpose | ||
| Social Influence | SI1 | I use the ride-sharing services for security purpose, because, as persons who play a vital role in my life want me to use them. | Magotra et al. (2016) |
| SI2 | I use the ride-sharing services for security purpose, because, as my friends want me to use them. | ||
| SI3 | I use the ride-sharing services for security purpose, because, as people who are valuable to me recommend me to use them. | ||
| SI4 | I use the ride-sharing services for security purpose, because, as people who inspire me are using it. | ||
| SI5 | I use the ride-sharing services for security purpose, because, as my family members want me to use it | ||
| SI6 | I use the ride-sharing services for security purpose as other persons in my social circle want me to use them. | ||
| PerceivedSelf Efficacy | PSE1 | I feel comfortable using ride-sharing services for security purpose | Thompson etal. (2017) |
| PSE2 | Taking the necessary measures of using ride-sharing service is entirely under my control for security purpose | ||
| PSE3 | I have the resources and the knowledge to use ride-sharing services for security purpose | ||
| PSE4 | Taking the necessary measures to use a ride-sharing service is easy for security purpose | ||
| PSE5 | I can protect myself from unwanted incidents (security issues)of public transport by using a ride-sharing service | ||
| PerceivedTrust | PT1 | I feel ride-sharing service is trustworthy for security purpose | Mashal and Shuhaiber (2019) |
| PT2 | I feel ride-sharing service is reliable for security purpose | ||
| PT3 | I feel ride-sharing service is controllable for security purpose | ||
| PT4 | I feel ride-sharing service is efficient for security purpose | ||
| Personal Innovativeness | PI1 | The latest technologies allow me to work more in lesser time. | Magotra et al.(2016) |
| PI2 | I am keen to search for the latest technological developments taking place around me. | ||
| PI3 | I keep myself up with the latest technological developments which provide better results with fewer efforts. |
||
| PI4 | Other people come to me for advice on the usage and benefits of the latesttechnologies. | ||
| PI5 | In general, I am among the first in my social circle to acquire new technology whenever it appears. |
||
| AdoptionIntention | AI1 | I currently use ride-sharing services for security purpose | Zhou et al.(2020) |
| AI2 | I will recommend ride-sharing services to my friends or others for security purpose | ||
| AI3 | Ride-sharing services are my first choice when I need better safety in transport. |
References
- Islam, S.; Huda, E.; Nasrin, F. Ride-sharing Service in Bangladesh: Contemporary States and Prospects. Int. J. Bus. Manag. 2019, 14. [Google Scholar] [CrossRef]
- Cynthia, S. T. , Majumder, M., Tabassum, A., Khanom, N. N., Tuhin, R. A., & Das, A. K. (2019, September). Security concerns of ridesharing services in Bangladesh. In 2019 2nd International Conference on Applied Information Technology and Innovation (ICAITI) (pp. 44-50). IEEE.
- Sakib, M. N. , & Mia, M. H. (2019). The ride-sharing services in Bangladesh: current status, prospects, and challenges. European Journal of Business and Management, 11(31), 41-52.
- Hasan, N. , Khan, A. G., Hossen, M. A., & Islam, A. (2021). Ride on Conveniently!: Passengers’ Adoption of Uber App in an Emerging Economy. International Journal of e-Adoption (IJEA), 13(2), 19-35.
- Nastjuk, I.; Herrenkind, B.; Marrone, M.; Brendel, A.B.; Kolbe, L.M. What drives the acceptance of autonomous driving? An investigation of acceptance factors from an end-user's perspective. Technol. Forecast. Soc. Chang. 2020, 161. [Google Scholar] [CrossRef]
- Maruf, T. I. , Manaf, N. H. B. A., Haque, A. K. M. A., & Maulan, S. B. (2021). Factors affecting attitudes towards using ride-sharing apps. International Journal of Business, Economics and Law, 25(2), 60-70.
- Raza, S.A.; Khan, K.A.; Salam, J. Impact of environmental triggers on students’ behavior to use ride-sharing services: the moderating role of perceived risk. Curr. Psychol. 2021, 42, 11329–11343. [Google Scholar] [CrossRef] [PubMed]
- Alraja, M.N.; Butt, U.J.; Abbod, M. Information security policies compliance in a global setting: An employee's perspective. Comput. Secur. 2023, 129. [Google Scholar] [CrossRef]
- Lu, K.; Shi, C. Why do travelers discontinue using integrated ride-hailing platforms? The role of perceived value and perceived risk. Humanit. Soc. Sci. Commun. 2025, 12, 1–19. [Google Scholar] [CrossRef]
- Coronado-Maldonado, I. , & Benítez-Márquez, M. D. (2023). Emotional intelligence, leadership, and work teams: A hybrid literature review. Heliyon, 9(10).
- Nguyen, G.-D.; Dao, T.-H.T. Factors influencing continuance intention to use mobile banking: an extended expectation-confirmation model with moderating role of trust. Humanit. Soc. Sci. Commun. 2024, 11, 1–14. [Google Scholar] [CrossRef]
- Liu, J.; Chen, X.; Liu, C.; Han, P. Factors influencing adoption intentions to use AIGC for health information: findings from SEM and fsQCA. Front. Public Heal. 2025, 13, 1525879. [Google Scholar] [CrossRef] [PubMed]
- Triani, M.; Nurfanani, A.; Aditya, I.A.; Susanty, A.; Cahyaningrum, K.I.; Widayat, W.; Silviana, S. Empirical model of public participation intention in biomass project based on integrated TAM-TPB model. Sci. Rep. 2025, 15, 1–24. [Google Scholar] [CrossRef] [PubMed]
- Wu, C.; Yeh, P.-C.; Huang, K.-C.; Hu, H.-Y. Factors influencing seniors’ adoption of augmented reality cognitive training games: An extended TAM with moderating effects of participants’ attributes using a PLS-SEM approach. Educ. Gerontol. 2025, 1–23. [Google Scholar] [CrossRef]
- Zhou, T.; Lu, Y.; Wang, B. The Relative Importance of Website Design Quality and Service Quality in Determining Consumers’ Online Repurchase Behavior. Inf. Syst. Manag. 2009, 26, 327–337. [Google Scholar] [CrossRef]
- Agarwal, R.; Prasad, J. A Conceptual and Operational Definition of Personal Innovativeness in the Domain of Information Technology. Inf. Syst. Res. 1998, 9, 204–215. [Google Scholar] [CrossRef]
- Im, S.; Bayus, B.L.; Mason, C.H. An Empirical Study of Innate Consumer Innovativeness, Personal Characteristics, and New-Product Adoption Behavior. J. Acad. Mark. Sci. 2003, 31, 61–73. [Google Scholar] [CrossRef]
- Bandura, A. Social Foundations of thought and Action; 1986; Volume 1986, pp. 23–28.
- Yi, M.Y.; Jackson, J.D.; Park, J.S.; Probst, J.C. Understanding information technology acceptance by individual professionals: Toward an integrative view. Inf. Manag. 2006, 43, 350–363. [Google Scholar] [CrossRef]
- Venkatesh, V. , Morris, M. G., Davis, G. B., & Davis, F. D. (2003). User acceptance of information technology: Toward a unified view. MIS quarterly, 425-478.
- Moore, G.C.; Benbasat, I. Development of an Instrument to Measure the Perceptions of Adopting an Information Technology Innovation. Inf. Syst. Res. 1991, 2, 192–222. [Google Scholar] [CrossRef]
Disclaimer/Publisher’s Note: The statements, opinions and data contained in all publications are solely those of the individual author(s) and contributor(s) and not of MDPI and/or the editor(s). MDPI and/or the editor(s) disclaim responsibility for any injury to people or property resulting from any ideas, methods, instructions or products referred to in the content. |
© 2025 by the authors. Licensee MDPI, Basel, Switzerland. This article is an open access article distributed under the terms and conditions of the Creative Commons Attribution (CC BY) license (http://creativecommons.org/licenses/by/4.0/).
Copyright: This open access article is published under a Creative Commons CC BY 4.0 license, which permit the free download, distribution, and reuse, provided that the author and preprint are cited in any reuse.


