Submitted:
09 July 2025
Posted:
11 July 2025
You are already at the latest version
Abstract
The objective of this study was to assess the impact of incorporating hemp (Cannabis sativa L.) flour (HF) into muffins on their nutritional, physicochemical, microbiological, and sensory characteristics. Muffins were prepared by partially replacing wheat flour (WF) and whole wheat flour (WWF) with HF at levels of 5%, 10%, 15%, and 20%. Analytical evaluations included proximate composition, texture profile analysis (TPA), color measurements, microbial safety tests, and sensory evaluation using trained panelists. The results showed that increasing HF levels improved fiber, protein, and ash content, while moisture content decreased. Texture parameters such as firmness and cohesiveness were affected, and color analysis revealed a progressive darkening of the product with higher HF content. Microbiological analysis confirmed that all samples were within acceptable safety limits. Sensory evaluation indicated that muffins containing up to 15% HF were generally well accepted, while higher levels influenced texture and flavor negatively. The study concludes that HF can be a valuable ingredient for developing nutritionally enriched and sustainable baked goods, provided that formulation is carefully optimized to ensure product quality and consumer acceptability.
Keywords:
alternative flours
; enriched muffins
; functional bakery products
; nutritional quality
; plant-based ingredients
; sustainable food products
1. Introduction
Hemp (Cannabis sativa L.) has long been recognized as a versatile and significant herbaceous plant, with its origins in Central Asia [1]. For centuries, hemp has held an important place in many cultures, valued for its versatility and wide range of uses. Traditionally, it has been recognized for its therapeutic properties and was commonly used in folk medicine to help treat various ailments. [2]. Hemp has also been an important source of strong, durable fibers, historically used in the production of textiles, ropes, and other essential materials, making it a cornerstone of early industries. In addition to its role in textiles, hemp provides a rich supply of cellulosic and woody fibers, which have been used in paper manufacturing and as components in sustainable construction materials. What truly sets hemp apart, however, is its remarkable phytochemical profile, including cannabinoids, terpenes, and flavonoids—bioactive compounds with potential health-promoting properties. [3,4,5,6,7]. These compounds contribute to their increasing importance in modern industries, such as food, cosmetics, and pharmaceuticals [8,9]. The plant's multifaceted applications and rich chemical profile have made it a focus of interest for both historical and contemporary studies, solidifying its reputation as one of the most valuable and sustainable crops in human history [10,11,12].
Thanks to its diverse applications and complex chemical profile, hemp has attracted the interest of researchers for centuries. Historically, it played a vital role in multiple industries, and today, it continues to be studied for its health benefits and potential as a sustainable resource. Its remarkable versatility, along with its low environmental impact, has helped solidify its status as one of the most valuable crops cultivated by humans. As global interest in sustainable materials grows, hemp remains at the forefront of both agricultural and scientific research, underscoring its lasting relevance from the past into the future [1,3,7,11,13,14].
Hemp flour (HF) is a nontraditional, gluten-free, plant-based ingredient that has attracted growing interest in the food industry due to its nutritional value and versatility. Its use in bakery products has expanded in recent years, fueled by increasing consumer demand for healthier and more sustainable food alternatives. HF is produced from the seeds of the hemp plant, which are naturally rich in protein, fiber, and essential fatty acids, offering a promising substitute for conventional grain-based flour. A substantial portion of HF is derived from by-products of hemp oil extraction, such as hemp seed cake and hemp protein. These residual materials can be further processed into flour, contributing to a circular and resource-efficient production model. [15,16,17]. Hemp flour is a nutrient-dense ingredient, rich in protein, dietary fiber, essential fatty acids, and a variety of vitamins and minerals [18]. Its nutritional composition and functional properties make it suitable for a broad range of food applications, including baked goods, snacks, and other processed products. As demand for sustainable and nontraditional food sources grows, HF is gaining recognition as a versatile ingredient in the formulation of innovative, health-focused products [15,18,19]. Its inclusion can enhance the protein content, provide beneficial omega-3 and omega-6 fatty acids, and contribute a distinctive nutty flavor and darker color to baked items [15,18,19,20].
The primary objective of this study was to evaluate the effects of incorporating hemp flour (HF) into muffin formulations at varying levels, from 0% to 40%, using wheat flour (WF) and whole wheat flour (WWF) as base ingredients. The aim was to assess whether HF could enhance the nutritional profile of the muffins while preserving their sensory qualities and microbiological safety. By systematically substituting portions of the primary flours with HF, the study investigated its impact on key quality parameters, including texture, flavor, and overall consumer acceptability.
Following the initial hedonic sensory analysis and based on the results obtained, a series of detailed analyses was conducted on the prepared muffins containing 5% to 20% added hemp flour (HF). The analyses performed to assess various quality attributes were descriptive sensory analysis, texture and colour analyses, microbiological analysis (undertaken to ensure the safety and hygienic quality of the samples), physicochemical tests (moisture content, protein content, fiber content, sugar content and ash levels) were measured.
This multifaceted approach enabled a comprehensive evaluation of the nutritional, functional, and sensory properties of muffins enriched with hemp flour (HF). The findings aim to offer practical insights into the use of HF in bakery products, not only for improving nutritional value and consumer appeal but also for supporting sustainability goals. As a by-product of hemp oil extraction, HF represents an opportunity to reduce waste by repurposing materials that might otherwise be discarded. This dual focus—enhancing food formulations for health benefits while promoting resource efficiency—aligns with ongoing efforts to develop more sustainable and environmentally conscious food systems.
2. Results and Discussion
This study investigates the impact of HF on muffin quality through a comprehensive set of analyses. First, the preparation of samples is detailed, followed by a sensory evaluation, including hedonic analysis for overall acceptability and descriptive sensory analysis. The physical properties of the samples are assessed through texture and color measurements, microbiological analysis to examine the presence of yeast, molds, and Enterobacteriaceae, physicochemical analyses to determine key compositional parameters, including moisture, ash, fiber, protein, fat, and sugar content.
2.1. Sensory Analyses
2.1.1. Preferential (Hedonic) Sensory Analysis
The total acceptability of the muffins samples was obtained through the preferential (hedonic) sensory analysis which was performed using a 9-point scale (from 9 - I like it extremely to 1 - I dislike it extremely). This analysis was conducted with consumers, people not trained in sensory analysis, only for the samples with addition of HF.
Regarding the age categories participating in the study, five age groups ranging from 20 and over 60 years old, were identified. In terms of gender distribution, 26.5% of the participants were men and 73.5% were women. Figure 1 illustrates the age distribution of individuals who participated in the preferential (hedonic) sensory analysis.
It was observed that all five established age categories were represented, with the highest share of respondents falling within the 30-39 age category (29%). The analysis was performed in a bright room, around a table (Figure 2). The samples were randomly coded with 3 digits. The system is used to ensure an unbiased assessment and placed on white plates; each muffin cut into equal portions for evaluation.
To eliminate potential bias and prevent consumers from recognizing specific formulations, the samples were arranged randomly on the plates rather than in a sequential order. This randomized placement helps ensure that any observed differences in sensory perception are based solely on the product's characteristics rather than expectations or visual cues. Additionally, coded labels were used for sample identification, further reinforcing the objectivity of the analysis. This method aligns with best practices in sensory evaluation, allowing for a more accurate determination of consumer acceptability and preference for the different muffin formulations.
In order to determine the acceptability of the samples according to the concentration of hemp added, the consumers choose at the end for each group (samples with WF and samples with WWF, from the 6 samples only 4, in ascending order - from the one they liked the most to the one they liked the least). The results obtained are presented below, in Figure 3.
Based on the results of the sensory evaluation conducted with panelists, the most appreciated percentages of HF addition were 5%, 10%, 15% and 20%. These formulations received the highest hedonic ratings, indicating that they provided an optimal balance of overall acceptability. The results suggest that the incorporation of HF in varying concentrations had a significant influence on the sensory perception of the muffins, with specific concentrations being more favorable than others. The preference for these particular samples may be attributed to an enhanced texture, a balanced flavor profile, or an appealing color, factors that play a crucial role in consumer acceptability.
Based on the results of the sensory evaluation completed with panelists, for the WF samples, the most appreciated percentages of HF addition were 5%, 15%, 20% and 30%. These specific formulations achieved higher scores in terms of overall acceptability, indicating that the varying levels of HF affected key sensory attributes, including taste, texture, and appearance.
This study highlights the potential of HF as a valuable ingredient in bakery products, emphasizing the importance of selecting an optimal concentration to maintain desirable sensory properties. The results indicate that consumers responded positively to the incorporation of HF, even at higher concentrations, suggesting its viability as a functional ingredient. The preference for specific formulations indicates that the balance of flavours and textures played a crucial role in product desirability, likely due to enhanced moisture content, improved crumb structure, and a well-balanced flavour profile. These findings provide essential insights for future product development, offering guidance on optimizing formulations to appeal to a broader consumer market. Moreover, they underscore the significance of fine-tuning HF concentrations to enhance consumer satisfaction while ensuring product quality. As interest in alternative and functional ingredients continues to grow, this research offers valuable direction for manufacturers aiming to integrate HF into bakery formulations without compromising sensory appeal.
It can be seen from the results obtained that the use of WWF leads to a higher acceptability for samples with a higher concentration of HF. It was thus concluded that the acceptability of the samples is highest for concentrations of HF added between 5% and 20%, and that these formulations will be further analysed alongside the control samples made with WF and WWF to assess sensory attributes.
2.1.2. Descriptive Sensory Analysis
Based on the results of the sensory evaluation completed with panelists, for the WF samples, the most appreciated percentages of HF addition were 5%, 10%, 15% and 20%. In order to determine the consumers’ preference for the samples, a descriptive sensory analysis was performed. The evaluation of the organoleptic characteristics was conducted using a comparison method with unit scoring scales. A descriptive sensory analysis sheet has been made with important sensory attributes for this product. The sensory analysis was performed by a panel of trained evaluators, in the sensory analysis laboratory. The samples were coded and placed on white plates shortly before testing. A glass of water was provided with the samples for rinsing the mouth between samples.
The radar charts presented in Figure 4 illustrate the sensory profiles of the muffin samples with different concentrations of HF, based on a trained panel's evaluation. Each axis represents a distinct sensory attribute, and the data points reflect the intensity scores assigned by the consumers. The right chart (blue) corresponds to the formulation set of samples obtained with WF, while the left chart (green) represents the samples obtained with WWF.
A comparative analysis of the key sensory attributes—appearance, aroma, texture, taste, and overall acceptability—is presented below in Table 1 below.
Comparative sensory analysis highlights the impact of HF incorporation on the sensory characteristics of muffins. The WF samples generally showed greater variability in attributes such as aroma, taste, and overall acceptability, suggesting that the formulation of this group led to more distinct sensory differences among consumers. In contrast, the WWF samples demonstrated more uniformity in sensory ratings, particularly in aroma and overall acceptability, indicating a more consistent formulation.
These findings emphasize the importance of optimizing HF concentration to achieve a balance between sensory appeal and functional benefits. While moderate HF levels (5%–20%) appear to be well-accepted, further refinement may be required for higher concentrations to mitigate potential negative effects on texture and taste.
This analysis provides valuable insights into future product development, supporting the integration of HF into bakery formulations without compromising consumer satisfaction.
Sensory data were analyzed using XLSTAT (AHC and PCA) to identify sample groupings and assess variability in sensory perception. The results showed that muffins with 5% hemp flour were most similar to controls, while higher hemp additions (especially in whole wheat samples) led to notable sensory changes. PCA and AHC confirmed distinct clustering, with 20% HF showing the most deviation. Moderate hemp enrichment (up to 10–15%) may be optimal for consumer acceptability.
2.2. Physical Properties
2.2.1. Texture Measurements
The purpose of this study was to evaluate the impact of HF incorporation (5%-20%) on the textural properties of muffins made with WF (Type 650) and WWF. The texture parameters analyzed included firmness, elasticity, cohesiveness, and gumminess, as these attributes play a crucial role in consumer acceptability and product quality.
A comparative analysis was conducted between muffins formulated with WF and those made with WWF, to assess how the differences in flour composition interact with increasing HF concentrations. The study aimed to determine the optimal HF percentage that maintains desirable textural properties while improving the nutritional profile of the final product.
The following section presents the detailed results of texture profile analysis (TPA), highlighting the key trends observed across different formulations and providing insights into how HF affects the structure, chewability, and mechanical properties of muffins.
The results of the TPA for muffins with WF and WWF, incorporating 5% to 20% HF, are summarized in Table 2. The data includes key texture parameters such as firmness (indicates the resistance of the muffins to deformation, representing their hardness), elasticity (refers to the capacity of the muffins to recover their shape after being compressed), cohesiveness (measures the ability of the muffin structure to remain intact after compression), and gumminess (represents the energy required to chew the muffins until they are ready for swallowing), allowing for a direct comparison between formulations. These values highlight the structural differences caused by flour type and HF concentration, providing insights into the textural changes and their potential impact on product quality.
The TPA results demonstrate the significant impact of HF substitution (5–20%) on the textural attributes of muffins, particularly in terms of firmness, cohesiveness, elasticity, and gumminess. These parameters are essential in determining the sensory perception and structural integrity of the final product, with variations reflecting changes in the underlying composition and interactions between proteins, fibers and starches.
Firmness decreased by 35% (WF) and 22% (WWF) at 5% HF, indicating that small amounts of hemp flour soften the muffin matrix—likely due to reduced gluten strength and starch dilution. At 10% HF, firmness increased by 91% (WF) and 92% (WWF), suggesting the formation of a denser structure as fibers interact with starch and limit expansion. This reinforcing effect weakened at 15% HF, where firmness dropped again by 35% (WF) and 13% (WWF), potentially due to excess fiber disrupting the matrix. At 20% HF, firmness stabilized in WF but increased by 17% (WWF), reflecting inconsistent structural behavior at higher fiber levels.
Cohesiveness dropped by 40% (WF) at 5% HF, showing that initial fiber addition weakens internal binding, possibly due to gluten dilution. However, WWF showed a slight increase, indicating some compensatory fiber interactions in the whole wheat matrix. At 10% HF, cohesiveness improved by 50% (WF) but declined by 36% (WWF), suggesting an unstable balance between gluten weakening and fiber-starch interaction. At 15% and 20%, cohesiveness declined further in both cases, implying that higher fiber content disrupts the internal network and increases fragility.
Elasticity remained stable in WF but decreased by 54% (WWF) at 5% HF, showing that fiber has a greater impact on the springiness of whole wheat muffins. At 10% HF, elasticity slightly decreased in WF but increased by 20% (WWF), pointing to mixed effects of fiber on structure recovery. At 15%, elasticity dropped by 23% (WF) but rose modestly by 5% (WWF), and at 20%, it increased significantly by 102% (WF) while remaining stable in WWF. These shifts suggest that higher HF levels can sometimes stiffen the structure, improving spring-back in some cases, but reducing flexibility overall.
Gumminess decreased by 60% (WF) and increased slightly in WWF at 5% HF, indicating that muffins became softer and easier to break down. At 10% HF, gumminess increased by 132% (WF) and 52% (WWF), reflecting the formation of a more compact, chewier texture. At 15%, it dropped by 71% (WF) while staying relatively stable in WWF, and at 20%, gumminess showed high variability, decreasing by 206% (WF) and increasing by 11% (WWF). These results suggest that excessive HF causes inconsistent texture due to uneven fiber distribution and a weakened gluten network.
Textural data were analyzed using XLSTAT (AHC and PCA) to identify sample groupings and assess variability in texture of the samples. The results showed that muffins with up to 15% HF, especially in whole wheat formulations, had profiles similar to the white flour control. Higher additions (20% HF) and the WWF control differed significantly, likely due to increased fiber. The 15% HF in WF sample stood out with a distinct texture, suggesting unique structural effects.
2.2.2. Color Measurements
Color is a key quality attribute in bakery products, influencing consumer perception and acceptability. The addition of HF to muffins is expected to induce color changes, depending on the concentration used and the interaction with WF or WWF. These changes occur due to the natural pigments present in HF, such as chlorophyll, polyphenols, and Maillard reaction products, which contribute to variations in lightness (L) - represents the brightness of the sample, with higher values indicating lighter muffins, redness (a*) - red-green axis determines the intensity of red or green hues, with positive values indicating redness and negative values indicating greenness, and yellowness (b*) - yellow-blue axis reflects the balance between yellow and blue tones, with positive values indicating more yellow shades.
The following section presents the color analysis results, highlighting the impact of HF concentration on the visual characteristics of muffins. This evaluation is essential in understanding consumer preferences and optimizing formulations to maintain desirable color properties while incorporating nutritional benefits from HF.
For WF muffins, lightness (L*) decreased from 72.54 (control) to 46.49 (20% HF), indicating a progressive darkening due to hemp pigments, polyphenols, and intensified Maillard reactions; redness (a*) dropped from 5.76 (control) to 3.34 (15% HF), then slightly increased to 3.57 (20%), suggesting a shift toward more neutral tones; yellowness (b*) declined consistently from 37.48 (control) to 23.90 (20% HF), showing a loss of yellow hue as HF concentration increased.
For WWF muffins, L* decreased from 59.93 (control) to 43.40 (20% HF), confirming the darkening trend; redness (a*) dropped from 6.73 to 4.68, with the most notable decline between 10% and 20% HF; yellowness (b*) initially rose at 5% HF (24.20), then decreased to 20.16 (20% HF), indicating that small HF additions can enhance yellow tones, but higher levels reduce color vibrancy.
The standard deviation for all samples analyzed, values for L, a*, and b* are generally low, indicating that the color measurements are consistent and reproducible. For samples with WF higher variability in a* and b* at 5% and 10% HF suggests that minor inconsistencies in pigment distribution may occur at lower concentrations. For samples with WWF at 20% HF, L and b* have higher standard deviations, suggesting greater color variation at high HF levels.
The following figure illustrates the impact of increasing HF levels on the color attributes of both formulations, highlighting the progressive darkening (lower L values), the reduction in red tones (a*), and the variation in yellow hues (b*). These findings are crucial in understanding the visual appeal and marketability of hemp-enriched bakery products.
Figure 5.
Effect of HF addition on the color parameters (L, a, b*) of muffins made with WF and WWF.
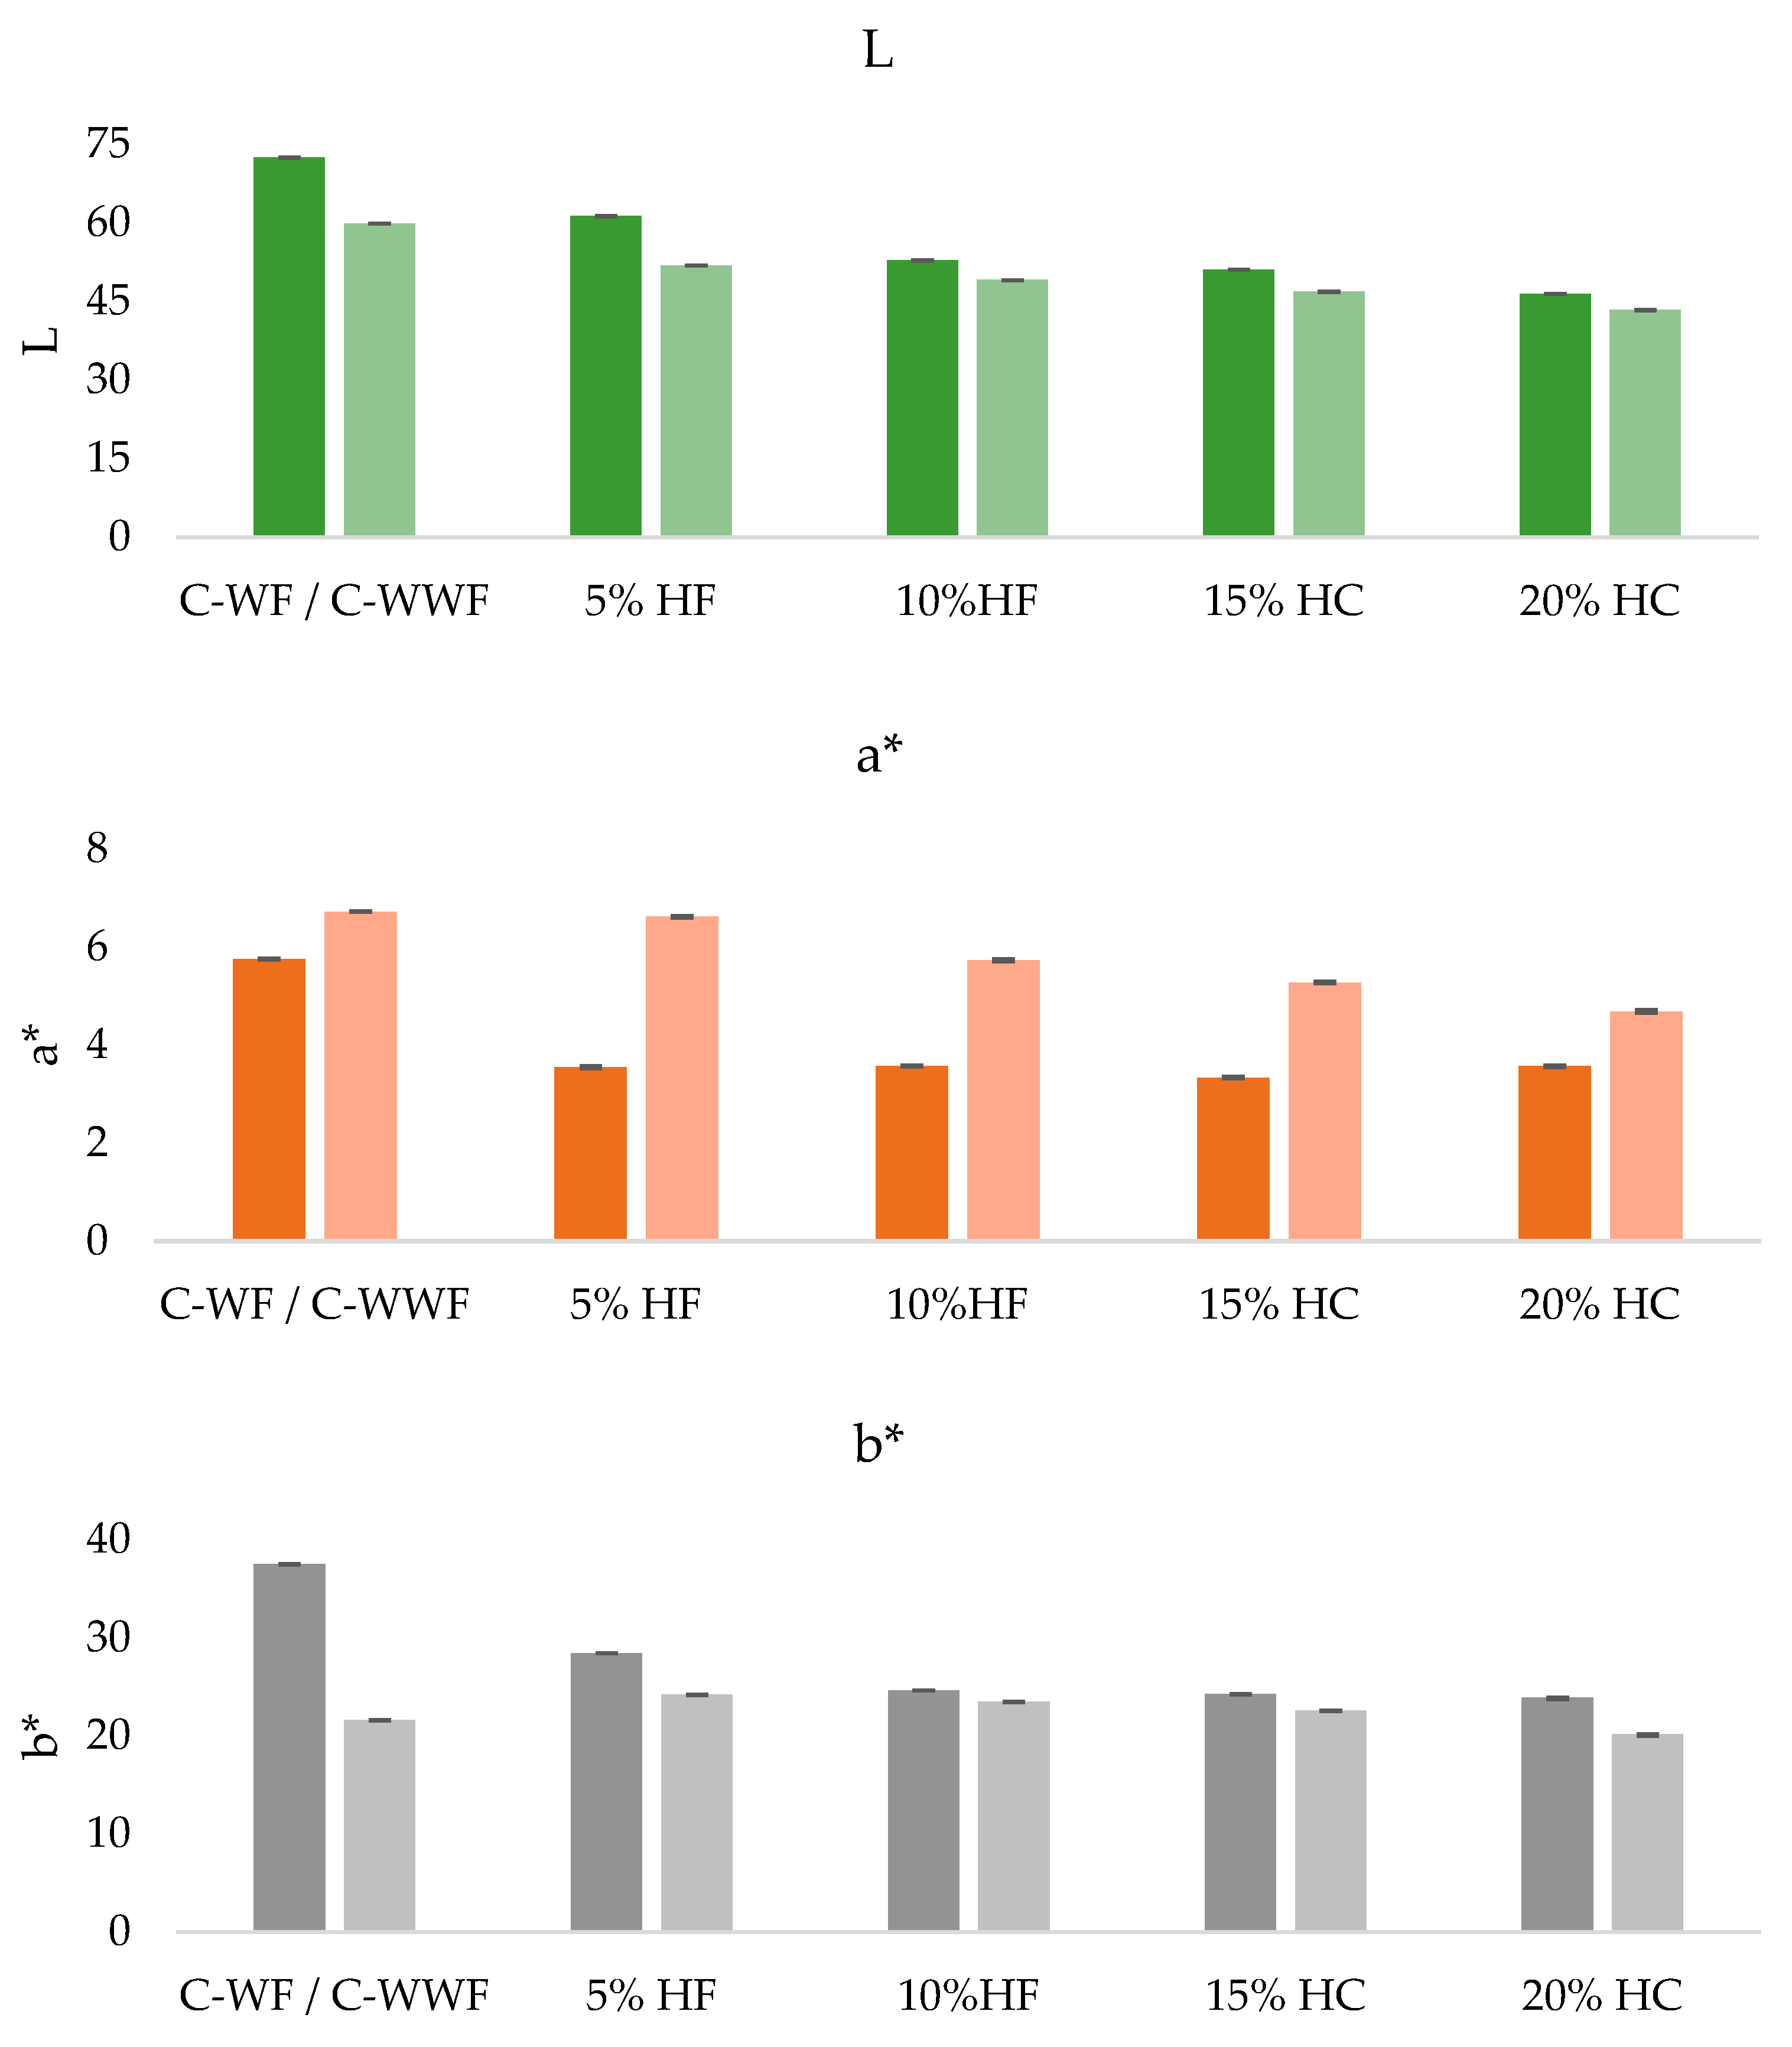
Lightness (L*) decreased progressively in both WF and WWF muffins as hemp flour (HF) concentration increased, confirming a clear darkening effect. WF muffins showed a more pronounced change in brightness compared to WWF muffins, indicating that HF has a stronger visual impact on white flour-based formulations. Whole wheat muffins started darker and remained darker across all HF levels due to their naturally lower lightness.
Redness (a*) declined with increasing HF in both formulations, indicating a shift toward more neutral brown tones. The reduction was sharper in WF muffins, where redness dropped quickly and then stabilized. In contrast, WWF muffins showed a gradual and continuous decrease, retaining slightly more red tones throughout.
Yellowness (b*) also decreased with higher HF levels, indicating a fading of yellow hues. In WF muffins, the decline was consistent, while in WWF muffins, a slight initial increase was observed at low HF concentrations before the values declined. This suggests that low HF levels may briefly enhance yellow tones in whole wheat formulations before higher concentrations dull the color.
Overall, increasing HF led to darker, less vibrant muffins in both types, with more noticeable shifts in the WF samples. These color changes are likely influenced by hemp pigments, polyphenols, and Maillard reactions, and may affect consumer perception depending on expected visual cues for fiber-rich or wholegrain products.
Data obtained were analyzed using XLSTAT (AHC and PCA) to identify sample groupings and assess variability in color of the samples. Color analysis showed that increasing HF levels led to perceptible darkening of muffins, especially in WWF formulations. PCA and AHC grouped high-hemp samples together, while control and low-hemp samples (especially C-WF and 5% HF) remained distinct. These findings confirm the visual impact of hemp addition on product appearance.
2.3. Microbiology Analysis
Microbiological analysis focused on the detection of yeasts, molds, and Enterobacteriaceae to assess the hygienic quality of the muffins, in accordance with food safety standards (e.g., Regulation (EC) No 2073/2005). Yeasts and molds are spoilage fungi capable of growing in bakery products under low-moisture conditions, with yeasts fermenting sugars and molds potentially producing mycotoxins during storage.
The presence of yeasts and molds in bakery products is a critical indicator of microbiological stability and shelf life. These microorganisms can develop due to moisture content, ingredient composition, and storage conditions, potentially affecting product safety and quality. Given that HF is rich in fiber, protein, and bioactive compounds, it is essential to evaluate whether its incorporation influences the microbial load in muffins.
In this study, the number of yeasts and molds was determined for muffins formulated with WF and WWF, with HF concentrations ranging from 5% to 20%. This analysis provides insights into whether HF addition affects microbial growth, which is crucial for establishing optimal storage conditions and product safety parameters. The results are presented in the following section, highlighting potential differences between formulations and the microbiological stability of hemp-enriched muffins (Table 3.)
The results indicate that all samples, including the control formulations and hemp-enriched muffins, recorded yeast and mold counts below 10 CFU/g, which is within acceptable microbiological limits for bakery products. These findings suggest that the inclusion of HF does not promote microbial growth, maintaining the microbiological quality of the muffins [21].
The absence of significant yeast and mold growth across all formulations highlights the stability of HF-enriched muffins, confirming their suitability for consumption under proper storage conditions. These results are crucial for product development, as they suggest that HF does not compromise the microbiological safety of the final product.
The table below (Table 4.) presents the microbiological evaluation of Enterobacteriaceae contamination in muffins formulated with WF and WWF, incorporating HF at concentrations of 5%, 10%, 15%, and 20%. The analysis focused on detecting Enterobacteriaceae colony-forming units (CFU/g) to assess the hygienic quality and safety of the muffins.
The results indicate that all samples, including both control formulations and hemp-enriched muffins, did not contain Enterobacteriaceae, ensuring that the production process maintained proper hygiene and safety standards.
The absence of Enterobacteriaceae in all samples reinforces the microbiological stability of the HF formulations, demonstrating that HF does not contribute to bacterial growth. These results are essential for ensuring the safety and shelf life of hemp-enriched muffins, making them suitable for consumer consumption under appropriate storage conditions.
2.4. Physicochemical Analyses
The physicochemical composition of bakery products plays a crucial role in determining their nutritional value, texture, and overall quality. The incorporation of HF into muffins is expected to influence key parameters, including moisture content, ash content, total fiber, protein, fat, and sugar levels, thereby affecting both functional and sensory properties.
In this study, physicochemical analyses were conducted on muffins formulated with WF and WWF, with HF concentrations ranging from 5% to 20%. These analyses provide a comprehensive understanding of how HF impacts the composition of muffins, offering insights into potential nutritional improvements and formulation adjustments required for product optimization.
Moisture content is essential for product freshness and shelf stability, as it affects microbial growth and texture. Ash content represents the total mineral content, reflecting the presence of essential micronutrients. Total fiber content is a key nutritional factor, with HF contributing additional dietary fiber, which is beneficial for digestion and overall health. Protein content influences the structural and nutritional quality of the muffins, with HF being a high-protein ingredient. Fat content contributes to texture, mouthfeel, and energy value, with variations depending on the ingredient composition. Sugar content affects the perception of sweetness and caramelization reactions, which in turn impact flavor and color.
The following table (Table 5.) presents the results of these physicochemical analyses, highlighting the impact of HF on the nutritional profile and quality characteristics of the muffins.
The physicochemical properties of muffins varied significantly with the addition of HF.
Moisture content exhibited a clear decreasing trend with increasing levels of hemp flour (HF). The highest value was observed in the control sample containing only wheat flour (C-WF), at 17.59%, while the lowest moisture content, 10.76%, was recorded in the sample with 20% HF substitution in the whole wheat formulation (C-WWF), representing a 38.8% reduction. This decline is primarily attributed to the high dietary fiber content of HF—particularly cellulose, hemicellulose, and lignin—which have strong water-binding capacities, thereby reducing the amount of free water available in the muffin matrix. Furthermore, the partial replacement of wheat flour with HF weakens the gluten network, diminishing its ability to retain moisture and resulting in a firmer, drier crumb texture.
Ash content, indicative of the total mineral concentration in the muffins, increased consistently with higher levels of hemp flour (HF) incorporation, rising from 0.95% in the control sample (C-WF) to 1.67% in the 20% HF sample (C-WWF), representing a 75.8% increase. This trend is attributed to the naturally high mineral content of HF, which is particularly rich in essential minerals, including calcium, magnesium, phosphorus, potassium, and iron. From a nutritional perspective, this increase is advantageous, as these minerals contribute to critical physiological functions, including bone health, enzymatic activity, and muscle function.
Crude fiber content showed the most significant increase among the parameters analyzed, rising from 2.79% in the control sample (C-WF) to 7.59% in the 20% HF formulation (C-WWF), representing a 172% improvement. This substantial enhancement highlights hemp flour’s (HF) effectiveness as a valuable source of dietary fiber. HF contains both insoluble fibers (such as cellulose and lignin) and soluble fibers (including pectins and gums), which contribute to digestive health while also influencing water absorption, gel formation, and viscosity within the food matrix. The high fiber content can also affect the texture of muffins, often increase density and reduce tenderness, which may, in turn, influence sensory acceptability.
Protein content increased steadily with the incorporation of hemp flour (HF), rising from 6.89% in the control sample (C-WF) to 9.95% in the 20% HF formulation (C-WWF), reflecting a 44.4% improvement. This trend is consistent with the naturally high protein content of HF, which is composed primarily of edestin and albumin—two highly digestible storage proteins. These proteins provide essential amino acids such as arginine, lysine, and methionine, contributing to the nutritional value of HF as a plant-based alternative to wheat flour (WF). However, unlike gluten proteins (gliadin and glutenin), hemp proteins lack strong elastic and cohesive properties, which may negatively affect the structural integrity of the muffins by limiting gas retention and reducing volume expansion during baking.
In contrast to other nutritional parameters, fat content remained relatively stable across all samples, fluctuating between 26.08% in the 5% HF formulation (C-WF) and 27.41% in the control sample, with a maximum variation of only 5.1%. This suggests that the partial replacement of wheat flour (WF) with hemp flour (HF) did not significantly alter the overall lipid content of the muffins. Although HF is known for its high concentration of polyunsaturated fatty acids (PUFAs), particularly omega-3 (α-linolenic acid) and omega-6 (linoleic acid), the relatively unchanged fat content indicates consistent lipid retention during baking. The minor variations observed are likely due to the distribution of lipids within the flour matrix and potential interactions with fiber and protein components.
Sugar content exhibited minor fluctuations across the formulations, peaking at 39.95% in the 5% HF sample (C-WF) and reaching a minimum of 27.76% in the 5% HF whole wheat formulation (C-WWF), corresponding to a 30.5% decrease at the lowest value. This variation follows a pattern of initial increase at low HF concentrations, followed by a gradual decline as HF levels rise. These changes may be attributed to interactions between dietary fiber and sugars, as fiber can influence sugar solubility, delay sugar release, and interfere with Maillard reaction dynamics during baking. Additionally, higher fiber content may lead to increased water absorption, which in turn reduces the dissolution and availability of sugars in the final product.
Overall, the incorporation of hemp flour (HF) significantly improved the nutritional profile of muffins by increasing their fiber, protein, and mineral content. These enhancements are primarily attributed to the chemical composition of HF—its high dietary fiber promotes water absorption, its proteins affect gluten functionality, and its mineral richness elevates ash content. However, these nutritional gains are accompanied by a reduction in moisture content, which can negatively influence textural and sensory properties by increasing density and reducing tenderness. Therefore, careful formulation adjustments are necessary to mitigate these effects and ensure that the final product remains acceptable in terms of both texture and palatability.
Data obtained were analyzed using XLSTAT (AHC and PCA) to identify sample groupings and assess variability in physicochemical properties of the samples. The results obtained showed clear differences between control and hemp-enriched muffins. PCA and AHC revealed that higher HF additions (15–20%) significantly increased protein, fiber, and ash content, especially in WWF formulations. Control and low-hemp samples clustered separately, confirming the nutritional enhancement from HF.
3. Materials and Methods
3.1. Preparation of Samples
The muffin samples were prepared using two different base formulations: one with refined WF and another with WWF. In both cases, partial substitution with HF was applied at varying concentrations (5%, 10%, 15%, 20%, 30% and 40%). The control samples contained only the respective base flour (wheat or whole wheat), while the experimental samples incorporated the designated percentages of HF.
The ingredients used in the formulation included flour (wheat or whole wheat), sugar, eggs, butter (82% fat), baking soda, and flavour. The preparation process began with creaming the butter and sugar until a homogeneous paste was obtained. The eggs were then incorporated one at a time, ensuring thorough mixing after each addition, followed by the flavour. Finally, the pre-mixed dry ingredients, consisting of flour and baking soda, were gradually added to the wet mixture, and the batter was mixed until a uniform consistency was achieved. The presentation of preparing the muffins is in Figure 6.
The batter prepared in the specific formulations presented in Table 6 was weighed in 48 grams portions into paper molds and baked in silicon shapes at 190°C for 35 minutes.
After baking, the muffins were allowed to cool at room temperature before being stored under controlled conditions for subsequent analyses. Each sample was packed individually in sealed plastic bags. Each experimental product was tested in two replicates.
Figure 7 provides a visual representation of the muffin samples, both in their whole form and in cross-section, for each concentration of HF. This visual comparison allows for an initial qualitative assessment of the effects of HF incorporation on the overall appearance, internal structure, and crumb texture of the muffins. Differences in color, porosity, and uniformity between the control samples and those with increasing levels of HF are observable, highlighting potential changes in the physical characteristics of the final product. These images serve as a preliminary reference for further analyses, including texture measurements and sensory evaluation, which aim to quantify and describe the impact of HF addition on muffin quality.
3.2. Analyses performed.
3.2.1. Preferential (Hedonic) Sensory Analysis
The hedonic analysis was conducted to assess the total acceptability of muffins formulated with WF and WWF, incorporating different levels of HF (5%, 10%, 15%, 20%, 30%, and 40%). This test aimed to determine consumer preference for the muffins based on overall liking, without analyzing specific sensory attributes in detail.
As part of this study, participants’ age data were collected to ensure eligibility and to analyze potential age-related trends in the results. Age is treated as personal data under Regulation (EU) 2016/679 (General Data Protection Regulation – GDPR) and is processed lawfully, fairly, and transparently.
In accordance with GDPR Article 6(1)(a), participants provided explicit informed consent for the collection and use of their age information. Only data strictly necessary for the purpose of this study were collected, in line with the principle of data minimization (Article 5(1)(c)). Age data were stored securely and anonymized during analysis to protect participant confidentiality.
A group of untrained consumers participated in the study, representing potential target consumers for hemp-enriched muffins. The evaluation was conducted under controlled conditions to minimize external influences on perception. Each participant was asked to assess overall acceptability using a 9-point hedonic scale, where: 9=Like extremely, 5=Neither like nor dislike and 1=Dislike extremely [22,23,24,25,26]. Participants were not given additional details about the formulation to prevent bias or preconceptions from influencing the results.
The muffins were prepared using standardized baking conditions, ensuring consistency across all formulations. Samples were coded with randomized three-digit numbers and were presented in a random order to prevent positional effects or preference biases: the samples were served at room temperature on neutral white plates to avoid visual bias from dishware color; the portion size was uniform to ensure an equal evaluation of texture, taste, and mouthfeel and participants were instructed to rinse their palate with water between samples to prevent taste carryover effects.
3.2.2. Descriptive Sensory Analysis
The descriptive sensory analysis was conducted to characterize the sensory profile of muffins formulated with WF and WWF, incorporating different levels of HF (5%, 10%, 15%, 20%). Unlike the hedonic test, which focused on consumer preference, this analysis aimed to quantify specific sensory attributes using a trained panel of evaluators.
This study was conducted in accordance with the General Data Protection Regulation (EU) 2016/679 (GDPR). All participants involved in the sensory analysis provided informed consent after being fully briefed on the study’s purpose, procedures, and data handling practices. Personal data, such as age and sensory preference scores, were collected solely for research purposes and were anonymized prior to analysis to ensure participant confidentiality. Data collection adhered to the principles of data minimization and purpose limitation (Article 5), and no data was shared outside the research team. For participants under the legal age of consent, written parental or guardian consent was obtained in accordance with Article 8 of the GDPR.
The evaluation was conducted in a controlled sensory analysis laboratory by a trained panel of assessors who had undergone prior sensory training to ensure consistency and accuracy in evaluations. The panel consisted of trained individuals experienced in identifying and quantifying sensory attributes. Training sessions were conducted before the evaluation to familiarize the panel with the specific attributes and the rating scale used. Each panelist evaluated the muffins based on a structured sensory analysis method, using a numerical intensity scale to assess each attribute.
The muffins were prepared under standardized conditions to maintain consistency across samples. To ensure unbiased evaluation, the following protocols were followed:
- Blind coding: Samples were labeled with randomized three-digit codes to eliminate bias.
- Randomized presentation: Samples were served in a random order to prevent order effects influencing judgments.
- Controlled environment: The evaluations took place in individual sensory booths under neutral lighting to avoid visual bias.
- Portion size: Uniform-sized muffin pieces were provided to ensure equal exposure to texture and flavor attributes.
- Palate cleansing: Consumers were instructed to rinse their mouths with water between samples to reset taste perception.
The trained panel evaluated the muffins based on key sensory attributes, including exterior appearance (crust color), interior appearance (core color, crust thickness, core texture, pore structure), core texture (elasticity), flavor (baked product, hemp intensity), first bite (firmness, cohesiveness, moisture), taste and flavor (bitter taste, sweet taste, flavor, astringent taste, lubricity) and after taste. Each attribute was rated using a structured intensity scale, where higher values indicated stronger perceived intensities [27,28].
3.2.3. Texture Analysis
The texture analysis was performed to evaluate the mechanical properties of samples obtained. The goal of this analysis was to quantify textural changes induced by HF addition using instrumental texture profile analysis (TPA), providing objective data on the muffins' firmness, cohesiveness, elasticity, and gumminess.
Texture analysis was conducted using an INSTRON 5944 Texture Analyzer (USA), equipped with a load cell appropriate for food texture measurements. The samples underwent a double compression cycle to simulate chewing behavior, commonly referred to as Texture Profile Analysis (TPA).
Each sample was placed on the testing platform and compressed twice to simulate the first and second bite, measuring key texture attributes.
Samples were prepared under controlled baking conditions to ensure uniformity across samples. Samples were tested at room temperature (20 ± 1°C) to eliminate temperature-related variations in texture. Each formulation (control and HF -enriched samples) was analyzed in triplicate, and mean values were recorded.
The following TPA parameters were recorded and analyzed:
- Firmness (N): Maximum force required to compress the sample, indicating hardness.
- Cohesiveness: The ratio of the second compression peak to the first, reflecting the structural integrity of the muffin crumb.
- Elasticity (Springiness): The ability of the muffin to return to its original shape after compression.
- Gumminess (N): The product of firmness and cohesiveness, representing the energy required to chew the muffin [29].
The values obtained from these parameters provided insights into how HF impacts the mechanical structure of the muffins, affecting consumer perception and mouthfeel.
All texture measurements were recorded using Instron Bluehill software, and data were processed to calculate mean values and standard deviations. Results were visualized using graphs to compare textural changes across formulations, highlighting trends in firmness, cohesiveness, elasticity, and gumminess.
3.2.4. Color Analysis
The color analysis was conducted to assess the impact of HF incorporation (5%-20%) on the visual appearance of muffins formulated with WF and WWF. The objective was to quantify color differences caused by varying HF concentrations using the CIE Lab color system, which provides an objective measure of lightness (L), redness (a*), and yellowness (b*).
The color measurements were performed using a colorimeter/spectrophotometer (CM-5) calibrated with a white standard reference before each test to ensure accuracy. The muffins were analyzed under standardized lighting conditions to minimize external influences on color perception [30].
Instrument settings: measurement system: CIE Lab* color space, illuminant: D65 standard daylight, observer angle: 10°, measurement mode: reflectance, aperture size: Appropriate for muffin crumb surface. The colorimeter measured each muffin's crumb color, as it is more representative of the overall composition and uniformity than the crust.
Muffins were prepared under controlled baking conditions to ensure uniformity. Each muffin was cut in half, and measurements were taken from the crumb surface to avoid variations caused by the crust. Three different points on the muffin crumb were measured, and the average value was recorded to minimize variability. All color measurements were taken at room temperature (20 ± 1°C) to ensure consistency.
The CIE Lab* system was used to quantify color changes objectively: L (Lightness): represents brightness, with higher values indicating lighter muffins and lower values indicating darker muffins; a* (Red-Green Axis):* Measures redness (positive values) or greenness (negative values); b* (Yellow-Blue Axis): represents yellowness (positive values) or blueness (negative values). By analysing these parameters, the effects of HF concentration on muffin colour could be quantified and compared across formulations.
Each sample was measured ten times, and mean values were calculated. The results were graphically represented, highlighting trends in L, a, and b* values** as HF concentration increased. The correlation between color changes and sensory acceptability was also considered.
3.2.5. Microbiological Analysis
The microbiological analysis was conducted to assess the safety and hygiene of muffins formulated with WF and WWF, incorporating different levels of HF (5%, 10%, 15%, and 20%). The primary focus was on quantifying the presence of yeasts, molds, and Enterobacteriaceae, which are key indicators of microbial contamination and product stability.
This analysis aimed to determine whether the addition of HF influences microbial growth, ensuring that the muffins meet microbiological safety standards for bakery products.
Samples were prepared under controlled baking and hygienic conditions to minimize external contamination and were analyzed immediately after baking to assess the initial microbial load. Sterile conditions were maintained during sample preparation to prevent cross-contamination. A homogenized suspension was prepared by mixing 10 g of the muffin sample in 90 mL of sterile saline solution (0.9% NaCl) for microbial testing.
Microbiological evaluation was performed using standardized culture-based methods for the detection and quantification of yeast and molds and Enterobacteriaceae. Yeasts and mold counts were performed using the horizontal spread-plate method on DG-18 agar at 25 °C for 5–7 days (ISO 21527-2:2008) [21]. Enterobacteriaceae enumeration was conducted on Violet Red Bile Glucose Agar (VRBGA) at 37 °C for 24 ± 2 hours (ISO 21528-2:2004) [31]. All samples were analyzed in triplicate, and microbial counts were expressed as colony-forming units per gram (CFU/g), with <10 CFU/g recorded if below the detection limit [21,31].
3.2.6. Physicochemical Analyses
All reagents utilized in the analyses were procured from Merck and conformed to the respective analytical standards. Merck's analytical reagents are specified according to the American Chemical Society (ACS) standards and the European Pharmacopoeia (Reag. Ph Eur.), ensuring high purity and suitability for precise analytical applications.
Moisture was measured following SR 90:2007 (item 11) for bakery products, with reference to the European SR EN 712:2010 method—a Romanian adoption of ISO 712:2009, which outlines a thermogravimetric reference method for moisture analysis in cereals and cereal products [32,33].
Using a HE73 thermobalance, ~2 mm layers of the sample were dried at 130 °C. The instrument's “AUTO” mode ended the process when weight changes were ≤ 0.002 g over 30 s. Each sample was analyzed in duplicate (2 technical replicates), and the reported moisture content (to two decimal places) was the mean of both runs.
Ash content was measured according to SR 90:2007 (item 21) and SR 91:2007 (item 16). Moisture content was first assessed: samples with moisture < 7% or > 13% were preconditioned by drying for 90 min to ensure consistency. After cooling in a desiccator, crucibles were weighed immediately (±0.0001 g) to minimize moisture uptake. Samples were run in duplicate, and ash was expressed as a percentage of dry weight. This closely follows ISO 2171:2007/2023 (“Determination of ash yield by incineration”), including the use of high-precision crucibles, pre-ashing ignition with ethanol, 900 °C rated materials, desiccation, duplicate analyses, and result expression to ±0.01% [34].
Crude fiber content was determined per SR EN ISO 6865:2002, involving acid–alkaline digestion and gravimetric analysis of the residue. Samples with > 15 % fat were defatted with petroleum ether, and moisture corrections were applied. Ground samples (≤ 1 mm) of ~1 g (±0.0001 g) were digested in boiling dilute H₂SO₄ (~0.13 M) to hydrolyze starches, rinsed, then cooked in dilute NaOH (~0.23 M) to remove proteins and non-fiber components, with intervening rinses. The residue was dried at 105 °C (≥ 4 h), cooled, weighed, calcinated at 600 °C (4 h), and reweighed; a blank FiberBag was processed in parallel. Analyses were performed in duplicate, and crude fiber content was expressed as a percentage of total dry weight [35].
Crude protein was quantified using the Kjeldahl method as per SR 90:2007 (item 18) and SR 91:2007 (item 12), with a modification in the titration step — 0.1 N HCl replaced sulfuric acid. Sample preparation followed SR EN ISO 20483:2014, which mandates grinding ≥200 g of product to pass a 0.8 mm sieve and pre-drying subsamples at 130 °C when moisture exceeds 16 % for accurate analysis [36]. Analyses were performed in duplicate, and results were averaged provided the difference did not exceed 0.5 g crude protein per 100 g.
Total sugars were measured according to SR 91:2007 (item 13.2), involving sucrose hydrolysis and titration of reducing sugars with Fehling’s reagent. Approximately 300 g of core sample was dried (50–60 °C for 6–8 h), milled to 0.5 mm, then extracted with 150 mL hot water, clarified using potassium ferrocyanide and zinc sulfate, and hydrolyzed with 20 % HCl at ~70 °C. The hydrolysate was neutralized and titrated with Fehling’s A and B, with subsequent iodine release titrated via 0.1 N sodium thiosulfate using a starch endpoint — a method consistent with classic Fehling/Lane–Eynon protocols. Duplicate analyses were conducted, and the mean sugar content was calculated, allowing up to a 0.2 g/100 g dry weight difference between replicates [37,38].
Fat content was measured following SR 91:2007 (item 14) using solvent extraction with petroleum ether. The sample core was finely chopped, oven-dried at 50–60 °C for 6–8 h, then milled to pass a 0.5 mm sieve and stored under ambient conditions. For each analysis, 5 g of prepared sample was weighed into a folded filter paper, placed in an extraction cartridge, and subjected to Soxhlet-type extraction: initially immersed in boiling petroleum ether (40–65 °C) at 165 °C for 40 min, followed by 150 min of continuous reflux, 15 min of solvent recovery, and a final 10 min drying to remove residual solvent. Post-extraction, fat cups were cooled in a desiccator and weighed gravimetrically to determine fat content [38,39]. Each sample was analyzed in duplicate, with the mean reported. Acceptable replication precision was set at ≤ 0.3 g fat/100 g dry matter when total fat ≤ 10 %, and ≤ 0.5 g/100 g when fat > 10 %.
4. Conclusions
This study highlights the potential of hemp flour (HF) as a valuable ingredient for developing nutritionally enriched muffins. Gradual substitution of wheat flour (WF) with HF at levels ranging from 5% to 40% led to notable improvements in nutritional composition, particularly in dietary fiber, which increased by over 170% at 20% HF. Protein and ash contents also rose proportionally, reflecting the high nutrient density of HF.
Physicochemical analysis showed a consistent decrease in moisture content with increasing HF levels, likely due to the strong water-binding capacity of dietary fibers such as cellulose, hemicellulose, and lignin. These changes, combined with a weakened gluten network, contributed to firmer textures and darker crumb color at higher substitution rates.
Microbiological evaluation confirmed that all muffin samples met safety standards, with no significant growth of harmful microorganisms. Standard hygienic and baking practices effectively preserved microbial stability throughout production.
Sensory analysis indicated that muffins with up to 15% HF maintained acceptable organoleptic qualities. Higher substitution levels (20% and above), though nutritionally advantageous, resulted in denser texture, darker appearance, and a more pronounced hemp flavor, which contributed to reduced sensory scores. Nevertheless, some panelists appreciated the nutty aroma and enhanced satiety associated with higher HF content.
In conclusion, HF presents clear benefits as a sustainable, plant-based alternative in bakery applications. It supports the development of functional food products with improved levels of protein, fiber, and minerals. However, achieving broad consumer acceptance requires careful optimization of formulation. Future research could focus on strategies for flavor balancing, moisture retention, and extended sensory testing across diverse consumer groups to further refine and commercialize HF-enriched baked goods.
Author Contributions
Conceptualization, A.-L.M.; methodology, A.-L.M..; investigation: A.-L.M., C.-A.S., E.-L.U., G.M., G.C-S., A.A.D., C.-B.P., Ș.E.C., S.-A.B., C.F., B.M.N.; formal analysis, A.-L.M., G.C-S., A.A.D., S.-A.B., C.F., B.M.N.; resources, A.-L.M., G.C-S., A.A.D., C.-B.P., Ș.E.C., S.-A.B., C.F., B.M.N.; data curation, A.-L.M., C.-A.S., E.-L.U., G.M.; software, C.-B.P.; writing-original draft preparation, A.-L.M., C.-A.S., writing-review and editing, A.-L.M., G.C-S., E.-L.U., G.M., R.S., A.A.D.; visualization, A.-L.M., C.-B.P., supervision, R.S., G.M.; project administration, R.S.
Funding
This research received no external funding
Institutional Review Board Statement
Not applicable
Informed Consent Statement
Informed consent was obtained from all subjects involved in the study.
Conflicts of Interest
The authors declare no conflicts of interest.
Abbreviations
WF – wheat flour; WWF – whole wheat flour; HF – hemp flour.
References
- Crocq, M.-A. History of cannabis and the endocannabinoid system. Dialogues Clin. Neurosci. 2020, 22, 223–228. [Google Scholar] [CrossRef] [PubMed]
- Cvijic, A.; Bauer, B. History and medicinal properties of cannabis. Phcog. Rev. 2024, 18, 159–164. [Google Scholar] [CrossRef]
- Farinon B., Molinari R., Costantini L., Merendino N. The seed of industrial hemp (Cannabis sativa L.): nutritional quality and potential functionality for human health and nutrition. Nutr., 2020, 12, 1-59. [CrossRef]
- Iftikhar, A. , Zafar U, Ahmed W., Shabbir M.A., Sameen A., Sahar A., Bhat Z.F., Kowalczewski P.L., Jarzebski M., Aadil R.M. Applications of cannabis sativa L. in food and its therapeutic potential: from a prohibited drug to a nutritional supplement, Mol. 2021, 26, 1–21. [Google Scholar] [CrossRef]
- Schanknecht, E.; Bachari, A.; Nassar, N.; Piva, T.; Mantri, N. Phytochemical constituents and derivatives of cannabis sativa; bridging the gap in melanoma treatment. Int. J. Mol. Sci. 2023, 24, 859. [Google Scholar] [CrossRef] [PubMed]
- Xu, J.; Bai, M.; Song, H.; Yang, L.; Zhu, D.; Liu, H. Hemp (Cannabis sativa subsp. sativa) Chemical Composition and the Application of Hempseeds in Food Formulations. Plant Foods Hum. Nutr. 2022, 77, 355–365. [CrossRef]
- Fike, J. Industrial hemp: renewed opportunities for an ancient crop. Crit. Rev. Plant Sci. 2016, 35, 406–424. [Google Scholar] [CrossRef]
- Rupasinghe, H.P.V.; Davis, A.; Kumar, S.K.; Murray; B.; Zheljazkov, V.D. Industrial hemp (Cannabis sativa subsp. sativa) as an emerging source for value-added functional food ingredients and nutraceuticals. Mol. 2020, 25, 4078. [CrossRef]
- Naeem, M.Y.; Corbo, F.; Crupi, P.; Clodoveo, M.L. Hemp: An Alternative Source for Various Industries and an Emerging Tool for Functional Food and Pharmaceutical Sectors. Processes. 2023, 11(3), 718. [Google Scholar] [CrossRef]
- Raihan, A; Bijoy, T. R. A review of the industrial use and global sustainability of Cannabis sativa. Glob. Sust. Res. 2023, 2, 1–29. [Google Scholar] [CrossRef]
- Burton, R.A.; Andres, M.; Cole, M.; Cowley, J.M.; Augustin, M.A. Industrial hemp seed: from the field to value-added food ingredients. J. Cannabis Res. 2022, 4, 45. [Google Scholar] [CrossRef] [PubMed]
- Strzelczyk, M.; Lochynska, M.; Chudy, M. Systematics and Botanical Characteristics of Industrial Hemp Cannabis sativa L. J. Nat. Fibers. 2021, 19, 5804–5826. [Google Scholar] [CrossRef]
- Michels, M; Brinkmann, A; Mußhoff, O. Economic, ecological and social perspectives of industrial hemp cultivation in Germany: a qualitative analysis. J. Environ. Manage. 2025, 389, 126117. [CrossRef]
- Basak, M.; Broadway, M.; Lewis, J.; Starkey, H.; Bloomquist, M.; Peszlen, I.; Davis, J.; Lucia, L.A.; Pal, L. A critical review of industrial fiber hemp anatomy, agronomic practices, and valorization into sustainable bioproducts. BioResources 2025, 20, 5030–5070. [Google Scholar] [CrossRef]
- Hayit, F.; Balıkcı, E.; Yazıcı, L.; Beşcanlar, S. Investigation of the usability of hemp flour in the production of gluten-free cakes. J. Culin. Sci. Technol. 2024, 22, e2357282. [Google Scholar] [CrossRef]
- Korus, J.; Witczak, M.; Ziobro, R.; Juszczak, L. Hemp (Cannabis sativa subsp. sativa) flour and protein preparation as natural nutritional and structure-forming agents in gluten-free starch bread. Food Chem., 2017, 223, 51-59. [CrossRef]
- Ramos-Sanchez, R.; Hayeard, J.; Henderson, D.; Duncan, G. D.; Russel, W. R.; Duncan, S. H.; Neacsu, M. Hemp Seed-Based Foods and Processing By-Products Are Sustainable Rich Sources of Nutrients and Plant Metabolites Supporting Dietary Biodiversity, Health, and Nutritional Needs. Foods, 2025, 14, 875. [CrossRef]
- Svec, I.; Hruskova, M. ; Properties and nutritional value of wheat bread enriched by hemp products. Potr. S. J. F. Sci. 2015, 9, 304–308. [Google Scholar] [CrossRef] [PubMed]
- Lukin, A.; Bitiutskikh, K. On potential use of hemp flour in bread production. Bull. Transilv. Univ. Brasov Ser. II, 2017, 10, 117–123.
- Kowalski, S.; Mikulec, A., Litwinek, D.; Mickowska, B.; Skotnicka, M.; Oacz, J.; Karwowska, K.; Wiweocka-Gurgul, A.; Sabat, R.; Platta, A. The influence of fermentation technology on the functional ans densory propertiez of hemp bread. Mol. 2024, 29, 5455. [CrossRef]
- International Organization for Standardization (ISO). Microbiology of food and animal feeding stuffs – Horizontal method for the enumeration of yeasts and moulds – Part 2: Colony count technique in products with water activity ≤ 0.95; ISO 21527-2:2008; ISO: Geneva, Switzerland, 2008.
- Wichchukit, S.; O’Mahony, M. The 9-point hedonic scale and hedonic ranking in food science: some reappraisals and alternatives. J. Sci Food Agric. 2014, 95, 2167–2178. [Google Scholar] [CrossRef] [PubMed]
- Peryam, D.R.; Pilgrim, F.J. Hedonic scale method of measuring food preferences. Food Technol. 1957, 11, 9–14. [Google Scholar]
- Lawless, H.T.; Heymann, H. Sensory evaluation of food: Principles and practices. In Sensory Evaluation of Food, 2nd ed.; Springer: New York, NY, USA, 2010; pp. 1–596. [Google Scholar]
- Stone, H.; Bleibaum, R.; Thomas, H.A. Sensory Evaluation Practices, 4th ed.; Academic Press: San Diego, CA, USA, 2012; pp. 1–448. [Google Scholar]
- Meilgaard, M.; Civille, G.V.; Carr, B.T. Sensory Evaluation Techniques, 4th ed.; CRC Press: Boca Raton, FL, USA, 2007; pp. 1–464. [Google Scholar]
- Marques, C.; Correia, E.; Dinis, L.-T.; Vilela, A. An overview of sensory characterization techniques: from classical descriptive analysis to the emergence of novel profiling methods. Foods, 2022, 11(3), 255.
- Sensory Evaluation Practices, 4th ed.; Academic Press: San Diego, CA, USA, 2012; pp. 1–448.
- Trinh, K.T.; Glasgow, S. On the Texture Profile Analysis Test. In Proceedings of the Food Science Conference, Massey University, Palmerston North, New Zealand, 25–27 September 2012. [Google Scholar]
- Pathare, P.B.; Opara, U.L.; Al-Said, F.A.-J. Colour measurement and analysis in fresh and processed foods: A review. Food Bioproc. Technol. 2013, 6, 36–60. [Google Scholar] [CrossRef]
- International Organization for Standardization (ISO). Microbiology of food and animal feeding stuffs – Horizontal method for the detection and enumeration of Enterobacteriaceae – Part 2: Colony-count method; 21528-2:2004; ISO: Geneva, Switzerland, 2004.
- International Organization for Standardization (ISO). Cereals and cereal products — Determination of moisture content — Reference method; ISO 712:2009; ISO: Geneva, Switzerland, 2009.
- Vartolomei, N.; Turtoi, M. The influence of the addition of rosehip powder to wheat flour on the dough farinographic properties and bread physico-chemical characteristics. Appl. Sci. 2021, 11, 12035. [Google Scholar] [CrossRef]
- International Organization for Standardization (ISO). Cereals, pulses and by-products — Determination of ash yield by incineration; ISO 2171:2023; German version DIN EN ISO 2171:2010; ISO: Geneva, Switzerland, 2023.
- International Organization for Standardization (ISO). Animal feeding stuffs — Determination of crude fibre content — Method with intermediate filtration; ISO 6865:2000; ISO: Geneva, Switzerland, 2000.
- International Organization for Standardization (ISO). Cereals and cereal products — Determination of starch — Method using α-amylase and amyloglucosidase. ISO 20483:2013; ISO: Geneva, Switzerland, 2013. [Google Scholar]
- Romanian Standards Association (ASRO). SR 91:2007 – Cereals and derived products – Determination of starch content – Enzymatic method (item 13.2). ASRO: Bucharest, Romania, 2007. [Google Scholar]
- Stanciu, I.; Ungureanu, E.L.; Popa, E.E.; Geicu-Cristea, M.; Drăghici, M.; Miteluț, A.C.; Mustatea, G.; Popa, M.E. The experimental development of bread with enriched nutritional properties using organic sea buckthorn pomace. Appl. Sci. 2023, 13, 6513. [Google Scholar] [CrossRef]
- Romanian Standards Association (ASRO). SR 91:2007 – Cereals and derived products – Determination of starch content – Gravimetric method (item 14) . ASRO: Bucharest, Romania, 2007. [Google Scholar]
Figure 1.
Age distribution of consumers participating in preferential sensory analysis.
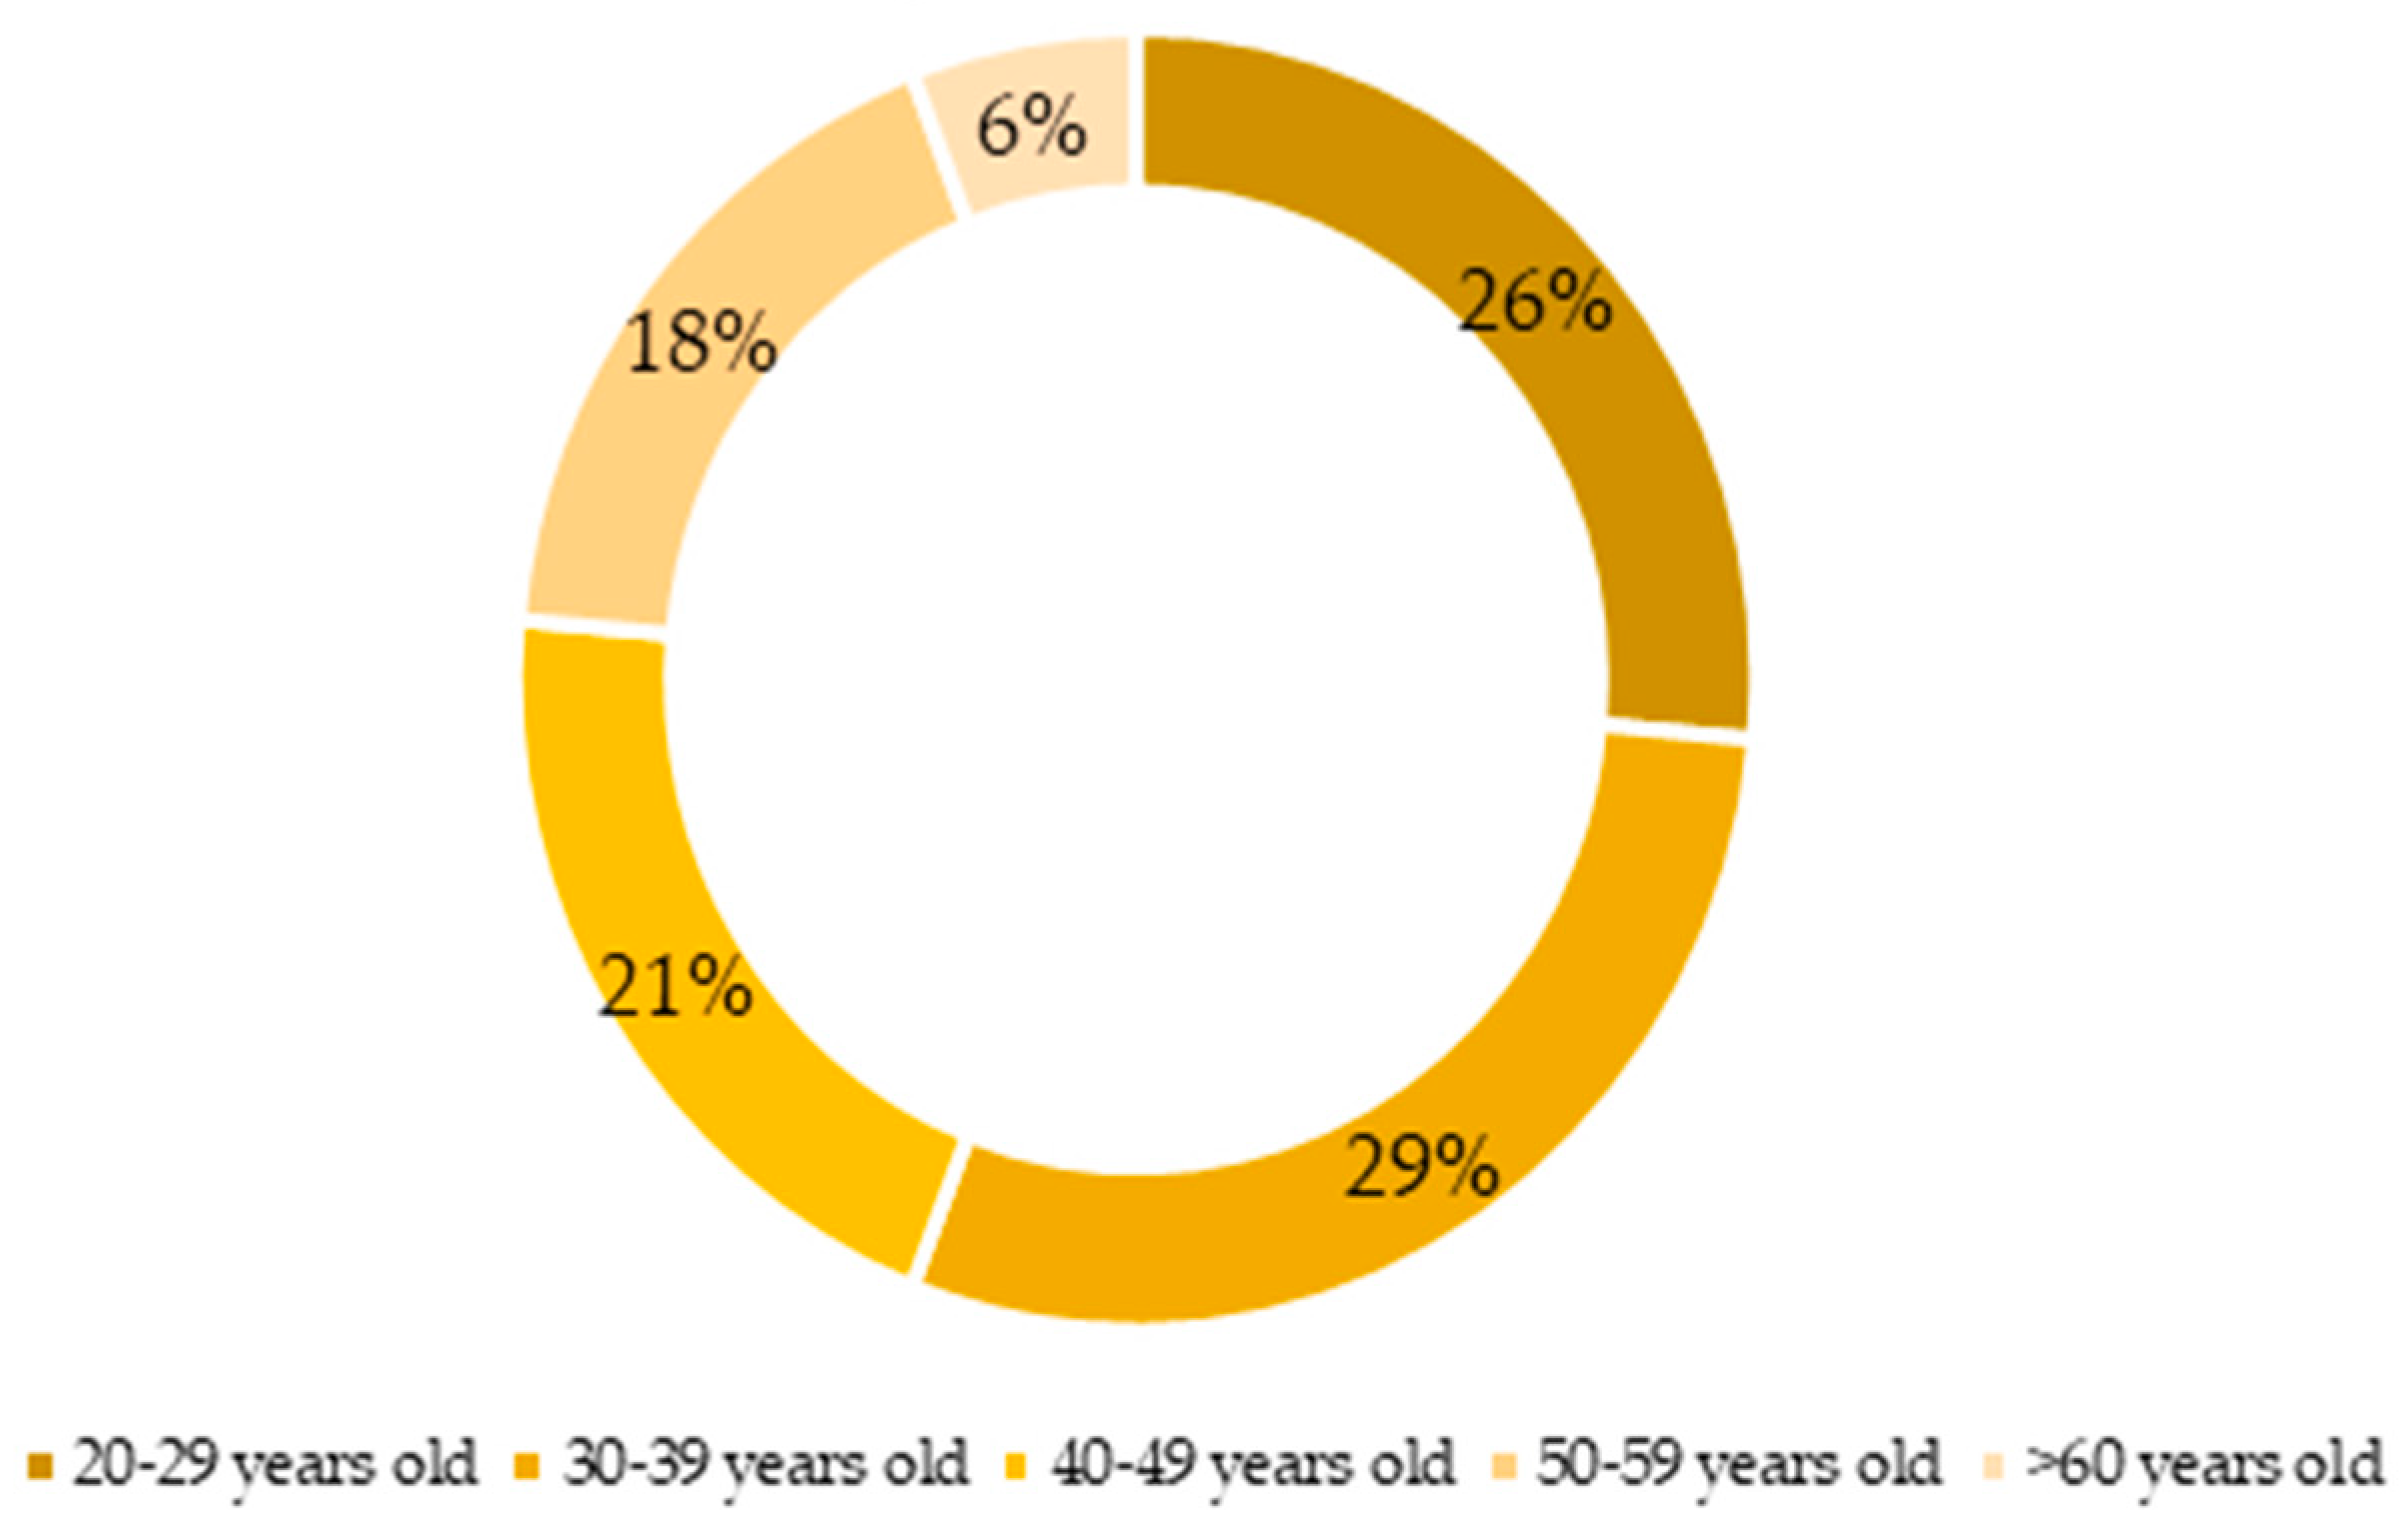
Figure 2.
Sensory preferential evaluation of muffin samples (All individuals appearing in photos have given their written informed consent for the use of their image in this publication, in accordance with GDPR (EU Regulation 2016/679).
Figure 2.
Sensory preferential evaluation of muffin samples (All individuals appearing in photos have given their written informed consent for the use of their image in this publication, in accordance with GDPR (EU Regulation 2016/679).

Figure 3.
Sensory evaluation results of muffin samples. The bar charts illustrate the hedonic ratings given by consumers for the samples. A chart represents the samples obtained with WF; B represents the samples obtained with WWF.
Figure 3.
Sensory evaluation results of muffin samples. The bar charts illustrate the hedonic ratings given by consumers for the samples. A chart represents the samples obtained with WF; B represents the samples obtained with WWF.
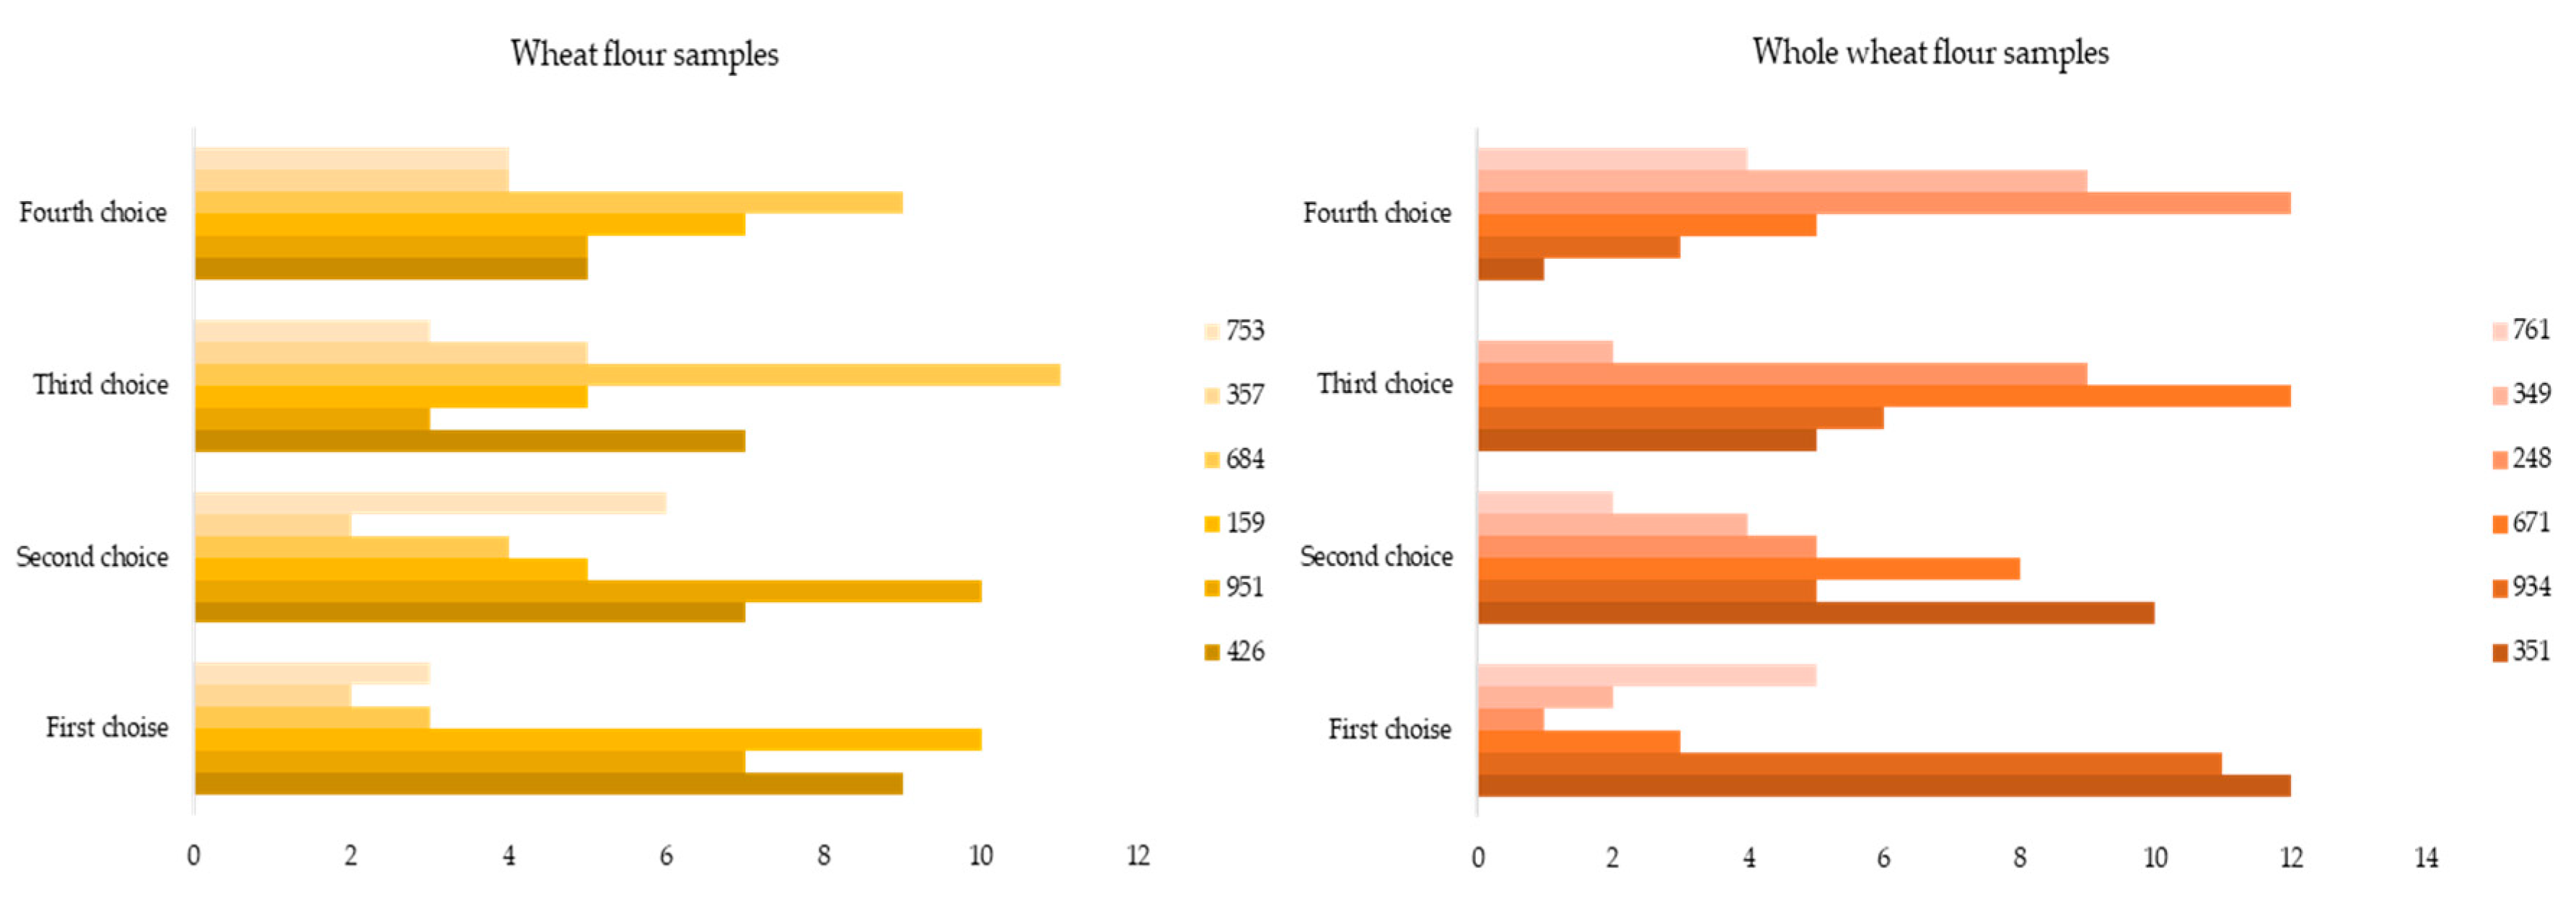
Figure 4.
Sensory profile of muffin samples with different HF concentrations. A: Samples with WF; B: Samples with WWF.
Figure 4.
Sensory profile of muffin samples with different HF concentrations. A: Samples with WF; B: Samples with WWF.
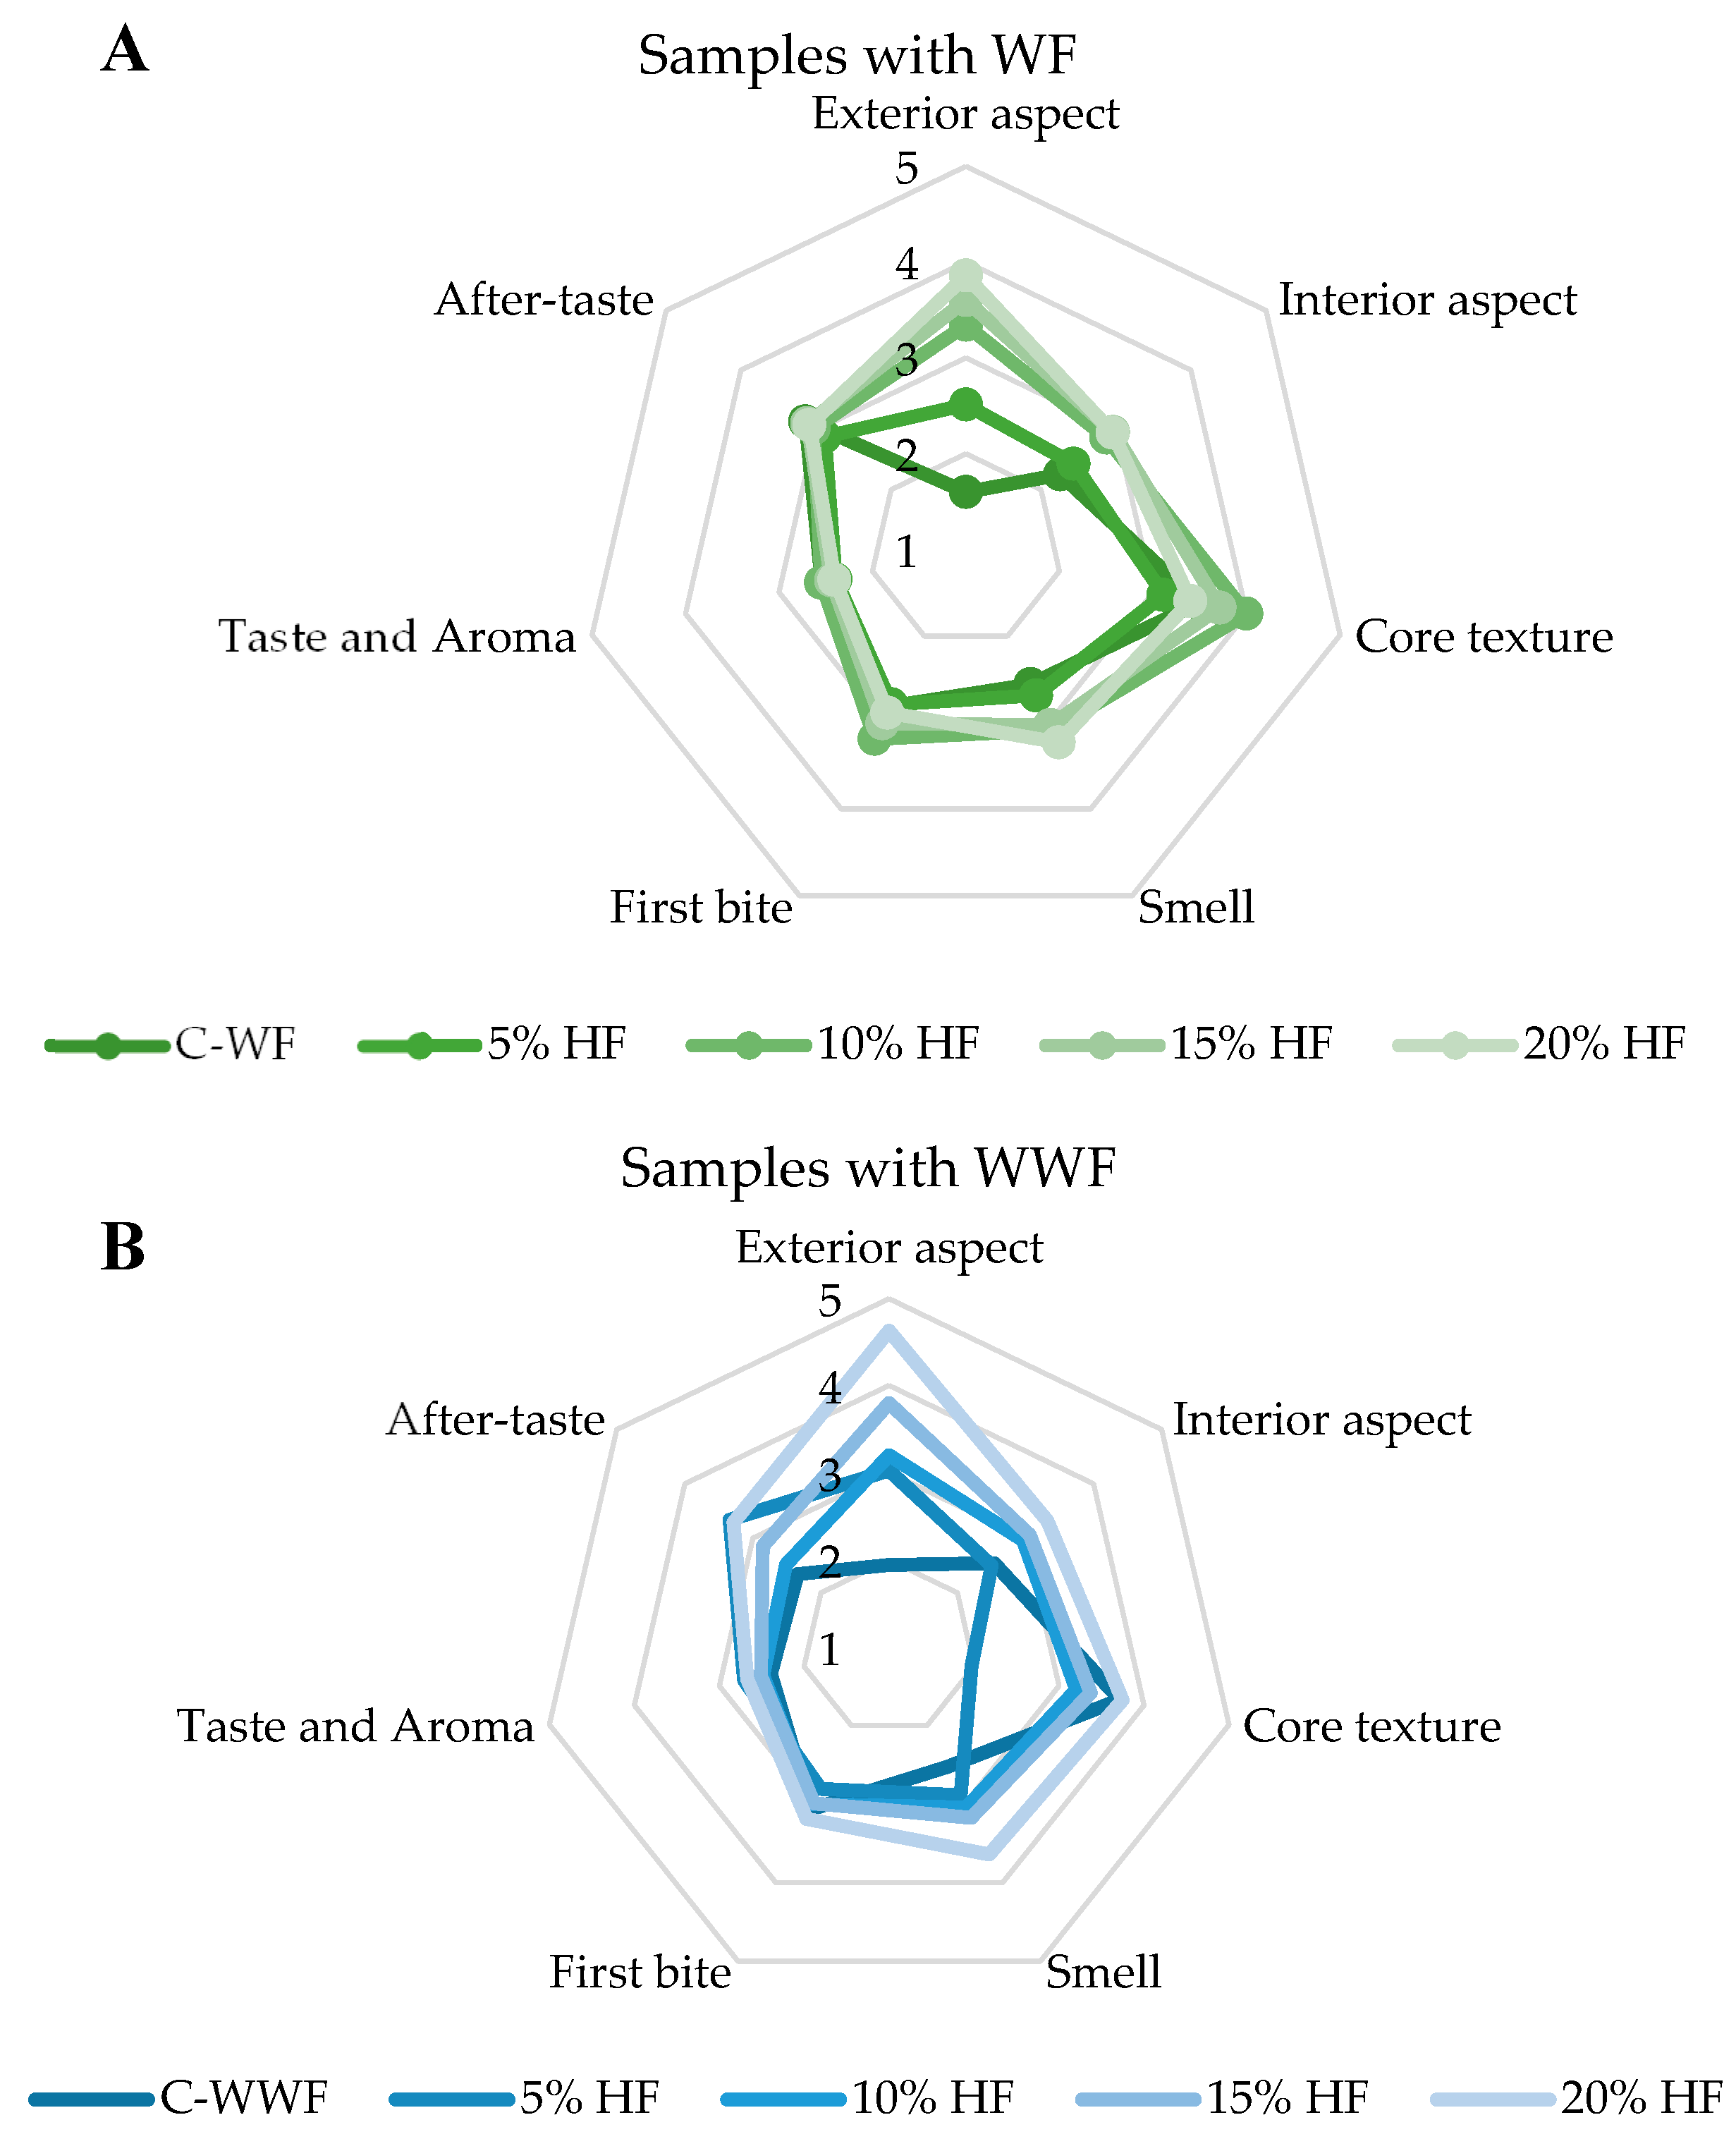
Figure 6.
Overview of the muffin preparation process and final baked samples. The top images illustrate the ingredients, preparation setup, and pre-baking arrangement. The bottom pictures present the baked muffin samples, both whole and cross-sectioned, showcasing the effects of different HF concentrations on color and texture.

Figure 7.
Samples with HF between 5% to 40%. AA: samples with WF and HF and AB: samples with WWF and HF. For each group we have: A, A’ – 5% HF, B, B’ – 10% HF, C, C’ – 15% HF, D, D’ – 20% HF, E, E’ – 30% HF and F, F’ – 40% HF.
Figure 7.
Samples with HF between 5% to 40%. AA: samples with WF and HF and AB: samples with WWF and HF. For each group we have: A, A’ – 5% HF, B, B’ – 10% HF, C, C’ – 15% HF, D, D’ – 20% HF, E, E’ – 30% HF and F, F’ – 40% HF.
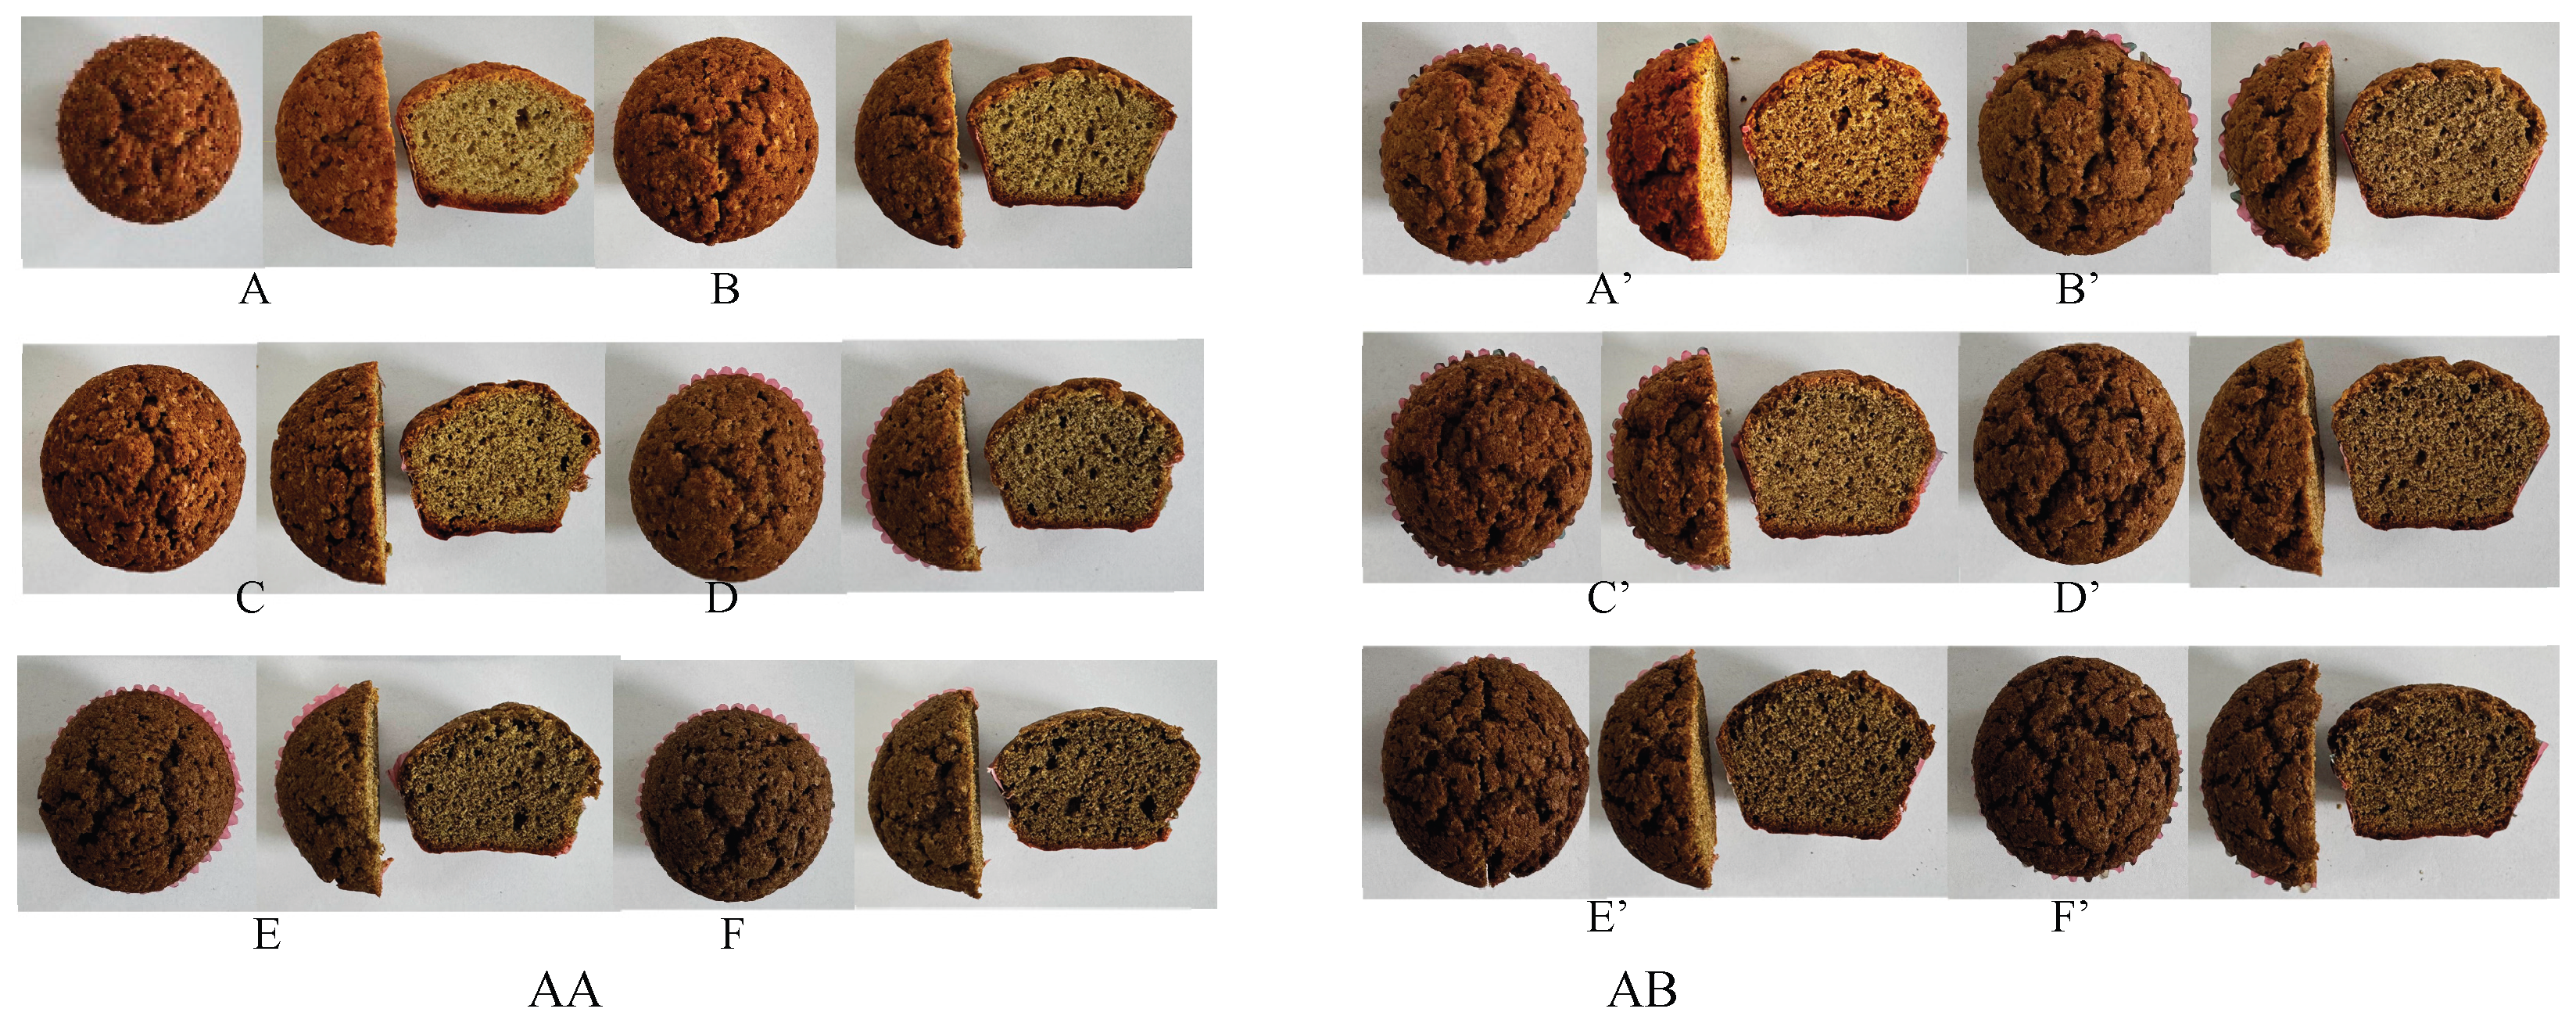

Table 1.
Key sensory attributes – a comparative analysis of samples.
| Attribute | Samples with WF | Samples with WWF | Comparison |
|---|---|---|---|
| Appearance | This set of samples demonstrates a more varied range of appearance scores, with some formulations receiving slightly higher ratings. This may suggest that the flour composition in this group resulted in a more visually appealing muffin, possibly due to improved crumb distribution or a lighter color. | The samples in this group exhibit moderate variation in appearance scores. The darker coloration and denser crumb structure associated with higher HF concentrations may have influenced consumers' ratings. The presence of HF can lead to a more compact crumb, affecting uniformity. | The W-HF1 samples generally have a more favorable appearance rating, which may indicate that these formulations maintained a more visually appealing structure despite HF incorporation. However, the differences are not extreme, suggesting that both groups were influenced by similar factors, such as the darkening effect of HF and crumb uniformity. |
| Aroma | The samples in this group exhibit a more pronounced variation in aroma scores. Some samples scored lower, potentially indicating that HF at higher concentrations masked the typical vanilla or buttery notes found in muffins. | The aroma scores in this group are relatively uniform, with moderate variability between samples. The addition of HF, known for its nutty and slightly earthy scent, may have altered the aroma profile. However, none of the samples seemed to have been overwhelmingly strong or unpleasant in their aroma. | The WW-HF2 samples appear to have more balanced aroma scores across different formulations, whereas Figure 4. A - samples show more variation, suggesting that HF concentration may have affected aroma perception differently between these two sample groups. |
| Texture | The texture ratings in this set appear slightly more consistent, suggesting that these formulations may have maintained a better balance between softness and elasticity. The ability of the muffin crumb to retain moisture while avoiding excessive gumminess may have contributed to these results. | The texture ratings in this group show noticeable variations, likely due to the impact of HF on crumb structure and moisture retention. Some formulations may have been perceived as too dense or firm, especially at higher HF concentrations. | The W-HF samples generally exhibit a more stable texture profile, which may indicate that this formulation group resulted in muffins with a more desirable crumb structure. Figure 4. B - samples appear to have more variability, possibly due to increased firmness or dryness in some formulations. |
| Taste | Taste ratings have slightly more variation, suggesting that some samples may have exhibited stronger taste alterations due to HF addition. Higher concentrations of HF might have contributed to more pronounced nutty and earthy notes. | Taste ratings in this group show a moderate spread, with some formulations receiving higher ratings. The influence of HF, particularly at higher concentrations, may have introduced a mild bitterness, which could have affected perception. | The WW-HF samples exhibit a more controlled spread in taste ratings, whereas Figure 4. A-samples show greater variability. This suggests that the impact of HF on taste was more noticeable in the W-HF samples, possibly due to differences in base flour or ingredient interactions. |
| Overall acceptability | The acceptability ratings in this group show more divergence, indicating that some samples were significantly preferred over others. This may imply that the formulations in this set had greater variations in sensory properties, leading to a stronger differentiation among consumers. | The overall acceptability ratings are relatively consistent, with most samples clustering around the mid-to-high range. This suggests that despite minor variations in texture, taste, and appearance, these formulations were generally well received. | The WW-HF samples exhibit a more balanced overall acceptability, while the W-HF samples show greater variation in preference. This suggests that the W-HF formulations had more noticeable differences in sensory attributes, leading to stronger opinions among consumers. |
1 Samples with WF and different concentrations of HF. 2 Samples with WWF and different concentrations of HF.
Table 2.
Mean values and standard deviations (SD) of key texture parameters.
| Sample | Firmness (N) | Cohesiveness | Elasticity | Gumminess | ||||
|---|---|---|---|---|---|---|---|---|
| Mean | SD | Mean | SD | Mean | SD | Mean | SD | |
| C – WF1 | 6.29 | ± 1.47 | 0.2 | ± 0.13 | 1.62 | ± 0.38 | 1.84 | ± 1.15 |
| 5% HF3 | 4.08 | ± 0.19 | 0.12 | ± 0.08 | 1.56 | ± 0.14 | 0.74 | ± 0.50 |
| 10% HF | 7.81 | ± 1.36 | 0.18 | ± 0.18 | 1.55 | ± 0.93 | 1.72 | ± 1.82 |
| 15% HF | 5.06 | ± 0.37 | 0.06 | ± 0.07 | 1.20 | ± 0.38 | 0.50 | ± 0.63 |
| 20% HF | 5.04 | ± 0.06 | -0.01 | ± 0.22 | 2.42 | ± 0.30 | -1.53 | ± 2.93 |
| C – WWF2 | 5.28 | ± 1.95 | -0.67 | - | 3.52 | - | -8.67 | - |
| 5% HF | 4.10 | ± 0.50 | 0.22 | ± 0.03 | 1.63 | ± 0.024 | 1.44 | ± 0.24 |
| 10% HF | 7.89 | ± 1.28 | 0.14 | ± 0.05 | 1.95 | ± 0.12 | 2.19 | ± 0.96 |
| 15% HF | 6.87 | ± 0.56 | 0.15 | ± 0.02 | 2.04 | ± 0.32 | 2.12 | ± 0.14 |
| 20% HF | 8.05 | ± 2.70 | 0.13 | ± 0.02 | 1.94 | ± 0.93 | 2.36 | ± 1.37 |
1C-WF – control sample with WF. 2C-WWF – control sample with WWF. 3HF – the variation of concentrations of HF between 5% and 20%.
Table 3.
Yeast and Mold Counts in samples with different concentrations of HF.
| Sample | Yeast and molds (CFU/g) |
|---|---|
| C – WF1 | < 10 |
| 5% HF3 | < 10 |
| 10% HF | < 10 |
| 15% HF | < 10 |
| 20% HF | < 10 |
| C – WWF2 | < 10 |
| 5% HF | < 10 |
| 10% HF | < 10 |
| 15% HF | < 10 |
| 20% HF | < 10 |
1C-WF – control sample with WF. 2C-WWF – control sample with WWF. 3HF – the variation of concentrations of HF between 5% and 20%.
Table 4.
Enterobacteriaceae counts in samples with different concentrations of HF.
| Sample | Enterobacteriaceae (CFU/g) |
|---|---|
| C – WF1 | < 10 |
| 5% HF3 | < 10 |
| 10% HF | < 10 |
| 15% HF | < 10 |
| 20% HF | < 10 |
| C – WWF2 | < 10 |
| 5% HF | < 10 |
| 10% HF | < 10 |
| 15% HF | < 10 |
| 20% HF | < 10 |
1C-WF – control sample with WF. 2C-WWF – control sample with WWF. 3HF – the variation of concentrations of HF between 5% and 20%.
Table 5.
Physicochemical properties of samples.
| Sample | Moisture% | Ash% | Crude fiber% | Protein% | Fat% | Sugar% | ||||||
|---|---|---|---|---|---|---|---|---|---|---|---|---|
| Mean | SD | Mean | SD | Mean | SD | Mean | SD | Mean | SD | Mean | SD | |
| C – WF1 | 17.59 | ± 0.014 | 0.95 | ± 0.028 | 2.79 | ± 0.099 | 6.89 | ± 0.028 | 27.41 | ± 0.014 | 32.05 | ± 0.007 |
| 5% HF3 | 14.58 | ± 0.014 | 1.10 | ± 0.064 | 3.98 | ± 0.191 | 8.07 | ± 0.085 | 26.08 | ± 0.219 | 39.95 | - |
| 10% HF | 14.10 | ± 0.014 | 1.25 | ± 0.021 | 5.45 | ± 0.233 | 8.59 | ± 0.021 | 26.24 | ± 0.191 | 31.40 | ± 0.014 |
| 15% HF | 14.62 | - | 1.35 | ± 0.042 | 4.64 | ± 0.269 | 8.68 | ± 0.078 | 26.18 | ± 0.014 | 29.07 | ± 0.007 |
| 20% HF | 14.45 | ± 0.007 | 1.44 | ± 0.071 | 5.87 | ± 0.099 | 9.26 | ± 0.049 | 26.09 | ± 0.049 | 29.07 | - |
| C – WWF2 | 12.88 | ± 0.007 | 1.35 | ± 0.014 | 3.64 | ± 0.304 | 8.82 | ± 0.007 | 26.66 | ± 0.042 | 31.07 | ± 0.007 |
| 5% HF | 13.80 | - | 1.38 | ± 0.014 | 4.38 | ± 0.019 | 9.29 | ± 0.042 | 26.28 | ± 0.014 | 27.76 | - |
| 10% HF | 12.78 | ± 0.007 | 1.42 | ± 0.035 | 5.66 | ± 0.453 | 9.54 | - | 26.62 | ± 0.071 | 30.40 | ± 0.007 |
| 15% HF | 13.10 | ± 0.014 | 1.59 | ± 0.014 | 7.00 | ± 0.247 | 9.81 | ± 0.021 | 26.55 | ± 0.028 | 32.33 | ± 0.071 |
| 20% HF | 10.76 | ± 0.007 | 1.67 | ± 0.007 | 7.59 | ± 0.057 | 9.95 | ± 0.028 | 27.02 | ± 0.049 | 30.73 | ± 0.007 |
1C-WF – control sample with WF. 2C-WWF – control sample with WWF. 3HF – the variation of concentrations of HF between 5% and 20%.
Table 6.
Formulation of muffins samples.
| Sample | WF (%) | WWF (%) | HF (%) | Sugar (%) | Butter (%) | Eggs (%) | Baking soda (%) | Flavor (%) |
|---|---|---|---|---|---|---|---|---|
| C – WF1 | 30.44 | – | – | 22.83 | 22.83 | 22.83 | 0.76 | 0.30 |
| 5% HF3 | 28.92 | – | 1.52 | 22.83 | 22.83 | 22.83 | 0.76 | 0.30 |
| 10% HF | 27.40 | – | 3.04 | 22.83 | 22.83 | 22.83 | 0.76 | 0.30 |
| 15% HF | 25.88 | – | 4.57 | 22.83 | 22.83 | 22.83 | 0.76 | 0.30 |
| 20% HF | 24.35 | – | 6.09 | 22.83 | 22.83 | 22.83 | 0.76 | 0.30 |
| 30% HF | 21.31 | – | 9.13 | 22.83 | 22.83 | 22.83 | 0.76 | 0.30 |
| 40% HF | 18.26 | – | 12.18 | 22.83 | 22.83 | 22.83 | 0.76 | 0.30 |
| C – WWF2 | – | 30.44 | – | 22.83 | 22.83 | 22.83 | 0.76 | 0.30 |
| 5% HF | – | 28.92 | 1.52 | 22.83 | 22.83 | 22.83 | 0.76 | 0.30 |
| 10% HF | – | 27.40 | 3.04 | 22.83 | 22.83 | 22.83 | 0.76 | 0.30 |
| 15% HF | – | 25.88 | 4.57 | 22.83 | 22.83 | 22.83 | 0.76 | 0.30 |
| 20% HF | – | 24.35 | 6.09 | 22.83 | 22.83 | 22.83 | 0.76 | 0.30 |
| 30% HF | – | 21.31 | 9.13 | 22.83 | 22.83 | 22.83 | 0.76 | 0.30 |
| 40% HF | – | 18.26 | 12.18 | 22.83 | 22.83 | 22.83 | 0.76 | 0.30 |
1C-WF – control sample with WF. 2C-WWF – control sample with WWF. 3HF – the variation of concentrations of HF between 5% and 40 %.
Disclaimer/Publisher’s Note: The statements, opinions and data contained in all publications are solely those of the individual author(s) and contributor(s) and not of MDPI and/or the editor(s). MDPI and/or the editor(s) disclaim responsibility for any injury to people or property resulting from any ideas, methods, instructions or products referred to in the content. |
© 2025 by the authors. Licensee MDPI, Basel, Switzerland. This article is an open access article distributed under the terms and conditions of the Creative Commons Attribution (CC BY) license (http://creativecommons.org/licenses/by/4.0/).
Copyright: This open access article is published under a Creative Commons CC BY 4.0 license, which permit the free download, distribution, and reuse, provided that the author and preprint are cited in any reuse.


