
Submitted:
09 July 2025
Posted:
10 July 2025
You are already at the latest version
Abstract
The iron and steel industries globally have a high prevalence of occupational injuries, which need to be reduced. Obtaining safety climate information from workers assists in understanding the safety status at the workplace. This study aimed to assess the safety climate in iron- and steel-industries, and its association with occupational injuries. A cross-sectional study was conducted in four iron- and steel-industries in Tanzania. Three hundred and twenty-one workers from the production lines and 50 managers/supervisors participated. The data were collected by interviews using the Swahili version of the Nordic Safety Climate questionnaire (NOSACQ-50) and the modified International Labor Organization (ILO) manual on methods for occupational injuries. The managers/supervisors scored higher than the workers in five of the NOSACQ-50 dimensions. Most workers with low scores on safety climates had experienced occupational injuries. Analyses of the workers who had been injured at work, showed that the dimensions ‘management safety priority and ability’, and ‘management safety justice’ were significant predictors of occupational injuries in the iron- and steel-industries, when adjusting for working years and working hours per day. This indicates that safety climate is a predictor of occupational injuries, and it is important to improve the safety priorities and commitments among the employees.
Keywords:
iron and steel industry
; occupational injury
; safety climate
1. Introduction
The iron- and steel-industries produce iron and steel, essential materials for construction and manufacturing. Steel is an alloy made from iron and carbon, known for its strength and durability [1]. Steel production involves separating metals from iron ores and/or scrap and subsequently refining the metal to more pure forms. The steel making has two stages. First, the reduction stage, i.e. the ironmaking stage, where iron ore is reduced to hot metal. The second stage is the oxidation, i.e. steel making stage, where hot metal is refined to steel [1]. Tanzanian steel industries rely on imported billets and metal scraps for steel making. The sector plays an important role in the production of essential materials for other industries such as construction industries, and automobile industries, and is important for the development of low-and middle-income countries. However, the iron- and steel-industries are among the most dangerous workplaces in the world, compared to other manufacturing industries [2,3]. Workers in the iron- and steel-industries might be at risk of various injuries because of using mechanical equipment and energy-intensive processes. There are numerous potential risks for occupational accidents associated with the manufacturing of iron and steel, including high temperatures, working at heights, working in enclosed spaces, working near moving and unsecured machinery, the presence of sharp metal pieces, and heavy lifting. In a systematic review and meta-analysis, the iron- and steel-industries globally have been reported to have a prevalence of occupational injuries of 55%, which is considered very high [4]. In Tanzania, the situation in this industry is even worse, as a study from 2025 shows an injury prevalence of 65.1 [5]. The high rate of occupational injuries in these industries is reported to be attributed to poor occupational health safety (OHS) implementation at these workplaces [4,5,6]. It is uncertain why OHS is not widely implemented in iron- and steel-companies, even though national laws, regulations, and an ILO code of practice on health and safety emphasize the importance of OHS measures to be adopted in these industries to protect workers.
Recently, the Tanzanian government wanted to invest more in manufacturing industries for economic growth. This will accelerate the evolution of the iron- and steel-industries. As many people (14,889) are currently employed in the industry in Tanzania [7], and more jobs are expected to be created, it is crucial to concentrate on this industry and work on preventing occupational injuries due to the large workforce of 40 million people worldwide. To benefit both the national and global iron and steel sectors, conducting a study to improve safety conditions and ultimately protect the workers is essential. To accomplish this, we need to understand the perception of the workers on available safety policies, procedures, and practices within their workplace (safety climate). More knowledge of this type will give us a picture of the overall performance of occupational safety in these workplaces.
Safety climate refers to the shared perceptions of employees of how safety is prioritized, valued, and enforced within an organization at a given point in time. Safety climate describes individual perceptions of safety in the work environment [8]. A safety climate can influence an individual’s OHS behavior by motivating an employee to try to engage in health and safety. To achieve this, the organization needs to have strong management support and commitment to safety, for instance with an emphasis on worker safety training, regular and open communication, safety promotion, environmental control, good housekeeping, a stable workforce, and employee involvement in health and safety activities and decision-making processes [9]. A positive safety climate seems to lead to a change in employee safety behavior and safety outcomes in the organization [10]. It has been shown that workers express a low level of ambivalence towards using personal protective equipment when they perceive that there is an atmosphere in the organization that supports safety [11]. Likewise, various research has demonstrated a relationship between safety climate and occupational injuries [11,12,13]. A supportive safety climate, where safe behavior is encouraged, seems to be linked to fewer injuries. In contrast, an unsupportive safety climate, where safe behavior is not encouraged, seems to be linked to more frequent injuries [14]. It is also important to consider that managers and employees may perceive their safety climate and safety differently. This might be due to their different roles in terms of safety within the workplace. If both managers and employees perceive the safety climate positively, this will indicate that OHS standards within the workplace are adhered. Ultimately, this may reduce the rate of occupational injuries [15].
Many studies have investigated the safety climate in different types of industries, for example from agriculture [16,17], oil and power [18,19], nursing homes, healthcare [20,21] and construction sector [22,23,24]. However, even though the iron- and steel-industry is recognized as one of the most hazardous workplaces in the world, with a high prevalence of occupational injuries, no research has examined the relationship between safety climate and occupational injuries in these industries. It is important to understand this relationship in this sector, to come up with measures to reduce the injury prevalence. Also, it is important to consider that managers and employees may perceive their safety climate differently [25,26], and study both groups in the industry.
This study aimed to assess the level of safety climate and its association with occupational injuries among workers in the iron- and steel-industries. The opinions of the employees and their managers have been studied separately.
2. Materials and Methods
2.1. Study Design and Population
We conducted a cross-sectional study in the iron- and steel-industry in Dar es Salaam and Pwani areas of Tanzania. This industry has many companies, and we selected four of these, without any knowledge about their working conditions and injury prevalence. Two companies from each region were selected from the Tanzanian Occupational Safety and Health Authority (OSHA) registry. This registry includes companies that adhere to the Occupational Health and Safety Act in Tanzania. The sample size was calculated by using OpenEpi, version 3. We used figures from an Ethiopian study, showing a work-related prevalence of 33% for injuries, a significance level of 0.05, and a statistical power of 95 [27]. The calculated sample size was 381. We were given access to the list of production line workers registered in the payroll from each company, and selected the number of workers proportionate to the number of employees. Company A had 125 workers in the production line, and we randomly selected 99 participants from this group. Similarly, company B had 76 production workers, and 60 workers were selected; company C had 116 production workers, and 92 were selected; company D had 165 workers, and 130 were selected. In three companies we had a response rate of 100, but in company D only 70 workers consented to participate. The overall response rate for all workers consented in four companies was 84. For managers/supervisors in these four companies, all who were available during the interview were invited to participate in the study, and 50 managers/supervisors consented and participated. Their response rate was 100.
2.2. Nordic Safety Climate Questionnaire (NOSACQ-50)
The Nordic safety climate questionnaire is a valid instrument that evaluates individuals’ perceptions of safety climate. The questionnaire was developed by a team of specialists from various Nordic countries, in 2011. This instrument has been used in several studies [13,16,22,25,26]. The NOSACQ-50 consists of 50 questions that assess seven dimensions of safety climate. The seven dimensions contain 22 items dealing with three managerial dimensions: management ‘safety priority and ability’ (9 items, of which four are negated or reversed), ‘safety empowerment’ (7 items, 2 negated), and ‘safety justice’ (6 items, 2 negated). The remaining 28 items deal with the worker’s dimensions: ‘safety commitment’ (6 items, 3 negated), ‘safety priority and risk non-acceptance’ (7 items, 6 negated), ‘peer safety communication, learning, and trust in safety ability’ (8 items, 1 negated) and ‘trust in the efficacy of safety systems’ (7 items, 3 negated). As far as the assessment criteria are concerned, a four-step Likert scale is used for rating each statement using the terms strongly disagree, disagree, agree, and strongly agree, which namely correspond to a 1–4 rating scale in case of positively formulated statements or 4–1 for the reversed statements. When calculating the scores from the questionnaires, a mean score was calculated for each dimension per participant, whereas the individual mean scores were calculated as the number of positive and reversed responses divided by the number of answered questions, after getting the individual mean then we calculated the total mean for the population for each of the 7 dimensions as a 'mean of the mean'.
Based on the criteria for interpreting safety climate dimension scores, a score greater than 3.30 indicates that the safety climate level of the workplace is good. Safety climate dimension scores between 3 to 3.30 are considered fairly good with a slight need for improvement, scores between 2. 99 and 2.70 are considered fairly low with need for improvement and a score less than 2.7 indicated as low with great need for improvement [28,29]. In our study, we adapted the Swahili version of the Nordic safety climate questionnaire (NOSACQ-50), available on the website, and we combined good and fairly good as ‘good score’ and fairly low and low as ‘low score’.
2.3. Occupational Injuries
Questions from an ILO manual on methods for occupational injuries statistics from household surveys and establishment survey [30] was used to obtain information on occupational injuries. This part of the questionnaire was not originally in Swahili, so it was translated from English to Swahili language and back again to English. No changes in the questionnaire seemed necessary after these translations. The occupational injuries experienced by the person interviewed in the past year among iron- and steel-industry workers was the main outcome variable in our analyses, and was specifically defined as accidents that had caused injury or disease at the workplace while the worker was carrying out the business of the employer [30]. In addition, the injury should have caused the worker to be unable to work (incapacitated) at least one day apart from the day of the accident to be defined as an occupational injury [30].
2.4. Pretesting
A pre-test was conducted for the whole questionnaire, which involved 5% of the total sample size calculated. A pre-test was done in another industry that was not participating in the present study. A few corrections were made afterward, as some questions needed clarification, with more words for explanations.
2.5. Data Analysis
The collected data were cleaned, coded, entered, and analyzed using the Statistical Package for Social Sciences (SPSS), version 23. Continuous variables were described by mean and standard deviation (mean; SD), and categorical variables were described by proportion (%). Chi-square tests and Fisher’s exact tests were used to assess whether the demographic variables differ significantly between the two groups. To compare the scores of safety climate dimensions between managers/supervisors and workers, a Mann-Whitney test was used because the variables (dimensions) were not normally distributed. Multivariate logistic regression analyses were performed by including variables with a p-value of less than 0.25 from univariate regression analyses. Statistical significance was defined as a P value less or equal to 0.05.
3. Results
3.1. Description of Study Participants, Managers, and Workers
A total of 371 participated in this study, 321 production workers with a response rate of 84%, and 50 managers/supervisors with a response rate of 100%. In the production line, all participants were men, while among managers/supervisors, 48 were male and 2 females. The mean age of participants was 32 (SD = 8) for workers and 30 (SD = 5) for managers/supervisors. Many participants had less or equal to 4 working years, (76%) and (56%) for workers and managers/supervisors respectively. Many of the iron- and steel- workers and managers worked for more than Table 1.
3.2. Safety Climate Level Among Managers and Workers
The results showed that managers/supervisors have higher mean ranks than the workers on the Nordic safety climate questionnaire, ‘management safety empowerment’, ‘management safety justice’, ‘workers’ safety priority and risk non-acceptance’ and ‘workers’ trust in the efficacy of safety systems’ than the workers. This means that the manager scores higher in the mentioned dimensions Table 2.
3.3. Prevalence of Occupational Injuries
The prevalence of occupational injuries was 65.1% per year. The occupational injuries were dominated by superficial injuries (abrasions, blisters, contusions, puncture wounds): 110 (52.6%), followed by dislocation, sprain, and strain injuries that were experienced by 13.9 percent. Burns and corrosions were experienced by 12.9% and cuts by 11% Figure 1. More details on the injuries are found in another publication [5].
3.4. Safety Climate and Occupational Injuries Among Workers
The results on safety climate and occupational injuries revealed that the majority of workers who reported being injured at work had low safety climate scores. Whereas, in dimension one, 80.4% of workers who reported being injured scored low, 59.4% of injured workers scored fairly low, 32. 7% scored fairly good and 27.3% scored good, in dimension two, 70.7% of injured workers scored low, 73.3% of injured scored fairly low, likewise 63. 7% and 42.6 % scored fairly good and good respectively as shown in Figure S1-S5 in the supplementary file.
3.4.1. Association Between Safety Climate Score and Occupational Injuries the Past Year Among Workers in the Production Line of Iron- and Steel-Industries
The results showed that the scores for the dimensions ‘management safety priority and ability’, and ‘management safety justice’ were both significant predictors of occupational injuries in the iron- and steel-industries (Table 3), in multivariate regression analyses, adjusting for work experience and working hours.
4. Discussion
The findings show that the safety climate level among workers in the iron- and steel- industries is low, managers/supervisors scored higher than workers and this indicates a poor safety culture at these workplaces. The workers with low scores regarding safety climate were more likely to have experienced occupational injuries compared to those with higher scores. ‘Management safety priority and ability’, and ‘management safety justice’ were both significant predictors of occupational injuries in the iron- and steel- industries
The finding aligns with a previous study done at the twin plants in Denmark, where plant B workers had high accident rates and scored low on almost all safety climate scores [31]. Similar findings have also been shown in a study from a metallurgical enterprise in Poland that revealed a difference between an “accident” group and a “no accident” group. The safety culture scores were significantly higher in the “no accident” group [32].
In our study, low scores regarding the management safety priority and ability and low scores on management safety justice were significant predictors of occupational injuries in the iron- and steel-industries. This finding is consistent with a study done in Korea where they found that occupational injuries were more than double as high at work-places with unfavorable safety climates, compared to workplaces with a favorable safety climate [33]. Specifically, factors such as "not encouraging employees to follow safety rules when on a tight schedule" were associated with a high prevalence of occupational injuries [33]. This means that “management’s safety priority and ability” is poor, where they focus more on production and leave behind safety issues. Sometimes managers may know the significance of health and safety regulations and/or the potential consequences of neglecting them but their action does not reflect their awareness, because they just focus on profit gain and see health and safety measures as an extra cost and not investment, which in turn, they prioritize on short-term financial rewards over long-term advantages associated with a safe work environment.
The low score regarding ‘management safety justice’, was also a predictor for occupational injuries. This result is consistent with a study done in construction industries in Taiwan where the occupational accident risk was higher for men with low workplace justice [34]. Likewise, a study done in South Korea showed that driver's lower level of perceived organizational justice was significantly associated with more traffic accidents [35]. Management safety justice is a dimension of the safety culture that evaluates the workers’ perceptions of how the management at the workplace will treat and react to workers who have been involved in an accident or incident. Therefore, the low score reported by the workers on this dimension revealed that the management did not handle workplace accidents properly and accurately. This situation is likely to make the employees reluctant to report an accident to the appropriate personnel for fear of blame or punishment. Ultimately, this can impede the entire process of identifying the underlying cause to such an incident, which in turn will cause occupational injuries to occur and recur at the workplace.
The present study showed that the workers scored lower than their managers/supervisors for five dimensions of the safety climate instrument. The lower perception of the safety climate among workers might be due to the difference in roles and responsibilities when comparing workers and managers/supervisors. The different perceptions of safety in the organization may hinder the implementation of occupational health and safety to mitigate workplace hazards. Better perceptions of safety climate dimensions among managers than among workers have also been observed in another study conducted in the United States. This study involved 1831 truck drivers and their 219 supervisors and found that supervisors provided higher ratings for the safety climate scales ‘management safety empowerment’ and ‘management safety justice’ [26]. These differences in safety perceptions be explained because managers might want to show how well they perform on safety issues in the workplace for the sake of enhancing the company’s image.
The managers/supervisors scored low on the dimension of management safety priority and ability which means that their perception is low in this dimension. This indicates that organizations were not prioritizing safety, which, in turn, may affect the whole hierarchical structure of the company. The priorities of the organization are largely communicated by the managers/supervisors to their workers. If managers are perceived not to be committed to safety and not to prioritize safety over other goals, possibly this habit will be transferred to their subordinates, and ultimately, unsafe behavior would be expected to take place [25,31]. Likewise, in the worker safety commitment dimension, the managers/supervisors had the lowest score than workers and their differences were statistically significant. These findings tend to portray different safety cultures available within the workplace as the result of poor leadership and failed role modeling of managers/supervisors in terms of safety practices.
Apart from that, the dimension of safety priority and risk non-acceptance had the lowest score for both managers/supervisors and workers. This result is consistent with a study done in Colombia in the construction industry where the findings showed that the dimension of workers’ safety priority and risk non-acceptance had the lowest safety climate score across the three groups studied;(workers, supervisors: and managers [36]. These results are serious and show the need to improve safety.
Generally, the results support the notion that the safety outcome in the workplace depends on how workers perceive an organization in terms of safety policies, rules, and practices. If the worker's perception is negative, it will automatically encourage unsafe behavior. which is associated with injury occurrence. Our findings tell us that management involvement in safety is an important factor in occupational injury occurrence at the workplace [33,34]. A more positive safety climate at the workplace might result in injury reduction, which could be advantageous for the organizations. This may lead to improved health and performance among the employees, lower compensation costs, fewer employee turnovers, lower insurance premium costs, and fewer working hours lost.
To achieve improved safety at the workplaces in the present study, the management must demonstrate and uphold leadership integrity about workplace health and safety practices. Management must make sure that the priority at the workplace is focused on safety rather than production for the mutual and long-term benefits between the industry and workers. Management should empower workers in all aspects related to health and safety in the workplace, which will make the workers feel as if they are an integral part of the organization and in turn will enhance adherence to OHS policies, procedures, and practices in the workplace and ultimately aid in accident prevention. Safety education of both management and workers is warranted, as well as support from authorities in Tanzania to make this possible.
The Strengths and Limitations of the Study
This is the first study conducted in Tanzania assessing the safety climate and occupational injuries in iron- and steel-industries. The response rate in this study was high, as the workers were very willing to provide information. However, the study has some limitations as it was designed as a cross-sectional study. We cannot evaluate any cause-effect relationship between safety climate and occupational injuries. We do not know if experiencing injuries leads to an opinion of an insufficient safety climate, or if it is the other way around. However, we do know that the safety climate is not optimal, and the number of injuries is too high and can suggest improving safety in the companies based on this information. For instance, a priority seems to be that the management in the companies needs training and motivation. Future studies in this area should have a longitudinal study design to capture the relationship between time patterns of the safety climate and injury occurrences. Also, we used self-reports to obtain the data. Self-reports might have produced some information bias, as the workers might not remember or remember wrongly the accidents and injuries that had happened. Though, we utilized a validated tool for obtaining the injury information, and asked only for the period of the past year. This might have minimized the information bias. Asking workers questions related to safety within their workplace might make the respondents fear providing the true information by thinking that the management will get informed and depict the company in a more favorable or unfavorable light. To minimize this, precautions were taken by using a private room and informing respondents that their identities would remain secret and that our findings would be published anonymously. Also, we used the Swahili NOSACQ 50-validated tool to obtain data on safety climate, and this makes it likely that the results were valid.
This study was conducted in Tanzania, and most findings are relevant also to other similar factories in the iron- and steel-industries in the country. However, one should be careful when generalizing the findings to other countries due to the variation in occupational health and safety policies, regulations and practices. Nevertheless, similar findings might be observed in similar factory sites in other low and middle-income countries.
5. Conclusions
This study showed a low safety climate score among workers in the iron- and steel- industries. Managers/supervisors had higher mean safety scores than the workers. Associations between safety climate scores (‘management safety priority and ability’ and ‘management safety justice’) and occupational injuries were demonstrated. The findings show that there is a need for safety improvement in this industry.
Author Contributions
S.S. conceived the study, collected data, conducted data analysis, and wrote the first draft of the manuscript. S.H.D.M. conceived the study and reviewed the manuscript. B.E.M. reviewed the manuscript. T.A. reviewed the manuscript. All authors have read and agreed to the published version of the manuscript.
Funding
This research was funded by NORAD through the NORHED programme (Norwegian Program for Capacity Development in Higher Education and Research for Development) via the NORHED II SAFE WORKERS PROJECT.
Institutional Review Board Statement
This study was conducted according to the guidelines of the Declaration of Helsinki and approved by the Publications Committee of Muhimbili University of Health and Allied Sciences on 31/03/2022 with approval number MUHAS-REC-03-2022-1061.
Informed Consent Statement
All participants were informed about the study and gave their written consent before the interview was performed.
Data Availability Statement
Data for this study that supports its findings are available upon reasonable request from the corresponding author. .
Acknowledgments
We are most grateful Special thanks go to Mr Matiku and Dr. Materu from OSHA for their invaluable support and cooperation. Last but not least, we would like to sincerely thank the Management team, health and safety officers in the participating factories of iron and steel industries and workers who consented to be involved in this study.
Conflicts of Interest
The authors declare no conflicts of interest.
References
- Dutta, S.K.; Chokshi, Y.B. Basic Concepts of Iron and Steel Making; 1st ed.; Springer Nature: Singapore, 2020; pp. 293–496.
- Basha, S.A.; Maiti, J. Relationships of Demographic Factors, Job Risk Perception and Work Injury in a Steel Plant in India. Saf. Sci. 2013, 51, 374–381. [Google Scholar] [CrossRef]
- Vajda, P.; Aleksić, V.; Hunter, T. Environmental Aspects. In Commentary on the Energy Charter Treaty; Edward Elgar Publishing, 2018; pp. 269–281.
- Shabani, S.; Mamuya, S.H.; Moen, B.E. The Prevalence of Occupational Injuries and Associated Risk Factors among Workers in the Iron and Steel Industries : A Systematic Review and Meta-Analysis. BMC Public Health 2024, 24, 1–12. [Google Scholar] [CrossRef]
- Shabani, S.; Moen, B.E.; Deressa, W.; Mamuya, S.H. Prevalence of Occupational Injuries among Workers in the Iron and Steel Industries in Tanzania. Ann. Glob. Heal. 2025, 91, 9. [Google Scholar] [CrossRef] [PubMed]
- Kifle, M.; Engdaw, D.; Alemu, K.; Sharma, H.R.; Amsalu, S.; Feleke, A.; Worku, W. Work Related Injuries and Associated Risk Factors among Iron and Steel Industries Workers in Addis Ababa, Ethiopia. Saf. Sci. 2014, 63, 211–216. [Google Scholar] [CrossRef]
- National Bureau of Statistics (NBS) and the Ministry of Industry, Trade and Investment (MITI), The 2013 Census of Industrial Production: Summary Report. Dar Es Salaam, Tanzania, 2016. https://www.nbs.go.tz/uploads/statistics/documents/en-1705493816-Census_of_Industrial_Production_2013-Summary_Report.pdf (accessed 7-7-2025).
- Neal, A.; Griffin, M.A.; Hart, P.M. The Impact of Organizational Climate on Safety Climate and Individual Behavior. Saf. Sci. 2000, 34, 99–109. [Google Scholar] [CrossRef]
- Zohar, D. Safety Climate in Industrial Organizations: Theoretical and Applied Implications. J. Appl. Psychol. 1980, 65, 96. [Google Scholar] [CrossRef] [PubMed]
- Hertanto, A.; Erwandi, D.; Widanarko, B.; Tejamaya, M. Relationship between Safety Climate and Safety Behavior in Company X in Indonesia. Safety 2023, 9, 89. [Google Scholar] [CrossRef]
- Cavazza, N.; Serpe, A. Effects of Safety Climate on Safety Norm Violations: Exploring the Mediating Role of Attitudinal Ambivalence toward Personal Protective Equipment. J. Safety Res. 2009, 40, 277–283. [Google Scholar] [CrossRef]
- Christian, M.S.; Bradley, J.C.; Wallace, J.C.; Burke, M.J. Workplace Safety: A Meta-Analysis of the Roles of Person and Situation Factors. J. Appl. Psychol. 2009, 94, 1103. [Google Scholar] [CrossRef]
- Clarke, S. The Relationship between Safety Climate and Safety Performance: A Meta-Analytic Review. J. Occup. Health Psychol. 2006, 11, 315. [Google Scholar] [CrossRef]
- Ajslev, J.Z.N.; Sundstrup, E.; Jakobsen, M.D.; Kines, P.; Dyreborg, J.; Andersen, L.L. Is Perception of Safety Climate a Relevant Predictor for Occupational Accidents? A Prospective Cohort Study among Blue-Collar Workers. Scand. J. Work. Environ. Health 2018, 44, 370–376. [Google Scholar] [CrossRef]
- Hon, C.-Y.; Randhawa, J.; Lun, N.; Fairclough, C.; Rothman, L. Comparison of Management and Workers’ Perception, Attitudes and Beliefs toward Health and Safety in the Ontario Manufacturing Sector. J. Safety Res. 2023, 84, 364–370. [Google Scholar] [CrossRef] [PubMed]
- Fargnoli, M.; Lombardi, M. NOSACQ-50 for Safety Climate Assessment in Agricultural Activities: A Case Study in Central Italy. Int. J. Environ. Res. Public Health 2020, 17, 1–20. [Google Scholar] [CrossRef]
- Fargnoli, M.; Lombardi, M. Safety Climate and the Impact of the COVID-19 Pandemic: An Investigation on Safety Perceptions among Farmers in Italy. Safety 2021, 7, 52. [Google Scholar] [CrossRef]
- Arooj, A.; Majid, M.; Alam, A.; Bilal, M.F. Assessment of Workplace Safety Climate among Power Sector Employees: A Comparative Study of Cross-Culture Employer in Pakistan. PLoS One 2022, 17, e0272976. [Google Scholar] [CrossRef] [PubMed]
- Wibowo, A.; Lestari, F.; Modjo, R. Safety Climate Assessment in Fuel Stations in the West Java Region. Safety 2023, 9, 9. [Google Scholar] [CrossRef]
- Sepp, J.; Järvis, M. Relationship between Nursing Home Safety Climate and Caregivers’ Competence. Econ. Bus. 2019, 33, 247–263. [Google Scholar] [CrossRef]
- Moda, H.M.; Dama, F.M.; Nwadike, C.; Alatni, B.S.; Adewoye, S.O.; Sawyerr, H.; Doka, P.J.S.; Danjin, M. Assessment of Workplace Safety Climate among Healthcare Workers during the COVID-19 Pandemic in Low and Middle Income Countries: A Case Study of Nigeria. Healthcare 2021, 9, 661. [Google Scholar] [CrossRef]
- Ramirez, L.S.M. Safety Climate, Safety Hazards and Organizational Practices in the Construction Industry in Colombia, University of Massachusetts Lowell, Boston, 2014.
- Abegaz, T.; Deressa, W.; Moen, B.E. The Relationship Between Safety Climate and Safety Performance in the Large-Scale Building Construction Industry in Ethiopia: A Structural Equation Model Using the NOSACQ-50 Tool. Safety 2025, 11, 28. [Google Scholar] [CrossRef]
- Alamoudi, M. The Integration of NOSACQ-50 with Importance-Performance Analysis Technique to Evaluate and Analyze Safety Climate Dimensions in the Construction Sector in Saudi Arabia. Buildings 2022, 12, 1855. [Google Scholar] [CrossRef]
- Cheyne, A.; Tomas, J.M.; Cox, S.; Oliver, A. Perceptions of Safety Climate at Different Employment Levels. Work Stress 2003, 17, 21–37. [Google Scholar] [CrossRef]
- Huang, Y.; Robertson, M.M.; Lee, J.; Rineer, J.; Murphy, L.A.; Garabet, A.; Dainoff, M.J. Supervisory Interpretation of Safety Climate versus Employee Safety Climate Perception: Association with Safety Behavior and Outcomes for Lone Workers. Transp. Res. part F traffic Psychol. Behav. 2014, 26, 348–360. [Google Scholar] [CrossRef]
- Kifle, M.; Engdaw, D.; Alemu, K.; Rai, H.; Amsalu, S.; Feleke, A.; Worku, W. Work Related Injuries and Associated Risk Factors among Iron and Steel Industries Workers in Addis Ababa, Ethiopia. Saf. Sci. 2014, 63, 211–216. [Google Scholar] [CrossRef]
- National Research Centre for the Working Environment. Interpreting the Nordic Occupational Safety Climate Questionnaire NOSACQ-50 results. https://nfa.dk/vaerktoejer/spoergeskemaer/safety-climate-questionnaire-nosacq-50/how-to-use-the-nordic-occupational-safety-climate-questionnaire-nosacq-50/interpreting-the-nordic-occupational-safety-climate-questionnaire-nosacq-50. (accessed Jul 7, 2025).
- Kines, P.; Lappalainen, M.; Pousette, T.; TÃmasson, T. Nordic Occupational Safety Climate Questionnaire. NOSACQ-50: A new tool for diagnosing occupational safety climate. Int. J. Ind. Ergon. 2015. [Google Scholar] [CrossRef]
- Taswell, K.; Wingfield-Digby, P. Occupational Injuries Statistics from Household Surveys and Establishment Surveys; Intern. labour office, 2008; pp. 19–105.
- Nielsen, K.J.; Rasmussen, K.; Glasscock, D.; Spangenberg, S. Changes in Safety Climate and Accidents at Two Identical Manufacturing Plants. Saf. Sci. 2008, 46, 440–449. [Google Scholar] [CrossRef]
- Milczarek, M.; Najmiec, A. The Relationship between Workers’ Safety Culture and Accidents, near Accidents and Health Problems. Int. J. Occup. Saf. Ergon. 2004, 10, 25–33. [Google Scholar] [CrossRef] [PubMed]
- Min, J.; Jang, T.-W.; Lee, H.-E.; Kang, M.-Y.; Cho, S.-S. Association between the Safety Climate and Occupational Injury in the Korean Working Population: A Cross-Sectional Study. Epidemiol Heal. 2024. [Google Scholar] [CrossRef]
- Hsieh, C.-M.; Chen, C.-J.; Peng, T.-T.; Chen, S.; Chen, P.-H. The Relationship between Workplace Justice and Self-Reported Occupational Accidents in Construction Employees of Taiwan. Ind. Health 2020, 58, 282–286. [Google Scholar] [CrossRef]
- Kim, S.J.; Chung, E.K. The Effect of Organizational Justice as Perceived by Occupational Drivers on Traffic Accidents: Mediating Effects of Job Satisfaction. J. Safety Res. 2019, 68, 27–32. [Google Scholar] [CrossRef]
- Marin, L.S.; Lipscomb, H.; Cifuentes, M.; Punnett, L. Perceptions of Safety Climate across Construction Personnel: Associations with Injury Rates. Saf. Sci. 2019, 118, 487–496. [Google Scholar] [CrossRef]
Figure 1.
Types of occupational injuries among workers in the iron and steel industry.
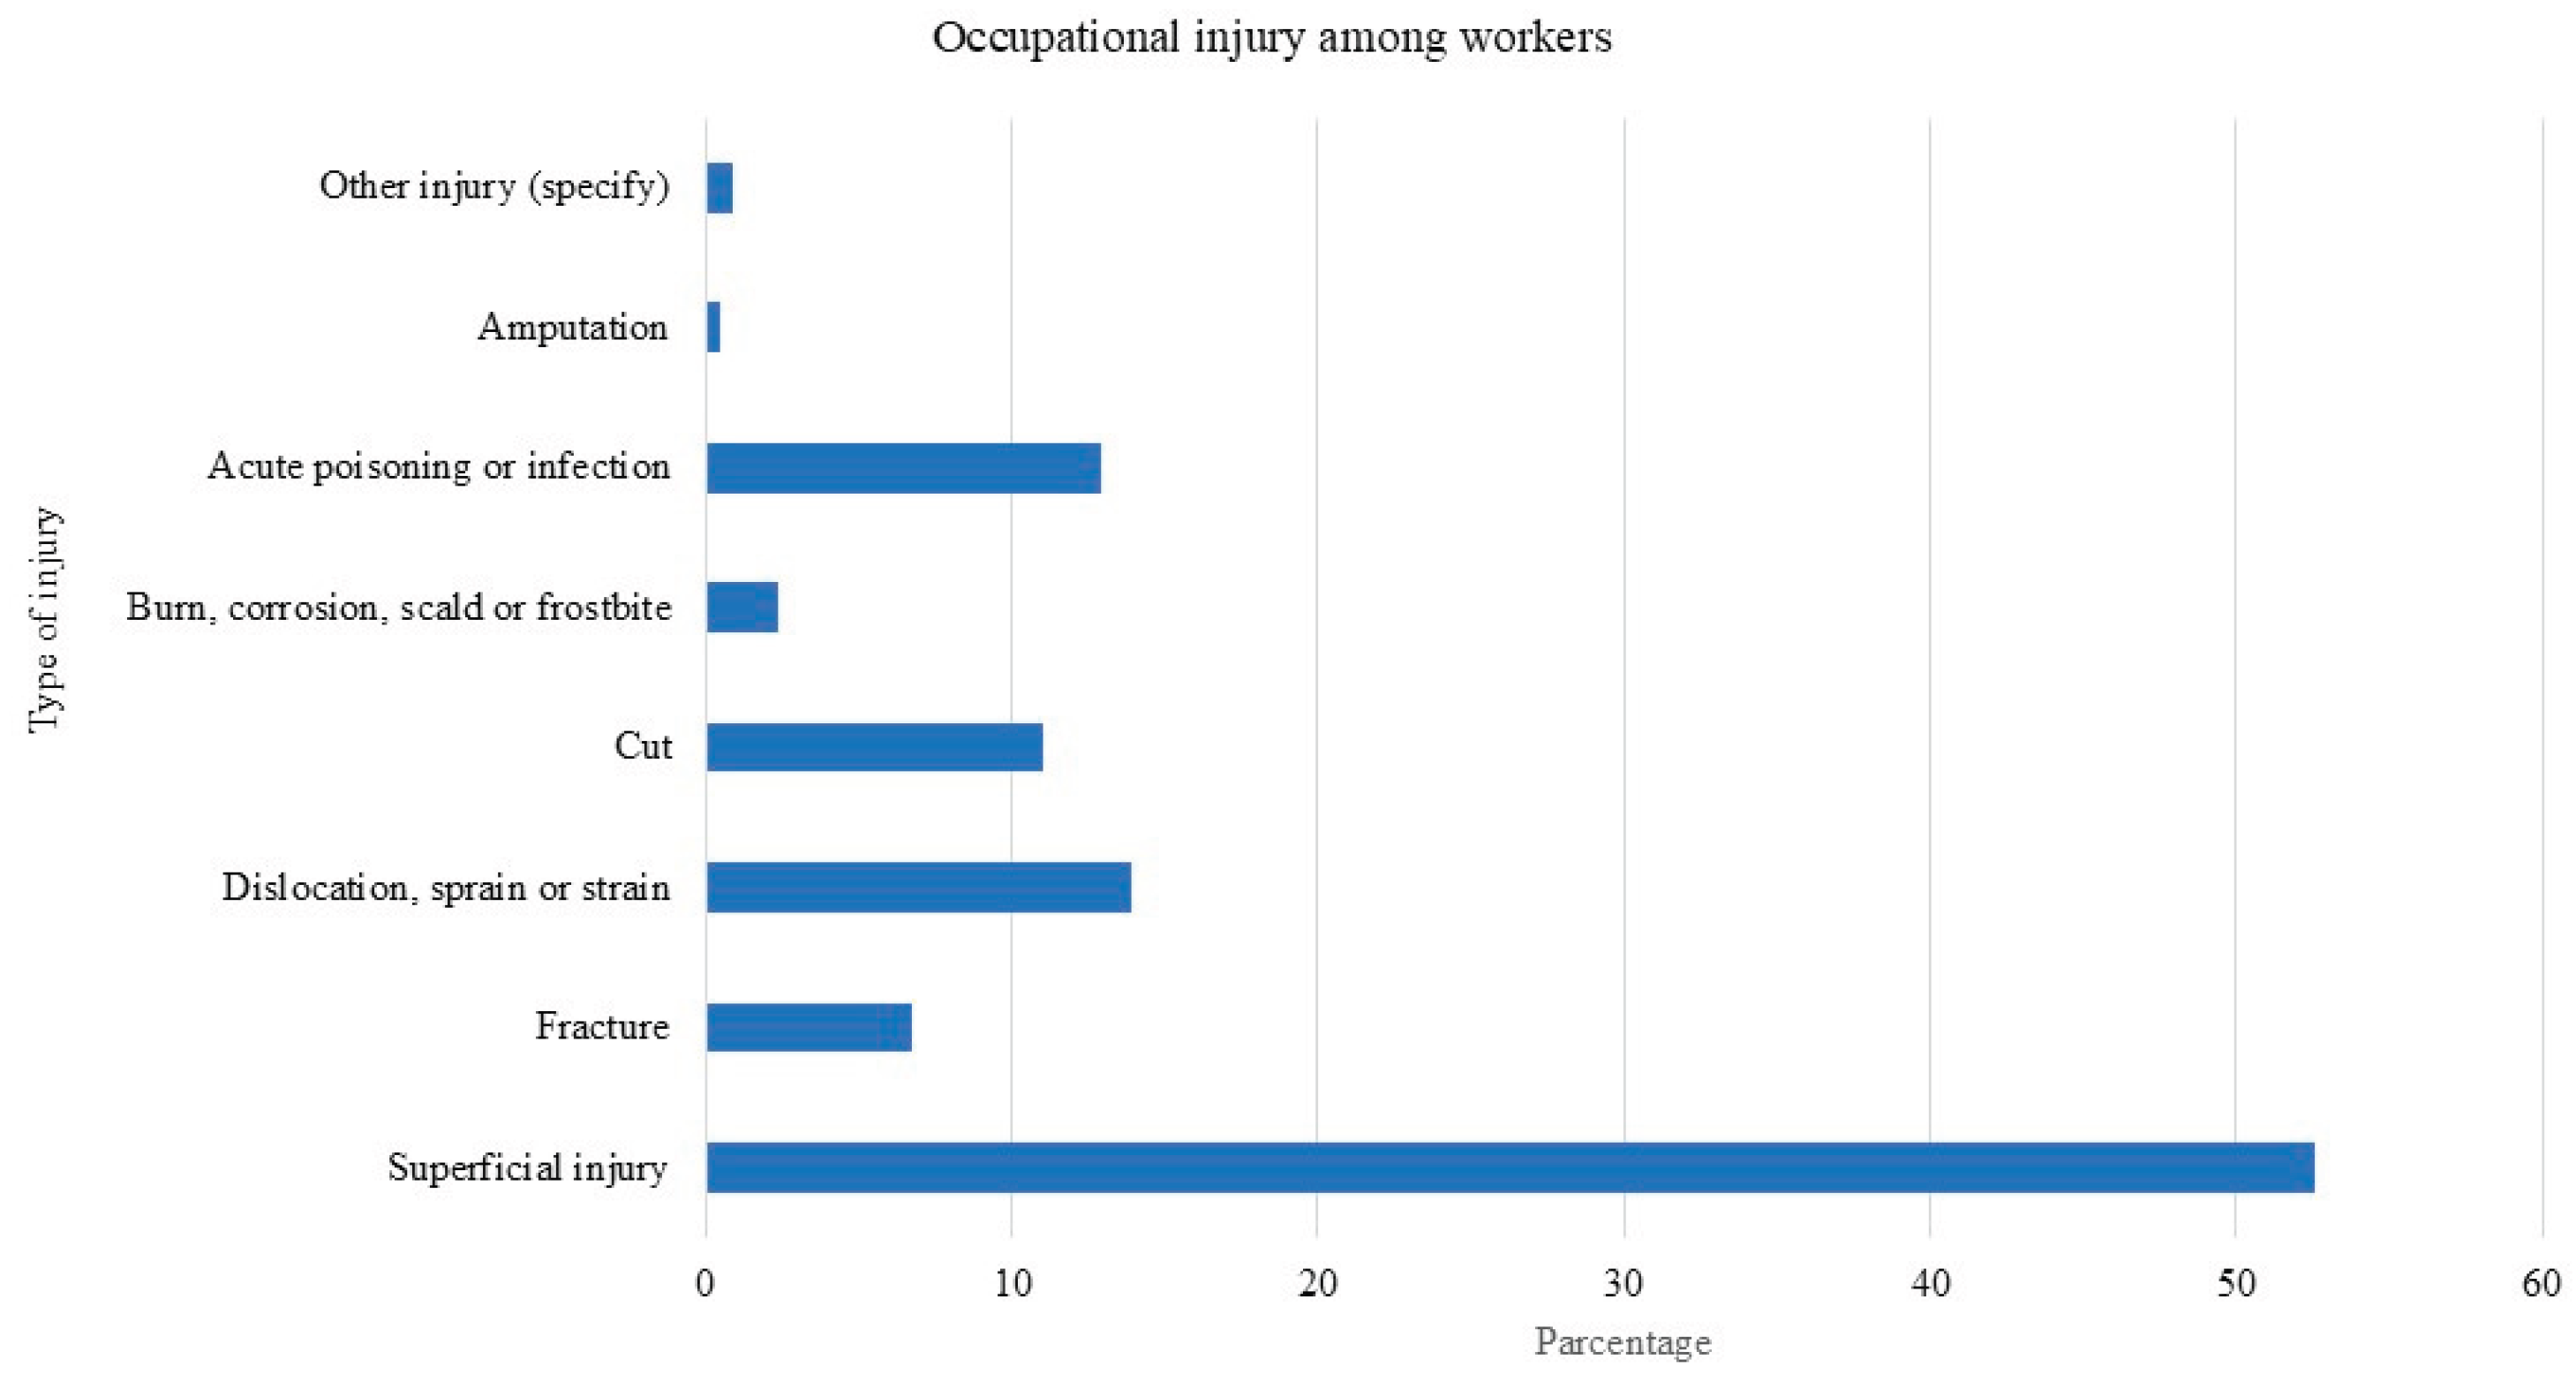

Table 1.
Socio-demographic characteristics among 371 workers in the iron- and steel-industries.
| Variable | Workers (n=321) | Managers/Supervisors (n=50) | P-Value | |
|---|---|---|---|---|
| Age group | No (%) | No (%) | ||
| 18-30 | 179 (56) | 31 (62) | 0.1212 | |
| 31-44 | 107 (33) | 18 (36) | ||
| ≥45 | 35 (11) | 1 (2) | ||
| Education | ||||
| Never being in school | 19 (6) | - | ||
| Primary school | 133 (41) | 3 (6) | 0.0002* | |
| Secondary school and above | 169 (53) | 47(94) | ||
| Marital status | ||||
| Never married | 83(26) | 18(36) | 0.1341 | |
| Ever married | 238(74) | 32(64) | ||
| ‘Factory | ||||
| A | 96(31) | 12(24) | ||
| B | 60(19) | 15(30) | 0.340 | |
| C | 92 (29) | 13 (26) | ||
| D | 70(22) | 10(20) | ||
| Section | ||||
| Furnace | 139(43) | - | - | |
| Rolling mill | 182(57) | |||
| Working years | ||||
| 1-4years | 245 (76) | 28(56) | 0.0031 | |
| > 4years | 76 (24) | 22(44) | ||
| Working hours per day | ||||
| ≤10 hours | 77(24) | 10(20) | 0.3371 | |
| > 10 hours | 244(76) | 40(80) |
1Chi-square test. 2Fishers exact test.
Table 2.
A comparison of answers from workers and managers/supervisors of the mean scores of 7 Nordic safety climate dimensions.
Table 2.
A comparison of answers from workers and managers/supervisors of the mean scores of 7 Nordic safety climate dimensions.
| Dimension | Managers or Supervisors Mean rank |
Workers Mean rank | Mann- Whitney |
P-Value1 |
| Management safety priority and ability | 165.73 | 189.16 | 7,011.500 | 0.150 |
| Management safety empowerment | 251.46 | 175.80 | 11,298.000 | <0.001 |
| Management safety justice | 265.55 | 173.61 | 12,002.500 | <0.001 |
| Worker safety commitment | 41.12 | 208.57 | 781.000 | <0.001 |
| Workers’ safety priority and risk non-acceptance | 219.88 | 180.72 | 9719.000 | 0.016 |
| Peer safety communication, learning, and trust in safety ability |
112.84 | 197.40 | 4367.000 | <0.001 |
| Workers’ trust in the efficacy of safety systems | 232.79 | 178.71 | 10364.500 | 0.001 |
1Mann-Whitney test.
Table 3.
Association between safety climate score and occupational injuries the past year among workers in the production line of iron- and steel-industries.
Table 3.
Association between safety climate score and occupational injuries the past year among workers in the production line of iron- and steel-industries.
| Variables | Occupational injury | Univariate COR (95%CI) | Multivariate AOR (95%CI) | |
| Yes (N= 209) | No (N=112) | |||
| Management safety priority and ability |
||||
| Good | 26 (27.3) | 59(72.7) | 1 | 1 |
| Low | 183(80.4) | 53(19.6) | 7.835(4.51-13.63) * | 6.73(3.65-12.41) * |
| Management safety empowerment | ||||
| Good | 78(42.5) | 60(57.5) | 1 | 1 |
| Low | 131(70.7) | 52(29.3) | 1.94(1.22-3.09) * | 0.98(0.55-1. 75) |
| Management safety justice | ||||
| Good | 51(29.6) | 56(70.4) | 1 | 1 |
| Low | 158(92.3) | 56(7.7) | 3.09(1.90-5.04) * | 1.80 (1.02-3.19) * |
| Worker safety commitment | ||||
| Good | 84(57.1) | 45(42.9) | 1 | - |
| Low | 125(68.1) | 67(31.9) | 0.999 (0.626-1.596) | - |
| Workers’ safety priority and risk non-acceptance | ||||
| Good | 16(57.1) | 12(42.9) | 1 | - |
| Low | 193(65.9) | 100(34.1) | 1.447(0.659-3.178) | - |
| Peer safety communication, learning, and trust in safety ability | ||||
| Good | 171(29.6) | 83(70.4) | 1 | 1 |
| Low | 38(92.3) | 29(7.7) | 0.64 (0.37-1.10) | 0.666 (0.35-1.25) |
| Workers’ trust in the efficacy of safety systems | ||||
| Good | 154 (65) | 83(35) | 1 | - |
| Low | 55 (65.5) | 29(34.5) | 1.022(0.606-1.724) | - |
| Working years (Experience) | ||||
| 1-4years | 169(69) | 76 (31) | 2.001 (1.183-3.384) | |
| > 4years | 40(52,3) | 36(47.4) | 1 | |
| Working hours per day | ||||
| ≤10 hours | 38(49.4) | 39 (50.6) | 1 | |
| >10 hours | 171(70.1) | 73(29.9) | 2.404 (1.423-4.060) | |
* Adjusted for working years and working hours. COR= crude odds ratio, AOR=adjusted odds ratio, 95% CI=95% confidence interval.
Disclaimer/Publisher’s Note: The statements, opinions and data contained in all publications are solely those of the individual author(s) and contributor(s) and not of MDPI and/or the editor(s). MDPI and/or the editor(s) disclaim responsibility for any injury to people or property resulting from any ideas, methods, instructions or products referred to in the content. |
© 2025 by the authors. Licensee MDPI, Basel, Switzerland. This article is an open access article distributed under the terms and conditions of the Creative Commons Attribution (CC BY) license (http://creativecommons.org/licenses/by/4.0/).
Copyright: This open access article is published under a Creative Commons CC BY 4.0 license, which permit the free download, distribution, and reuse, provided that the author and preprint are cited in any reuse.


