Submitted:
08 July 2025
Posted:
09 July 2025
You are already at the latest version
Abstract
This study aims to investigate the vibrational, structural, morphological, optical and magnetic properties of Zn1-xCoxO with 0.00x0.05, prepared by sol-gel method via amorphous citrate precursor. FTIR spectroscopy has been used to follow the mecha-nism of thermal decomposition process of ZnO precursor. XRD and FTIR-ATR tech-niques showed only the single wurtzite crystalline phase with the presence of oxygen deficiency and/or vacancies, and secondary phases were not detected. SEM micro-graphs shown agglomerated particles of irregular shape and size with a high distribu-tion, evidenced particles of nanometric size with a morphology change for x=0.05. We detected high spin Co2+ ions located in tetrahedral core and pseudo-octahedral surface sites, substituting Zn2+ ions. The energy band gap of the ZnO semiconductor decreases gradually by increasing the Co doping concentration. M vs H for undoped ZnO nano-particles exhibited a diamagnetic overlapped with a weak ferromagnetic signal at room temperature. Interestingly, temperature dependent magnetization showed a su-perparamagnetic behavior with a blocked state in the low temperature range. The Co doped ZnO samples evidenced a weak ferromagnetic signal and a paramagnetic com-ponent, which increased with x. The saturation magnetization increased until x=0.03 and then decreased for x=0.05, while the coercive field gradually decreased.
Keywords:
TGA-FTIR
; XRD
; FTIR
; SEM
; magnetic properties
; RTFM
1. Introduction
Studies on the physical and chemical properties of a wide range of nanometric systems currently occupies one of the most important areas of investigation both basic and applied science. Variations in the composition of these materials can modify and/or combine more than one property, opening the door to new and interesting lines of research in the development of nanomaterials with a great variety of potential applications. Semiconductor oxides such as ZnO, TiO2, SnO2, WO3 In2O3, CuO, among others, have received a lot of attention from researchers because of the execution of many and novel applications [1]. The ZnO is highlighted as a broad band-gap (3.37 eV), a large exciton binding energy (60 meV), it has good transparency, high electron mobility, high thermal and mechanical stability at room temperature (RT). Besides, it has non-toxicity and non-hazardous properties. Additionally, ZnO is a promising material due to its unique optical and electrical properties, which make it suitable for applications, including optoelectronic and photonics devices, photocatalysts, solar cells, supercapacitors, fingerprint technologies, gas sensors, water treatment, energy storage, dye-sensitized solar cells, biomedical sciences (antibacterial, anti-oxidant, drug delivery), etc [1,2,3,4,5]. These potential applications can be controlled and improved in ZnO when small percentages of impurities are introduced into its crystalline structure. Among these dopants, metal transition (MT) and rare earth are ideal candidates to achieve RT ferromagnetism (FM) to create a new generation of devices based on spintronics [6]. Whitin of the MT elements, in particular, cobalt doped ZnO has exhibited higher ferromagnetic properties, with high magnetization saturation (Ms) at RT and improved optical properties making it a suitable material in this field [7]. It is well known that the physical and chemical properties of Co doped ZnO nanoparticles strongly depend on the choice of the chemical synthesis method, starting reactants and conditions during samples preparation. Different chemical methods have been used to synthesize Co doped ZnO powder such as co-precipitation [8,9], hydrothermal [10], green synthesis [11,12], sonochemical [13], microwave assisted [14], sol-gel [15], sol-gel auto-combustion [16,17], modified Pechini sol-gel [18], amorphous citrate route, etc [19]. Sol-gel method based on the amorphous citrate route is a simple and easily reproducible method due to that there is not too handling in the process. Besides, the method is low-cost, environmentally friendly, scalable, offers control over the material composition and permits the mixing of chemicals at the atomic level and yields nanopowders with a fairly narrow particle size distribution depending on the sintered final temperature [20].
This study aims mainly focused on presenting a qualitative, quantitative and careful investigation of the vibrational, morphological, crystallographic, optical and magnetic properties of Zn1-xCoxO with (0.00≤ x≤ 0.05). The paper describes the mechanism of the decomposition of ZnO polymeric precursor. The variation in the studied properties as a function of Co concentration are discussed in detail.
2. Materials and Methods
2.1. Samples Preparation
Zn1−xCoxO (0.00≤ x≤ 0.05) nanopowders, where x represents the nominal molar concentration, were prepared by sol-gel method, via amorphous citrate precursor. In a beaker of 250 mL, required amounts (to obtained theoretically 1 g of sample) of Zn(NO3)2·6H2O, Co(NO3)2·6H2O, citric acid (CA) monohydrate, with a molar ratio [(Zn + Co)/CA)] 1:3, and 100 mL of double distilled water and deionized were mixed for the preparation of the starting sol. The pH of the solution was not varied. The resultant sol was heated slowly on a hot plate at 80 °C under constant stirring. The solution was maintained to this temperature, to evaporate the solvent and to promote the polymerization, until the bar stirring stopped by itself. In this last step, the solution became more viscous and finally turned into a wet gel. The wet gel thus formed was dried at 120 °C for 6 h resulting in a solid mass, which is known as the polymeric precursor. Afterward, this powder was hand ground in an agate mortar and sieved through 150 μm sieve and finally annealed in a tubular furnace at 450 °C (heating rate: 5 °C min), for 1 h.
2.2. Characterization Techniques
The thermal decomposition of the polymeric precursors was studied by thermogravimetric analysis (TGA) using a TA Instruments SDT Q600. The samples were analyzed at a heating rate of 10 °C/min in an air atmosphere from RT to 600 °C. The Fourier transform infrared-attenuated total reflectance (FTIR-ATR) spectroscopy of the samples were recorded using a Thermo Scientific Nicolet iS5 with iD7 accessory. The scanning electron microscope JEOL JSM 6490 was utilized to obtain SEM images and EDS spectra. X-ray diffraction (XRD) patterns were collected at RT using a Aeris Malvern-PANalytical with Pixel 3D detector with Cu-Kα source (λ = 1.5406 Å) in Bragg-Brentano geometry. The data were carried out in the range 20-80 in 2θ with a step of 0.022° and step time of 29 s. The loose powder samples were leveled in the sample holder and mounted on a rotatory disk to ensure a smooth surface and homogeneity in the data collected. The XRD patterns were fitted using the MAUD program, to obtain crystal lattice parameters and average crystallite size (Dv). RT optical absorption spectra in the ultraviolet and visible light wavelengths were measured using an UV-VIS Varian Cary 100 Bio Spectrophotometer fitted with an integrating sphere diffuse reflectance accessory. Due to that the technique is sensitive to the sample amount, similar weights were used to carry out the analysis under the same conditions. The magnetic properties of the samples were studied using a PPMS (Physical Property Measurement System) Model 6000 (Quantum Design, San Diego, California) equipped with a superconducting magnet. The magnetic measurements were carried out as a function of the applied magnetic field (±0.5 T), at 300 K and as a function of temperature (10-300 K). The magnetic measurements were replicated and the results shown are an average of the data.
3. Results and Discussions
3.1. Thermogravimetric Analysis
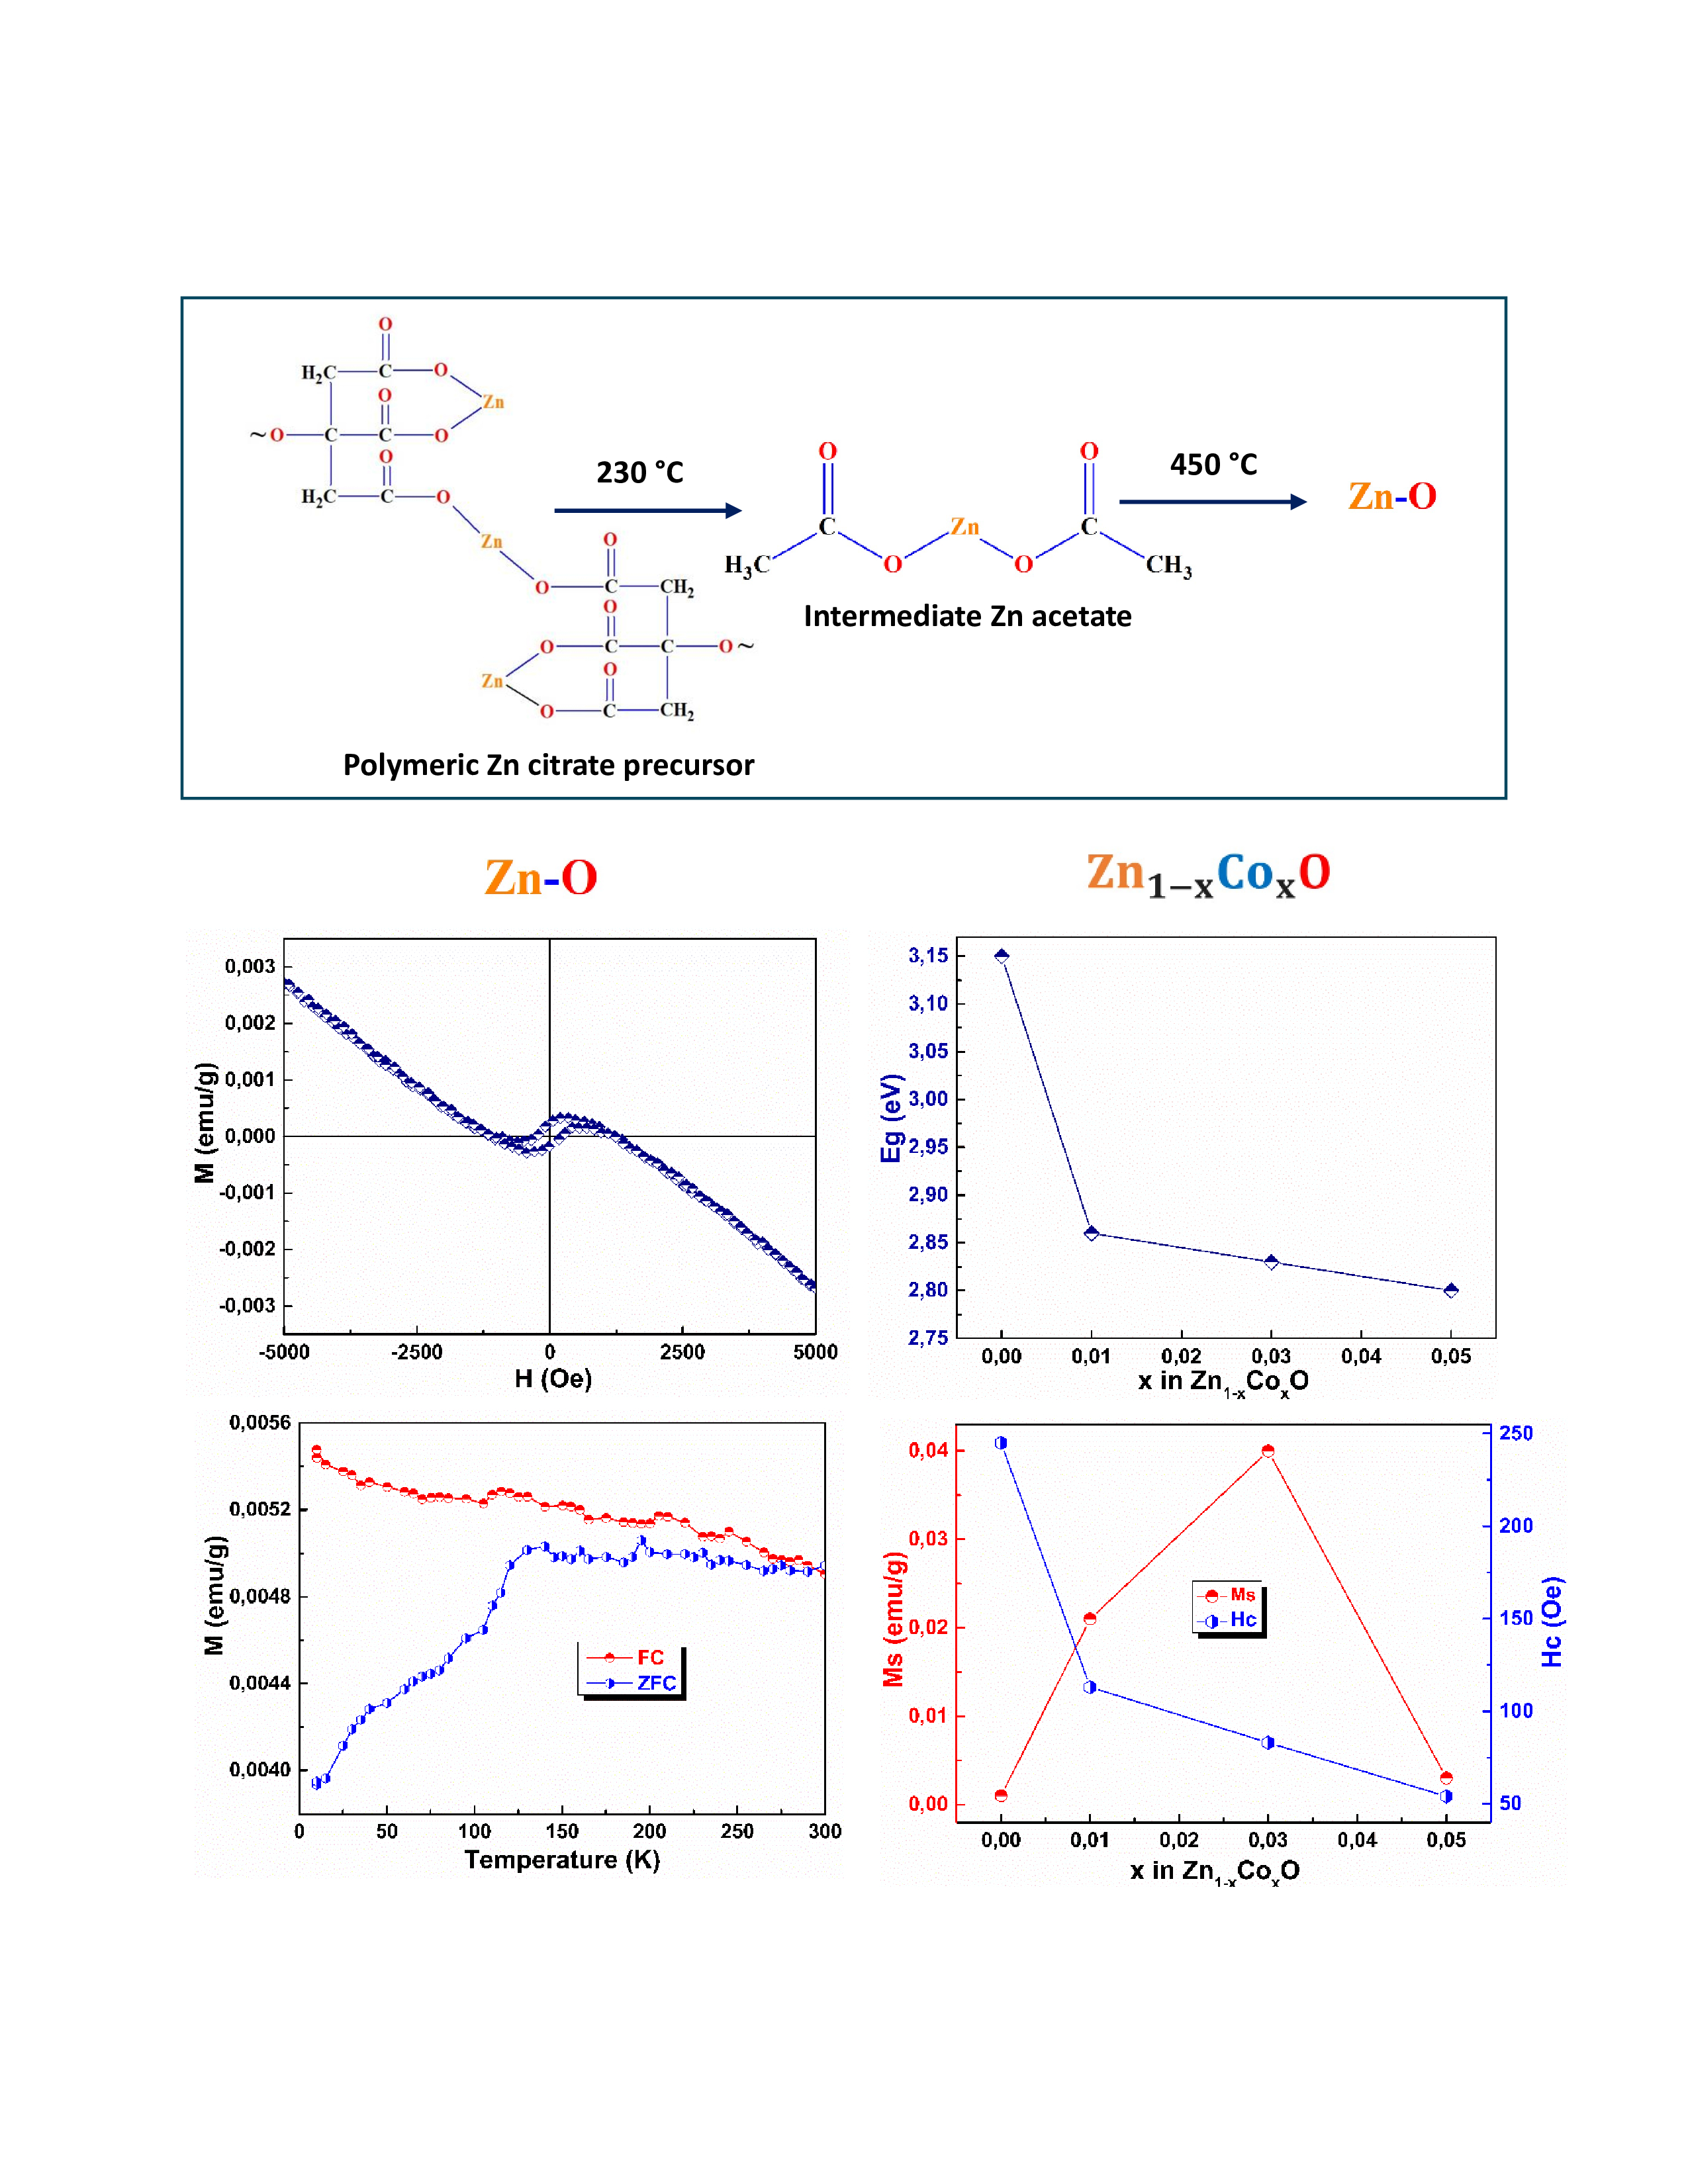
The first step in synthesizing ZnO nanoparticles by sol-gel method via citrate amorphous precursor process, is the metallic chelate formation through the reaction between the zinc nitrate hexahydrate and citric acid monohydrate. Due to that the Zn source is the limiting reactant, there is an excess of CA. During the gelation process (80 °C), by means an esterification reaction in acid media, polymeric chains are formed and NO3- anions are eliminated as nitrogen oxide and molecular oxygen. After the drying process (120 °C), the gel is transformed into the precursor polymeric, very probably constitutes by nonuniform polymeric chains. Figure 1 shows TGA/DTG curves, where DTG is the first derivative of the TGA, of undoped ZnO and Zn0.95Co0.05O precursor powders. The different stages of the thermal decomposition process and their respective weight loss are shown in the Figure. For both curves are observed five similar regions in weight loss in the thermal decomposition process. The thermal decomposition process of ZnO precursor polymeric was studied by FTIR spectroscopy. Figure 2 shows FTIR spectra of their products decomposition sintered at 170, 230, 310 and 450 °C. As can be seen, initially (RT) the spectrum does not appear to contain water of crystallization, since the hydroxyl band observed at 3470 cm-1 is quite sharp and too weak, due to that gel was previously dried at 120 °C for 6 h. In the spectrum, are observed typical bands associated to CA and zinc citrate [21,22,23]. The broad band from 2700-3100 cm-1 can be assigned to O–H y C–H bonds stretching, indicative of the formation of a material with polymeric properties. This spectrum is similar to that reported by [23] The first weight loss (25-170 °C), can be ascribed to the elimination of absorbed or superficial water molecules. In this stage, takes place the thermal degradation of the CA free and the depolymerization zinc citrate, due to the reduction of the intensities of the bands compared to that of the sample without thermal treatment (RT). The band of the α-hydroxy group of free CA disappears (green circle) as a result of a dehydration reaction, presumably leading to the formation of free aconitic acid [22]. The sharp -OH band observed in the IR spectrum of the original sample has now disappeared. In the second weight loss (170-230 °C), almost complete reduction in the intensity of the citrate bands is observed and appear two strong bands at 1560 and 1446 cm-1, (orange circle) indicating the partial decomposition of citrate zinc, forming zinc acetate, Zn(CH3COO)2 [24]. This is confirmed by the reduction of the Zn-O vibration stretching in the fingerprint region (purple circle). In another hand, the appearance of two additional bands located at 1770 and 1080 cm-1 (yellow circle) confirm the conversion of free aconitic acid to free itaconic acid [22]. The next stage in weight loss (230-315 °C) could be attributed to the thermal decomposition of zinc acetate, forming ZnO and the decomposition of free itaconic acid [22]. The fourth stage in the range of 315 to 370 °C could be ascribed to the degradation of decomposition subproducts of the CA through a process of combustion/oxidation, in a reaction strongly exothermic, where the total the crystallization of ZnO take place. Finally, in the last stage (370–450 °C), the elimination of a small amount of any residual carbonaceous material. By comparing the TGA/DTG curves of the Co-doped ZnO precursor with those of pure ZnO (Figure 1b), an additional peak is observed in the third stage, and the fourth stage of thermal decomposition occurs at a higher temperature than in pure ZnO. These differences could be associated with the formation of different of metallic citrate molecules (Zn and Co), indicating the effect of doping incorporation in the polymeric network.
3.2. FTIR-ATR
Figure 3 displays FTIR-ATR spectra of Zn1-xCoxO samples with x= 0.00, 0.01, 0.03 and 0.05. In the spectrum of pure ZnO sample are observed two strong bands. The first centered around 410 cm-1 is attributed to antisymmetric stretching vibration modes of O-Zn-O bonds in tetrahedral coordination, into wurtzite crystalline structure [25], while the second one, about 520 cm-1 may be attributed to oxygen deficiency and/or vacancies in ZnO [26,27]. From the Figure is observed that with increases of doping concentration, the O-Zn-O mode at 410 cm-1 systematically shifts to higher wavenumber, indicating the incorporation and/or replacement of ions Co into the ZnO structure modifying the O-Zn-O bonds. In fact, if cobalt substitutes zinc at their lattice sites, the vibrational modes must shift toward higher wavenumber regions, given that the atomic mass of Co (58.93 u.m.a) is lower than that of Zn (65.38 u.m.a). In another hand, the band associated to oxygen deficiency does not change appreciably in intensity and position (blue line), indicating that the vacancies are probably bulk defects [28].
3.3. SEM Micrographs
SEM micrographs (15000 X-1μm) of Zn1-xCoxO with x =0.00, 0.01, 0.03 and 0.05 samples are shown in left part of Figure 4. The image of pure ZnO sample reveals that the crystals are constituted by agglomerated particles of irregular shape and size with a high distribution, evidenced particles of nanometric size. With increasing cobalt concentration, an appreciable change in the particle’s morphology is not observed, but a higher particle size in Zn0.95Co0.05O sample is evidenced. Additionally, from the micrographs is possible to observe a gradual increase in the porosity with the increase of the Co concentration, which makes the system a promising candidate for applications mainly in gas adsorption and/or photocatalytic performance [29]. EDS spectra, (right part of Figure 3), over the selected scan area (3000 X-5 um, see upper insets), evidence only the existence of Zn and O atoms in pure ZnO and of Zn, Co and O in Zn1-xCoxO system, ruling out the presence of impurities in the samples. Experimental and calculated elemental compositions are within the limit of experimental error (see Tables). Now, when the SEM micrographs are detailed to 3000 X, a new morphology (like sheets, see green circle) appears in the sample with higher Co content in comparison to undoped ZnO, evidencing the effect of the amount of doping on the morphology of system.
3.4. XRD
The refined diffraction patterns for all samples using the Rietveld method are presented in Figure 5 and the obtained parameters of the fits along with L (Zn-O bond length along the c direction) and R (distortion degree) [8] parameters are displayed in Figure 6. The χ2 (the goodness of fit) values evidenced the quality of the refinement.
Only reflections belonging to the hexagonal structure type wurtzite with P63mc space group (JCPDS card no. 361-451) [30] were identified. Bragg peaks associated to others ZnO polymorphs [31] or Co CoO, Co3O4 or ZnCo2O4 phases were not evidenced within detection limit of the technique [32,33]. From Figure 6 it is observed that the a and c parameters of Zn1-xCoxO gradually decrease until x=0.03 and then increase when x reaches 0.05. The changes in the cell parameters observed in the present study are very similar to those found by Jabbar [10] and Hays et al. [34] in Zn1-xCoxO nanoparticles.
The ionic radii of high spin tetrahedral Co2+ (0.58 Å), is slightly smaller than the ionic size of Zn2+ (0.60 Å) in a tetrahedral environment [35]. The decrease in lattice parameters for x=0.03 could be related to the substitutional Co2+ ions in tetrahedral Zn2+ lattice sites in wurtzite structure. Now, the observed increase in the lattice parameters for x=0.05, suggests additional incorporation of Co2+ in octahedral coordination (interstitial position) and/or the presence of Co3+ ions with significant lattice defects. The above mentioned can be also evidenced with the changes observed in the c/a, R and L parameters (see Figure 6). The micro strains (ε) values [8] for Zn1-xCoxO samples were of (1.5, 1.7, 1.8 and 1.4) x10-3 for x=0.0 0.01, 0.03 and 0.05, respectively. It is noted that with an increase in concentration, the microstrain first increases and then decreases, in similar way that L and lattice parameters. In the pure ZnO as well as Co doped ZnO samples, the c/a parameter is in the range of 1.6017-1.6026, which is smaller than c/a ratio for an ideal wurtzite structure (1.633). This might indicate the presence of oxygen vacancies [10] as detected for FTIR. From Figure 6 it is observed that the Dv decreases with increase in cobalt content to 3.0 molar percentage and thereafter, the value increases with a further increment of Co content up to 5.0. These results probably could be related with the fact that to lower doping concentration, the Co ions modifying the rate of nucleation inhibiting further growth of ZnO crystal and a higher concentration encourage crystallite growth. This observation is in good agreement with SEM results.
3.5. Optical Properties
RT optical absorption spectra of ZnO and Co doped ZnO nanoparticles with different concentrations are shown in left part of Figure 7. In the pure ZnO sample, the absorption peak is centered at around 375 nm. A gradual and systematic blue shift in the Zn1-xCoxO samples, as x increase, with respect to the pure ZnO sample is observed. This blue shift behavior could indicate the replacement of ions Co2+ at Zn2+ into the ZnO structure [8]. In the spectra of the Co doped ZnO samples it is evident the presence of three humps located to 565, 612 and 657 cm-1 in comparison to the undoped ZnO sample.
These peaks are ascribed to the crystalline field splitting, due to d-d transitions of high spin Co2+ ions, (3d7, S=3/2)) in a tetrahedral crystal symmetry substituting Zn2+ sites in ZnO hexagonal wurtzite structure [15,16,17]. These d-d transitions of the ground state to their respective excited states are indicated in the Figure. It is noticeable that the area relative under these three peaks gradually increase with the doping level indicating higher absorption of the Co2+ ions. Two additional humps located at ~390 nm and ~495 are observed for all Co doped ZnO samples. The band around at 390 nm has been attributed to sub-band gap charge-transfer (CT) transitions in which the Co2+ acts as the CT acceptor and the valence band serves as the CT donor [36], whereas the band at 495 nm has been assigned to the ligand field transitions of Co2+ ions in a pseudo-octahedral environment [37] mainly in the particles surface. The increase of both, absorption bands due of the Co2+ ions coordinated tetrahedrally as bands due to pseudo-octahedral Co2+ ions could explain the increase in lattice parameters for x= 0.05 (DRX) and the morphology change to this doping molar concentration (SEM). The higher presence of Co2+ pseudo-octahedral increases the surface charge density, which could modify the growth of the crystal in a preferential orientation. The first derivative with respect to the wavelength of the all synthetized samples are displayed in right part of Figure 7. In the Figure, Co²⁺ ions in a pseudo-octahedral environment are more readily observed. As x increases from 0 to 0.01, the peak centered at 383 nm corresponding to the band edge suddenly disappears. If these results are compared with the first derivative with respect to the wavelength of Fe doped ZnO nanoparticle [38], is observed that Co2+ ions have an effect more pronounced in in affect and/or alter the absorption edge. This fact may give rise to the development of theoretical work with first principles calculations that attempt to explain these results.
The optical direct band gap (Eg) energies for the synthesized samples were determined using the Kubelka-Munk equation [15,39]. These results are shown in Figure 8. The Eg value of ZnO sample was found to be 3.15 eV, similar results have been reported by [15]. The observed decreasing in the band gap with increasing doping concentration can not be associated with the quantum confinement effect, since the crystallite sizes observed in this work, are larger than the exciton Bohr radius of ZnO [40]. Additionally, according to our results the crystallite size and lattice parameters variation also can be ruling out. Then, structural changes caused by the dopant incorporation has a dominant role in the decreasing in the forbidden band. The stronger exchange interactions between the localized d electrons of the Co2+ ions substituting for Zn2+ ions and the s and p electrons of the host band of ZnO could be responsible of the shrinkage of the band gap [15].
3.6. Magnetic Properties
M vs H to RT for Zn1-xCoxO with x= 0.00, 0.01, 0.03 and 0.05 are shown in Figure 9. In pure ZnO sample it is evident a mixture of a diamagnetic (DM) component along with a clear hysteresis loop, evidencing room temperature ferromagnetism (RTFM). This behavior observed it is no surprisingly according to previous reports [41,42]. The weak FM behavior in undoped ZnO generally has been associated to oxygen and/or zinc vacancies at surface or near surface, high size particle distribution, grain boundaries, uncompensated spins systems on the surface of the nanoparticles and or lattice imperfections occasioned by the stress [9]. In Co doped ZnO samples, the M vs H at RT consist of an open curve, due to FM contribution, superimposed with a linear part, due to paramagnetic (PM) contribution, where the coercive field (Hc), decreases with the increasing Co content. This behavior has also been reported by other authors. [16,43]. It can be seen that the PM component increase with increase x and there is no sign of saturation to higher applied magnetic fields. Such behavior could be an indication of the presence of isolated Co2+ ions, not participating in the magnetic ordering. These data support a weak RTFM in these samples. It is worth mentioning that according to our experimental results the weak FM observed in the samples is not due to any secondary phase or clusters.
Figure 10 shows the RT M vs H curves of Zn1-xCoxO (0.00≤x≤0.05) samples, where the linear component has been subtracted, to illustrate the actual Ms from the ferromagnetic phase. It can be seen that the Ms value first increase and then decrease with increasing Co doping, in our case exhibiting the highest Ms values for Zn0.97Co0.03O sample, as reported by [8]. The zero field cooling (ZFC) and field cooling curves (FC) for the undoped ZnO and Co doped ZnO samples are shown in Figure 11. The pure ZnO sample shows branching between ZFC and FC, typical of a superparamagnetic (SPM) behavior, with a blocked state in the low temperature regime around 135 K. Additionally, in the ZFC curve an additional peak around 50 K is displayed. This discrepancy in the M vs. H curve could be attributed to finite particle size with high agglomeration, lattice imperfections (microstrain), and/or the presence of uncompensated spin systems on the nanoparticle surfaces. [44]. In the Zn0.99Co0.01O sample it is observed a small difference between the ZFC-FC curves, which increase for the Zn0.97Co0.03O sample and then decrease for Zn0.97Co0.05O. The presence of this irreversibility should not exist in the case of a purely paramagnetic system, rather indicate the existence weak ferromagnetic behavior at RT [43].
These curves were fitted following the modified Curie-Weiss law, χ= χ0+C/(T+θ) [45], where χ0 represents non-PM contributions, C=Nμ2/3KB (N is the number of magnetic ions per g, μ = is the magnetic moment of the ion, KB is the Boltzmann constant) and θ is the Curie-Weiss temperature and results are shown in Table 1. These fits showed an increase in C as increases x, confirming the progressive doping of Co2+ ions. Only positive values for θ were obtained indicating that the interactions between Co2+ ions are mainly of antiferromagnetic (AFM) character.
As Co doping increase, θ increases indicating a progressive increment of the AFM contribution. It is also found that χ0 increases up to x=0.03 and decrease for x=0.05, in full agreement with the results shown in Figure 10.
According to our results is evident that Co2+ ions modify the magnetic behavior of pure ZnO. The higher Ms observed in Zn1-xCoxO samples with x =0.01 and 0.03, in comparison to undoped ZnO, might be correlated with the perturbation/alteration and/or changes in the electronic structure of ZnO occasioned by the exchange interaction between the localized magnetic dipole moments of the Co2+ ions and the free delocalized charge carriers from the valence band. The decrease in the weak FM signal in Zn0.95Co0.05O has been associated to the increases of AFM coupled spins. It is worth mentioning that the Ms values in the Co doped ZnO samples have similar behavior that cell, L, ε parameters. Then, lattice imperfections occasioned by the stress must not be ruled out to account for the weak FM signal observed in these samples.
4. Conclusions
We have investigated experimentally the crystallographic, vibrational, morphological, optical, electronic and magnetic properties of undoped and Co doped ZnO samples synthesized via a simple, cost-effective, and reproducible method. The few handling steps involved in the process enhance its reproducibility. We have analyzed the thermal decomposition of ZnO polymeric precursor by FTIR spectroscopy, where Zn(CH3COO)2 has been identified as the main intermediate product in the process. The samples were free from contamination. Results of XRD demonstrated that all the samples exhibited the wurtzite ZnO phase with a crystallite average size in the nanometric range. SEM micrographs show that with increasing cobalt concentration there is a gradual increase in the porosity of the samples and a new morphology (like sheets) is observed for x=0.05. FTIR-ATR and UV-vis absorbance spectra displayed a blue shift with increasing Co doping evidenced the incorporation and/or substitution of Co ions in host semiconductor. The band gap energy calculated decreased as Co molar concentration increased. Only high spin Co2+ ions were detected and located in different environments: tetrahedral core sites and pseudo-octaedral surface sites. Undoped and Co doped ZnO samples evidenced weak RTFM, where the 3 mol% cobalt doped ZnO sample displayed the maximum Ms and coercive field decreased with increased Co content. For pure ZnO this behavior was associated to oxygen vacancies, particle finite size, high size particle distribution and uncompensated spins systems on the surface. The reduction in the weak FM signal after a concentration molar of 3 % Co is likely due to increased antiferromagnetic coupling.
Author Contributions
Conceptualization, J.B.; methodology, J.B. and L.S.; validation, J.B., L.F. and L.S.; formal analysis, J.B., L.F. and L.S.; writing—original draft preparation, J.B., L.F. and L.S; writing—review and editing, J.B., L.F. and L.S.; supervision, J.B.; project administration, J.B.; funding acquisition, J.B All authors have read and agreed to the published version of the manuscript.
Funding
This research was funded by UNIVERSIDAD DE CORDOBA, grant number ACN° SFCB-01-24.
Institutional Review Board Statement
Not applicable.
Informed Consent Statement
Not applicable.
Data Availability Statement
The original contributions presented in this study are included in the article. Further inquiries can be directed to the corresponding author.
Conflicts of Interest
The authors declare no conflict of interest.
References
- Hossain, N.; Afroz, M.F.; Alam, M.; Shuvo, M.A.I.; Mohiuddin, M., Hossen, M.N.; Iqbal, A.; Rahman, M.A.; Rahman, M.M. Advances and significances of nanoparticles in semiconductor applications – A review. Results Eng. 2023, 19, 101347. [CrossRef]
- Ansari, A.A.; Ansari, M.O.; Alomari, M.; Alshahrani, T.; Rather, H.A.; Ahmad, R.; Ansari, S.A. ZnO nanostructures – Future frontiers in photocatalysis, solar cells, sensing, supercapacitor, fingerprint technologies, toxicity, and clinical diagnostics. Coord. Chem. Rev. 2024, 515, 215942. [CrossRef]
- Noman, M.T.; Amor, N.; Petru, M. Synthesis and applications of ZnO nanostructures (ZONSs): a review. Crit. Rev. Solid State Mater. Sci.2022, 47(2), 99–141. [CrossRef]
- Raha, S.; Ahmaruzzaman, M. ZnO nanostructured materials and their potential applications: progress, challenges and perspectives. Nanoscale Adv. 2022, 4(8), 1868–1925. [CrossRef]
- Dey, S.; Saha, A.; Shukla, A.; Anand, A.; Kar, K.K.; Tiwari, A. A critical review on zinc oxide nanoparticles: Synthesis, properties and biomedical applications. Intell. Pharm. 2024, 3(1), 53–70. [CrossRef]
- Kalita, H.; Bhushan, M.; Singh, L.R. A comprehensive review on theoretical concepts, types and applications of magnetic semiconductors. Mater. Sci. Eng. B 2023, 288, 116201. [CrossRef]
- Murtaza, A.; Rehman, M.A.; Khan, M.Y.; Abro, M.I.; Ullah, R.; Naqvi, S.R.; Laref, A. Robust ferromagnetism in rare-earth and transition metal co-doped ZnO nanoparticles for spintronics applications. Mater. Lett. 2022, 310, 131479. [CrossRef]
- Tun Naziba, A.; Paiman, S.; Rusop, M.; Sahdan, M.Z.; Dimyati, K. Structural, optical, and magnetic properties of Co-doped ZnO nanorods: Advancements in room temperature ferromagnetic behavior for spintronic applications. J. Magn. Magn. Mater. 2024, 593, 171836. [CrossRef]
- Habanjar, K.; Chakraborty, P.; Sharma, P.; Sharma, T.K.; Kumar, R. Magneto-optical effect of (Sm, Co) co-doping in ZnO semiconductor. Phys. B: Condens. Matter 2020, 598(July), 412444. [CrossRef]
- Jabbar, I.; Ahmad, M.; Nazir, S.; Ghaffar, A.; Arshad, S.; Khan, F.; Abbas, G.; Ali, M. Diluted magnetic semiconductor properties in TM doped ZnO nanoparticles. RSC Adv. 2022, 12(21), 13456–13463. [CrossRef]
- Zelekew, O.A.; Almomani, F.; Haddad, R.; Ayele, D.W. Green synthesis of Co-doped ZnO via the accumulation of cobalt ion onto Eichhornia crassipes plant tissue and the photocatalytic degradation efficiency under visible light. Mater. Res. Express 2021, 8(2), 025010. [CrossRef]
- Ogwuegbu, M.C.; Olatunde, O.C.; Pfukwa, T.M.; Mthiyane, D.M.N.; Fawole, O.A.; Onwudiwe, D.C. Green synthesis, characterization and antimicrobial activity of ZnO and Co-doped ZnO nanoparticles obtained using aqueous extracts of Platycladus orientalis leaves. Discov. Mater. 2025, 5(1). [CrossRef]
- Arruda, L.B.; Leite, D.M.G.; Orlandi, M.O.; Ortiz, W.A.; Lisboa-Filho, P.N. Sonochemical synthesis and magnetism in co-doped ZnO nanoparticles. J. Supercond. Nov. Magn. 2013, 26(7), 2515–2519. [CrossRef]
- Pandey, K.; Kumar, M.; Chauhan, S.; Raman, R.S. Microwave-assisted sol-gel synthesis of Li-Co doped zinc oxide nanoparticles: Investigating the effects of codoping on structural, optical, and magnetic properties for spintronic applications. J. Cryst. Growth 2025, 652, 128053. [CrossRef]
- Ji, H.; Cai, C.; Zhou, S.; Liu, W. Structure, photoluminescence, and magnetic properties of Co-doped ZnO nanoparticles. J. Mater. Sci. Mater. Electron.2018, 29(15), 12917–12926. [CrossRef]
- Elilarassi, R.; Chandrasekaran, G. Influence of Co-doping on the structural, optical and magnetic properties of ZnO nanoparticles synthesized using auto-combustion method. J. Mater. Sci. Mater. Electron. 2013, 24(1), 96–105. [CrossRef]
- Salkar, K.Y.; Tangsali, R.B.; Gad, R.S.; Jeyakanthan, M.; Subramanian, U. Preparation characterization and magnetic properties of Zn(1-x)CoxO nanoparticle dilute magnetic semiconductors. Superlattices Microstruct. 2019, 126, 158–173. [CrossRef]
- Beltrán, J.J.; Barrero, C.A.; Punnoose, A. Identifying the sources of ferromagnetism in sol-gel synthesized Zn(1-x)CoxO (0≤x≤0.10) nanoparticles. J. Solid State Chem. 2016, 240, 30–42. [CrossRef]
- Badhusha, M.S.M.; Kavitha, B.; Rajarajan, M.; Tharmaraj, P.; Suganthi, A. Synthesis of Co and Cu codoped ZnO nanoparticles by citrate gel combustion method: Photocatalytic and antimicrobial activity. J. Water Environ. Nanotechnol. 2022, 7(2), 143–154. [CrossRef]
- Bhagwat, M.; Shah, P.; Ramaswamy, V. Synthesis of nanocrystalline SnO2 powder by amorphous citrate route. Mater. Lett. 2003, 57(9–10), 1604–1611. [CrossRef]
- Pimpang, P.; Sumang, R.; Choopun, S. Effect of Concentration of Citric Acid on Size and Optical Properties of Fluorescence Graphene Quantum Dots Prepared by Tuning Carbonization Degree. Chiang Mai J. Sci. 2018, 45(5), 2005–2014. [CrossRef]
- Farbun, I.A.; Romanova, I.V.; Terikovskaya, T.E.; Dzanashvili, D.I.; Joo, S.W.; Kirillov, S.A. Complex Formation in the Course of Synthesis of Zinc Oxide from Citrate Solutions. Russ. J. Appl. Chem. 2007, 80(11), 1798–1803. [CrossRef]
- Poorna, K.S.V.; Patra, D.; Qureshi, A.A.; Gopalan, B.J. Metal citrate nanoparticles: a robust water-soluble plant micronutrient source. RSC Adv. 2021, 11, 20370. [CrossRef]
- Muhammad, D.; Aziz, D.; Aziz, S. Zinc metal complexes synthesized by a green method as a new approach to alter the structural and optical characteristics of PVA: new field for polymer composite fabrication with controlled optical band gap. RSC Adv. 2024, 14, 26362. [CrossRef]
- Chandrasekaran, S.; Anusuya, S.; Anbazhagan, V. Anticancer, anti-diabetic, antimicrobial activity of zinc oxide nanoparticles: A comparative analysis. J. Mol. Struct. 2022, 1263, 133139. [CrossRef]
- Dillip, G.R.; Banerjee, A.N.; Anitha, V.C.; Prasad Raju, B.D.; Joo, S.W.; Min, B.K. Oxygen Vacancy-Induced Structural, Optical, and Enhanced Supercapacitive Performance of Zinc Oxide Anchored Graphitic Carbon Nanofiber Hybrid Electrodes. ACS Appl. Mater. Interfaces 2016, 8(7), 5025–5039. [CrossRef]
- Beltrán, J.J.; Barrero, C.A.; Punnoose, A. Relationship between ferromagnetism and formation of complex carbon bonds in carbon doped ZnO powders. Phys. Chem. Chem. Phys. 2019, 21(17), 8808–8819. [CrossRef]
- Xiong, G.; Pal, U.; Serrano, J.G.; Ucer, K.B.; Williams, R.T. Photoluminescence and FTIR study of ZnO nanoparticles: The impurity and defect perspective. Phys. Status Solidi C 2006, 3(10), 3577–3581. [CrossRef]
- Zhang, Q.P.; Li, W.; Wu, W., Yu, S.; Wu, Y.; Li, Z. Adsorption behaviors of gas molecules on the surface of ZnO nanocrystals under UV irradiation. Sci. China Technol. Sci. 2019, 62(12), 2226–2235. [CrossRef]
- Sahu, S.; Samanta, P.K. Peak Profile Analysis of X-ray Diffraction Pattern of Zinc Oxide Nanostructure. J. Nano Electron. Phys. 2021, 13(5), 1–4. [CrossRef]
- Garcia-sotelo, A.; Avila-meza, M.; Melendez-lira, M.A.; Fernandez-muñoz, J.L.; Zelaya-angel, O. Modification of the crystalline structure of ZnO nanoparticles embedded within a SiO2 matrix due to thermal stress effects. Mater. Res. 2019, 22(4). [CrossRef]
- Musolino, M.G.; Busacca, C.; Mauriello, F.; Pietropaolo, R. Aliphatic carbonyl reduction promoted by palladium catalysts under mild conditions. Appl. Catal. A Gen. 2010, 379(1–2), 77–86. [CrossRef]
- Gao, X.; Li, C.; Zhu, C.; Ouyang, Q.; Zhang, X.; Chen, Y. Synthesis and low-temperature sensing property of the porous ZnCo2O4 nanosheets. J. Mater. Sci. Mater. Electron. 2019, 30(6), 5357–5365. [CrossRef]
- Hays, J.; Ramsier, R.D.; Chase, L.L.; Bowman, M.K.; Muntele, C.; Muntele, I..; Nastasi, M. Effect of Co doping on the structural, optical and magnetic properties of ZnO nanoparticles. J. Phys. Condens. Matter 2007, 19(26), 266203 . [CrossRef]
- Shannon Radii. (2020) Database of Ionic Radii. [Online] Available from: http://abulafia.mt.ic.ac.uk/shannon/ptable.php.
- Shi, S.; Zhang, L.; Zhang, H.; Li, H.; Liu, X.; Wang, Y. Structural, optical and magnetic properties of Co-doped ZnO nanorods prepared by hydrothermal method. J. Alloys Compd. 2013, 576, 59–65. [CrossRef]
- Li, J.; Zhang, L.; Zhu, J.; Liu, Y.; Hao, W.; Li, B. Controllable synthesis and magnetic investigation of ZnO: Co nanowires and nanotubes. Mater. Lett. 2012, 87, 101–104. [CrossRef]
- Beltrán, J.J.; Barrero, C.A.; Punnoose, A. Understanding the role of iron in the magnetism of Fe doped ZnO nanoparticles. Phys. Chem. Chem. Phys. 2015, 17, 15284–15296. [CrossRef]
- Abdullahi, S.; Güner, S.; Koseoglu, Y.; M.-n. J.; Adamu, B. Simple method for the determination of band gap of a nanopowdered sample using Kubelka Munk theory. J. Niger. Assoc. Math. Phys. 2016, 35, 241–246.
- Repp, S.; Erdem, E. Controlling the exciton energy of zinc oxide (ZnO) quantum dots by changing the confinement conditions. Spectrochim. Acta A Mol. Biomol. Spectrosc. 2016, 152, 637–644. [CrossRef]
- Motaung, D.E.; Ngoepe, P.N.; Nakonde, H.; Singh, M.; Swart, H.C. Shape-selective dependence of room temperature ferromagnetism induced by hierarchical ZnO nanostructures. ACS Appl. Mater. Interfaces 2014, 6, 8981–8995. [CrossRef]
- Xu, X.; Xu, C.; Dai, J.; Hu, J.; Li, F.; Zhang, S. Size dependence of defect-induced room temperature ferromagnetism in undoped ZnO nanoparticles. J. Phys. Chem. C 2012, 116, 8813–8818. [CrossRef]
- Duan, L.B.; Rao, G.H.; Yu, J.; Wang, Y.C. Ferromagnetism of lightly Co-doped ZnO nanoparticles. Solid State Commun. 2008, (11–12), 525–528. [CrossRef]
- Moura, K.O.; Lima, R.J.S.; Jesus, C.B.R.; Duque, J.G.S.; Meneses, C.T. Fe-doped NiO nanoparticles: Synthesis, characterization, and magnetic properties. J. Magn. Magn. Mater 2012, 58(3), 167–170. [CrossRef]
- Punnoose, A.; Philip, J.; Rice, J.T.; Kim, B.I.; Rabiei, S.; Healy, K.; Seebauer, E.G. Development of high-temperature ferromagnetism in SnO₂ and paramagnetism in SnO by Fe doping. Phys. Rev. B 2005, 72, 054402. [CrossRef]
Figure 1.
TG/DTG curves of polymeric precursors for a) ZnO and b) Zn0.95Co0.05O samples.
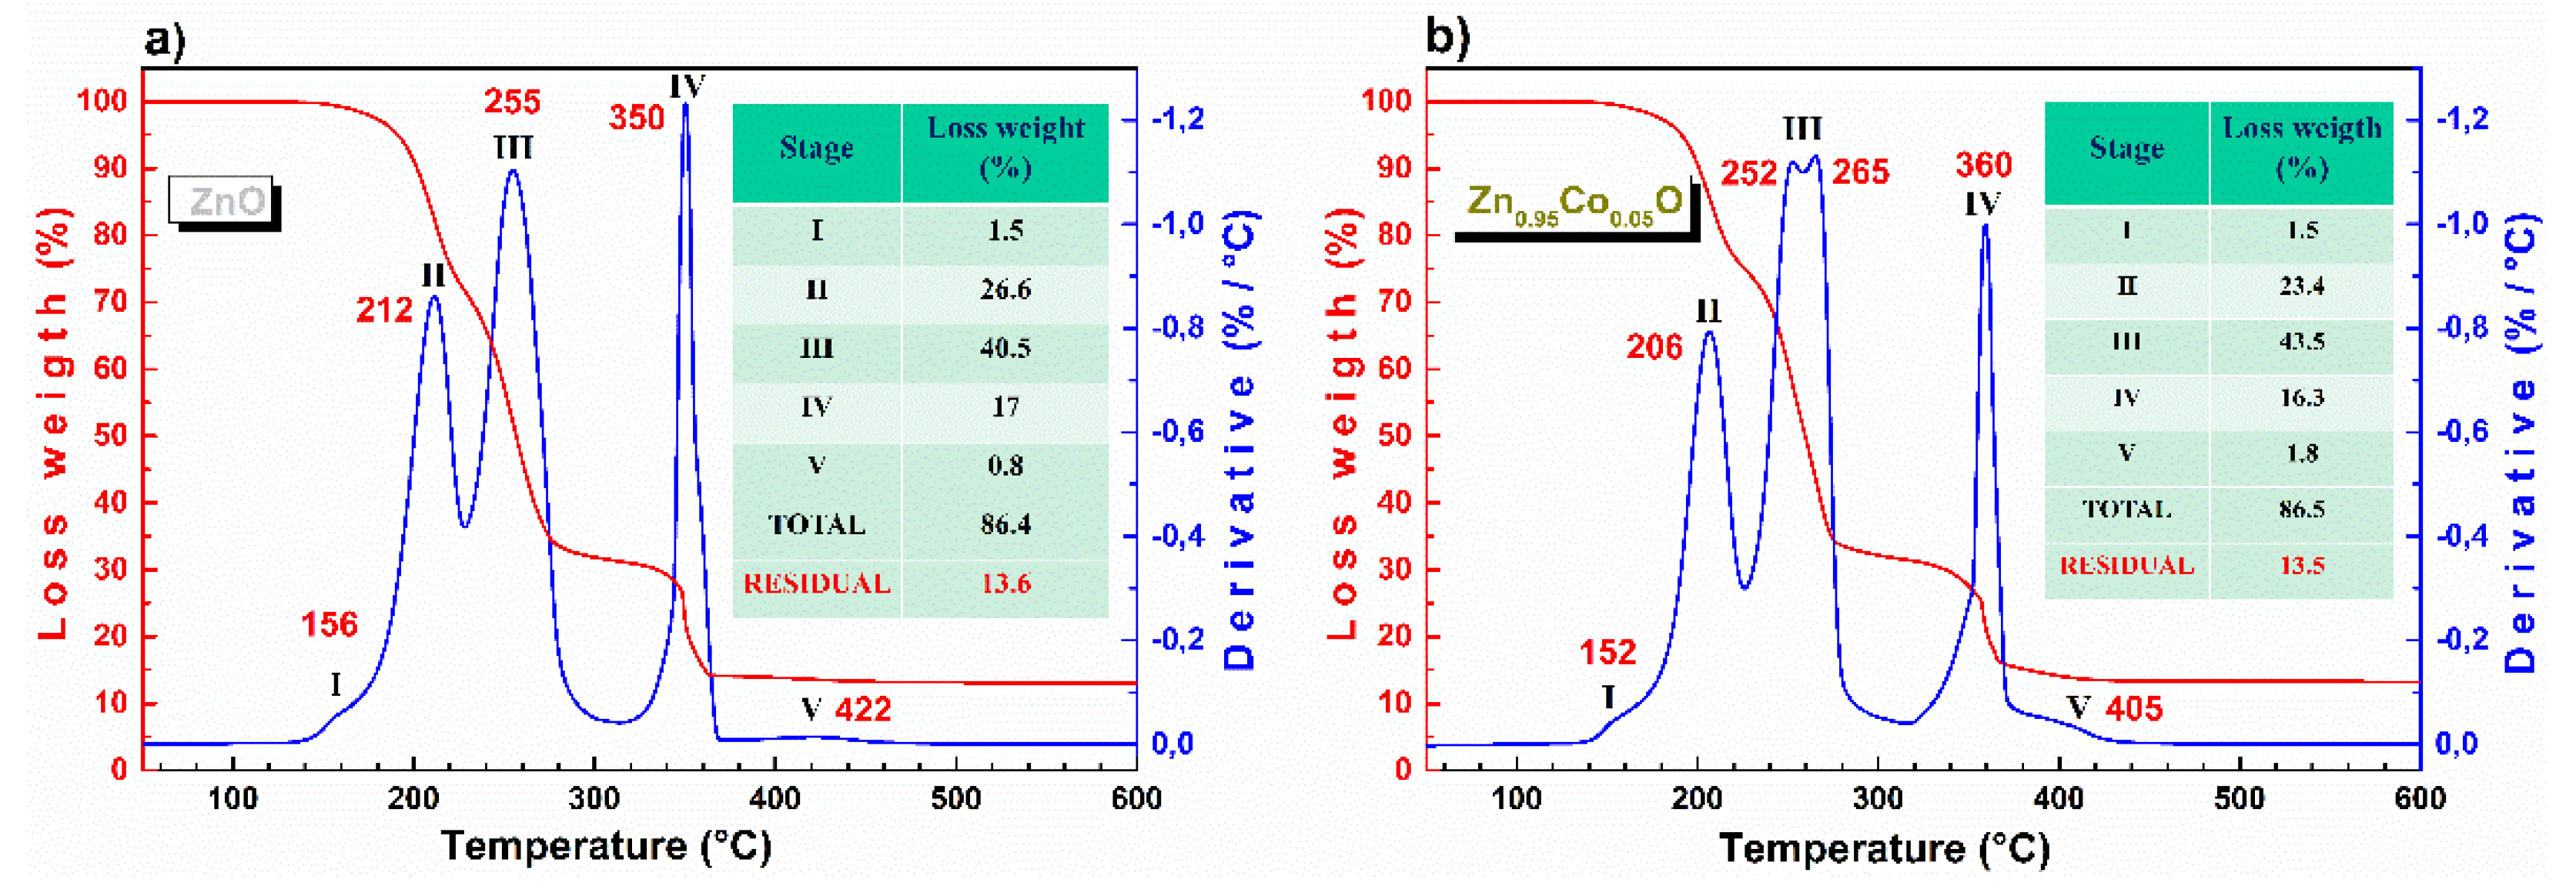
Figure 2.
FTIR spectra of precursors and products of their decomposition at various temperatures for the ZnO polymeric precursor.
Figure 2.
FTIR spectra of precursors and products of their decomposition at various temperatures for the ZnO polymeric precursor.
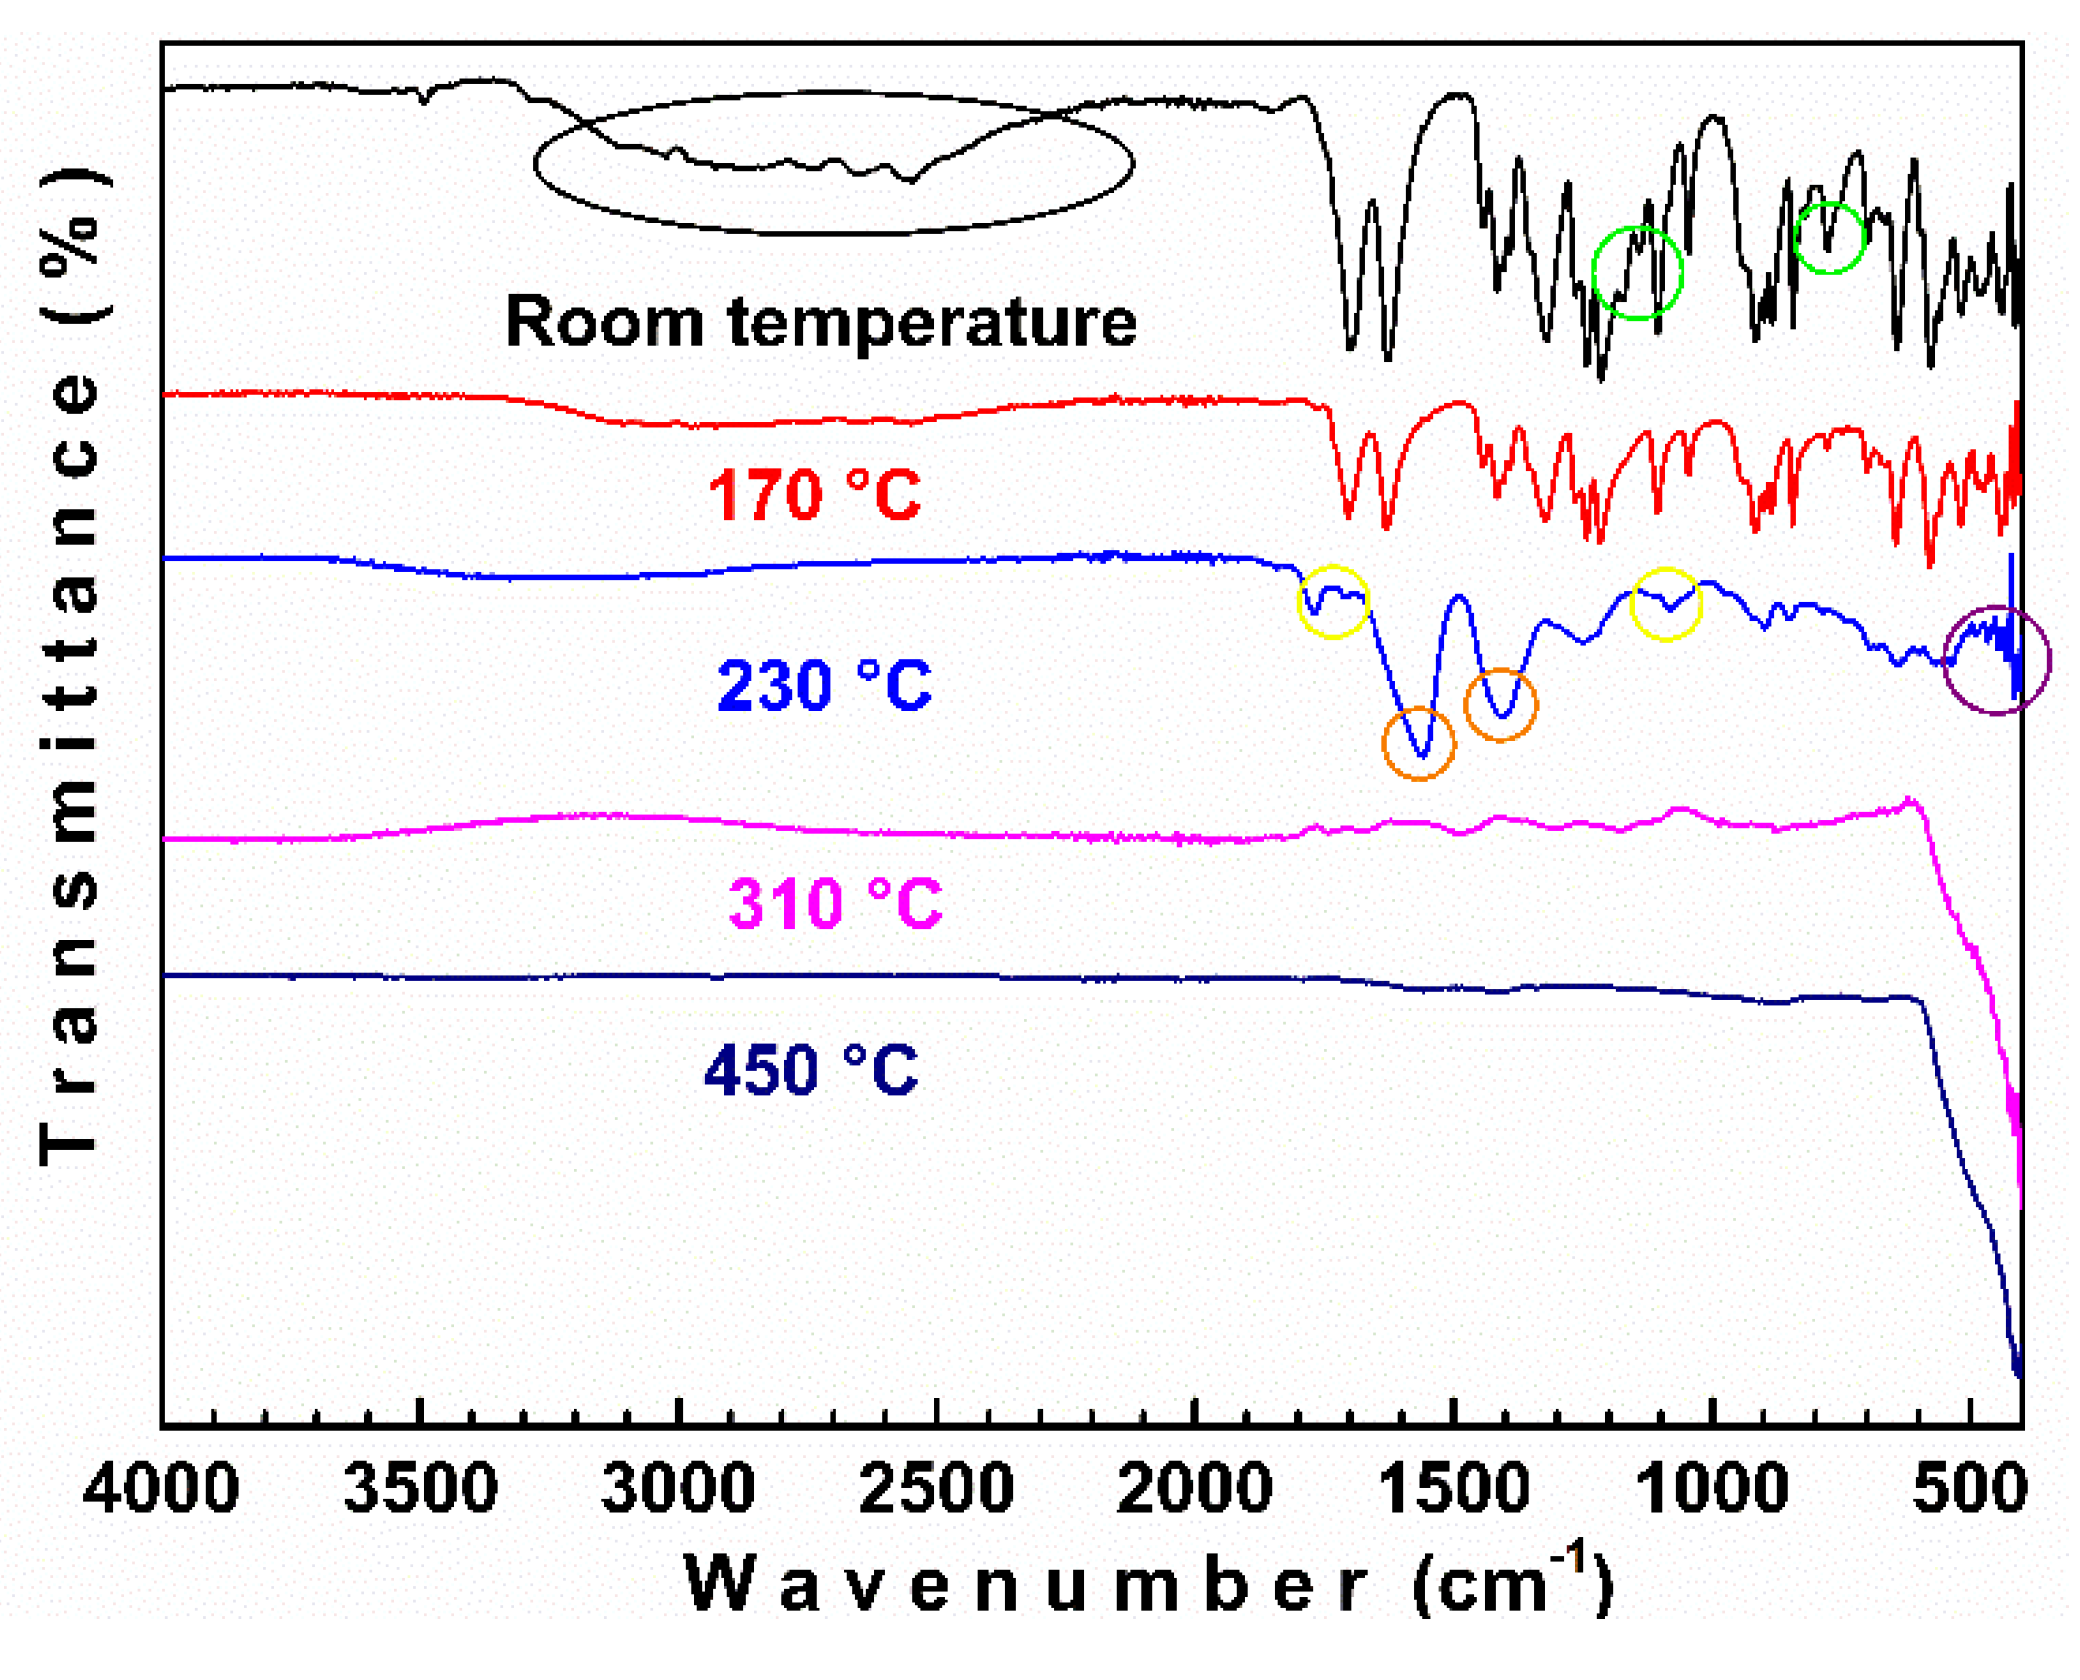
Figure 3.
FTIR-ATR spectra of Zn1-xCoxO (0.00 ≤ x ≤0.05) samples.

Figure 4.
Left part shows SEM micrographs of pure ZnO and Zn1-xCoxO samples with x=0.01, 0.03 and 0.05, while, right part shows EDS spectra to 3000 X (upper insets) for each one of the samples. Green circle in Zn0.95Co0.05O shows the morphology change in comparison to ZnO sample.
Figure 4.
Left part shows SEM micrographs of pure ZnO and Zn1-xCoxO samples with x=0.01, 0.03 and 0.05, while, right part shows EDS spectra to 3000 X (upper insets) for each one of the samples. Green circle in Zn0.95Co0.05O shows the morphology change in comparison to ZnO sample.
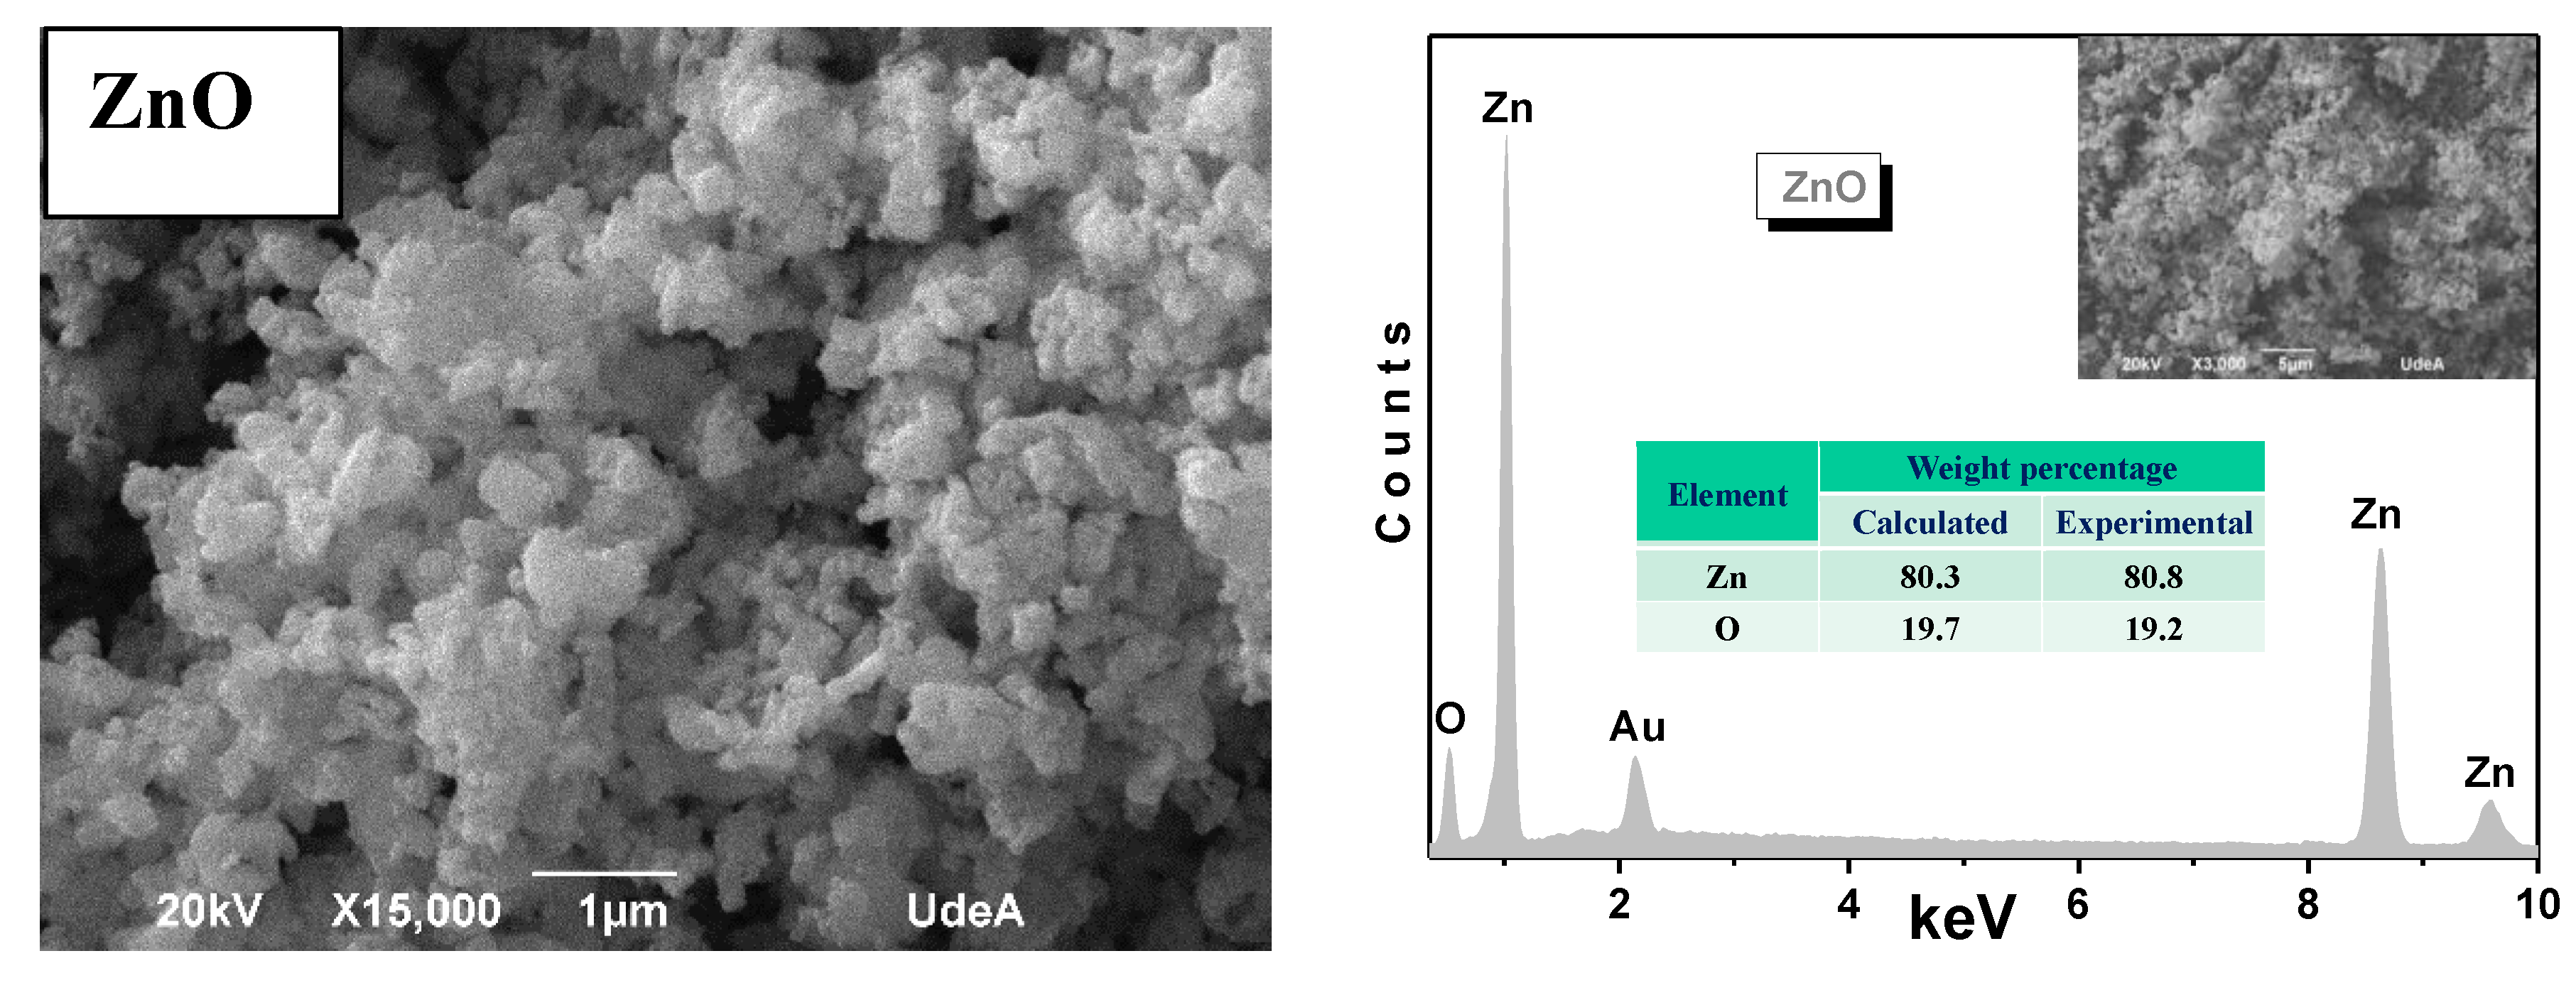
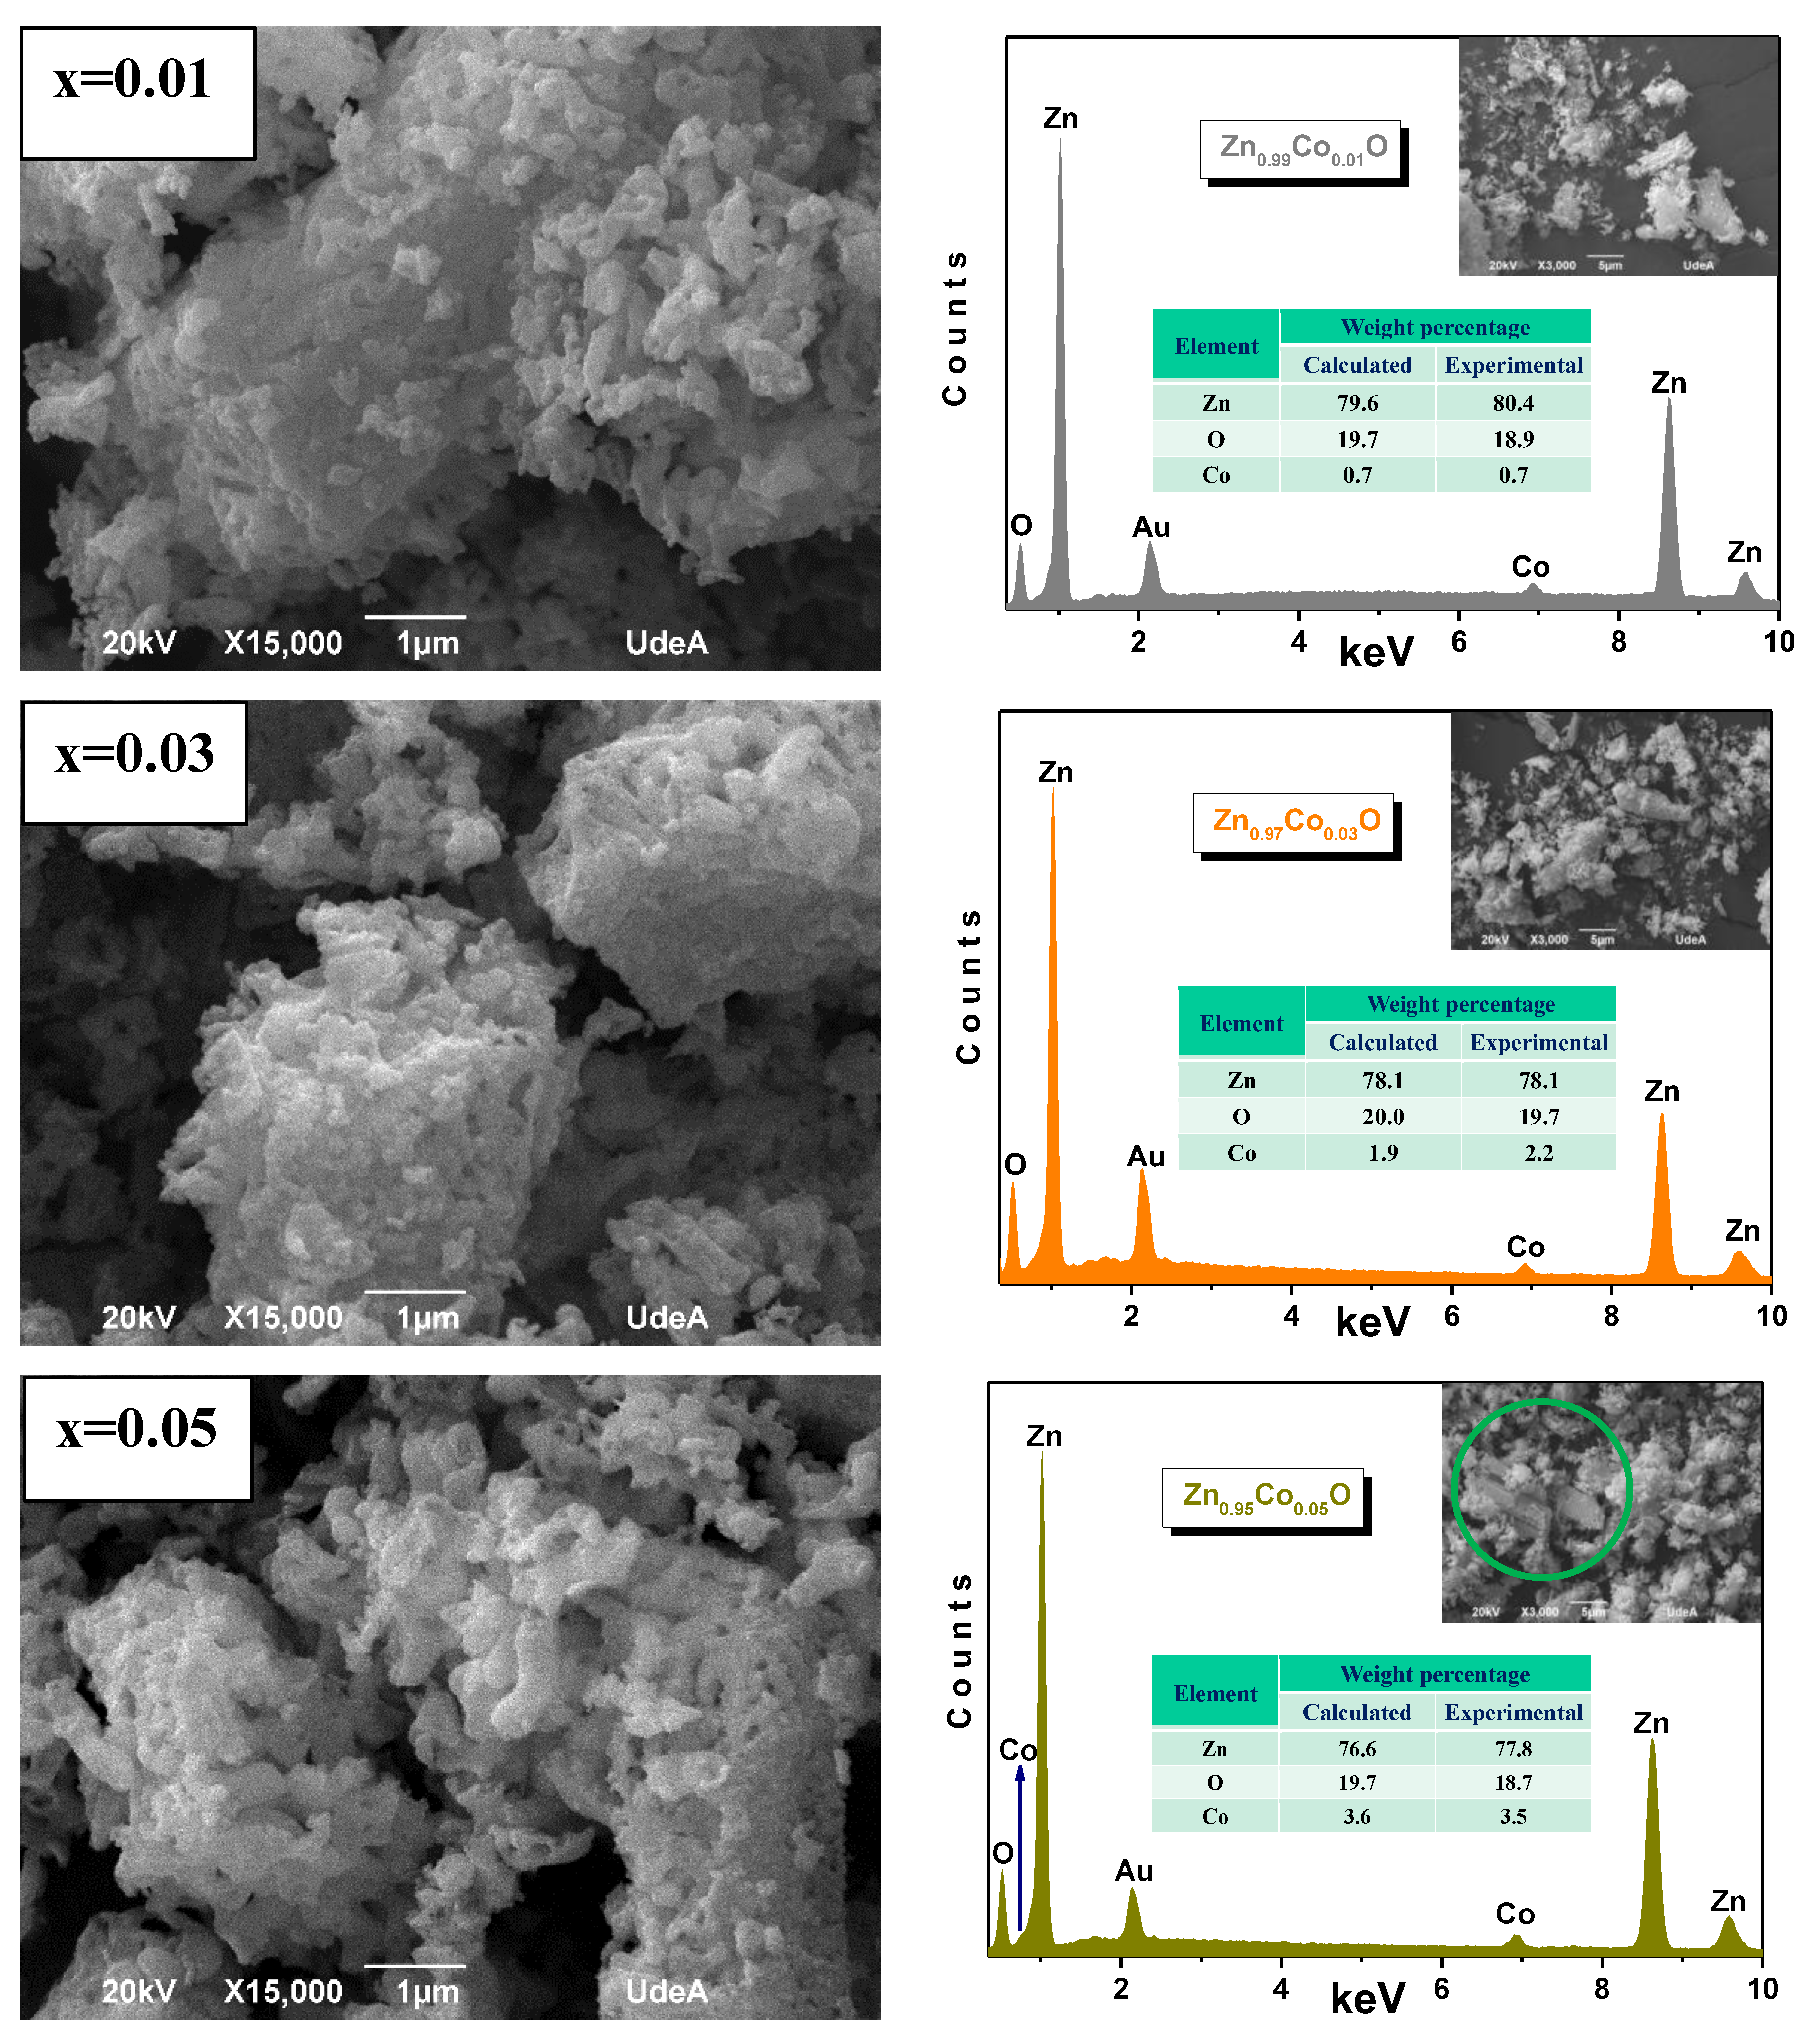
Figure 5.
Rietveld analysis of XRD patterns of undoped and Co doped ZnO nanopowders. Semisolid symbols are experimental data, whereas black solid lines represent the fit. The blue lines below represent the difference pattern. The χ2 represents the goodness of fit.
Figure 5.
Rietveld analysis of XRD patterns of undoped and Co doped ZnO nanopowders. Semisolid symbols are experimental data, whereas black solid lines represent the fit. The blue lines below represent the difference pattern. The χ2 represents the goodness of fit.
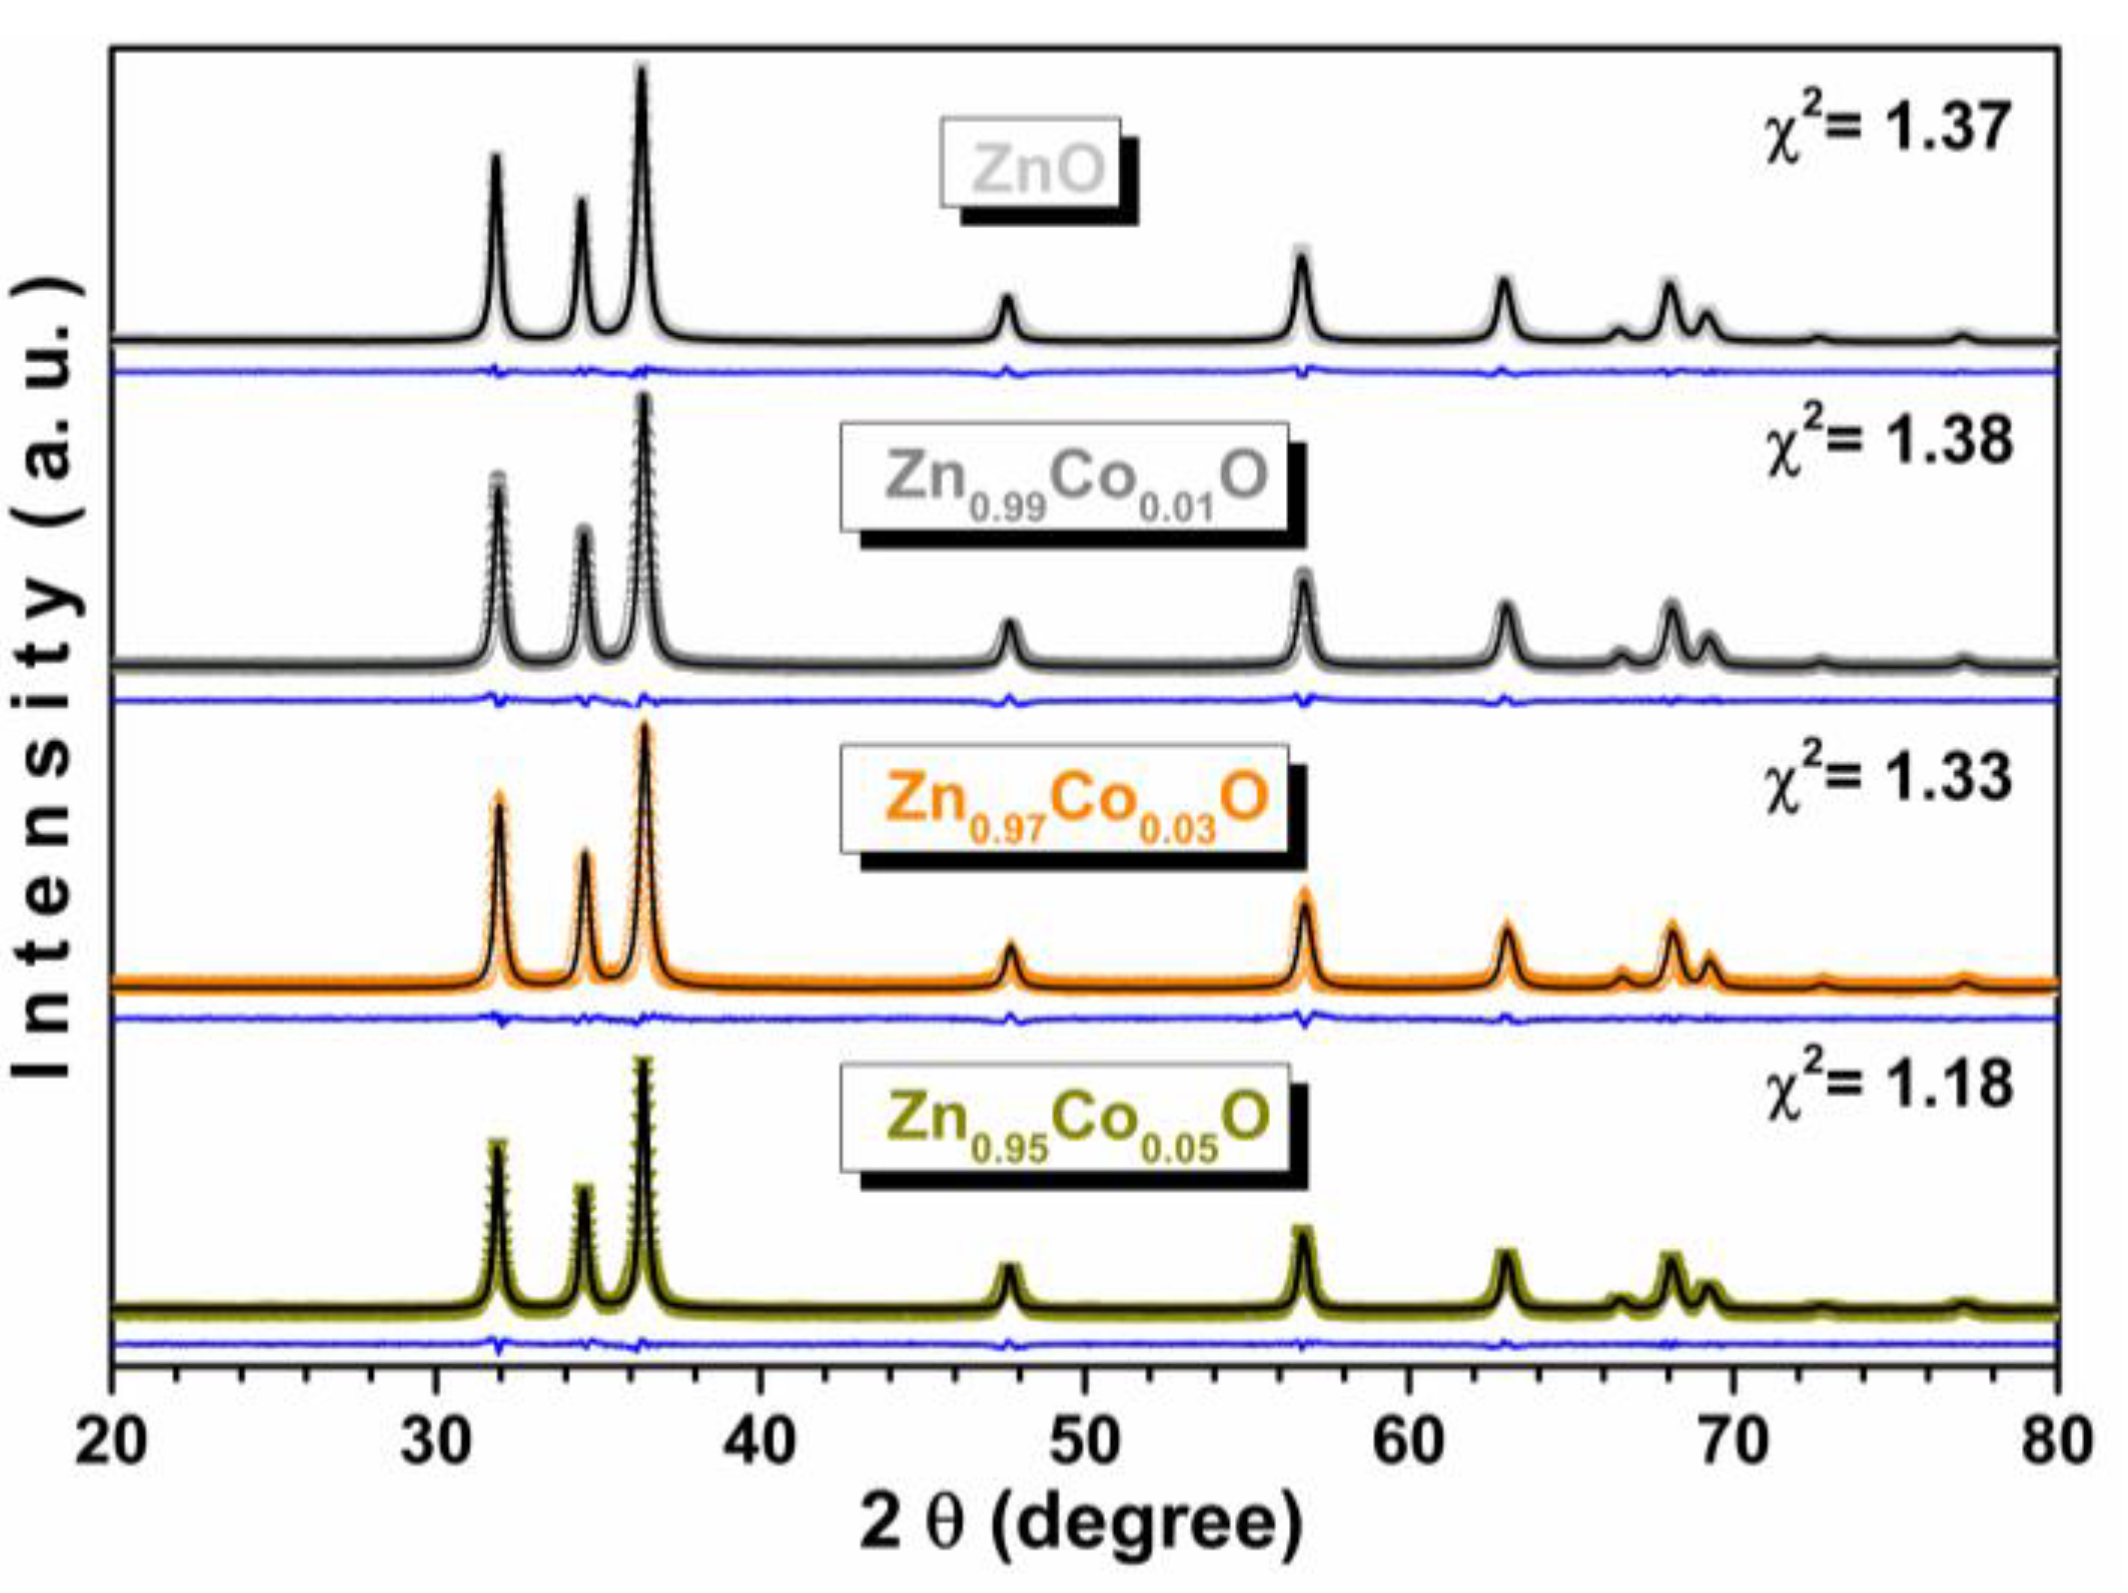
Figure 6.
Variation of a) a and c lattice parameters, b) c/a ratio and lattice distortion degree (R) and c) average crystallite size (Dv) and Zn–O bond length (L) parallel to the c-axis, as a function of nominal Co molar content.
Figure 6.
Variation of a) a and c lattice parameters, b) c/a ratio and lattice distortion degree (R) and c) average crystallite size (Dv) and Zn–O bond length (L) parallel to the c-axis, as a function of nominal Co molar content.
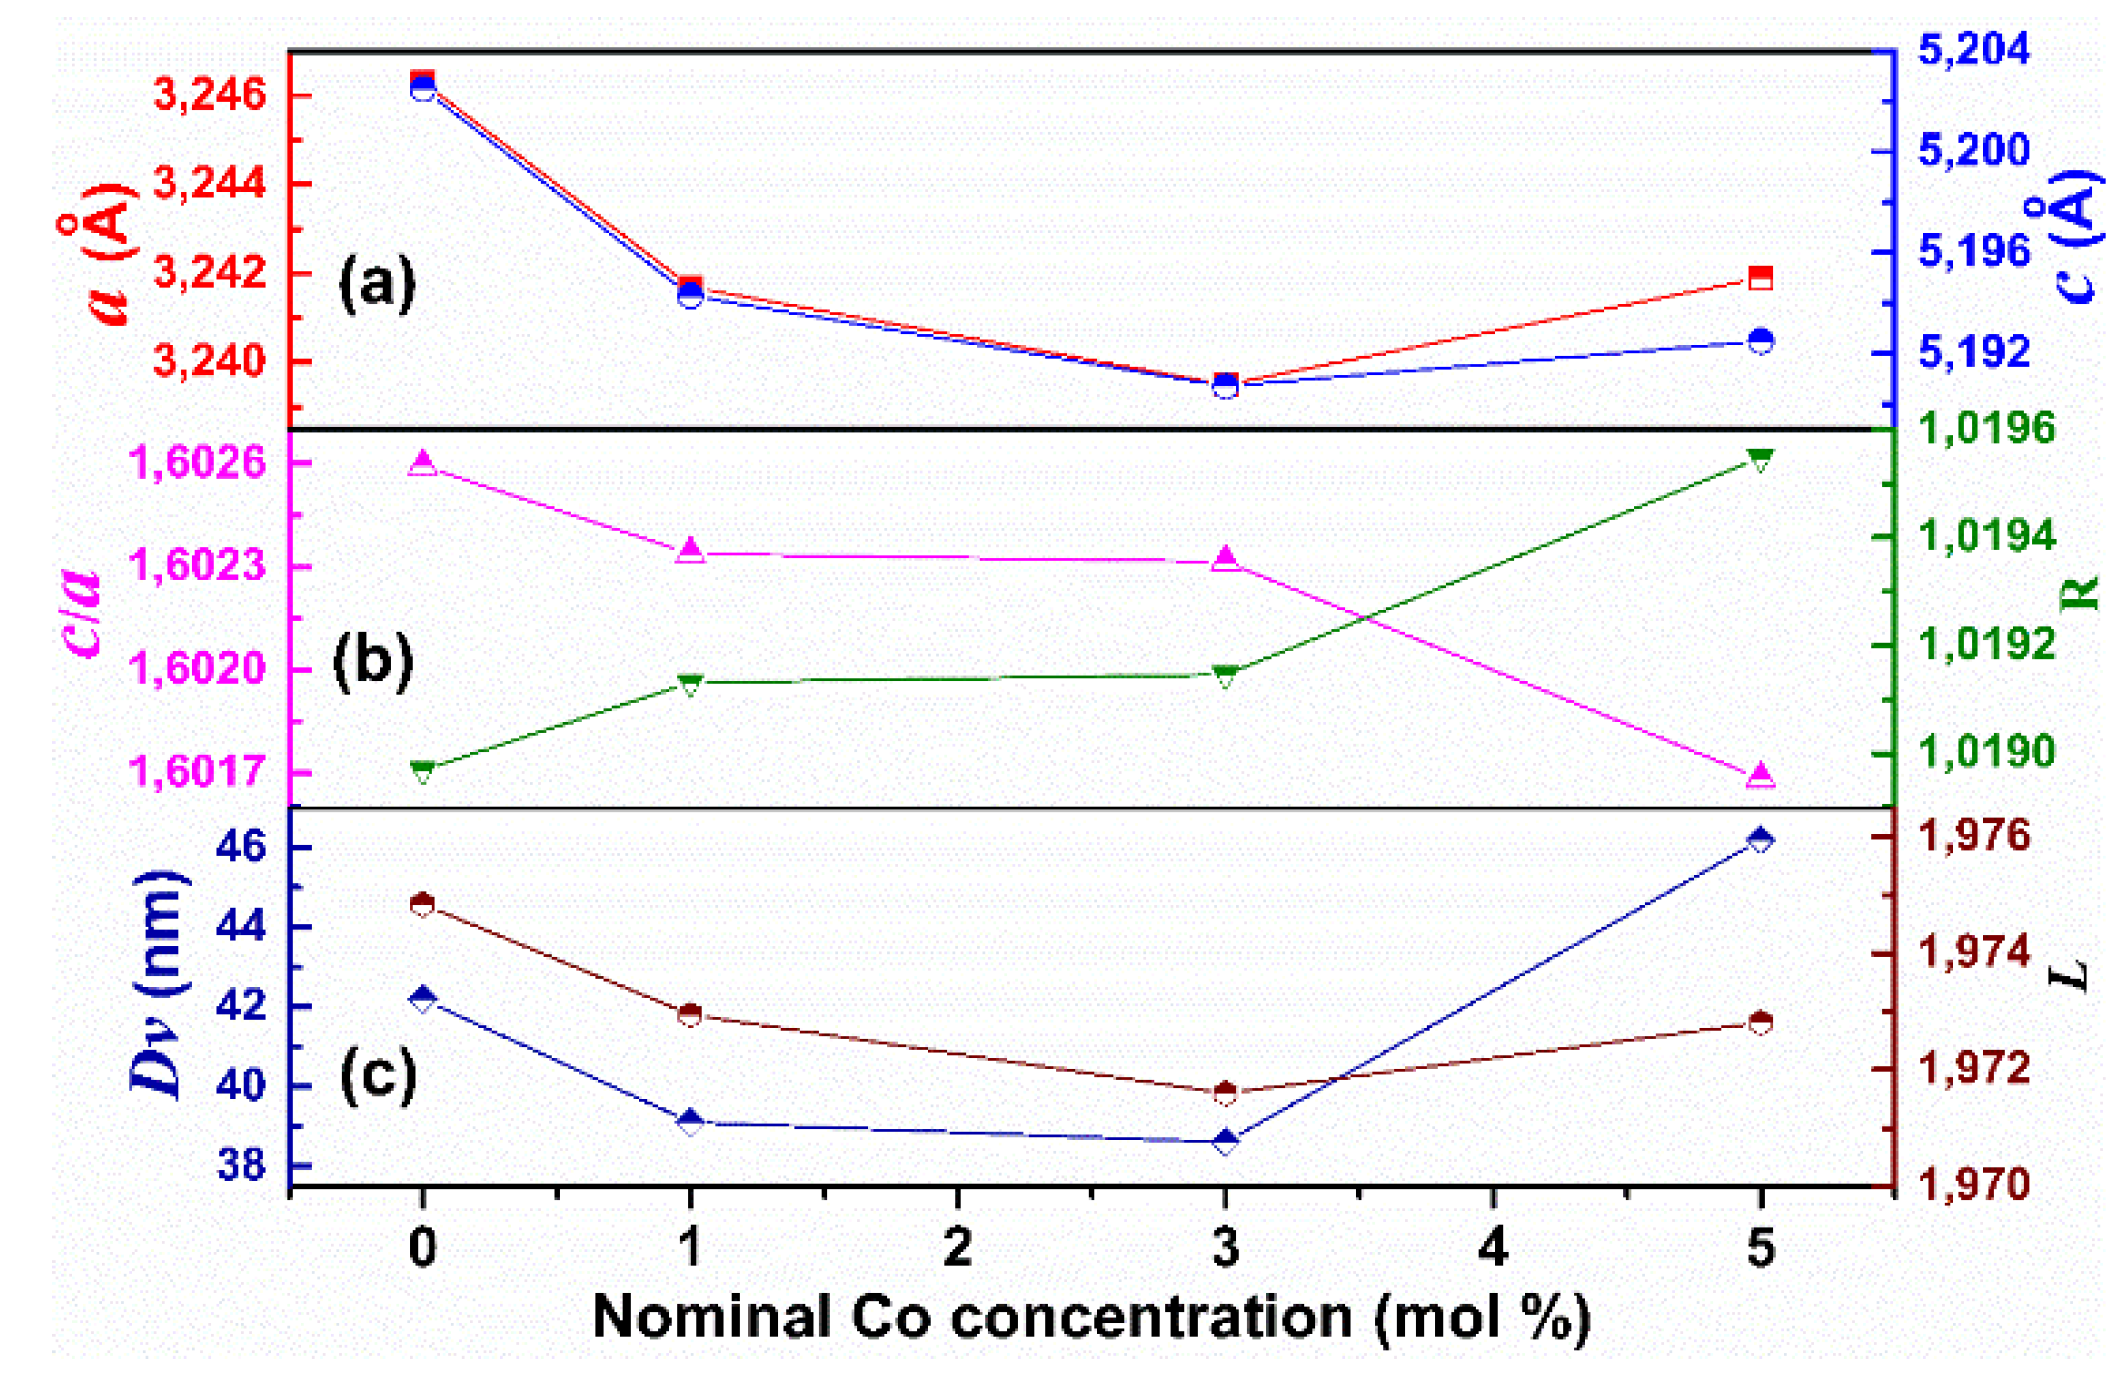
Figure 7.
Left part: optical absorbance diffuse reflectance spectra of ZnO and Zn1-xCoxO samples. In the Figure is shown the d-d transitions of Co2+ ions tetrahedrally coordinated. Right part: first Derivative of absorbance spectra with respect to wavelength for Zn1-xCoxO samples.
Figure 7.
Left part: optical absorbance diffuse reflectance spectra of ZnO and Zn1-xCoxO samples. In the Figure is shown the d-d transitions of Co2+ ions tetrahedrally coordinated. Right part: first Derivative of absorbance spectra with respect to wavelength for Zn1-xCoxO samples.
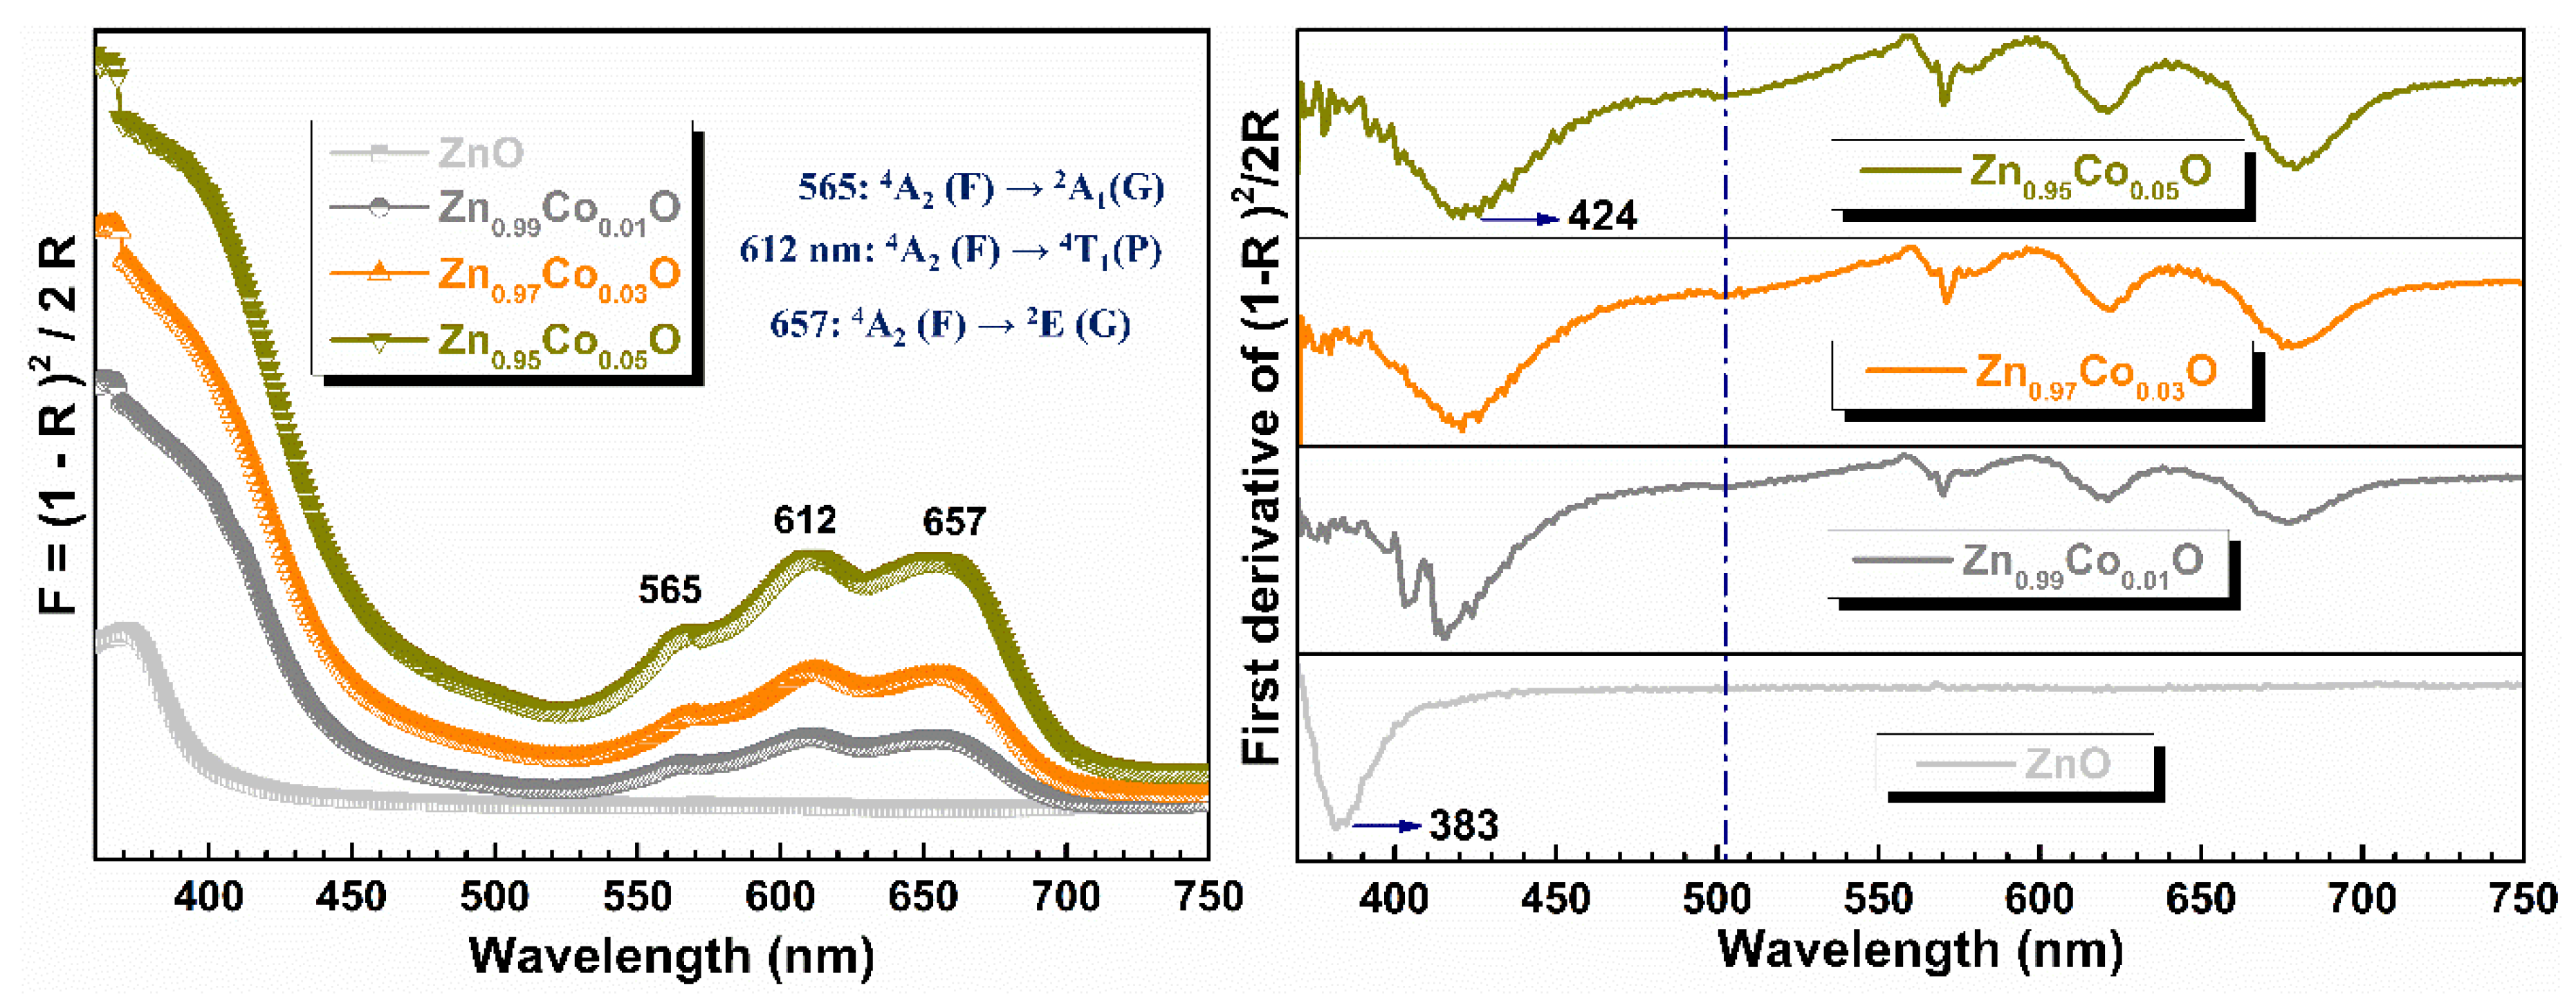
Figure 8.
Variation of the calculated band gap, according to Kubelka-Munk equation, for Zn1-xCoxO samples with x= 0.00, 0.01,0.3 and 0.05.
Figure 8.
Variation of the calculated band gap, according to Kubelka-Munk equation, for Zn1-xCoxO samples with x= 0.00, 0.01,0.3 and 0.05.
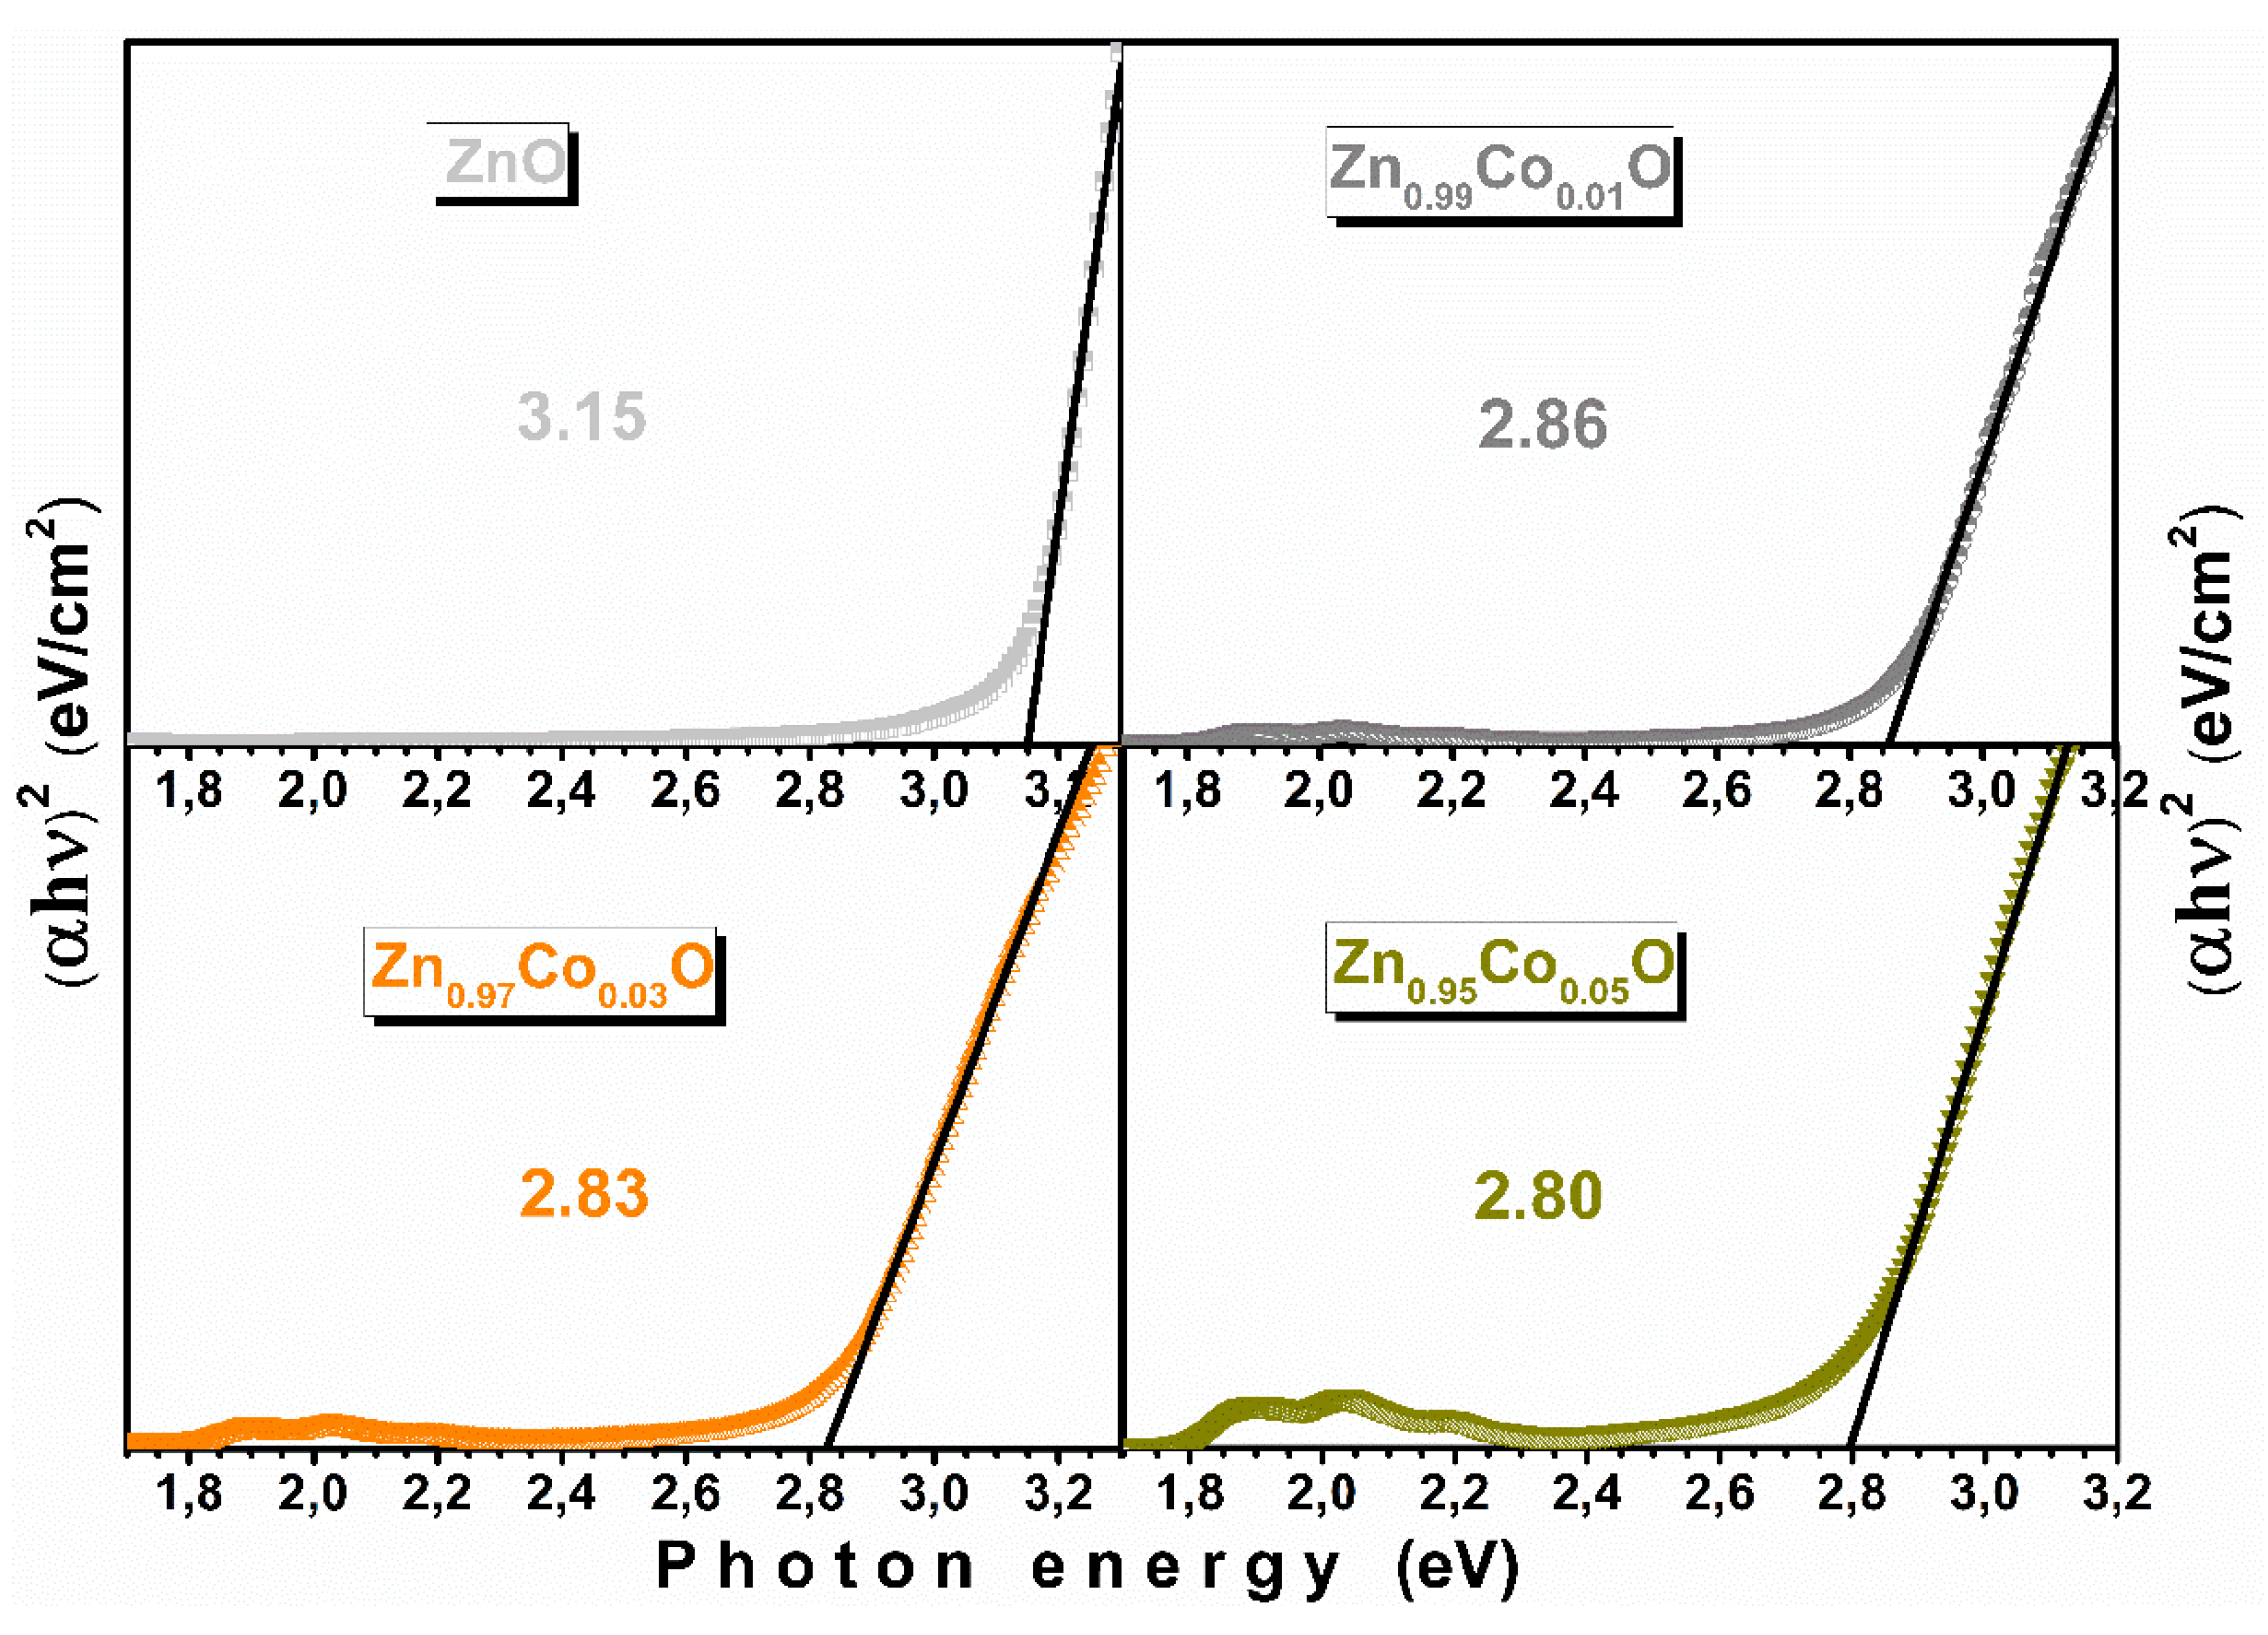
Figure 9.
RT hysteresis loops for Zn1-xCoxO samples with x= 0.00, 0.01,0.3 and 0.05.
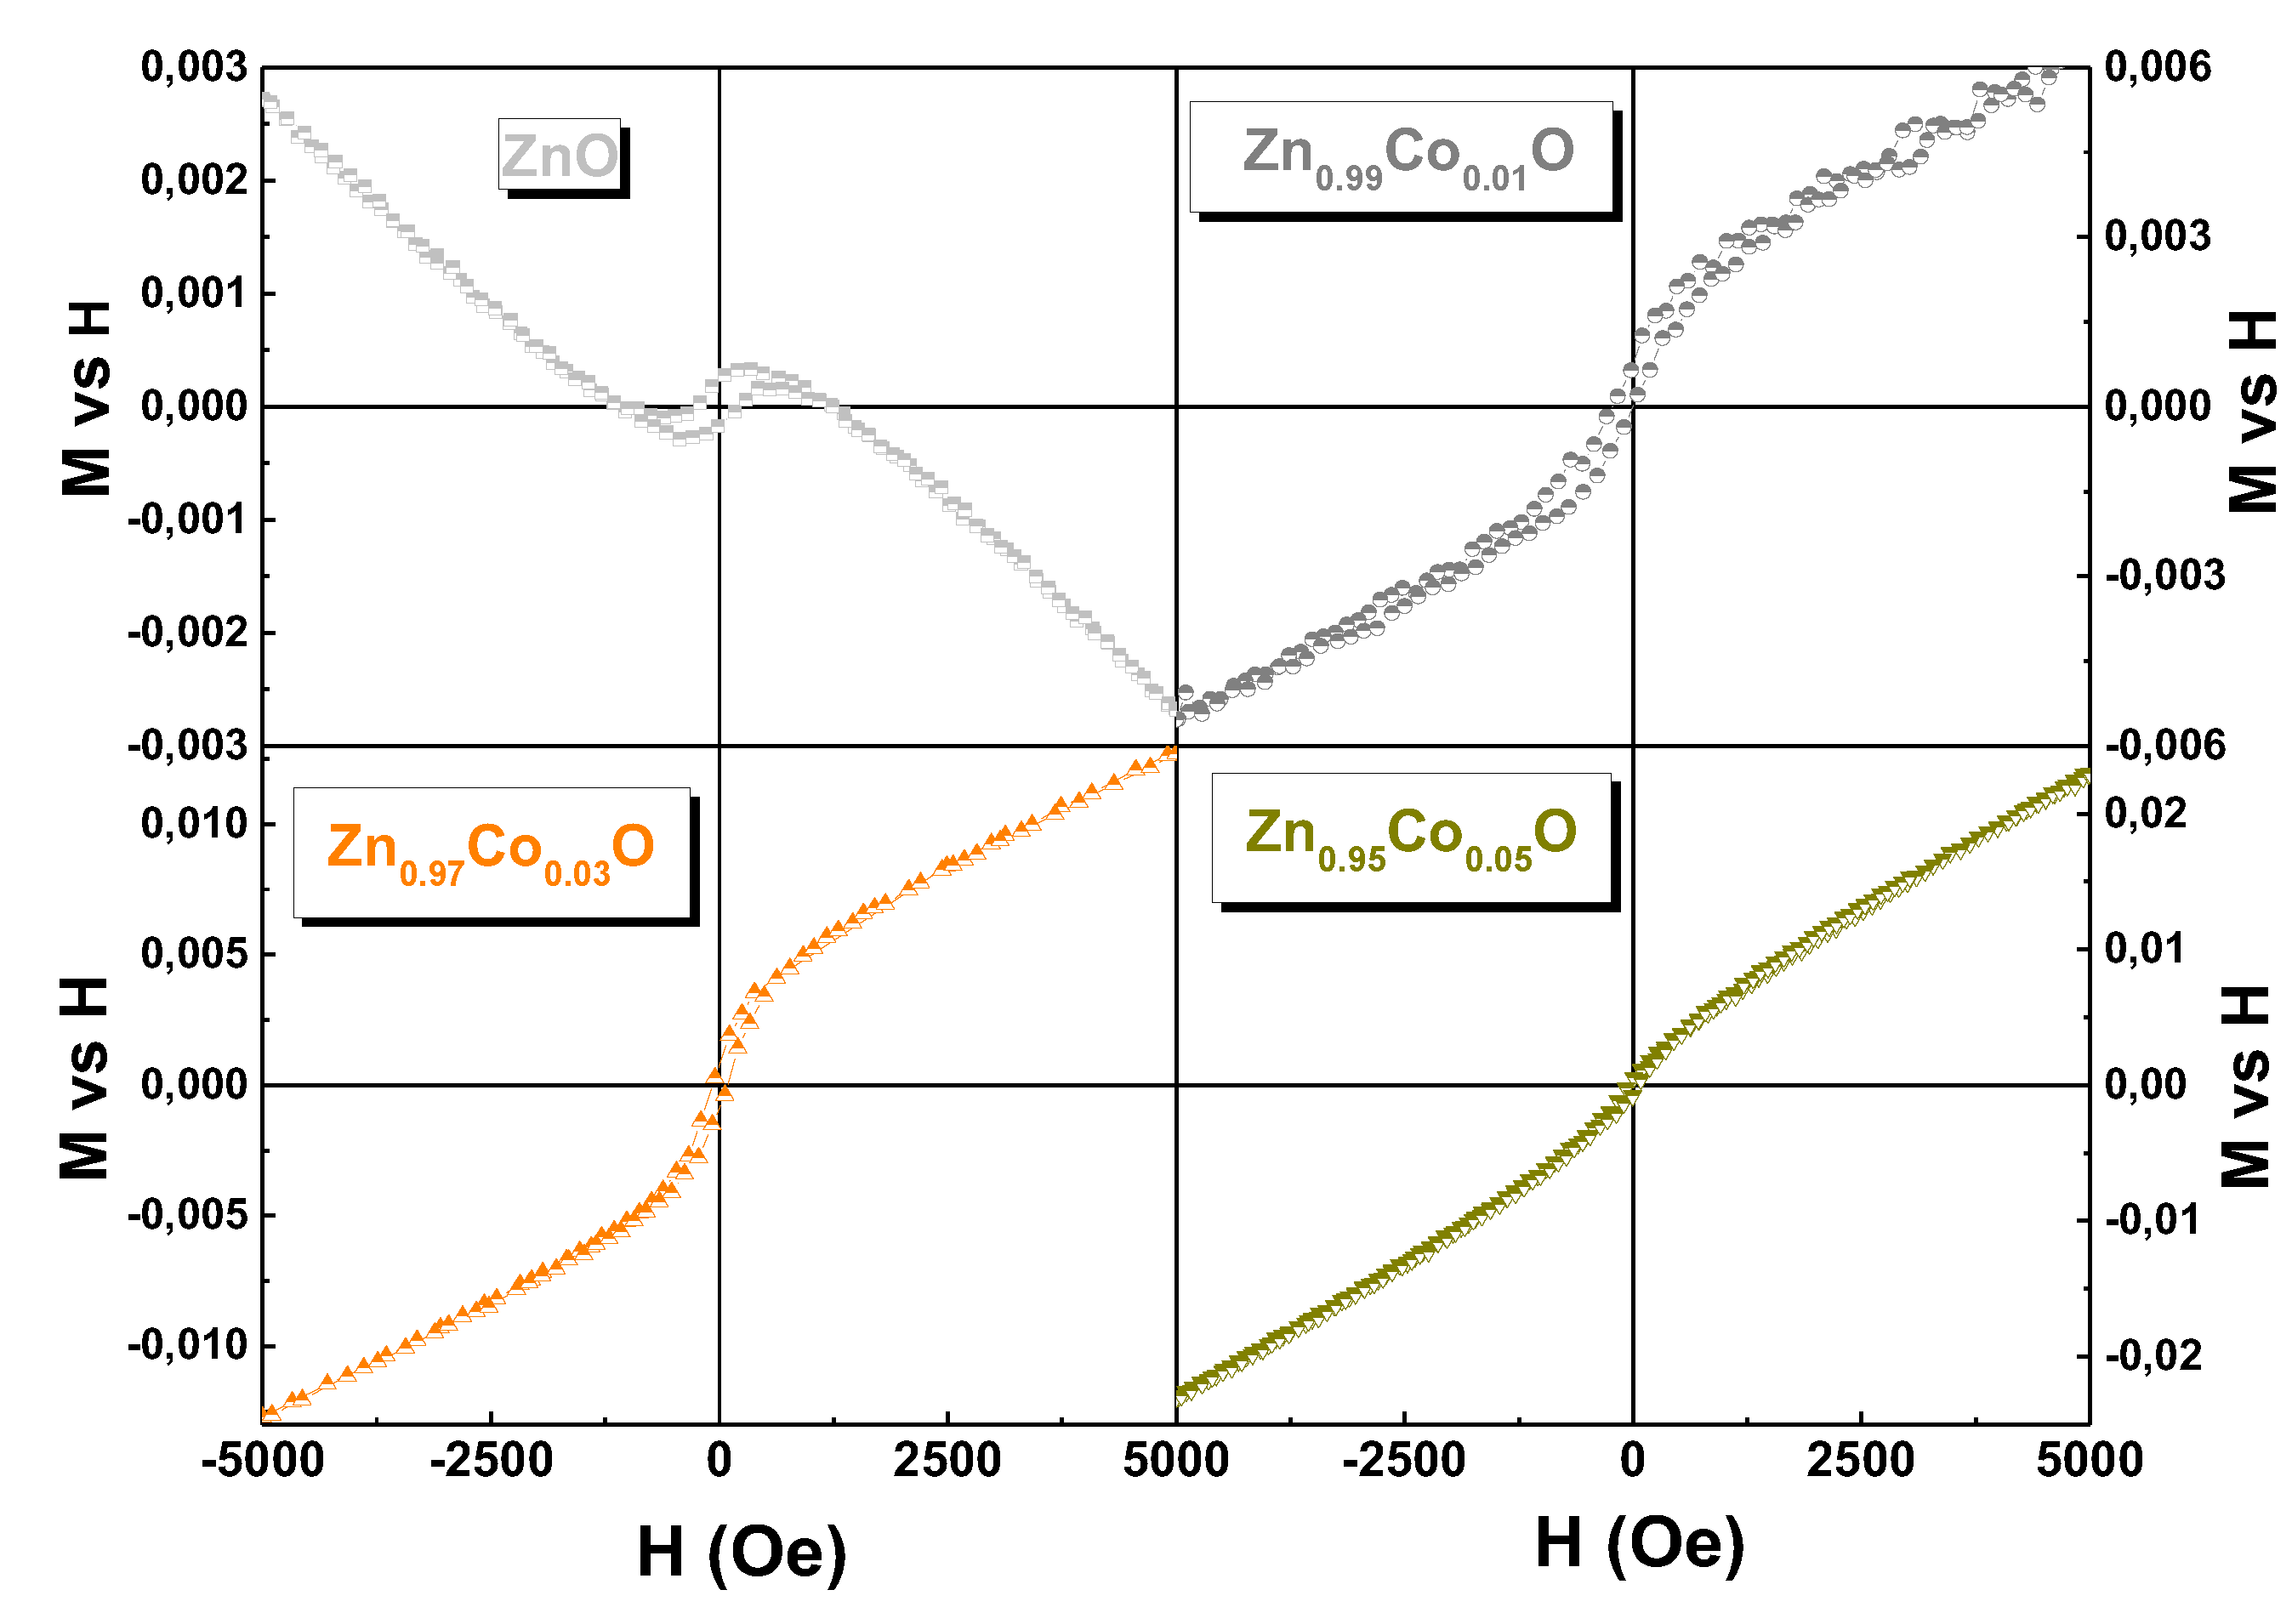
Figure 10.
RT hysteresis loops for Zn1-xCoxO samples with x= 0.00, 0.01 ,0.03 and 0.05, where the lineal component has been subtracted.
Figure 10.
RT hysteresis loops for Zn1-xCoxO samples with x= 0.00, 0.01 ,0.03 and 0.05, where the lineal component has been subtracted.
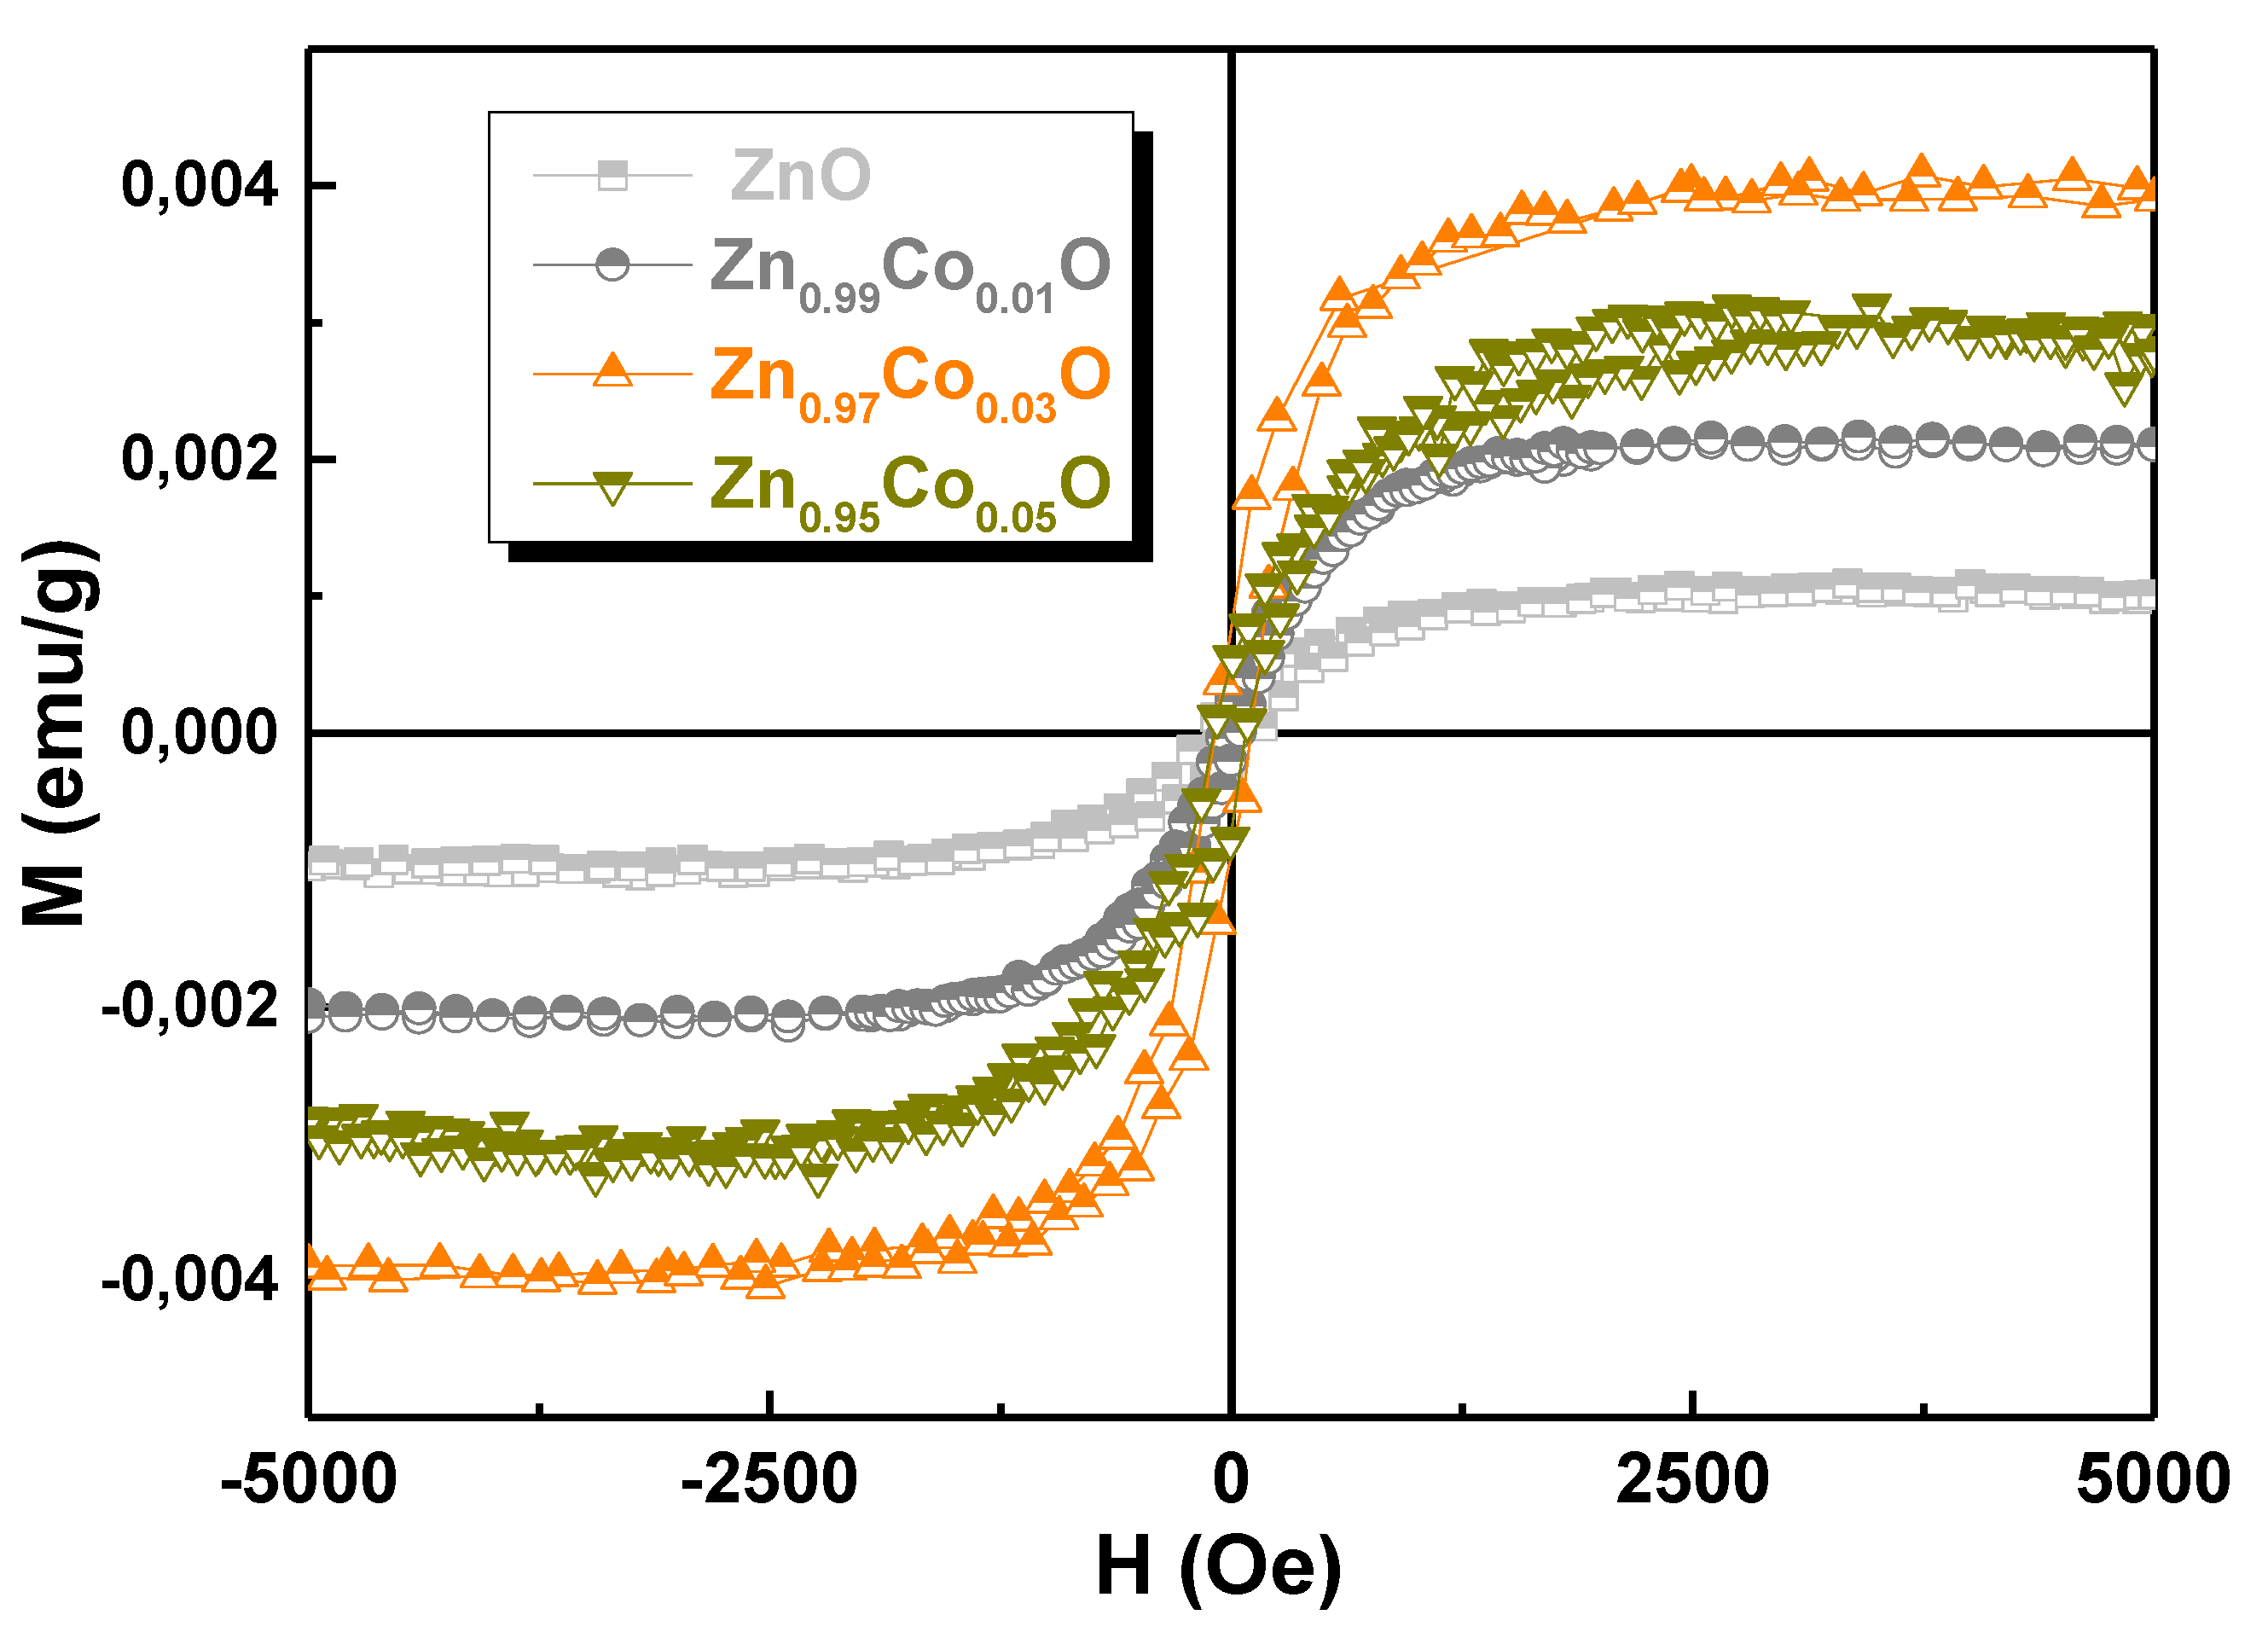
Figure 11.
FC and ZFC curves for Zn1-xCoxO samples with x= 0.0, 0.01,0.3 and 0.05. The samples with x= 0.01,0.3 and 0.05 were fitting using modified Curie−Weiss law (see text).
Figure 11.
FC and ZFC curves for Zn1-xCoxO samples with x= 0.0, 0.01,0.3 and 0.05. The samples with x= 0.01,0.3 and 0.05 were fitting using modified Curie−Weiss law (see text).
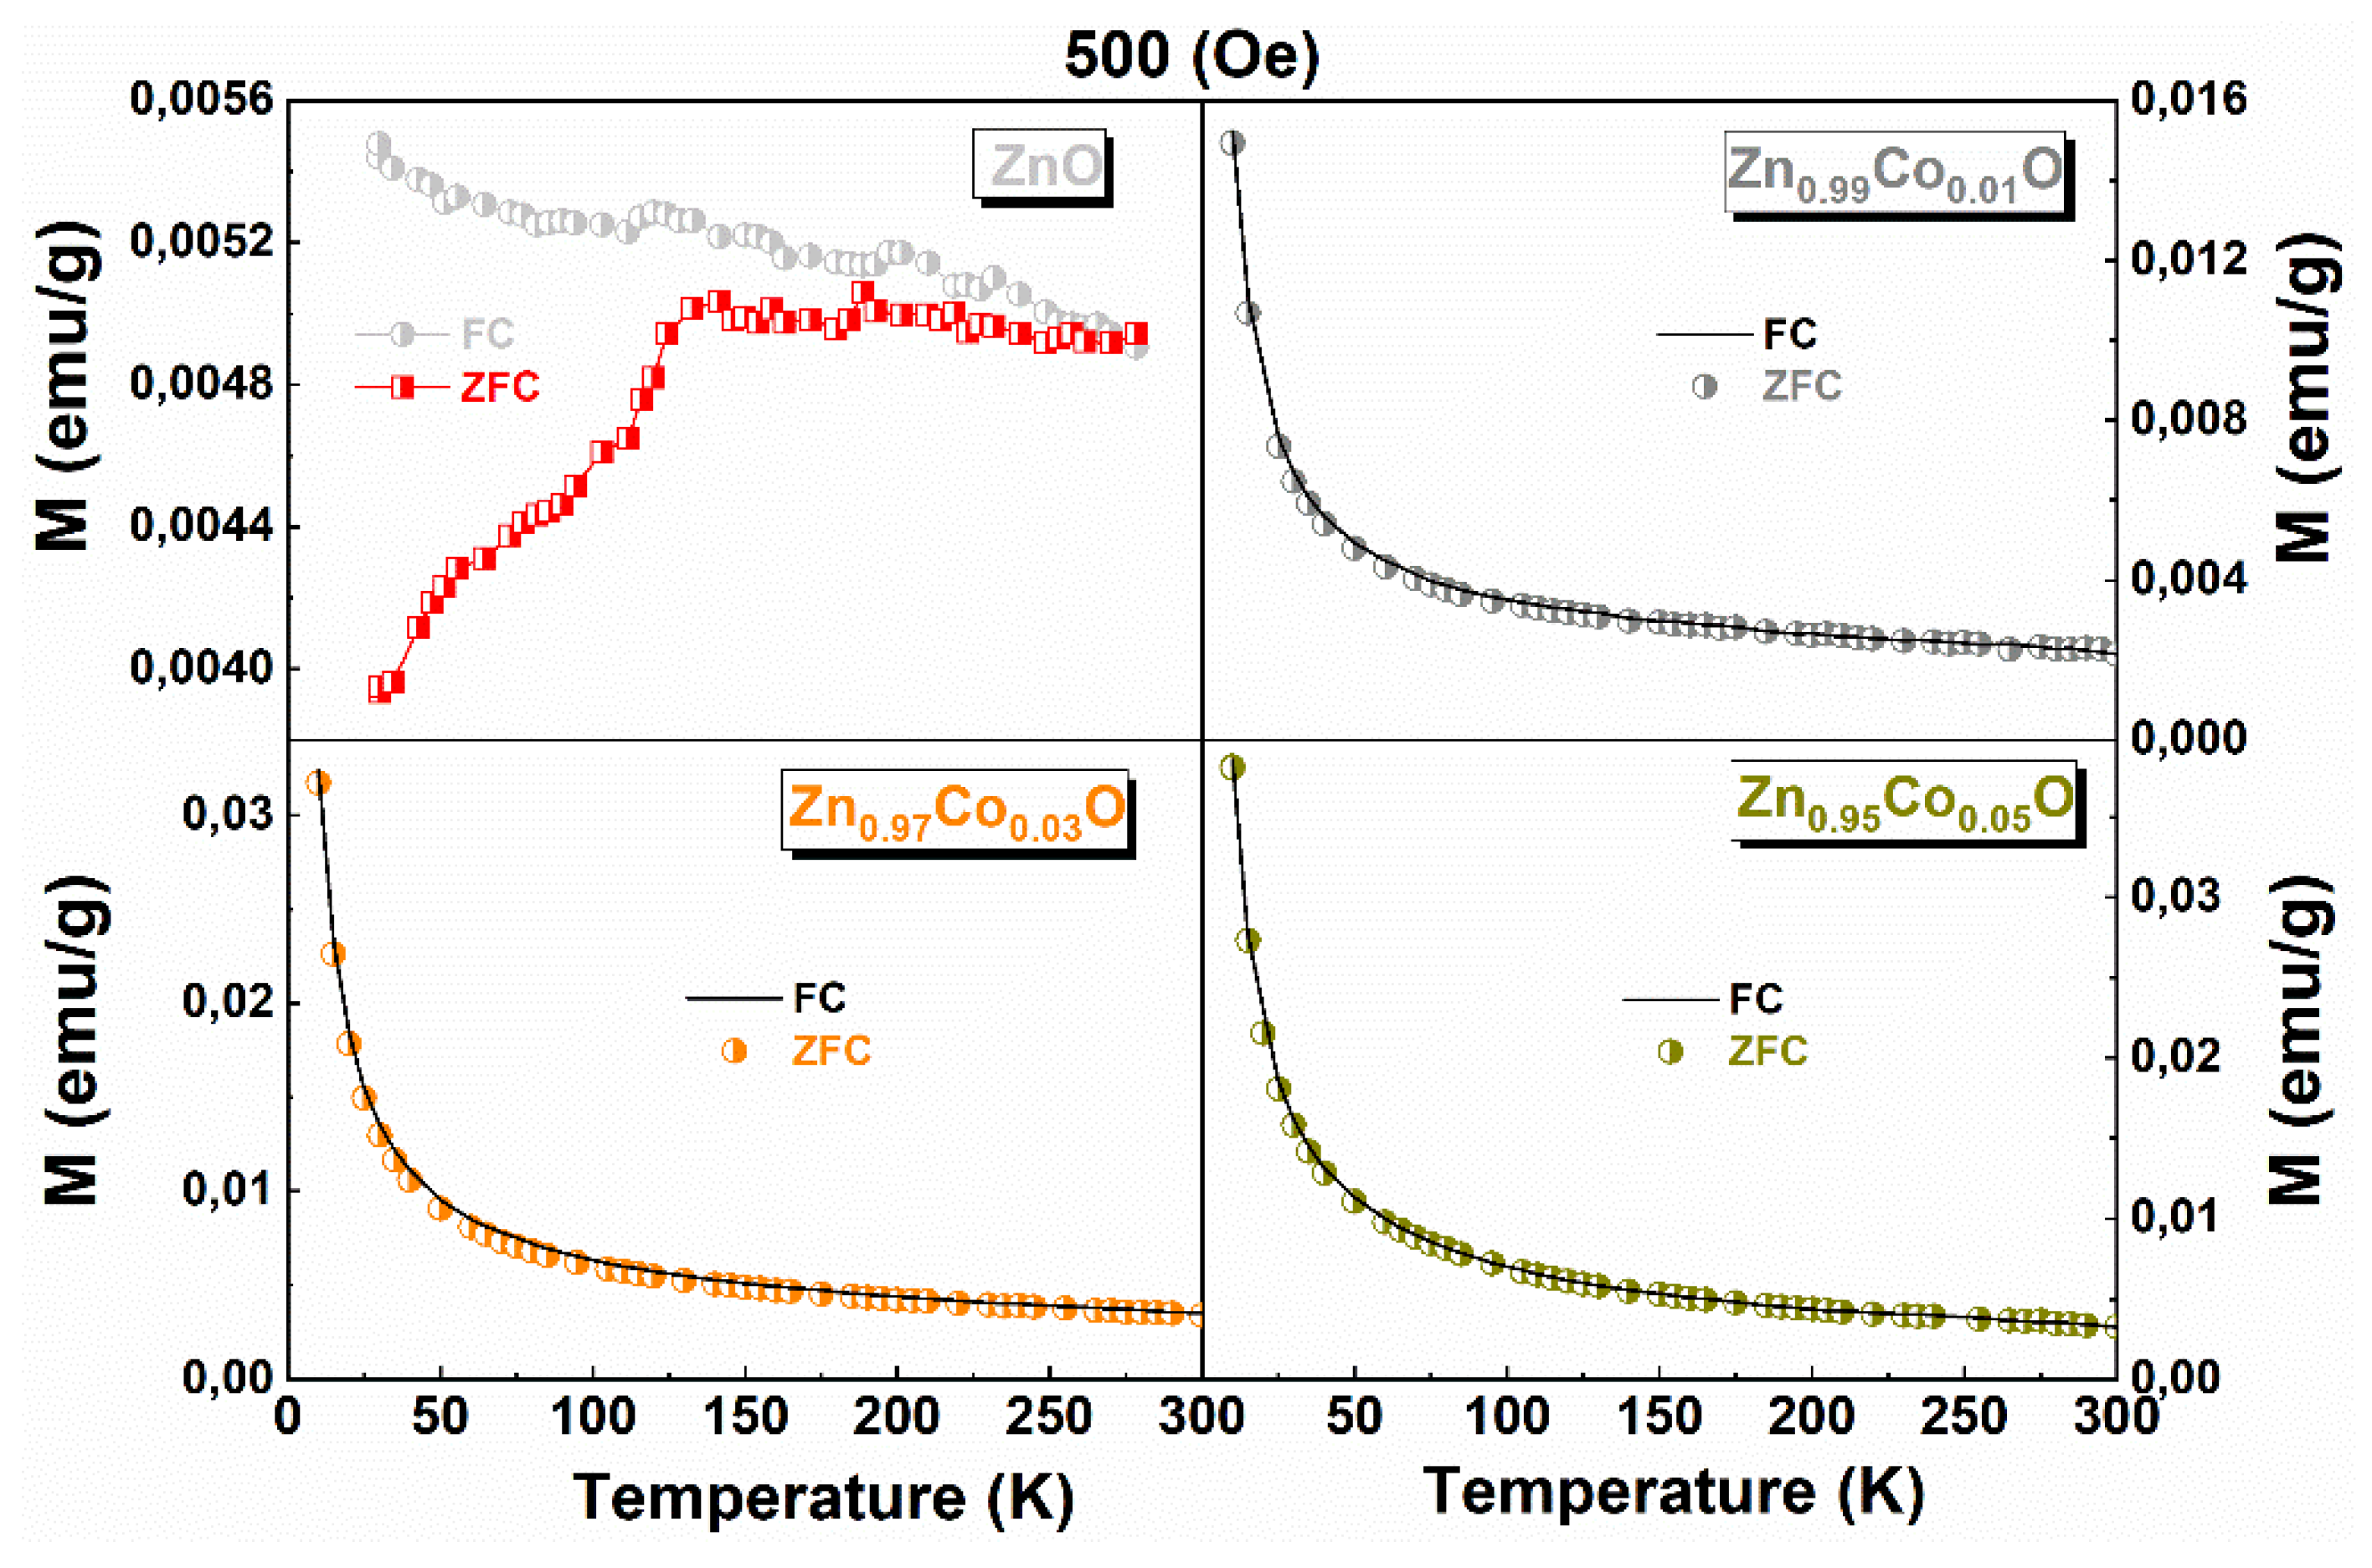

Table 1.
Variations of magnetization of non-paramagnetic contributions (Mo), Curie constant (C), and Curie-Weiss temperature (θ) parameters of Zn1−xCoxO as a function of x following the modified Curie-Weiss law fit.
Table 1.
Variations of magnetization of non-paramagnetic contributions (Mo), Curie constant (C), and Curie-Weiss temperature (θ) parameters of Zn1−xCoxO as a function of x following the modified Curie-Weiss law fit.
| x in Zn1-xCoxO | Mo (emu/g) | C (emu K/g Oe) | θ (K) |
|---|---|---|---|
| 0.01 | 0.94 | 0.15 | 1.26 |
| 0.03 | 1.29 | 0.33 | 1.41 |
| 0.05 | 1.09 | 0.45 | 2.72 |
Disclaimer/Publisher’s Note: The statements, opinions and data contained in all publications are solely those of the individual author(s) and contributor(s) and not of MDPI and/or the editor(s). MDPI and/or the editor(s) disclaim responsibility for any injury to people or property resulting from any ideas, methods, instructions or products referred to in the content. |
© 2025 by the authors. Licensee MDPI, Basel, Switzerland. This article is an open access article distributed under the terms and conditions of the Creative Commons Attribution (CC BY) license (http://creativecommons.org/licenses/by/4.0/).
Copyright: This open access article is published under a Creative Commons CC BY 4.0 license, which permit the free download, distribution, and reuse, provided that the author and preprint are cited in any reuse.


