
Submitted:
08 July 2025
Posted:
09 July 2025
You are already at the latest version
Abstract
In this paper, a study was carried out about the perception of postural discomfort concerning the seating in the middle rear seat of a car. The aim was to identify which body parts are most stressed and which elements or factors involved in the human-car interaction cause major discomfort. Even if the literature confirms that postural-physical comfort is one of the crucial elements in car seat design, nothing has been made about the comfort and experience of the car's middle rear seat. A two-step analysis was conducted: a Preliminary survey and the Design of a valid experiment to investigate passengers’ discomfort perception in the middle rear seat. Twenty people participated in the test, two different car models (a City Car and a C-SUV) and a short ride were chosen to perform the experiments. Postural discomfort was assessed through questionnaires and using a 5-point Likert scale. Other factors were considered such as the interference of body parts with the vehicle’s tunnel and roof, and the presence of other passengers on either side of the middle passenger. Interference with other passengers and side thrusts when cornering affected the shoulders and arms discomfort. The headrests made the neck and head feel uncomfortable, while the central tunnel forced passengers to adopt uncomfortable postures for their lower limbs. The study highlights key elements that negatively impact passengers' perceived discomfort. The results obtained from this analysis can offer interesting suggestions for automotive manufacturers to improve passengers’ travel.
Keywords:
Car-seat
; Discomfort
; Posture
; Rear seat
; Passenger behavior
1. Introduction
Today's global competition has led many automakers to design products based on consumer preferences and satisfaction. Identifying seat features that can improve the driving experience is a key issue for automotive companies. Each component of a car seat is designed by engineers considering all of its characteristics [e.g. size, material, hardness, color, finish, and the interface with other car components]. At the same time, since humans are involved in the process [either as drivers or passengers], all relevant human characteristics must be studied and considered when developing the equipment [1,2,3,4].
Therefore, during the design phase, ergonomic engineers have to evaluate all the aspects that take part in the driving experience. It is necessary to fully understand the intended user group and its preferences, the environmental conditions in which the driver/user operates [such as road, traffic, and weather], how the driver/user will perform various tasks, the aspects that can positively influence the driver/user expectation such as its quality, craftsmanship, the brand. So, from this perspective, ergonomic technical, aesthetic, and production aspects, have become crucial elements in the automotive design process and, therefore, its choice by the users.
People's driving habits are changing; they travel longer and more frequently each year [5,6]. The main risk is discomfort or fatigue caused by prolonged driving [7,8,9,10]. Several studies were published on vehicle comfort, particularly referring to the seat, mental stress, and aesthetics aspects. For example, in terms of comfort, Reed et al. [11], Kolich [12,13,14], Bubb et al. [15], and Fazlollahtabar [16], emphasize anthropometry as a fundamental design aspect; Naddeo and Memoli [17], and Naddeo et al.[18] focus on driver postural comfort to evaluate accessibility and usability; Vergara & Page [19], assessed the relationship between comfort, back posture, and body movements to evaluate seat comfort; in Seokhee et al. [20], in Kolich and Taboun [21], and in Zhao et al. [22] postural changes were detected through dynamic body pressure distribution and used to assess driver discomfort; in Reed et al. [11], in Kolich [12], in Warska et al. [23], and in Naddeo et al. [24] seat stiffness, breathability and geometry, were considered to be the factors that most influence driver comfort.
Most studies reveal that people perceive major physical discomfort in the back, neck, buttocks, and thigh areas [25,26,27].
In [28], the average ride [dis]comfort level, regarding accelerations [longitudinal, lateral, and vertical], was stated the lack of comfort is also associated with the frequency of the vibration and is directly proportional to the intensity of it.
Several studies indicated that the vibration transmitted from a vehicle to the human body affects a vehicle occupant’s perceptions of seating comfort especially for longer-term [>45 min] driving and riding scenarios [29,30].
Furthermore, it is known that low frequency vibrations close to 1 Hz are transmitted throughout the body in-creasing malaise, while higher frequency vibrations are attenuated by the human body. It is also interesting to note that monotone continuous low-frequency vibrations increase fatigue, while transient vibrations produce stress[31].
Therefore, physical comfort is highly among the factors that influence drivers' and passengers' decisions to buy, and car manufacturers consider discomfort as a design requirement that is mainly linked to seats’ design.
So, the literature confirms and offers a lot of studies in which is demonstrated that comfort is one of the crucial elements in car seat design [32,33,34]. Several types of human-vehicle interaction variables that influence the user's [dis]comfort were analyzed human factors [as age and gender], environmental factors [as temperature, noise and pressure], spatial factors [as seat shape] and dynamic motion factors [vibration]. Meanwhile, nothing has been made about the comfort and experience of the car's middle rear seat. Quattlebaum and Stylidis [35], conducted a preliminary study of perceived comfort in car seats using digital information about the physical components; Hatoum and Ghaddar [36] conducted a study about a rear cooling system using heat pipes embedded in the seat itself to improve passengers' comfort. People like comfortable seats [37] and in a 4-doors/5-seats car, the middle rear seat is the least desirable, most uncomfortable and most "un-cool" place in the vehicle. In this paper, a study was carried out about the perception of postural discomfort concerning the seating in the middle rear seat of a car. The discomfort evaluation, overall and localized, was carried out by relating it to seat characteristics and the interaction of human body parts with interior parts of the vehicles. After a survey, aimed at identifying and collecting as much data as possible on the human experience of using such a seat, the study was combined with extensive test sessions. The tests were conducted on the seats of two different car models: a City Car [Fiat Panda] and a C-SUV [Renault Arkana]. 20 participants were asked to perform the tests and fill a questionnaire. The paper's aim was to provide an instrument of investigation for the middle rear seat discomfort, so a short ride was chosen to perform the experiments. The postural discomfort measurement was assessed by asking participants to rate it on a 5-points Likert scale. The Likert scale is the most often used in the evaluation of seat vehicle [dis]comfort: it is easy to understand/administer, and several studies showed good significant results [12,13,21,38,39]. The research questions are: [1] Does the middle rear seat problem exist? [2] What do subjects feel during their experiences? [3] How can we assess the discomfort in middle rear seat? [4] Is it possible to suggest solutions to reduce the discomfort related issues?
2. Material and Methods
2.1. Purpose
In this study, a methodology to evaluate the effects of the car's middle rear seat on passenger seating behavior and perceived postural discomfort is shown. The aim was to identify which body parts are most stressed and which elements/factors, involved in the human-car interaction, cause major discomfort.
2.2. Procedure
This study was carried out strictly in compliance with the Ethical Regulation of the University of Salerno. The procedure was organized in three steps starting from the research questions.
1.A General Survey development to check, firstly, if the problem under investigation is common and, secondly, to identify aspects/factors that could influence the car experience in terms of postural [dis]comfort and physical wellbeing.
2.Definition of the best test setup in terms of participants to be involved in the tests, car to use, track typology, test procedure and development of an adequate questionnaire to be administered at the end of the tests to acquire the necessary data.
3.Data analysis. Data was gathered and analyzed to evaluate possible correlations among the different aspects/factors identified in the previous steps. As a result, some first guidelines and suggestions to improve the passenger experience have been formulated.
2.3. General Survey
First of all, a brainstorming was conducted among the authors, experts in the automotive design field and 10 students who often travel with other 4 people in a car [to/from the University] to identify main problems experienced by a passenger sitting in the car's middle rear seat. The output of the brainstorming was a questionnaire that have been spread out, using Google® Forms, among Italian Universities obtaining 120 answers.
The output of questionnaire’s answers analysis was a survey composed of 18 questions with closed-, semi-closed, and open questions. The Likert 5-point scale was used to investigate [dis]comfort perception. The questions concerned: demographic information [gender, age, and nationality]; the frequency of being a passenger in the middle rear seat; the type of car the interviewee usually travels in; and the trip time. Other questions were aimed at evaluating the central seat in terms of space, presence of headrest, visibility, lateral thrusts to which the subject is exposed when cornering and perceived acceleration when cornering and braking, climate control system, interference with the vehicle central tunnel and roof, and interference due to the presence of two other passengers on either side.
2.4. Participants
Twenty university students [12 males and 8 females], all volunteers, participated in the experiment. None had a history of muscular-skeletal diseases. Participants reported riding in the middle rear seat at least 3 times a month. The main characteristics of the subjects are summarized in Table 1. The subjects were informed of the nature of the tests and their written consent, in accordance with the Ethical standards of the University of Salerno, was obtained.
2.5. Path and Car
The analysis of Survey results gave evidence of more used cars by travellers: A- segment and C-SUV segment. For this reason, two cars were chosen to conduct the on-road test: a Fiat Panda, that is a City Car belonging to the A-segment, and a Renault Arkana, belonging to the C-SUV segment. The path chosen for testing was a city route and was 11,7 km long. The tests were carried out following the path in Figure 1, located in [eliminated for blind version]. The path included bumps, 90-degree turns, and traffic circles, as well as stop signs, and downhill and uphill sections, in order to experience, as passenger, the main critical road conditions that could bring a lower comfort condition.
For the tests only two drivers, one for the SUV and one for the City Car [height equal to 175 cm and 178 cm respectively] were chosen. In this way the driving mode for all the tests was similar. The drivers, in both cars, positioned the front seat according to their preferences to drive comfortably. The inclination of the backrest was 23° for the SUV and 25° for the City Car. The same inclination was then set also for the front seat/passenger. The rear seats of used vehicles, instead, were fixed as in the rear seats there were no possibilities of adjustment of the seat.
2.6. Test Procedure
The experiments were organized in two sessions, one for each car. During the implementation of dynamic tests, the two cars followed the same path and maintained, as much as possible] a similar speed [in compliance with the speed limits for urban roads, an average speed of around 34,35 km/h; for interurban roads, an average speed of 47,80 km/h; for highways, an average speed of 110,20 km/h]. The testing order was planned for each participant adopting the Latin Square Method [40] to randomize the order while keeping the experiments’ repeatability. Driving was moderate, at a normal road speed, never overtaking any other cars, thus also reflecting the impact of road traffic. Each test lasted approximately 21 to 26 minutes. It helped to not consider the “time effect” on the evaluation [45]. The experiment took place in May, with a slight mugginess in the air and a temperature of 26 °C. To evaluate the discomfort caused by the direct air jet targeted at the middle rear seat, the air conditioning was utilized and set at 21°C temperature. Both cars were equipped with a camera system so that the whole test could be recorded and then frames were captured.
In Figure 2, the cameras' point of view [red arrow] and the legs' space, transverse and horizontal [in mm], are highlighted. The cameras were placed at the same point for both cars so the passengers could be filmed from the same angle for the different tests. The camera used for the tests conducted on the Fiat Panda was that of the Google Pixel 7 smartphone, while a Xiaomi Mi action camera was used for the tests on the Renault Arkana.
In Figure 3 some frames from the video footage captured during the tests are reported. In all the tests and for both the cars, it was noted that participants assumed the same posture: hands on the legs.
For the acceleration data, a Samsung Smartphone with Phyphox app installed was used. It allows access to the accelerometers of the smartphone with a maximum sampling rate of 100 Hz. The smartphone was chosen because non-intrusive and car-independent [ https:/ /phyphox.org/, n.d.]. A screenshot of the application during data recollection is included in Figure 4.
2.7. Questionnaire
The questionnaire was developed considering the Tourangeau model [41] for interviewer answer process, that is considering the four cognitive stages or process while answering the question: comprehension of question, recall of memories, retrieval and judgment for attitude questions, the translation of judgments into responses. Pilot tests were conducted, and a screen of questions was done to minimize survey errors [variance and bias] [42,43,44,45,46]. All twenty participants in the experiment promptly completed an online questionnaire using the Google Forms platform. This questionnaire aimed to gather their responses regarding the level of physical discomfort experienced while sitting in the middle rear seat during the car ride. The participants were asked to respond to the questionnaire twice. Once by selecting the SUV option, referring to the experience in the C-SUV vehicle, and once by responding based on the experience in the City Car.
The questionnaire was divided into three sections. The first section focused on gathering anthropometric data from the participants [gender, age, height, and weight] and the tested vehicle, either a SUV or a City Car. The second section aimed to evaluate the discomfort caused by the seat itself and by the interiors’ parts the participants interacted with. For the seat, participants evaluated the perceived discomfort related to width, depth, and stiffness of the seat cushion, height and width of the backrest, seat belt and headrest [Figure 5a]. About the interaction with interiors’ parts, the questionnaire reported questions about the perceived discomfort related to interference with other passengers, lateral thrust during turns, thrust forward when braking, central rear air conditioning vents, central tunnel, cabin height, and visibility [Figure 5b]. Two specific questions on the discomfort caused by vibration. The rating provided from 1 to 5, with 1 indicating “not at all influential” and 5 indicating “extremely influential”.
Lastly, the third section was dedicated to investigating the participants' physical overall discomfort perceived in different body parts through a 5-point Likert scale for nine specific body regions [Figure 6]. The rating provided ranged from 1 to 5, with 1 indicating "No discomfort" and 5 indicating "Extreme discomfort.
3. Result and Discussion
An ex-post analysis of recorded movies has been performed in order to evaluate the behavior of subjects while performing the test and exclude the one that performed too many movements or had an unpredictable behavior. The analysis of recordings allowed avoiding to exclude any subject, due to the very low possibility of doing movements: the general lack of space for legs and shoulders and the presence of two other people on the rear seat-sides, did not allow any kind of strange movement; that happened both in the City Car and in the SUV.
Wilcoxon Signed Rank test was performed to calculate whether there were significant differences between data, particularly for comparing experiences in both cars. Correlations between the physical perceived discomfort [the overall and the local one] and the elements/factors involved in the interaction [seat, other passengers, lateral thrust during turns, thrust forward when braking, central rear air conditioning, central tunnel, and visibility] were calculated with IBM® SPSS® Statistics version 24 to evaluate if investigated factors affected the discomfort or not. Spearman correlations were computed since data could be not normally distributed.
Table 2 shows the mean the variance of overall discomfort, for the City Car and for the SUV, perceived by the test participants. The overall discomfort for the City Car is higher than SUV, with average values of 3.8 and 3 respectively. Although the average for both cars is similar, the variance is equal to 0.72 for the City Car and 1.16 for the SUV. For the City Car, therefore, there is less dispersion of the data. This shows that, for the City Car, although the participants had different anthropometric measurements, and perceived discomfort in the different body parts and related to the different elements of the passenger compartment differently, their perception related to the overall discomfort was similar.
Table 3 shows the number of participants who assigned that value of overall discomfort, both for the SUV and for the City Car, through the questionnaire. The data shows that, for the City Car, the participants assigned discomfort scores concentrated between 3, 4, and 5. For the SUV, however, the scores were concentrated between 2, 3 and 4.
Figure 7 and Figure 8 depict the trend of perceived discomfort related to the geometrical characteristics of the seat and elements/factors involved in the interaction. As can be seen from the graphs, for the City Car, the discomfort related to all the factors always has higher discomfort values. This result is in line with overall discomfort.
For both SUV and City Cars, the most critical aspects for perceived discomfort are the width of the backrest [Figure 7], as regards the seat itself, and the interference with other passengers and lateral thrust when cornering [Figure 8], regarding the factors involved in the interaction.
To understand which factors influenced global discomfort, a correlation analysis was carried out using the Spearman index [data not normally distributed]. The most significant results are reported in Table 4. The first result was a complete lack of correlation among investigated comfort and discomfort parameters and anthropometric data, age and weight; it was probably due to the limited number of subjects and to the lack of space in both cars that is perceived as uncomfortable independently from those body characteristics.
Regarding local discomfort, Table 5 shows the average discomfort values for each part of the body, both for the City Car and for the SUV.
Similarly, to overall discomfort, body region perceived discomfort is higher for the City Car. For the SUV, apart from the arms, the upper body appears to have a lower discomfort score [below 3]. Participants gave evidence that the head and neck, shoulders, back and lumbar parts are therefore the parts less affected by discomfort. Statistical correlation analyses were conducted to evaluate what discomfort in the different parts of the body was related to. In particular, the analyses aimed to highlight whether [and which] the elements/factors involved in the interaction and the seat itself had an impact on local discomfort; Table 6 [City Car] and Table 7 [SUV] show the mentioned correlations.
For the City Car [Table 6], arms discomfort, which is the most critical part [Mean Value 3.95, see Table 5] is related to the width of the backrest and the interference with other passengers. Air conditioning is a critical element for the lower limbs [correlations significant at the 0.01 level]. Furthermore, the characteristics of the cushion [stiffness and width] have a negative impact on the discomfort of buttocks and thighs.
For the SUV, the seat characteristics seem to have a greater impact on local discomfort [higher correlation indices compared to the City Car] [Table 7]. In particular, the most critical seating factors are the headrest, the width and firmness of the seat cushion, and the width of the backrest. Interference with other passengers greatly affects the discomfort of arms and shoulders. Unlike the City Car, the lateral forces in curves prove to be an element of discomfort, especially legs, feet, and thighs.
4. Discussion and Conclusion
This contribution wanted to widen, through a scientific study, the knowledge related to the car's middle rear seat and the impact on passenger seating behavior and perceived postural discomfort.
Twenty people participated in the test, two different car models [a City Car and a C-SUV] and a short ride were chosen to perform the experiments. Participants were asked to rate four aspects of postural discomfort: overall discomfort, localized discomfort, vibrational discomfort and the one caused by the various components of the passenger compartment the subjects interacted with.
Regarding the overall discomfort, the results showed that the SUV has a significantly better [lower] average discomfort score compared to the City Car. Particularly, for the SUV the value associated with the overall discomfort is concentrated on scores 1,2, and 3 while for the City Car on 3, 4, and 5. Likewise, the discomfort related to the different elements/factors involved in the interaction [seat, other passengers, cabin height, lateral thrust when cornering, forward thrust when braking, central rear air conditioning, central tunnel, and visibility] results has higher values for the City Car. The most critical aspects, for both the car, in terms of perceived discomfort are the width of the backrest, interference with other passengers, and lateral human body thrust when cornering.
The correlation analysis was crucial to identify the main issues relating to the discomfort perceived in the central rear seat. Non-trivial correlations emerged with the elements/factors involved in the interaction. Specifically, for the seat, two elements resulted as critical: the backrest width and the headrest [shape and position]. This result makes clear the other important correlations. The width of the backrest causes discomfort in the upper limbs [Arm, shoulder, and back] and furthermore, the space available makes interference with other passengers unpleasant, especially when cornering. All these elements emerged from the correlation analysis, with positive and strong correlations. The headrest affected the discomfort perceived and particularly the head one.
Other critical elements, that were highlighted by statistical correlation, were the position of the air conditioning system, which created discomfort for the knees and legs, and of the central tunnel forced passengers to adopt uncomfortable postures for their lower limbs.
In conclusion, the results highlighted that for both cars the critical factors are the same: the positioning of the air conditioning, interference with the passengers, the headrest, and the width of the seat.
The results obtained from this analysis can offer interesting suggestions for automotive manufacturers to improve passengers’ travel. Regarding the seat design, results suggest increasing the width of the headrest and the backrest of the middle rear seat to reduce perceived discomfort, especially in the head and shoulder area. The headrest plays a fundamental role in the design of the vehicle both regarding the safety of the occupants during a rear-end collision [47,48,49] and to counteract the continuous vibrations to which the subject is exposed during a car journey [50,51]. Furthermore, there are growing concerns about the increase in motion sickness in autonomous cars for which an optimal head restraint could play a crucial role [52]. An optimal headrest should guarantee a better level of perceived comfort and reduce the risk of neck injuries in the event of a rear-end collision.
The lateral thrusts and the presence of side passengers are two other elements that affect the perceived discomfort. For a seat car, lateral support is considered one of the essential elements for comfort [53,54]. Furthermore, it is demonstrated that poor lateral support leads to a heavier physical load competing with lateral movement [55]. A solution could concern the provision of lateral bolsters to “hold and wrap” the passenger. The lateral bolsters have a dual purpose: to reduce accidental interference between arms and shoulders during curves and to contain the occupant motion during lateral thrusts. Results also showed that the air conditioning was a crucial aspect of the discomfort perceived; the position of the air conditioning vents had a negative impact on overall discomfort and lower limbs. Various studies could be carried out to try to predict a different position of the air conditioning vents and ensure the correct distribution of air conditioning or heating to avoid discomfort to passengers' legs and knees.
In the end, we can give answers to research questions:
Does the middle rear seat problem exist? Yes, it exists, and the experiments highlight that all participants, in both car-types, feel uncomfortable in the middle rear seat.
What do subjects feel during their experiences? The feeling of discomfort is generated by a few main issues. Statistical correlations show that the width of the backrest causes discomfort in the upper limbs while the air conditioning system and the central tunnel affect the lower limb's discomfort, particularly the knees, and legs. Furthermore, the headrest proves to be a critical element affects the discomfort perceived, particularly the head.
How can we assess the discomfort in the middle rear seat? An experiment performed on a short track is able to highlight middle rear seat issues related to discomfort. The use of a two-stage analysis [first among experts and second through questionnaires to people] was effective in developing a questionnaire for investigating the factors that should affect the discomfort perception; users’ data and capabilities were gathered for a better understanding of subject-related habits and attitudes.
Is it possible to suggest solutions to reduce discomfort related issues? A greater effort, therefore, should concern the headrest for the middle rear seat to support better the head during lateral accelerations and guarantee a better level of perceived comfort. Furthermore, results show that seat design should provide for lateral bolsters to reduce the issues related to interference with other passengers and hold the passenger during lateral accelerations. Lastly, in the automotive design, a different position of the rear conditioning vents should be adopted to guarantee the middle rear passenger the same comfort level as the other passengers.
5. Limitations
This work shows the results of experiments regarding passenger behavior and discomfort in the middle rear seat. Results should have a helpful impact on vehicles’ interior design, nevertheless, some limitations need to be acknowledged.
Results are based on a pilot experimental test that involved 20 participants. This sample size cannot be considered sufficient to carry out an in-depth study of the issues, even if the sample is statistically representative. It is necessary to repeat the tests with a larger number of participants.
For the pilot tests, the path chosen was a city route and was only 11.7 km long. The paper's aim was to provide an instrument of investigation for the middle rear seat discomfort, so a short ride was chosen to perform the experiments. It is too short to capture, deeply, the dynamic changes in discomfort caused by long-term travel and the effect of vibration. Further studies may consider scenarios with longer and more diverse road conditions, such as highways, bumpy roads, and long time travelling, to obtain more comprehensive data. In a longer ride probably vibrations can cause different effects. Finally, only two car models were chosen to perform the road tests: a Fiat Panda, and a Renault Arkana. Further studies may include other car models with different types of traction and power supply [for example, electric cars are not equipped with a central tunnel]. It would be interesting, additionally, to understand what changes in terms of [dis]comfort, using cars equipped with heated and ventilated seats or to investigate the effect of seat design [sporty, luxury, economy, etc..] or seat cover type [leather, Alcantara, synthetic, etc..] on discomfort feelings.
References
- Bhise, V.D. Ergonomics in the automotive design process [Internet]. Boca Raton: CRC Press; 2012. Available from: http://www.crcnetbase.com/isbn/9781439842119.
- Barat, A.; Das S. A systematic literature review of driver behaviour in blind spot: Assessing risk and influencing factors for enhanced ergonomics in vehicle design. Ergonomics [Internet]. 2024, 67[12]:1765–81. Available from: https://www.scopus.com/inward/record.uri?eid=2-s2.0-85192508947&doi=10.1080%2f00140139.2024.2350667&partnerID=40&md5=c67a2341e4a4e42c31437eeb8522f06b.
- Zhang, C.; Duan, Y.; Pan, H.; Chen, S. Investigation into the Comfort of Automotive Seating through the Integration of Affective Engineering Design. In: ITOEC 2023 - IEEE 7th Information Technology and Mechatronics Engineering Conference. 2023. p. 2391–5.
- LeeAT. Driving Behavior: Managing Resources in a Complex Task [Internet]. Driving Behavior: Managing Resources in a Complex Task. 2023. 1 – 177 p. Available from: https://www.scopus.com/inward/record.uri?eid=2-s2.0-85173021419&doi=10.1201%2f9781003454373&partnerID=40&md5=b5c54de9b9d452fe7a4b3a7f80201010.
- Hiemstra-van Mastrigt, S.; Groenesteijn, L.; Vink, P.; Kuijt-Evers, L. Predicting passenger seat comfort and discomfort on the basis of human, context and seat characteristics: a literature review. Ergonomics. 2016, 60, 1–44. [Google Scholar] [CrossRef] [PubMed]
- Haseeb, A.; Mitra, R. Travel behaviour changes among young adults and associated implications for social sustainability. Transp Res Part A Policy Pract [Internet]. 2024, 187, 104189. [Google Scholar] [CrossRef]
- Battié, M.C.; Videman, T.; Gibbons, L.E.; Manninen, H.; Gill, K.; Pope, M.; et al. Occupational driving and lumbar disc degeneration: a case-control study. Lancet. 2002, 360, 1369–1374. [Google Scholar] [CrossRef] [PubMed]
- Dankaerts, W.; O’Sullivan, P.; Burnett, A.; Straker, L. Altered patterns of superficial trunk muscle activation during sitting in nonspecific chronic low back pain patients: importance of subclassification. Spine [Phila Pa 1976]. 2006, 31, 2017–2023. [Google Scholar] [CrossRef] [PubMed]
- Kyung, G.; Nussbaum, M. Driver sitting comfort and discomfort [Part II]: Relationships with and prediction from interface pressure. Int J Ind Ergon. 2008, 38, 526–538. [Google Scholar] [CrossRef]
- Zhang, H.; Ni, D.; Ding, N.; Sun, Y.; Zhang, Q.; Li, X. Structural analysis of driver fatigue behavior: A systematic review. Transp Res Interdiscip Perspect [Internet]. 2023, 21, 100865. [Google Scholar] [CrossRef]
- Reed, M.P.; Schneider, L.W.; Ricci, LL. Survey of auto seat design recommendations for improved comfort. 1994.
- Kolich, M. Automobile seat comfort: occupant preferences vs. anthropometric accommodation. Appl Ergon [Internet]. 2003 Jan 1;34[2]:177–84. Available from: https://eurekamag.com/research/010/221/010221783.
- Kolich, M. Predicting automobile seat comfort using a neural network. Int J Ind Ergon. 2004, 33, 285–293. [Google Scholar] [CrossRef]
- Kolich, M. A conceptual framework proposed to formalize the scientific investigation of automobile seat comfort. Vol. 39, Applied ergonomics. 2008. 15–27 p.
- Bubb, H.; Grünen, R.E.; Remlinger, W. Anthropometric Vehicle Design. In: Bubb H, Bengler K, Grünen RE, Vollrath M, editors. Automotive Ergonomics [Internet]. Wiesbaden: Springer Fachmedien Wiesbaden; 2021. p. 343–468. Available from. [CrossRef]
- Fazlollahtabar, H. A subjective framework for seat comfort based on a heuristic multi criteria decision making technique and anthropometry. Appl Ergon [Internet]. 2010, 42, 16–28. [Google Scholar] [CrossRef]
- Naddeo, A.; Memoli, S. Postural comfort inside a car: Development of an innovative model to evaluate the discomfort level. SAE International Journal of Passenger Cars - Mechanical Systems. 2009, 2[1].
- Naddeo, A.; Cappetti, N.; Ippolito, O. Dashboard reachability and usability tests: A cheap and effective method for drivers’ comfort rating. SAE Technical Papers. 2014, 1. [Google Scholar]
- Vergara M, Page Á. Relationship between comfort and back posture and mobility in sitting-posture. Appl Ergon. 2002, 33, 1–8. [Google Scholar] [CrossRef]
- Na, S.; Lim, S.; Choi, H.S.K.; Chung, M. Evaluation of driver’s discomfort and postural change using dynamic body pressure distribution. International Journal of Industrial Ergonomics 2005, 35, 1085–1096. [Google Scholar] [CrossRef]
- Kolich, M.; Taboun SM. Ergonomics modelling and evaluation of automobile seat comfort. Ergonomics [Internet]. 2004 Jun 22;47[8]:841–63. [CrossRef]
- Zhao, M.; Beurier, G.; Wang, H.; Wang, X. Driver posture monitoring in highly automated vehicles using pressure measurement. Traffic Inj Prev [Internet]. 2021, 22, 278–283. [Google Scholar] [CrossRef] [PubMed]
- Warska, M.; Barburski, M.; van, L.a.n.g.e.n.h.o.v. e L. Textile elements for car seat to improve user’s driving comfort. Journal of Industrial Textiles [Internet]. 2019, 51, 513–539. [Google Scholar] [CrossRef]
- Naddeo, A.; Morra, A.; Califano, R. Human-Centered Design and Manufacturing of a Pressure-Profile-Based Pad for Better Car Seat Comfort. Machines. 2024, 12, 6. [Google Scholar] [CrossRef]
- DELOOZEMP; KUIJT-EVERSLFM; VANDIEËN J. Sitting comfort and discomfort and the relationships with objective measures. Ergonomics [Internet]. 2003, 46, 985–997. [CrossRef]
- Vink, P.; Hallbeck, S. Editorial: Comfort and discomfort studies demonstrate the need for a new model. Appl Ergon [Internet]. 2012, 43, 271–276. [Google Scholar] [CrossRef]
- Hirao, A.; Naito, S.; Yamazaki, N. Pressure Sensitivity of Buttock and Thigh as a Key Factor for Understanding of Sitting Comfort. Applied Sciences [Internet]. 2022, 12, 15. [Google Scholar] [CrossRef]
- Förstberg J. Ride comfort and motion sickness in tilting trains. In 2000. Available from: https://api.semanticscholar.org/CorpusID:106679027.
- Ebe, K.; Griffin, MJ. Qualitative models of seat discomfort including static and dynamic factors. Ergonomics [Internet]. 2000, 43, 771–790. [Google Scholar] [CrossRef]
- Ebe, K.; Griffin, MJ. Factors affecting static seat cushion comfort. Ergonomics. 2001, 44, 901–921. [Google Scholar] [CrossRef]
- Garcia, S.o.l.a.n.o J. Generation of ride comfort index. Universidad Politecnica de Barcelona,; 2014.
- Reed, M.P.; Manary, M.A.; Flannagan, C.A.; Schneider, LW. Effects of vehicle interior geometry and anthropometric variables on automobile driving posture. Hum Factors. 2000, 42, 541–552. [Google Scholar] [CrossRef]
- Joseph, A. Sember. The biomechanical relationship of seat design to the human anatomy. 1st Editio. CRC Press; 1994. 9 p.
- Hiemstra-van Mastrigt, S.; Kamp, I.; van Veen, S.A.T.; Vink, P.; Bosch, T. The influence of active seating on car passengers’ perceived comfort and activity levels. Appl Ergon. 2015, 47, 211–219. [Google Scholar] [CrossRef] [PubMed]
- Quattelbaum, B.; Stylidis, K.; Braun, A.; Söderberg, R. Preliminary study on perceived comfort of car seats: A quantitative approach to visual cues. Procedia CIRP [Internet]. 2021, 104, 116–121. [Google Scholar] [CrossRef]
- Hatoum, O.; Ghaddar, N.; Ghali, K.; Ismail, N. Back-Cooling Car-Seat System Using Embedded Heat Pipes to Improve Passenger’s Comfort and Reduce Fuel Consumption. 2017.
- Vink, P.; Bazley, C.; Kamp, I.; Blok, M. Possibilities to improve the aircraft interior comfort experience. Appl Ergon [Internet]. 2012, 43, 354–359. [Google Scholar] [CrossRef]
- Mohammad Yusof, N.A.D.; Karuppiah, K.; Mohamad Jamil, P.A.S.; Khalid, M.S.; Mohd Tamrin, S.B.; Sadeghi, N.a.e.i.n. i H. Development of a high-powered Motorcycle Seat Discomfort Survey [MSDS]: Traffic police motorcycle. Int J Ind Ergon 2022, 92, 103374. [Google Scholar]
- Mohammad Yusof, N.; Karuppiah, K.; Md Tamrin, S.; Rasdi, I.; Mohamad, J.a.m.i.l. PAS. Likert Scale vs. Visual Analogue Scale on Vehicle Seat Discomfort Questionnaire: A Review. Malaysian Journal of Medicine and Health Sciences. 2019, 15, 159–165. [Google Scholar]
- Fisher, RA. Statistical Methods for Research Workers. In: Kotz S, Johnson NL, editors. Breakthroughs in Statistics: Methodology and Distribution. New York, NY: Springer New York; 1992. p. 66–70.
- Tourangeau, R. Cognitive Aspects of Survey Measurement and Mismeasurement. Int J Public Opin Res. 2003, 15. [Google Scholar] [CrossRef]
- Desselle, S. Construction, Implementation, and Analysis of Summated Rating Attitude Scales. Am J Pharm Educ. 2005, 1, 69. [Google Scholar] [CrossRef]
- Groves, R.; Fowler, F.; Couper, M.; Lepkowski, J.; Singer, E.; Tourangeau, R. Survey Methodology. 2004, 561.
- Salant, P.; Dillman, DA. How to Conduct Your Own Survey. 1994. 256 p.
- Presser, S.; Blair, J. SURVEY PRETESTING: DO DIFFERENT METHODS PRODUCE DIFFERENT RESULTS? In 1994. [CrossRef]
- Rothgeb, J.M.; Willis, G.; Forsyth, BH. Questionnaire Pretesting Methods. Do Different Techniques and Different Organizations Produce Similar Results. In 2007.
- Yang, Y.S.; Kim, Y.S.; Jeon ES. Behavior Analysis of Active and Proactive Headrest during Low-Velocity Rear-End Collisions. Applied Sciences [Internet]. 2020, 10[4]. Available from: https://www.mdpi.com/2076-3417/10/4/1451.
- Petru M. Development and optimization of the headrests seat according the signal Whiplash. Bulletin of Applied Mechanics. 2010 Jan 1;
- Gheorghe Marius, C.; Ionut Alexandru, G.; Daniel Dragos, T.; Florin, D.a.n.i.e. l T. Comparative analysis of driver’s motion using different headrest positions during the rear-end collision. IOP Conf Ser Mater Sci Eng [Internet]. 2022, 1220, 12046. [Google Scholar] [CrossRef]
- Niroobakhsh, M.; Gheibollahi, H.; Masih-Tehrani, M. The Key Role of Headrest Optimization in Driver Comfort. International Journal of Acoustics and Vibrations. 2019, 24, 592–599. [Google Scholar]
- Franz, M.; Durt, A.; Zenk, R. ; DesmetPMA. Comfort effects of a new car headrest with neck support. Appl Ergon [Internet]. 2012, 43, 336–343. [Google Scholar] [PubMed]
- Kato, K.; Suzuki, K.; Honda, C. Reduction of Carsickness using a Headrest with Support to Suppress Head Motion. 2021.
- O’Bannon, T.; Thomas, B.; Weierstall, M.; Shahid, M.; Khaja, I. Characterization of Seat Lateral Support as a Mechanical Behavior. SAE Int J Adv Curr Pract Mobil [Internet]. 2020, 2, 3364–3383. [Google Scholar] [CrossRef]
- Coelho, D.A.; Dahlman, S. A pilot evaluation of car seat side support: Leading to a redefinition of the problem. Int J Ind Ergon [Internet]. 1999, 24, 201–210. [Google Scholar] [CrossRef]
- Okiyama, H.; Michida, N.; Nishikawa, K.; Nouzawa, T. Objective Evaluation of Seat Lateral Supportfor Cornering. SAE Transactions [Internet]. 2001, 110, 306–310. [Google Scholar]
Figure 1.
Path for the test.
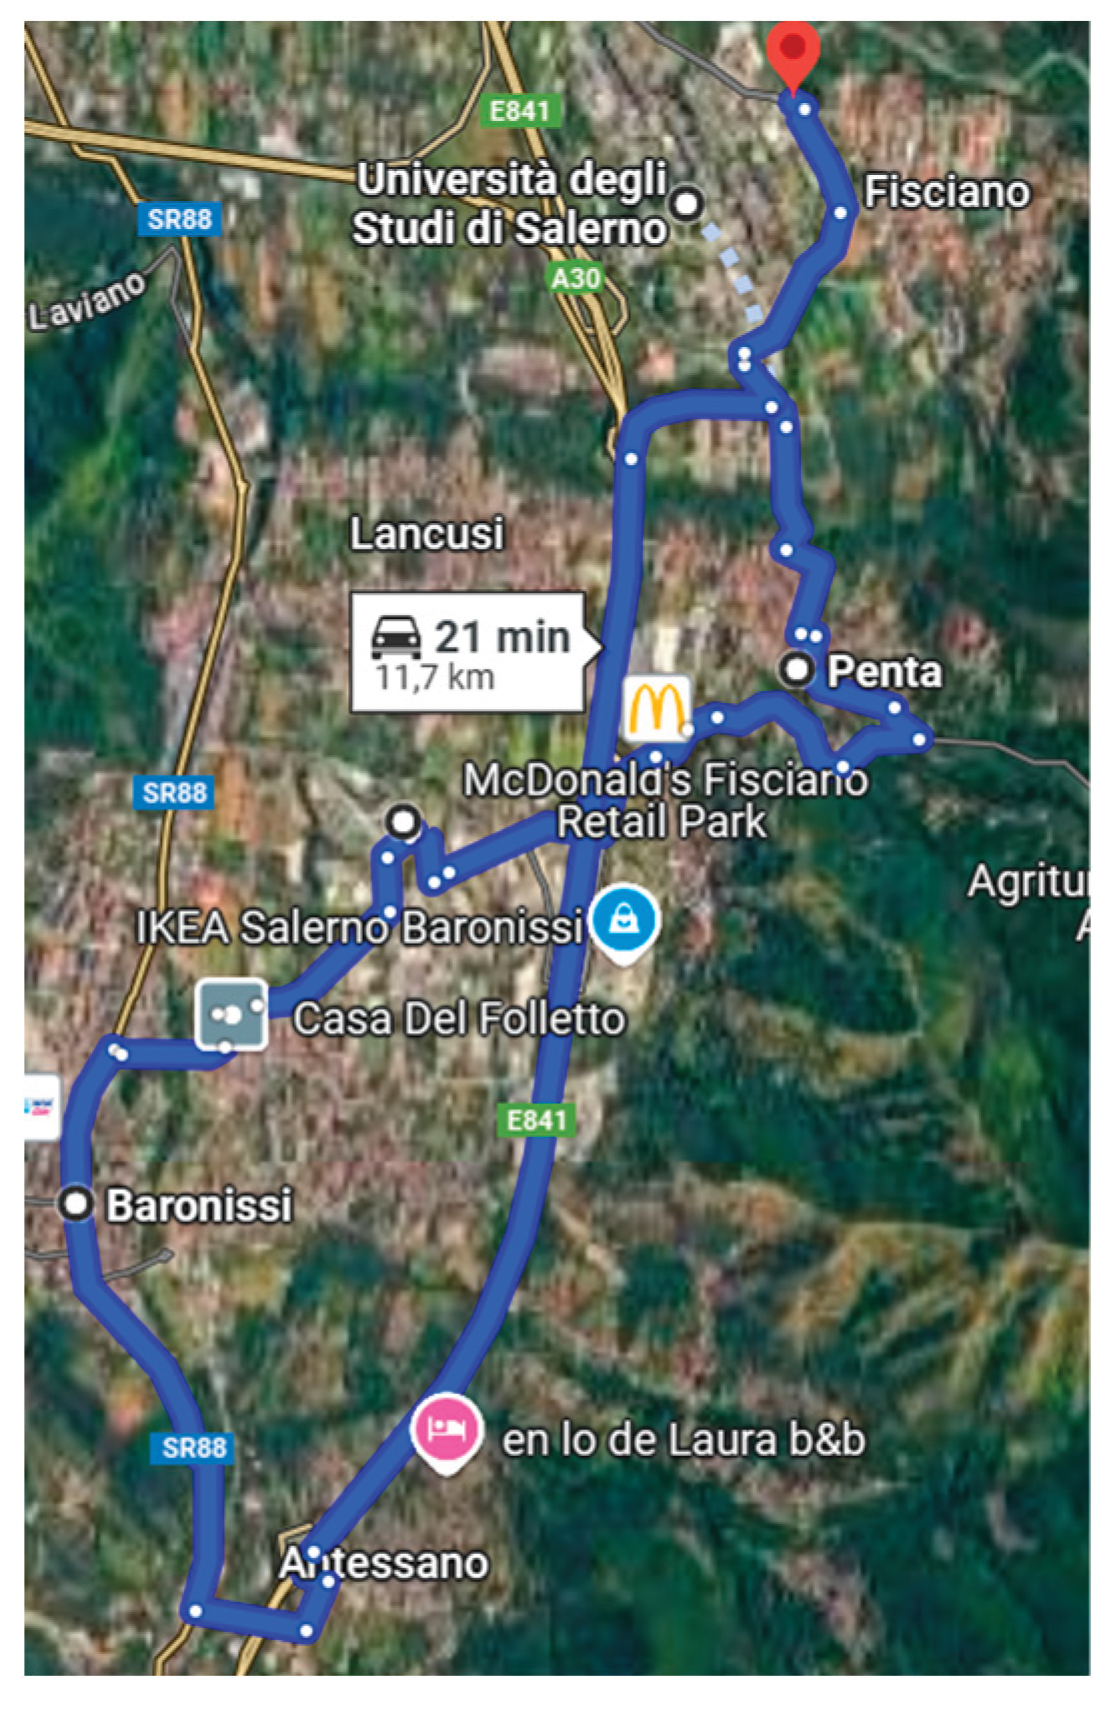
Figure 2.
Cars equipped by cameras and legs space information [width and frontal legroom]. Fiat Panda on the left and Renault Arkana on the right.
Figure 2.
Cars equipped by cameras and legs space information [width and frontal legroom]. Fiat Panda on the left and Renault Arkana on the right.
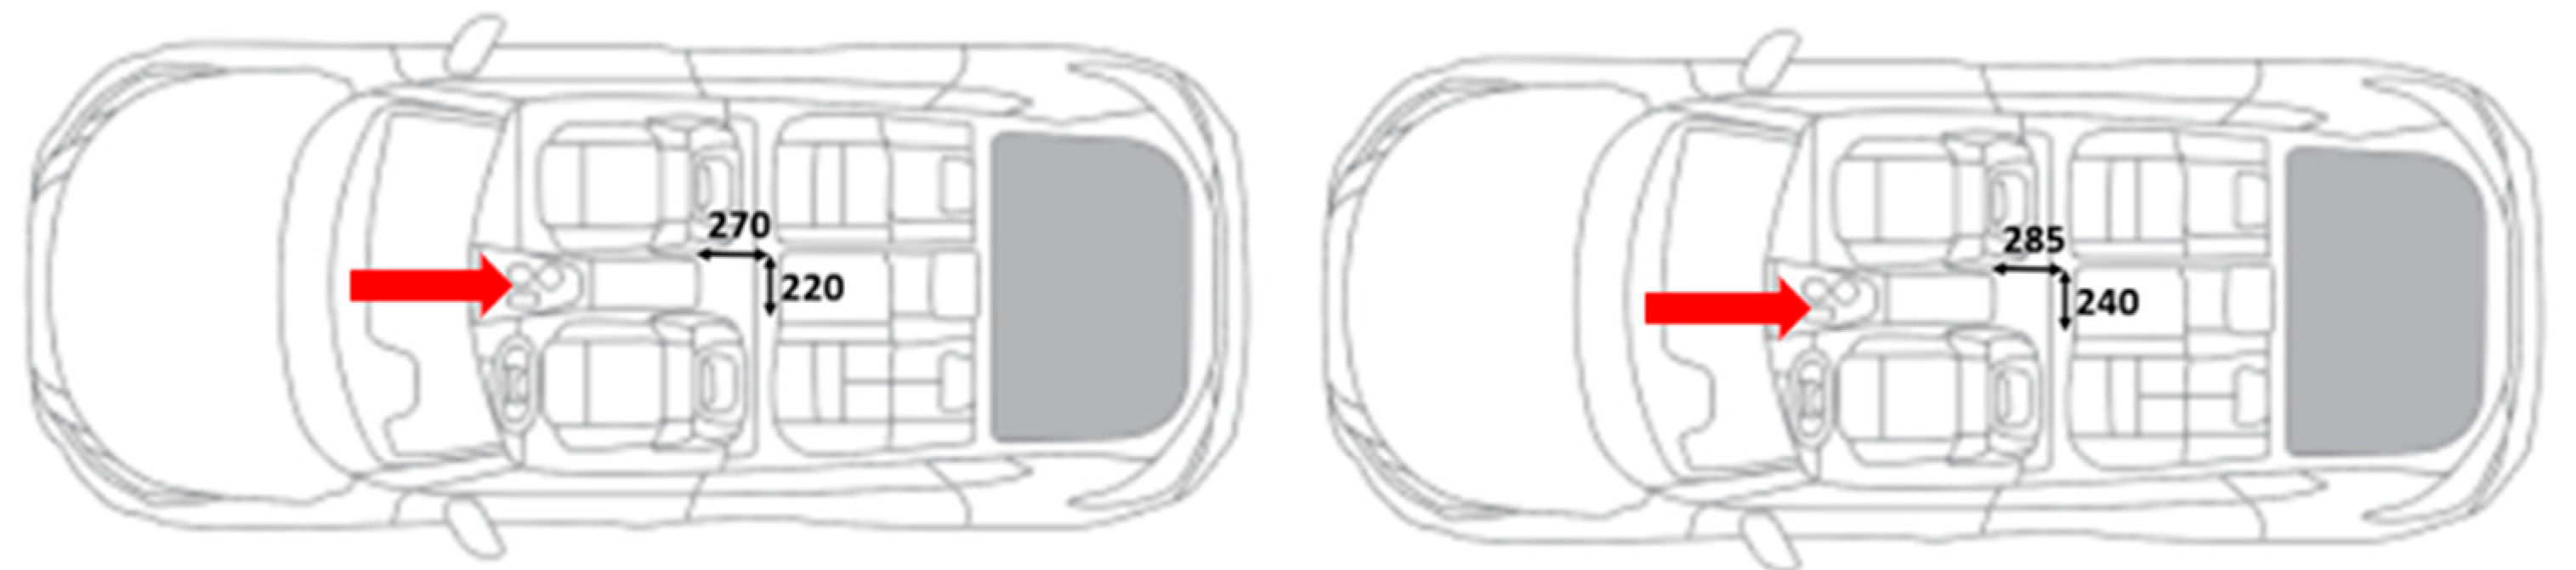
Figure 3.
Frames from the videos. Fiat Panda on the left and Renault Arkana on the right.

Figure 4.
An example of a screenshot during data acquisition.
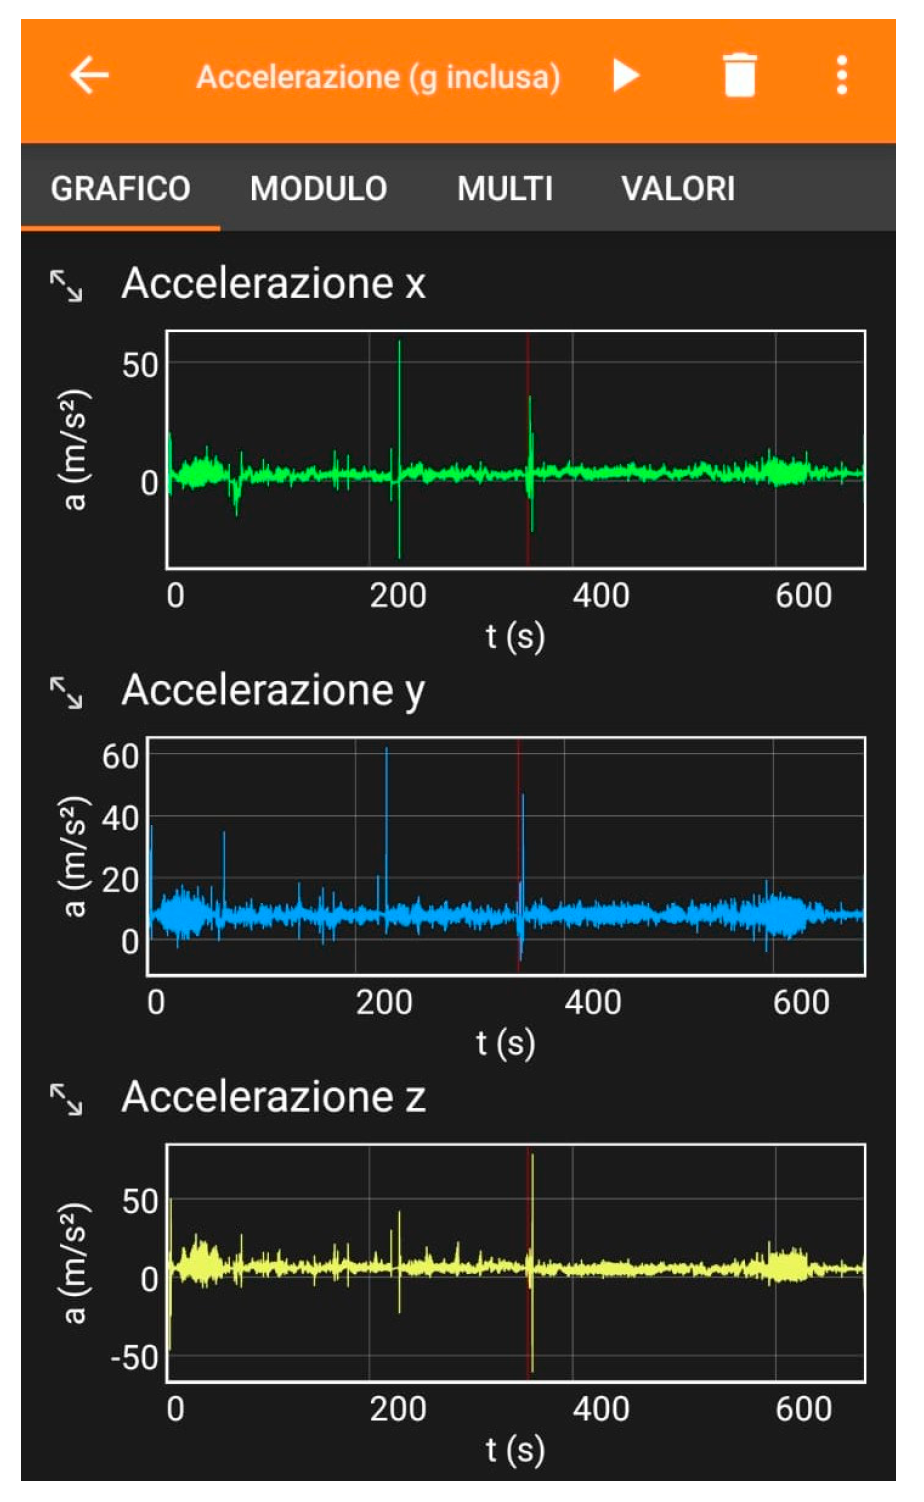
Figure 5.
Discomfort questionnaire [a] Seat’s characteristics [b] interiors’ parts.
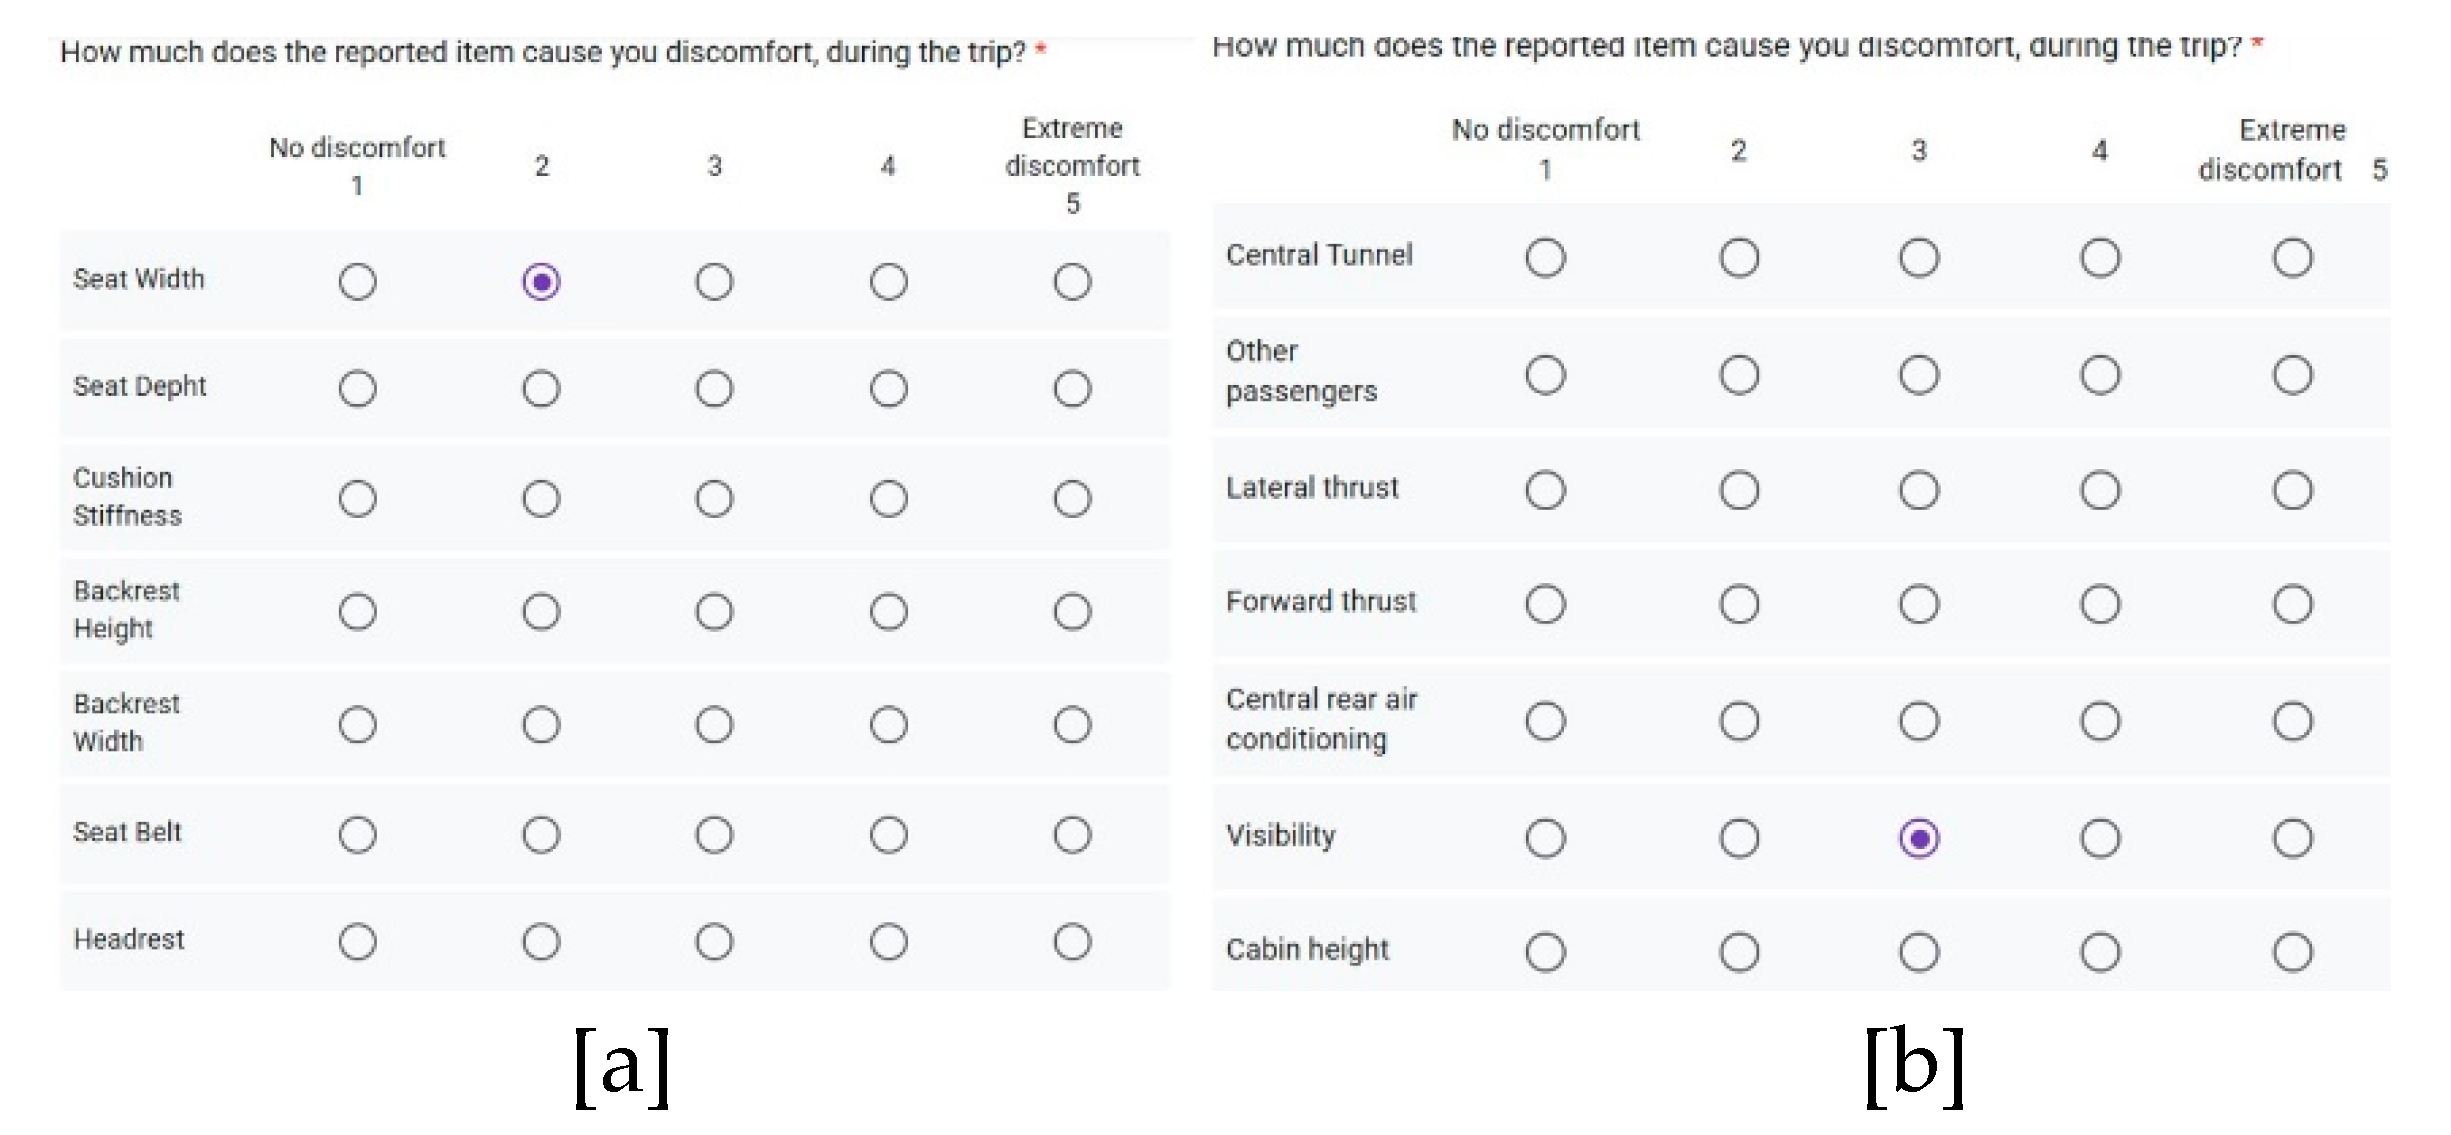
Figure 6.
Body regions and questionnaire for perceived postural discomfort rating.
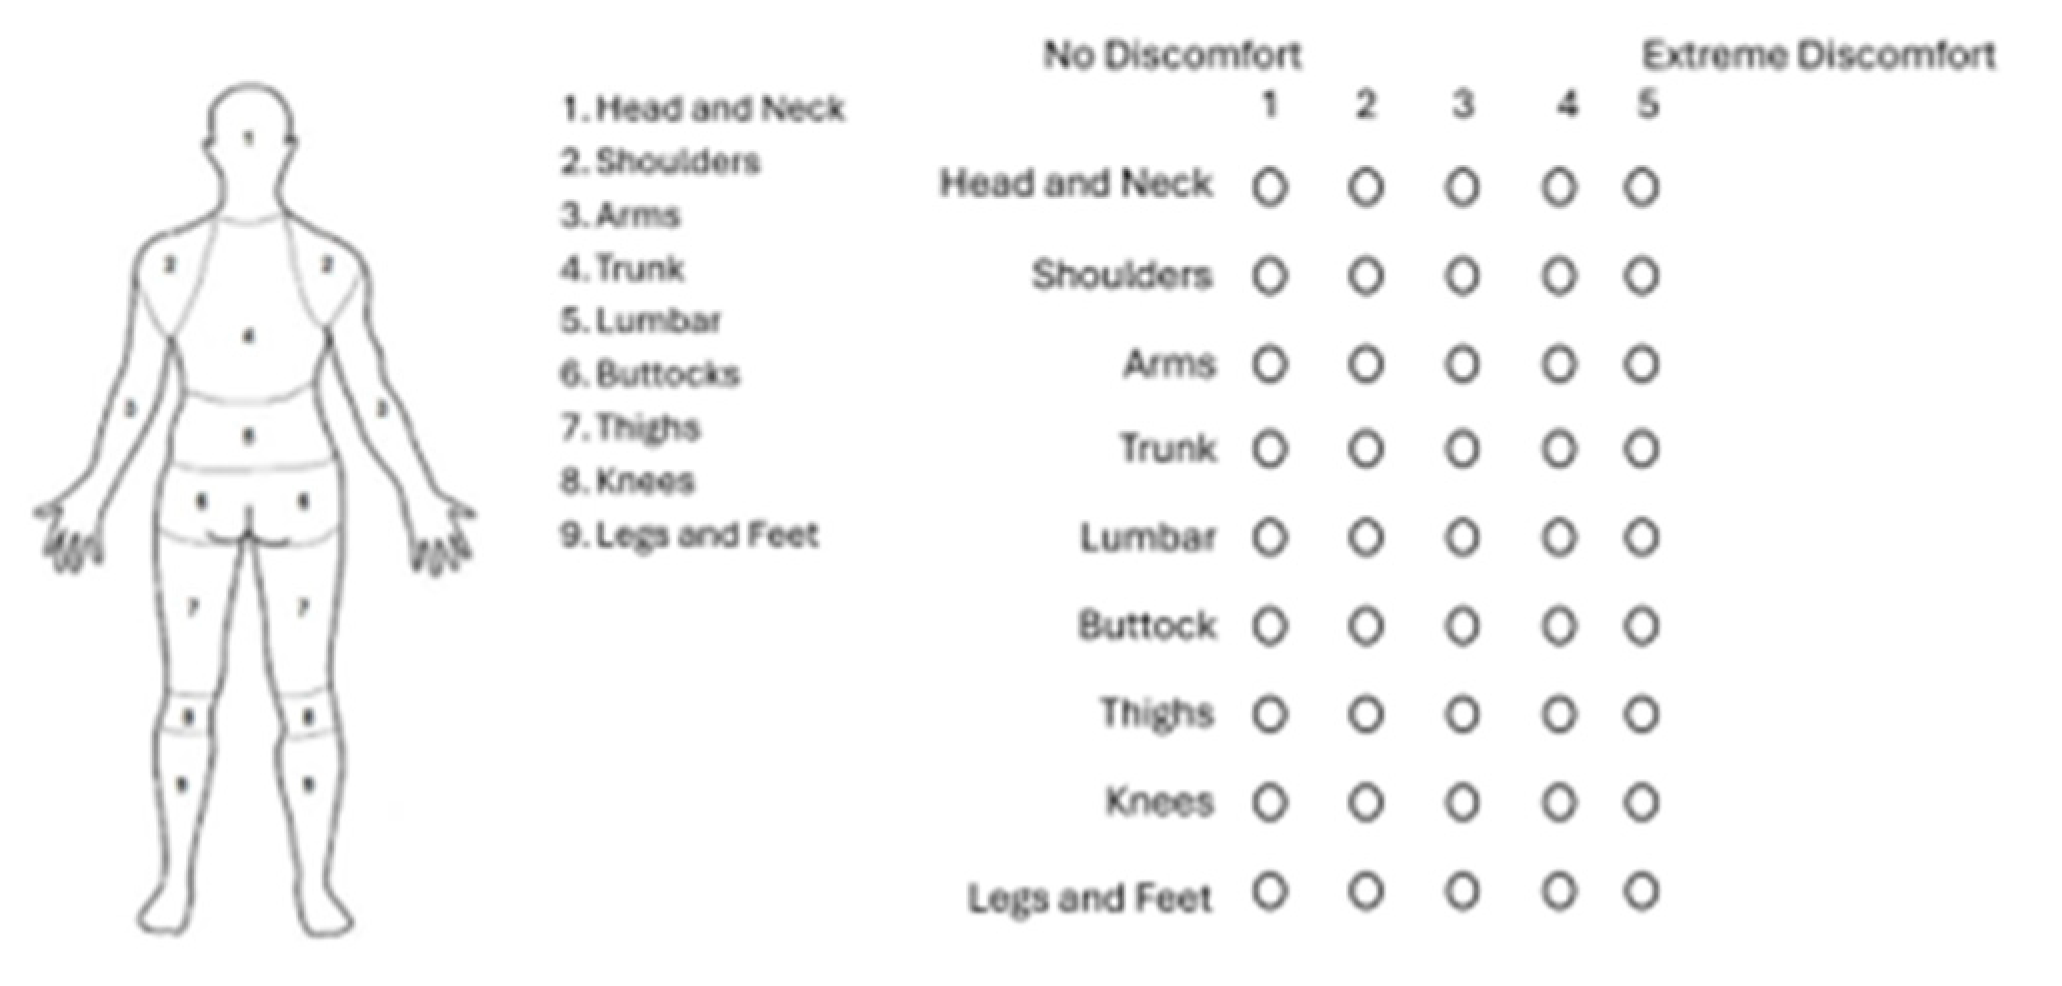
Figure 7.
Discomfort for each participant related to the seat characteristics. Mean Value for the City-Car and SUV.
Figure 7.
Discomfort for each participant related to the seat characteristics. Mean Value for the City-Car and SUV.
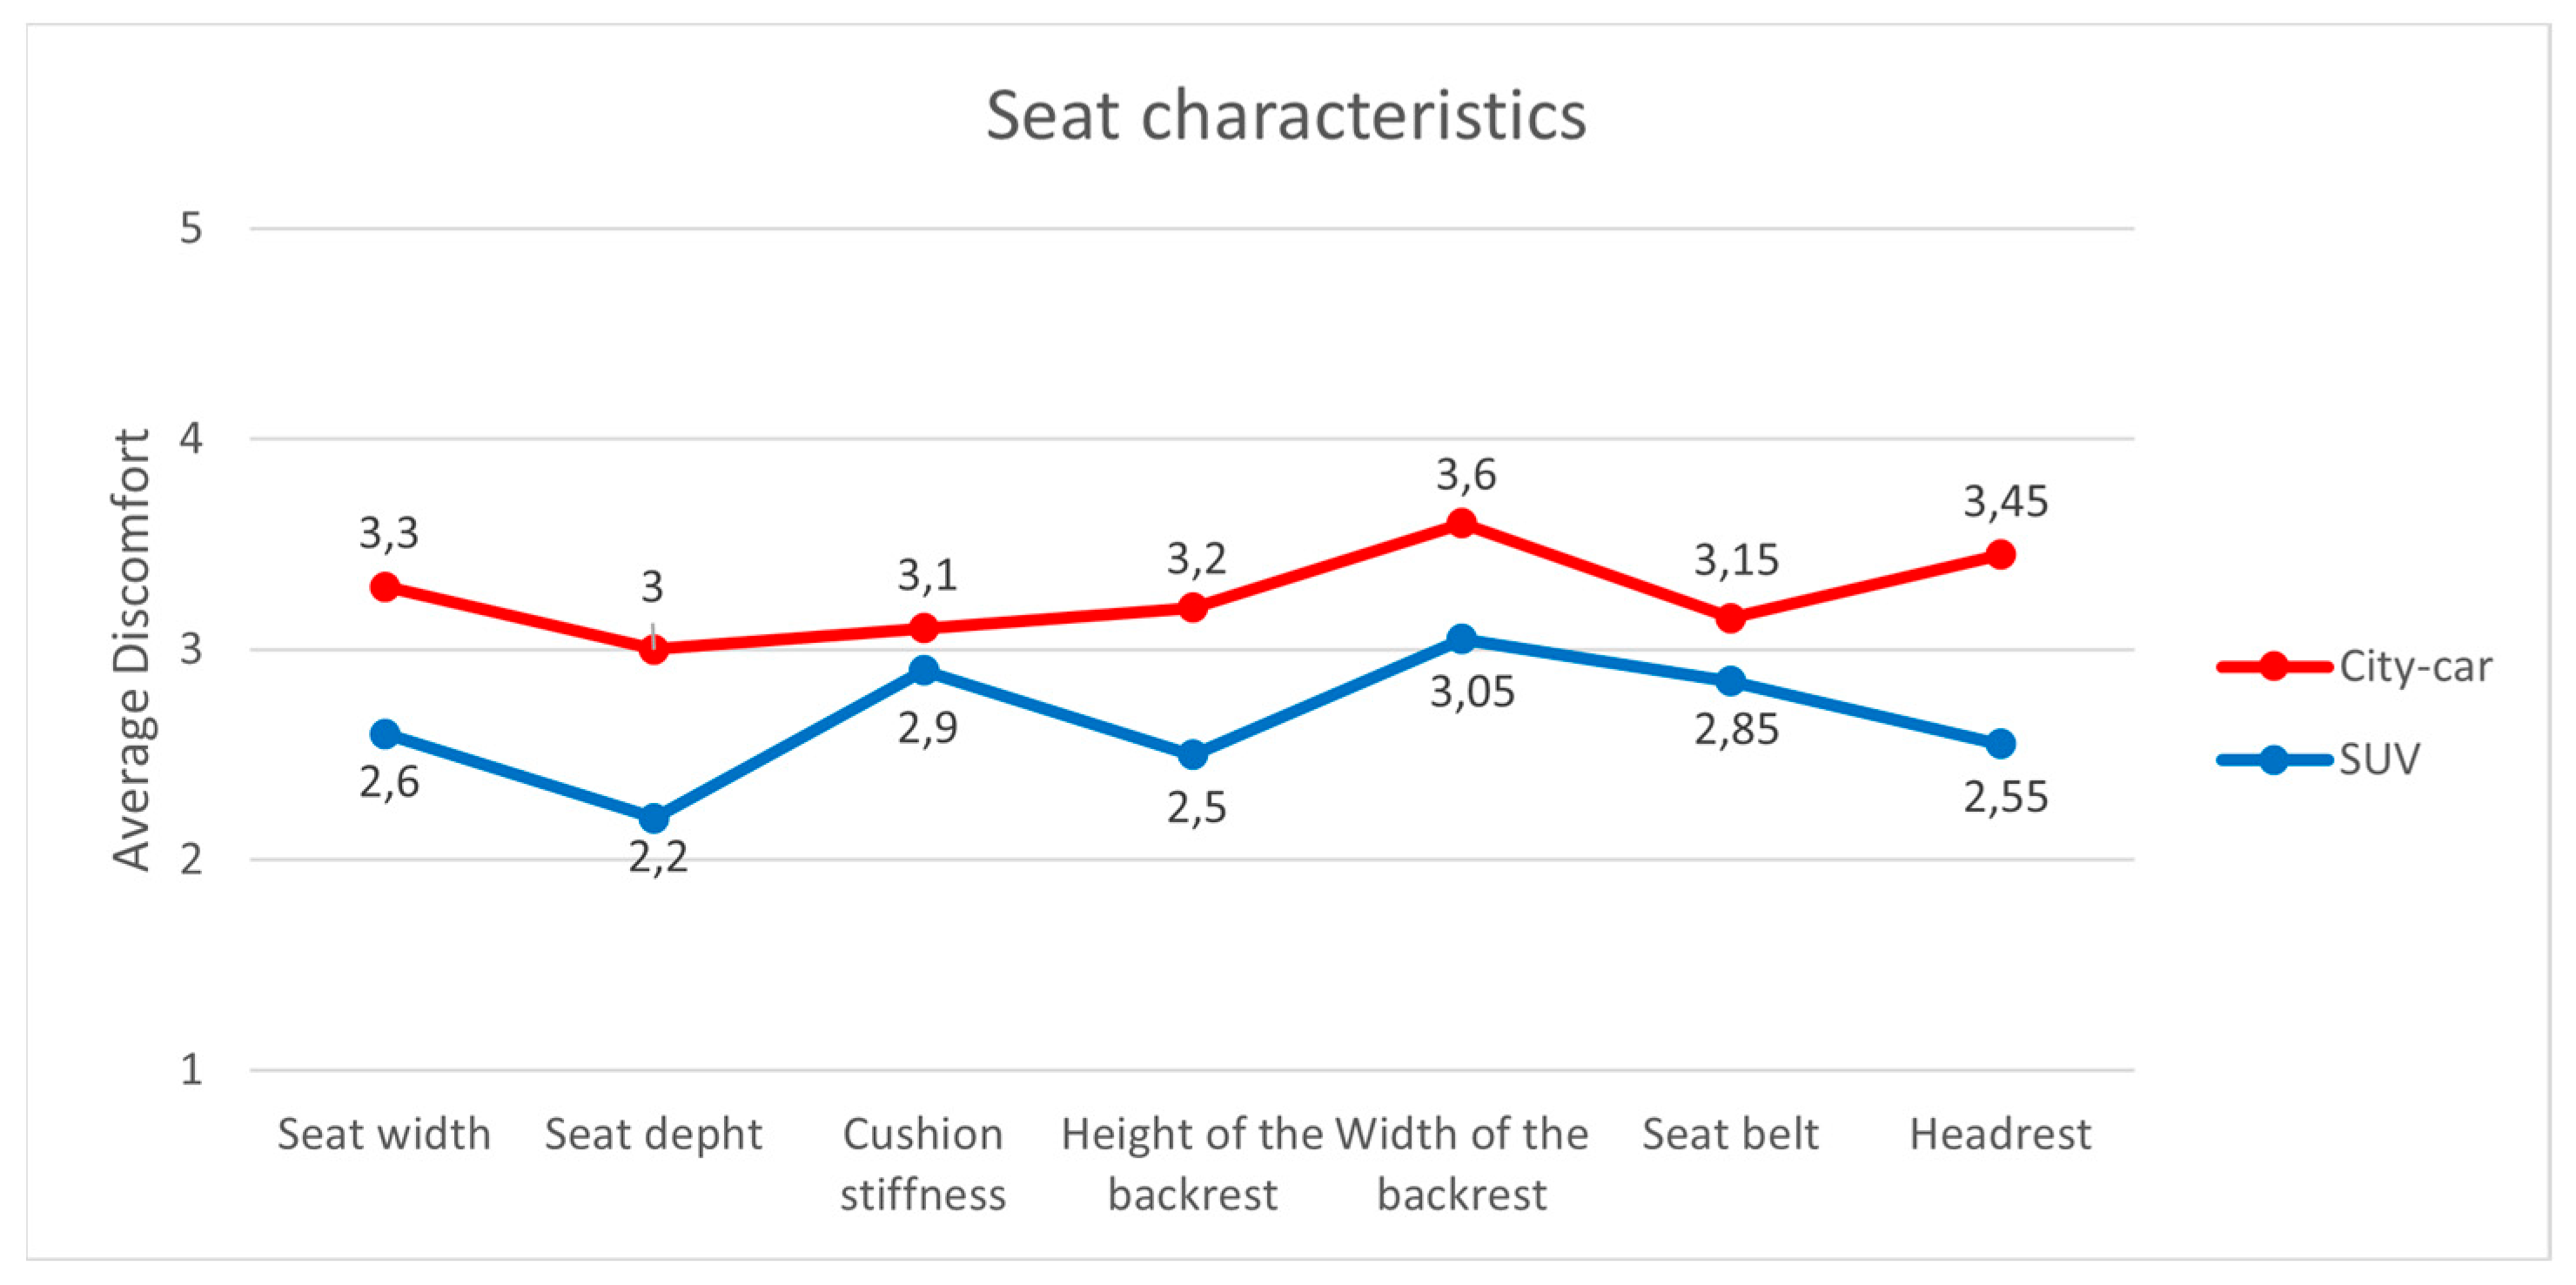
Figure 8.
Discomfort for each participant related elements/factors involved in the interaction. Mean Value for the City-Car and SUV.
Figure 8.
Discomfort for each participant related elements/factors involved in the interaction. Mean Value for the City-Car and SUV.
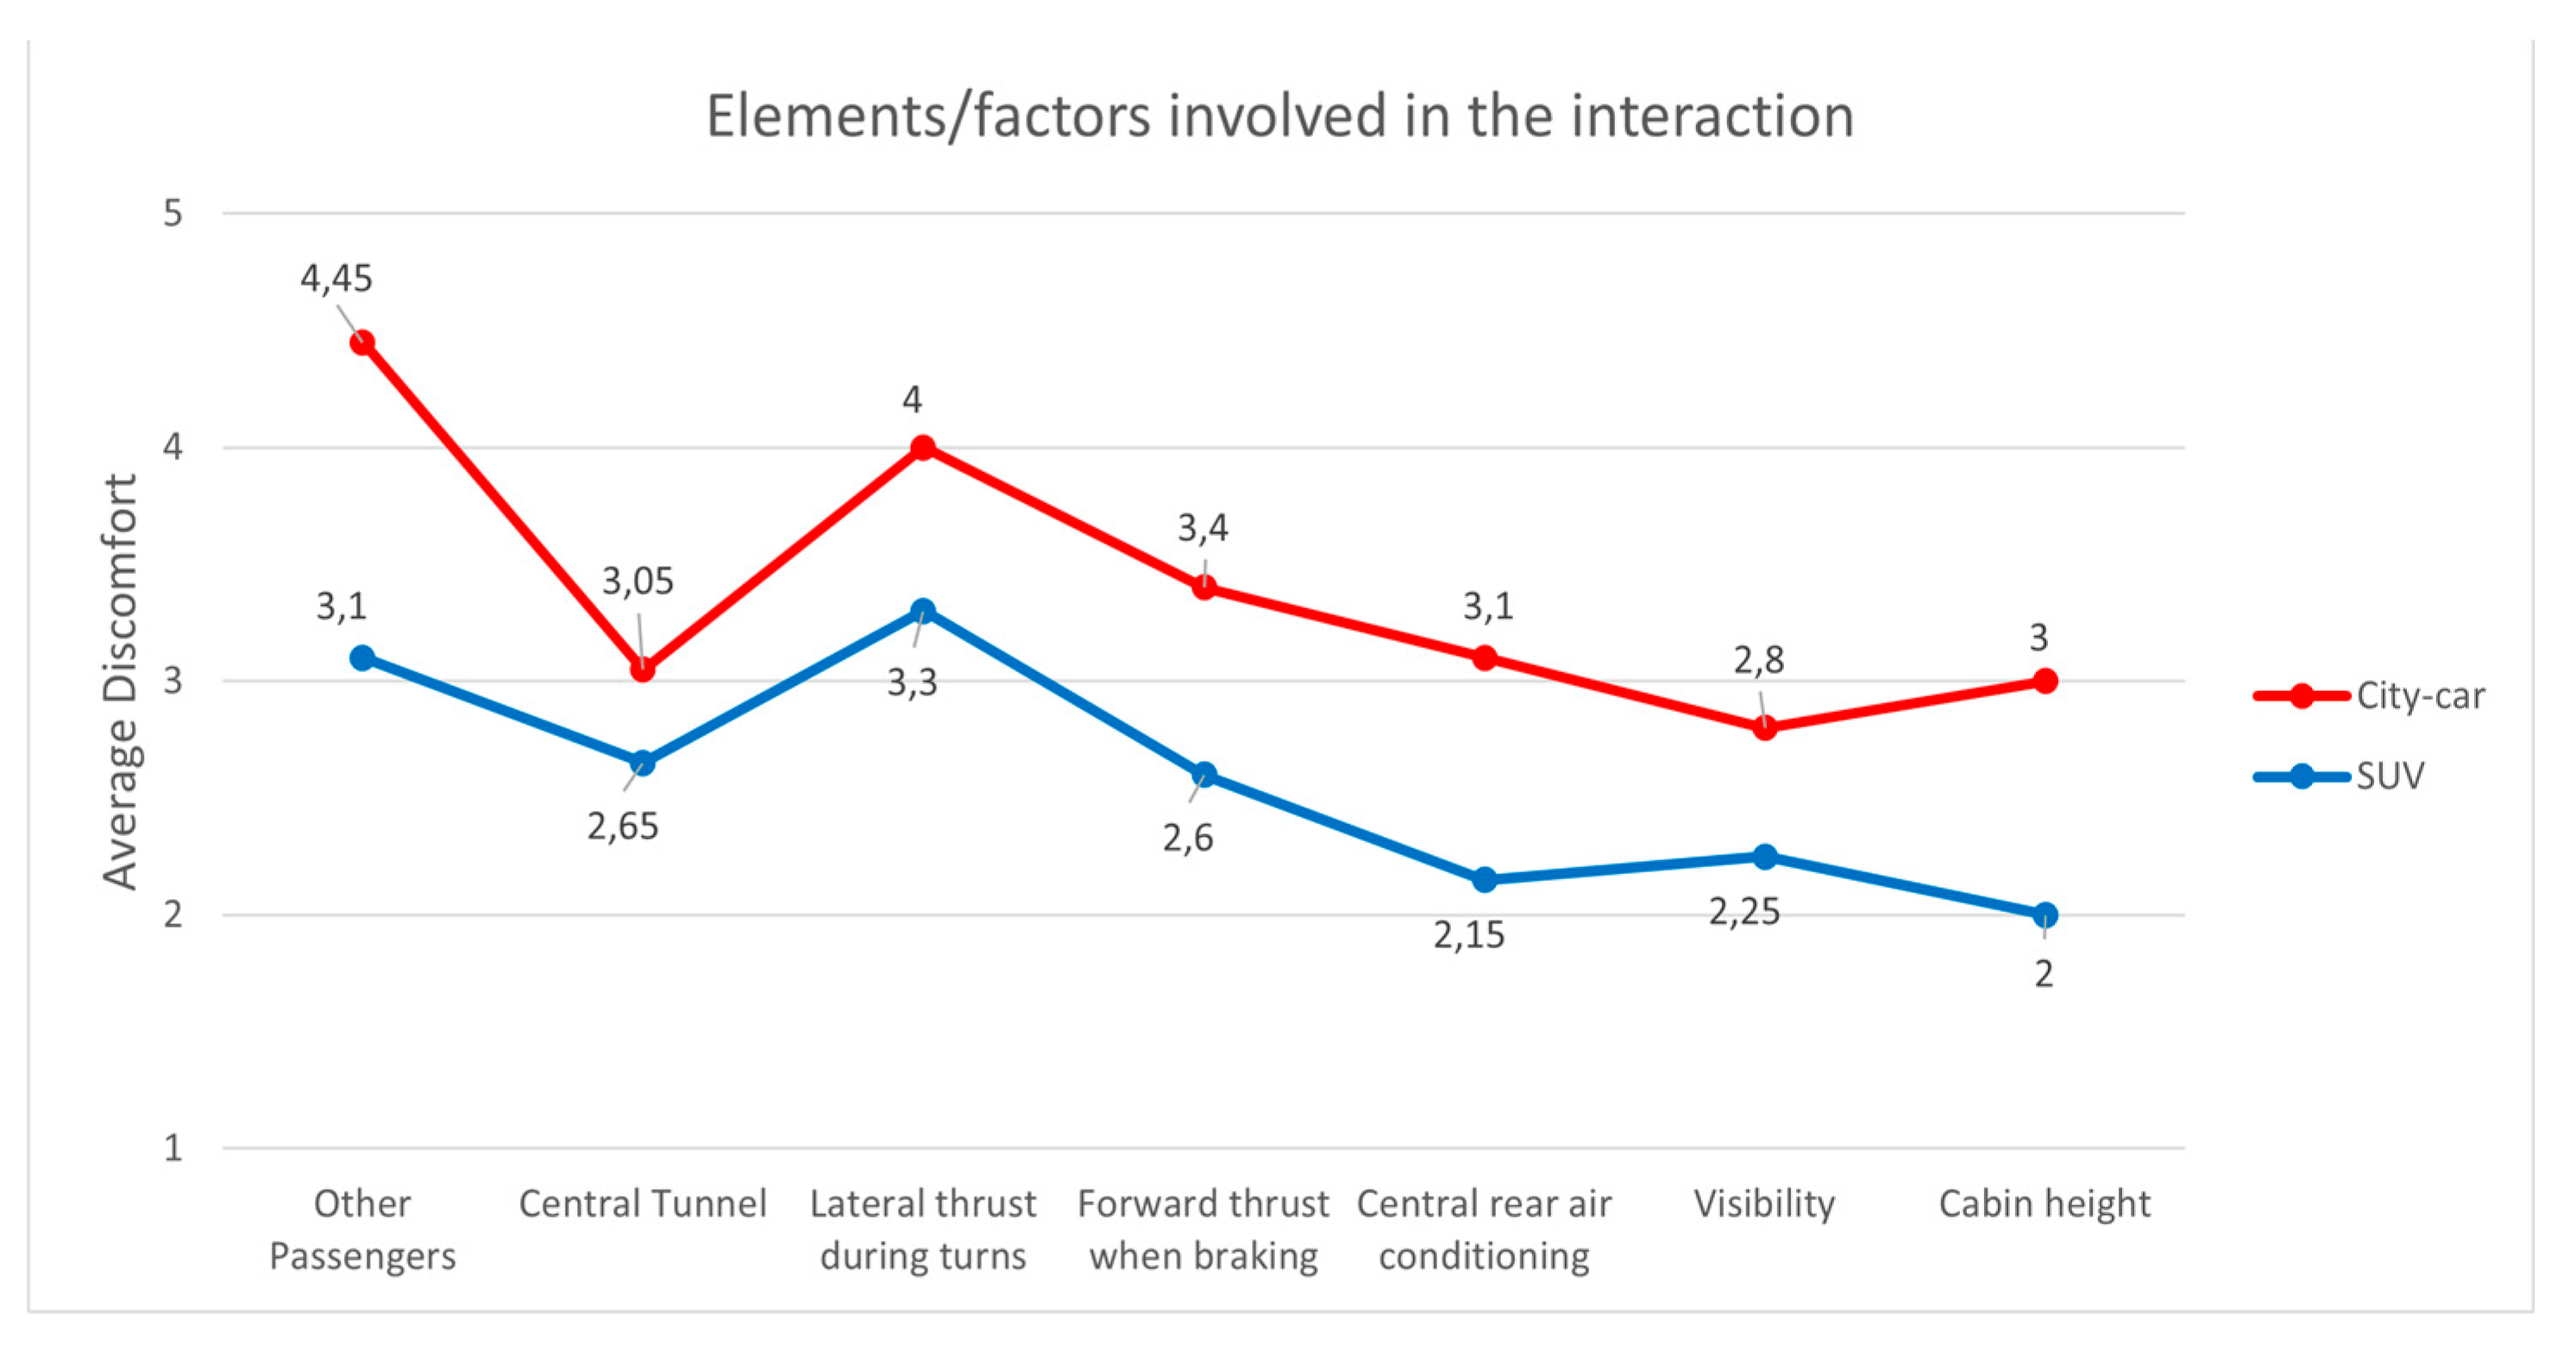

Table 1.
Demographic data of the participants.
| Age [years] | Height [mm] | Weight [Kg] | |
|---|---|---|---|
| Mean | 24 | 172.5 | 77 |
| Std. Deviation | 1.5 | 7.9 | 13.63 |
Table 2.
Overall Discomfort. Mean and Std. Deviation for City Car and SUV.
| City Car | SUV | |
|---|---|---|
| Mean | 3.75 | 3 |
| Std. Deviation | 0.72 | 1.16 |
Table 3.
Results from the overall Discomfort questionnaire.
| OVERALL DISCOMFORT | 1 | 2 | 3 | 4 | 5 | |
|---|---|---|---|---|---|---|
| Occurrence of answers | City Car | 0 | 1 | 8 | 6 | 5 |
| SUV | 1 | 7 | 4 | 7 | 1 | |
Table 4.
Correlation between elements/factors involved in the interaction, seat characteristics itself and Overall Discomfort [City Car and SUV].
Table 4.
Correlation between elements/factors involved in the interaction, seat characteristics itself and Overall Discomfort [City Car and SUV].
| Correlation Coefficient | |||
|---|---|---|---|
| City Car SUV | |||
|
Seat Characteristics |
Overall Discomfort - Backrest width | 0.642** | 0.547* |
| Overall Discomfort –Headrest |
0.552* | 0.560* | |
| Elements/factors involved in the interaction | Overall Discomfort - Interference with other passengers | 0.639** | 0.572** |
| Overall Discomfort - Central rear air conditioning | 0.498** | 0.571** | |
| Overall Discomfort - Lateral forces in curves | 0.541* | 0.534* | |
| Overall Discomfort - Central tunnel | 0.534* | 0.498** | |
| Body parts | Overall Discomfort – Discomfort Arm | 0.729** | 0.620** |
| Overall Discomfort – Discomfort Shoulder | 0.591** | 0.565** | |
| Overall Discomfort – Discomfort Back | 0.574** | 0.704** | |
| Overall Discomfort – Discomfort legs and feet | 0.683** | 0.671** | |
| Overall Discomfort – Discomfort knees | 0.528* | 0.823** | |
| Overall Discomfort – Discomfort Head | 0.567** | 0.531* | |
** The correlation is significant at level 0.01 [2-queues]* The correlation is significant at level 0.05 [2-queues].
Table 5.
Mean values of discomfort for each body part [1 indicating "No discomfort" and 5 indicating "Extreme discomfort"].
Table 5.
Mean values of discomfort for each body part [1 indicating "No discomfort" and 5 indicating "Extreme discomfort"].
| City-car | SUV | |
| Head and neck | 3.25 | 2.7 |
| Shoulder | 3.45 | 2.75 |
| Arms | 3.95 | 3.15 |
| Back | 3.55 | 2.7 |
| Lumbar | 3.2 | 2.35 |
| Buttocks | 3.3 | 3.15 |
| Thighs | 3.55 | 3.1 |
| Knees | 3.9 | 3.05 |
| Legs and feet | 3.55 | 3.25 |
| MEAN | 3.5 | 2.9 |
Table 6.
Correlation between elements/factors involved in the interaction, seat characteristics itself and local discomfort [City-car].
Table 6.
Correlation between elements/factors involved in the interaction, seat characteristics itself and local discomfort [City-car].
| City-car | Correlation Coefficient | |
|---|---|---|
| Degree of discomfort arms - Backrest width | 0.728** | |
| Seat Characteristics |
Degree of discomfort buttocks - Stiffness of the seat cushion | 0.541* |
| Degree of discomfort buttocks –Seat cushion width | 0.537* | |
| Degree of discomfort thighs –Seat cushion width | 0.523* | |
| Degree of discomfort head and neck –Headrest |
0.489* | |
| Elements/factors involved in the interaction | Degree of discomfort legs and feet - Central rear air conditioning | 0.629** |
| Degree of discomfort knees - Central rear air conditioning | 0.647** | |
| Degree of discomfort shoulders - Interference with other passengers | 0.555* | |
| Degree of discomfort arms - Interference with other passengers | 0.541* | |
| Degree of discomfort legs and feet - Central tunnel | 0.534* | |
| Degree of discomfort thighs - Interference with other passengers | 0.511* |
** The correlation is significant at level 0.01 [2-queues] * The correlation is significant at level 0.05 [2-queues].
Table 7.
Correlation between elements/factors involved in the interaction, seat characteristics itself and local discomfort [SUV].
Table 7.
Correlation between elements/factors involved in the interaction, seat characteristics itself and local discomfort [SUV].
| SUV | Correlation Coefficient | |
|---|---|---|
| Degree of discomfort head and neck –Headrest | 0.856** | |
| Seat Characteristics |
Degree of discomfort legs and feet - Seat cushion width | 0.714** |
| Degree of discomfort buttocks – Stiffness of the seat cushion | 0.595** | |
| Degree of discomfort arms - Backrest width | 0.572** | |
| Degree of discomfort legs and feet – Seat cushion depth | 0.558* | |
| Degree of discomfort shoulders - Backrest width | 0.549* | |
| Degree of discomfort thighs - Stiffness of the seat cushion | 0,455* | |
| Elements/factors involved in the interaction |
Degree of discomfort arms –Interference with other passengers | 0.758** |
| Degree of discomfort shoulders –Interference with other passengers | 0.686** | |
| Degree of discomfort legs and feet –Interference with other passengers | 0.549* | |
| Degree of discomfort knees –Central rear air conditioning | 0.518* | |
| Degree of discomfort legs and feet –Lateral forces in curves | 0.504* | |
| Degree of discomfort thighs –Lateral forces in curves | 0.455* | |
| Degree of discomfort lumbar –Interference with other passengers | 0.475* |
** The correlation is significant at level 0.01 [2-queues] * The correlation is significant at level 0.05 [2-queues].
Disclaimer/Publisher’s Note: The statements, opinions and data contained in all publications are solely those of the individual author(s) and contributor(s) and not of MDPI and/or the editor(s). MDPI and/or the editor(s) disclaim responsibility for any injury to people or property resulting from any ideas, methods, instructions or products referred to in the content. |
© 2025 by the authors. Licensee MDPI, Basel, Switzerland. This article is an open access article distributed under the terms and conditions of the Creative Commons Attribution (CC BY) license (http://creativecommons.org/licenses/by/4.0/).
Copyright: This open access article is published under a Creative Commons CC BY 4.0 license, which permit the free download, distribution, and reuse, provided that the author and preprint are cited in any reuse.


