Submitted:
06 July 2025
Posted:
08 July 2025
You are already at the latest version
Abstract
In many earthquake-prone regions where budgets and specialist equipment are limited, getting an integrity assessment on buildings can save lives. We have implemented a lightweight monitoring framework that operates entirely on off-the-shelf smartphones, eliminating the need for costly sensors or elaborate wiring. Our approach uses a simple Python Representational State Transfer (REST) API to link up different smartphone-based accelerometer sensors and keep their time series in synchronization. Once data are streaming in, we clean them up automatically by centering and scaling each signal, then applying a zero lag Butterworth band pass filter to strip away noise without disturbing the true vibration patterns. For frequency analysis, we rely on Welch’s method with carefully chosen Hann windows, overlap adjustments, and bias removal filters, which gives us sharper spectral estimates even when the signals are weak. The identified dominant frequency differed by only 0.21% from SAP2000 simulations. By turning any smartphone into a damage detection node, this platform makes real time structural monitoring affordable, fast, and ready to deploy without custom setups, moving from reactive post-event assessment towards predictive resilience.
Keywords:
Structural Health Monitoring (SHM)
; MEMS-IMU
; REST-API synchronization
; Welch’s PSD
; smartphone sensing
; time-series fusion
; Operational Modal Analysis (OMA)
1. Introduction
In seismically active areas, continuous and affordable SHM is crucial to detect damage early and prevent catastrophic collapse. For example, the 2015 Gorkha earthquake in Nepal (Mw 7.8) caused over 500,000 private and 2,600 public buildings to collapse, with nearly 9,000 fatalities. Engineers at the time had no fast, scalable way to assess how many buildings remained structurally sound. This post-earthquake uncertainty led to prolonged displacement of residents and hindered relief efforts. Such experiences highlight the urgent need for low-cost SHM systems that can give near-real-time insights into building safety after strong ground motions.
Traditional SHM typically relies on high-precision instruments (e.g., force-balance accelerometers or GPS-synchronized units) and controlled vibration inputs, equipment that is expensive and scarce in developing regions. Without affordable alternatives, communities remain exposed to damage that accumulates gradually through fatigue or corrosion, or rapidly during earthquakes.
Smartphones, which contain built-in Micro-Electro-Mechanical Systems (MEMS) inertial sensors, present an attractive, ubiquitous platform for SHM. Modern phone accelerometers are surprisingly sensitive, and smartphones can communicate data wirelessly. However, using phone sensors poses several challenges. MEMS accelerometers usually have higher noise floors than laboratory-grade units, and different phone models sample data at slightly different rates, causing clock drift and timing offsets between devices. Even a few millisecond-level misalignments can corrupt cross-correlations and modal identification. Moreover, ambient building vibrations often have very low signal-to-noise ratios (SNR), making conventional spectral methods like Welch’s periodogram suffer from spectral leakage and bias. Standard Power Spectral Density (PSD) routines often only resolve frequencies to about 0.5 Hz, which is too coarse to detect small shifts in modal frequencies that indicate early damage (e.g., a slight softening of the structure).
To address these issues, we develop an integrated SHM framework called Remote Structural Integrity Diagnosis via REST-API Synchronized MEMS-IMUs and PSD. This approach combines network-based sensor synchronization with an enhanced spectral analysis pipeline. A Python master-slave architecture uses a RESTful API to synchronize multiple smartphone IMU streams to within ±5 ms of each other. The master node coordinates time alignment (using a Network Time Protocol (NTP)-style handshake and buffering), and distributes processing parameters (filter cutoffs, window lengths, overlap, etc.) to all devices. Raw triaxial acceleration from each phone is preprocessed with median-centered normalization (to remove drift without being skewed by outliers), interquartile range scaling, and a zero-phase band-pass Butterworth filter (0.5–5 Hz) that preserves phase while filtering out-of-band noise. For modal analysis, we implement a Welch’s PSD estimator. We use Hann windows to reduce leakage, then apply bias-correction filters on each segment to remove systematic window-induced errors. We also weight overlapping segments adaptively: segments with higher local SNR or stationarity get more weight in the averaged spectrum. An automated peak detection (with thresholds on prominence and SNR) and clustering algorithm then extracts the building’s vibration modes. All data streaming and device control happen in real time, so sensors can be deployed remotely or in hazardous areas without physical intervention.
This smartphone-based SHM framework dramatically lowers cost and complexity without sacrificing analytical rigor. By leveraging ubiquitous devices, we can frequently monitor infrastructure and detect modal frequency shifts (e.g., a 15% drop in the fundamental frequency after damage) to trigger alerts. The result is a move from ad-hoc, post-disaster checks toward proactive, data-driven resilience. In short, our method turns raw accelerometer data into actionable intelligence, providing a scalable way to safeguard structures in resource-constrained, seismically active regions.
2. Literature Review
Smartphone MEMS accelerometers have enabled low-cost, scalable vibration monitoring systems. Zhang et al. [1] developed an Android-based wireless structural vibration monitoring system and validated it on shake table tests. Ozer et al. [2] deployed smartphones on a pedestrian link bridge for daily and seasonal frequency tracking over a month, demonstrating that consumer devices can capture the first mode near 10 Hz with ~0.06 Hz stability. Cronin et al. [3] outlined a roadmap for crowdsourced mobile sensing of bridge modal properties, emphasizing passive data collection from everyday commuters. Kang et al. [4] evaluated smartphone vibration detection in a two-story RC frame, finding that basic phone accelerometers reliably detected dominant frequencies but missed higher modes under ambient loads. Similarly, Occhipinti et al. [5] compared various MEMS accelerometers in a scaled masonry model on a shake table, concluding that while some MEMS match reference sensors in SNR, others exhibit excessive noise. Elhattab et al. [6] applied a novel 2D stochastic resonance filtering technique (2D-FI-UPSR) and demonstrated that a standard smartphone accelerometer can extract the fundamental vibration frequencies of a bridge, despite the device’s low sensitivity and high noise levels.
Ozer and Kromanis [7] systematically reviewed smartphone prospects in bridge SHM, noting that even though the device ubiquity simplifies deployment, the variability in sensor quality and user behavior remains problematic. Kong et al. [8] presented a shaker test of the Millikan Library using smartphone internal sensors to demonstrate their potential for cost-effective and scalable SHM of buildings, showing they can effectively capture shaking, allow extraction of fundamental and torsional frequencies, and provide absolute displacement estimates with good correlation to reference sensors. The MyShake project repurposed smartphones for building SHM during earthquakes, confirming that phone networks can estimate building frequencies within 5% error. Patel et al. [9] extended MyShake into a dedicated SHM platform, demonstrating real-time identification of campus building modes during ambient excitation. Earlier, Ozer et al. [10] introduced “citizen sensors,” where untrained volunteers collected smartphone acceleration data, showing that spatially distributed measurements can reproduce mode shapes when properly time-aligned.
Dash and Sharma [11] provided an overview of wireless-based smart sensor technology for SHM, detailing the opportunities it presents for improved civil infrastructure management and the challenges that must be addressed for its broader implementation. Figueiredo et al. [12] developed a smartphone app for bridge SHM, achieving automated data upload, modal analysis, and cloud-based dashboards. However, they noted that continuous monitoring drains phone batteries and that background app interference can corrupt data.
To improve hardware, Hasani et al. [13] designed a battery-powered, long-duration MEMS-based wireless system for Operational Modal Analysis (OMA) of concrete arch bridges, achieving multi-day unattended monitoring. Villacorta et al. [14] created a scalable, re-configurable MEMS sensor network that matched the performance of commercial systems on both lab models and in situ heritage structures.
Time synchronization remains critical when using multiple sensors. Li et al. [15] surveyed nonlinear clock drift in wireless smart sensors and proposed drift-compensated protocols achieving a maximum error of less than <50 μs. General overviews of clock sync in Wireless Sensor Networks (WSNs) by Sundararaman et al. [16] categorize sender–receiver and receiver–receiver methods, emphasizing that MAC layer timestamping (e.g., FTSP) and linear regression drift correction are standard but may fail under temperature variations.
Miniaturized IMUs are emerging for SHM beyond smartphones: Yu et al. [17] introduced a small Bosch chip IMU with onboard filtering for real time bending measurements on cantilevers. Tran et al. [18] reviewed health monitoring and modal updating of vibration dissipation systems, underscoring the need for multi-parameter anomaly detection and model-free indicators. A comprehensive overview by Liu [19] of recent advancements in smart sensor technologies and their applications in SHM and NDE highlights emerging trends such as AI-driven signal processing, novel sensor designs, and real-world implementations across diverse structural systems.
Historic deployments such as the Nibelungen Bridge Worms system [20] used custom sensor nodes and highlighted issues in long-term structural monitoring: sensor drift, power failures, and data loss. Li et al. [21] employed piezoelectric sensors for damage localization, achieving millimeter-scale crack detection in concrete via impedance and wave-based methods.
Collectively, the reviewed body of literature underscores the increasing viability of smartphone-based structural health monitoring (SHM) as a low-cost, scalable solution capable of reliably capturing the fundamental frequencies of civil infrastructure. Through appropriate calibration strategies or sufficiently dense data collection via crowdsourcing, smartphone-based systems have even been shown to approximate mode shapes, particularly in simpler or less complex structural configurations. Despite these achievements, several significant limitations persist that impede broader adoption and effectiveness. One of the primary constraints arises from the inherent noise floor of MEMS accelerometers embedded in smartphones, which significantly hampers the accurate detection of higher-order vibration modes, particularly under ambient excitation. Another key issue involves the challenge of achieving precise temporal alignment between devices. Nonlinear drift in internal clocks necessitates sophisticated synchronization algorithms, which still have more room for exploration in smartphone-based systems.
Furthermore, the voluntary and user-driven nature of smartphone data collection introduces temporal discontinuities and non-uniform spatial sampling, which in turn degrade the completeness and reliability of the resulting datasets. Practical constraints such as limited battery life, restricted background app execution, and device heterogeneity further complicate efforts to implement continuous or autonomous monitoring schemes. These limitations point to the need for targeted research into standardized acquisition protocols, mechanisms to evaluate and ensure data integrity from crowdsourced contributions, and real-time edge analytics to reduce reliance on cloud-based processing.
Combining various sensing techniques, such as using smartphone IMU data alongside GNSS positioning or visual data from built-in cameras, can enhance the spatial precision and overall reliability of structural health monitoring systems that utilize smartphones. This approach, known as multimodal fusion, is gaining recognition as an effective solution to overcome the limitations of relying on a single type of sensor. To fully realize the potential of MEMS-based smartphone sensing in SHM, it is important to advance sensor technologies, establish consistent standards, and design comprehensive monitoring systems.
3. Materials and Methods
3.1. Overall Framework Architecture
The monitoring framework follows a master-slave REST-API paradigm. A central master node (a Python-based server) coordinates data collection, time synchronization, and preprocessing settings. Multiple slave nodes run on ordinary Android or iOS smartphones, each sampling the device’s onboard MEMS-IMU and streaming data back to the master via HTTP. The master maintains persistent WebSocket connections for sending control commands (e.g., start/stop sampling, update filter parameters) and handling fault recovery signals. Each data packet from a phone includes a timestamp from the phone’s system clock; packets are locally buffered on the phone in case of connectivity loss and then bulk-uploaded when the connection is restored.
The sensing hardware in this study consisted of commercially available smartphones with MEMS accelerometers. Devices were selected based on specifications, sampling stability, network capability, form factor, and market availability in Nepal. Table 1 summarizes key specs of example smartphones used (e.g., iPhone 16 Pro Max, Google Pixel 6a, Xiaomi Redmi Note 12, etc.). Each smartphone was calibrated and securely placed in a predefined location on a structural slab to ensure consistent data collection. For single-device tests, the phone was placed near the floor’s center of mass to capture the structure’s global modes. For multi-sensor arrays, units were positioned at orthogonal corners of the slab to map spatial mode shapes. A dedicated Wi-Fi access point with a private SSID provided network connectivity to minimize interference and latency. All phones communicated with the master server via the REST API endpoint, enabling synchronized start/stop commands and real-time status checks. Acceleration data were recorded using the Phyphox smartphone application developed by RWTH Aachen University [23].
The master node exposes the following HTTP endpoints for coordinated control:
- -/sync (POST): Distributes time-offset calibration parameters to slaves. Each slave performs a three-step handshake to compute round-trip delays and align its clock.
- -/config (PUT): Propagates preprocessing parameters such as filter cutoffs, PSD window length, and overlap percentage.
- -/start and /stop (POST): Commands to start or stop data acquisition on all slave devices simultaneously.
- -/status (GET): Returns heartbeat statistics (e.g., packet loss, buffer occupancy) from each slave.
Slave devices implement adaptive polling: if network latency exceeds 200 ms for three consecutive packets, the phone enters a “store-and-forward” mode. In this mode, new samples are buffered locally and recovery notification is sent to the master; once latency is acceptable again, the buffered data is transmitted before resuming normal operation.
The acquisition layer is designed around a four-stage error-recovery mechanism that sits transparently between the smartphone sensor APIs and the downstream preprocessing pipeline. First, every batch of raw triaxial acceleration is sent via an HTTP POST wrapped in a non-blocking socket. If the POST does not complete within the timeout, the client automatically retries up to four times before marking that interval as “lost” and moving on, logging the event for post-session diagnostics. Second, on each slave device, a fixed-size circular buffer (32 kB) collects incoming sensor readings before each flush. A consistency check verifies that the number of samples matches the expected samples (±15-sample tolerance) and that the buffer’s read/write pointers remain coherent. If any inconsistency is detected, the buffer is safely discarded, a warning logged, and the local sensor interface is reinitialized before acquisition resumes. Beyond transport and buffering, every individual sample undergoes dynamic integrity validation. We enforce strict timestamp monotonicity (each ti must exceed ti-1), verify that accelerometer readings lie within the expected range, and check that no more than one sample is missing for any 5 ms interval. Samples failing any of these gates are omitted from the CSV stream and flagged for further analysis.
When malformed data or buffer corruption is detected, the client executes an automatic recovery sequence, which is the smartphone stopping and re-initializing. The internal timestamp cursor is rolled back to the last known good time tk before resuming at tk + Δt, and a lightweight heartbeat POST is sent to the master to notify it of the recovery event. This ensures that even in the face of transient API failures or memory glitches, the system loses at most a single interval of data, and all remaining samples maintain strict temporal and amplitude integrity.
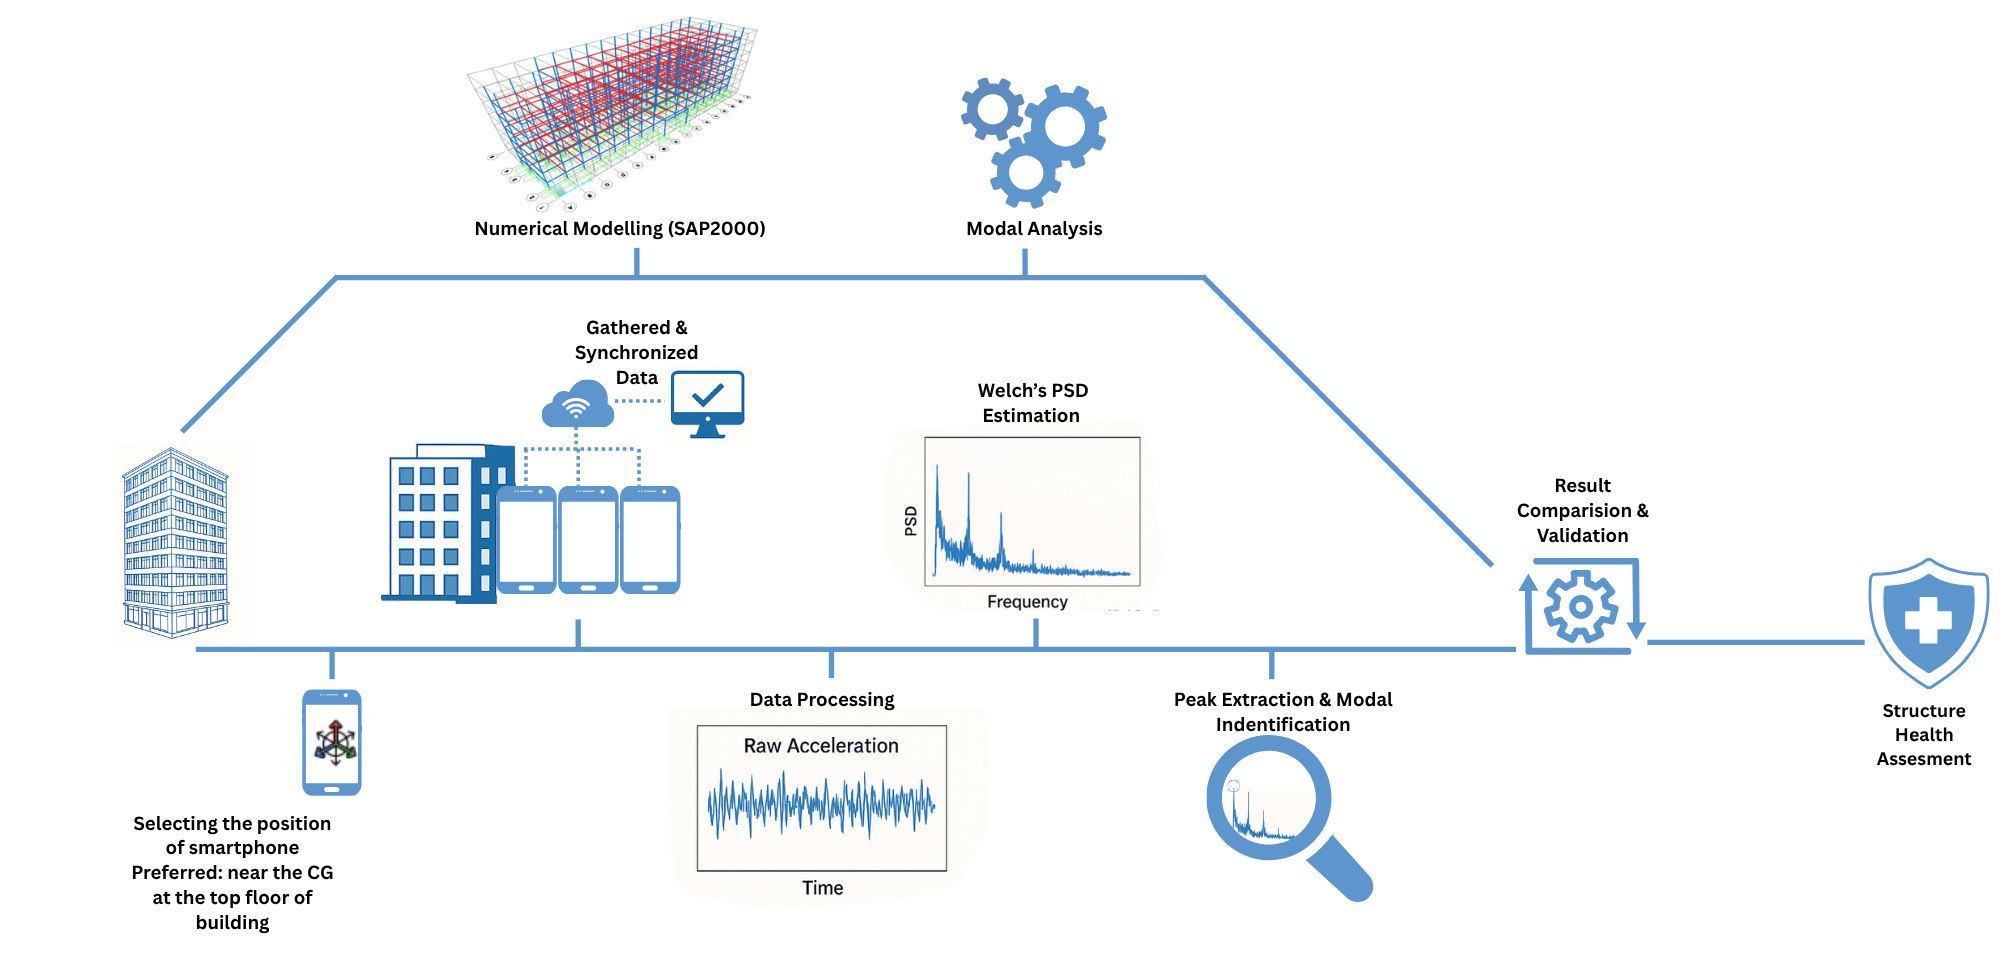
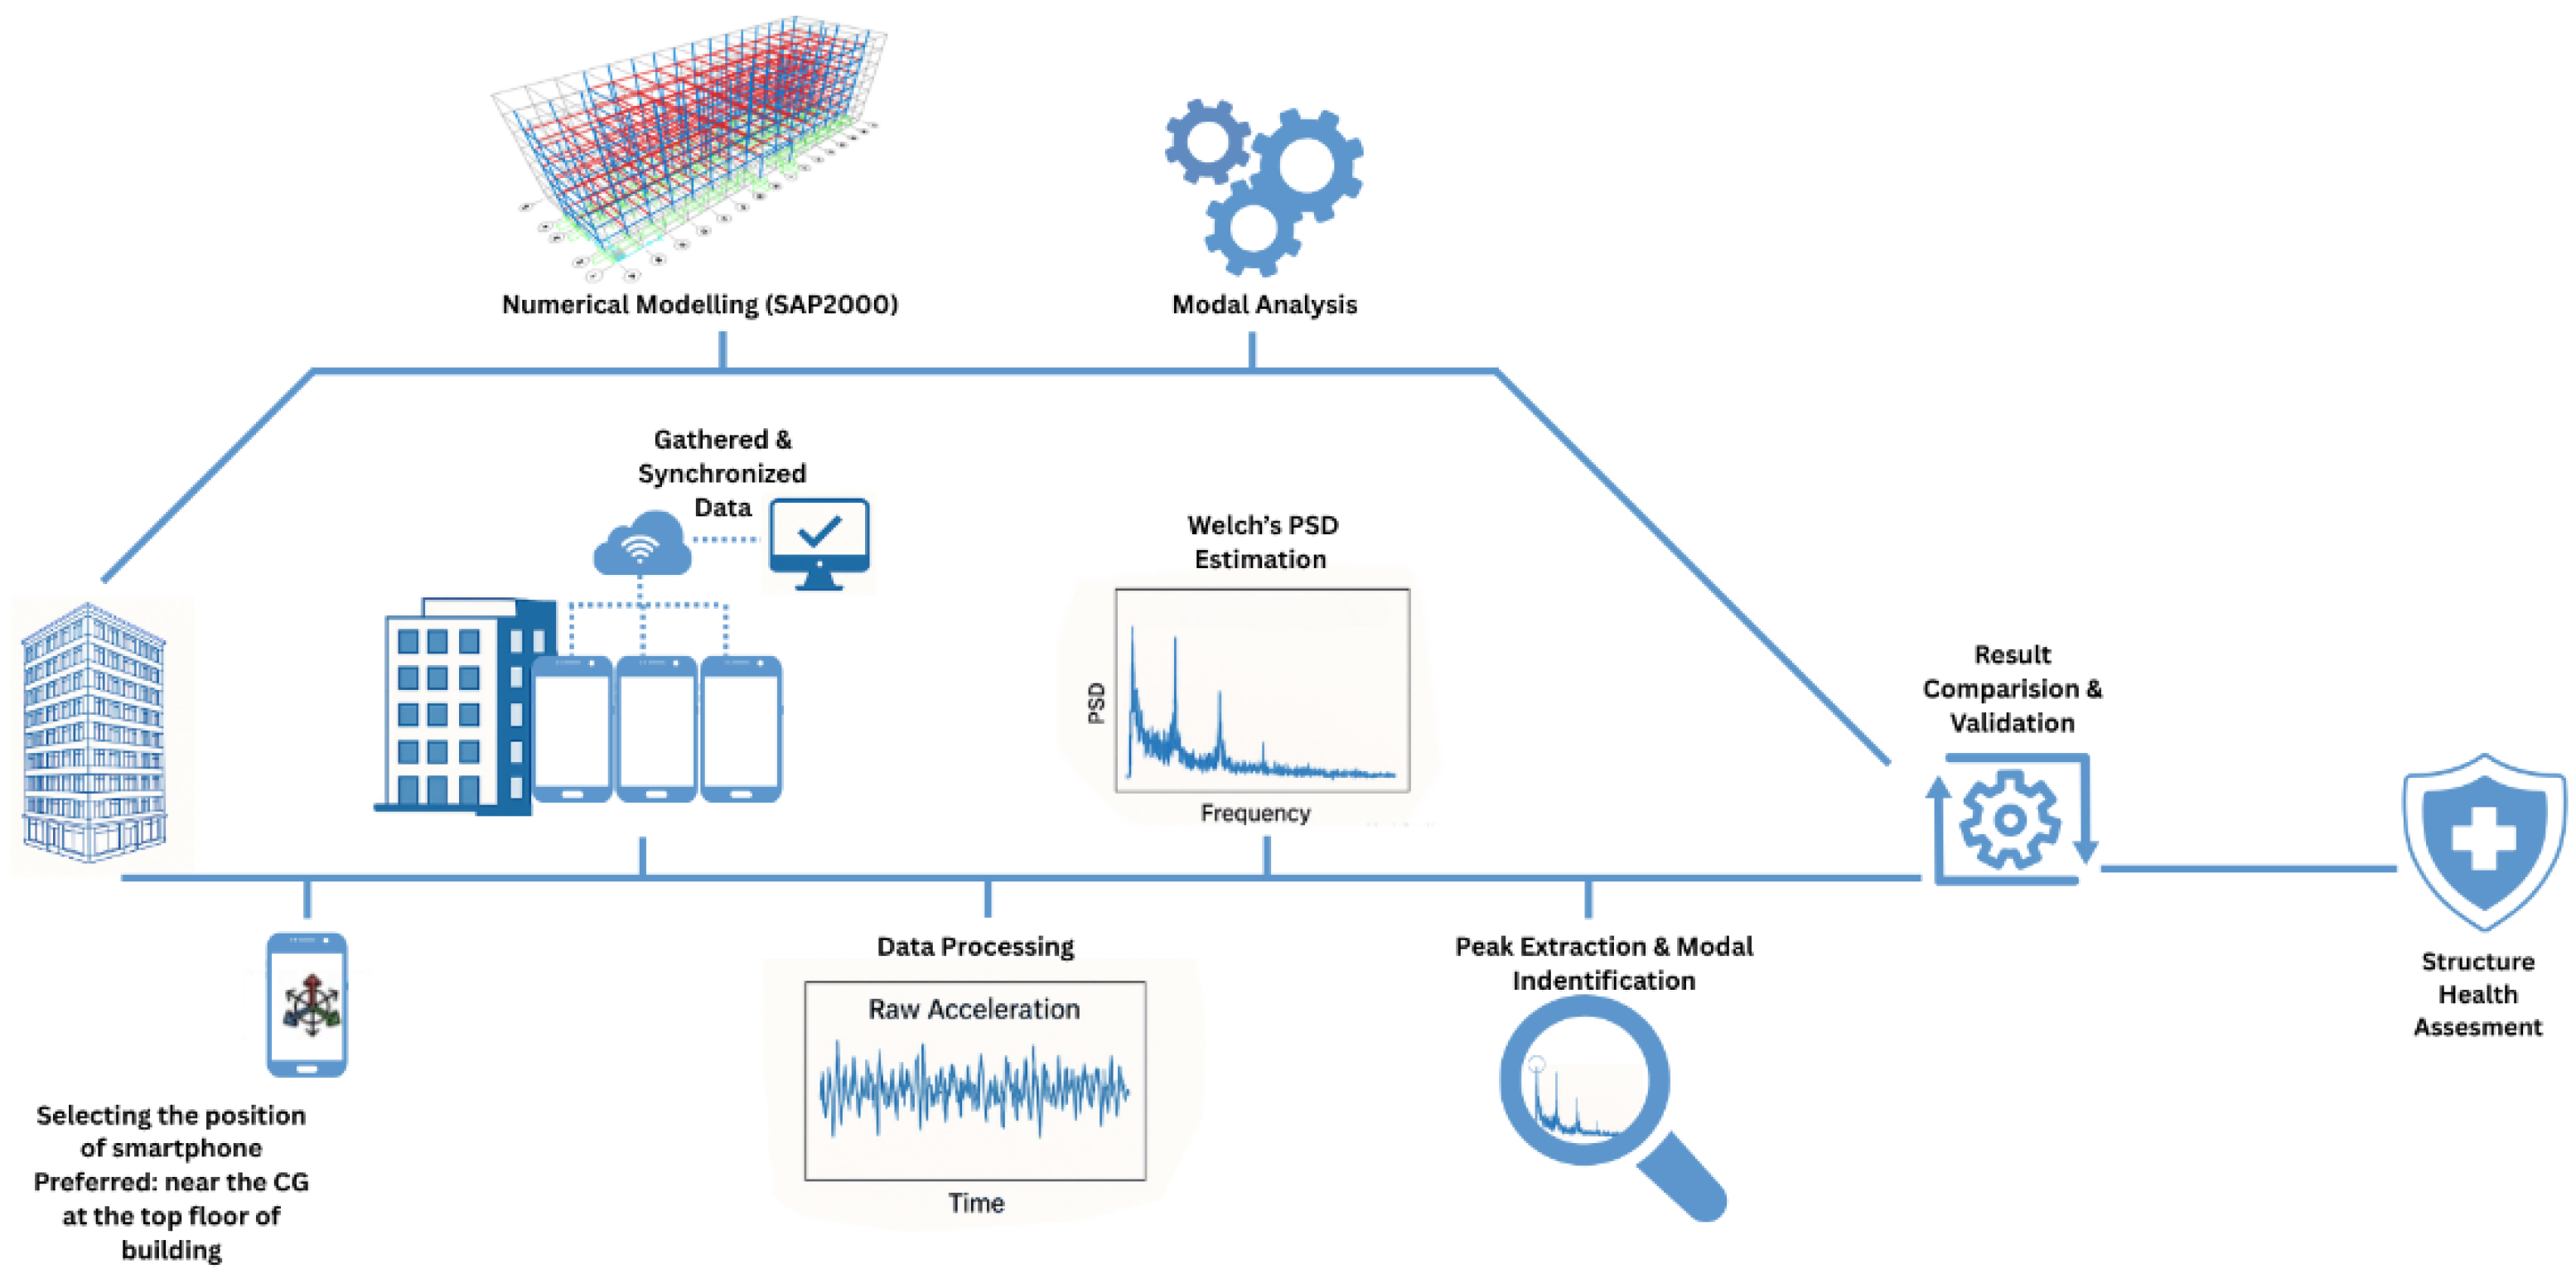
Figure 1.
Schematic Workflow of Structural Integrity Diagnosis.
In our multi-sensor setup, each smartphone continuously appends time-stamped acceleration measurements to a local CSV buffer, which is periodically flushed to persistent storage. The CSV schema for sensor i is
where ti,k is the timestamp (via System.nanoTime( )), (ax, ay, az) are the linear acceleration in m/s2 along device axes, and = the magnitude. By buffering before writing, we balance I/O overhead against memory use, ensuring that transient network drops do not cause data loss.
Once all CSV files are collected, fusion onto a common global timeline is required to enable coherent cross-sensor analysis. Let the global grid be
where is the session start time communicated by the master node. Although the initial /sync protocol aligns clock offsets to within ±5 ms, individual device clocks drift linearly over time. We therefore fit, for each sensor i, a linear model
where captures the relative clock rate error, the initial offset, and random noise. Solving for , via ordinary least square across all ensures global accuracy. After estimating and , corrected timestamps are:
To map each sensor’s readings to the common grid , we identify for each , the two nearest corrected samples (, ) and (, ). Linear interpolation then yields
To prepare the fused acceleration signals for robust spectral estimation under low SNR, we employ an adaptive two-stage preprocessing as statistical normalization followed by zero-phase band-pass filtering. Structural vibration data often contains non-Gaussian transients and drift, making mean-variance normalization suboptimal. Instead, for each channel we compute the sample median as , and the interquartile range as , with , as the 25th and 75th percentiles. We then define the normalized signal. To isolate the modal band of interest, we design an Nth-order Butterworth filter with an analog prototype transfer function
where, and are the low and high corner frequencies. A bilinear transform yields discrete coefficients for the digital difference equation
We apply the filter forward and backward so that the composite response achieves zero net phase shift. This procedure preserves the true timing of arrival and phase relationships across modes while attenuating out-of-band noise. The application of this filter is a key step in preparing the data for subsequent spectral analysis, ensuring that the power spectral density (PSD) estimation can focus on the relevant frequency bands and provide accurate modal parameter extraction.
Figure 2.
Multiple Device Synchronization based on REST API over the Network.
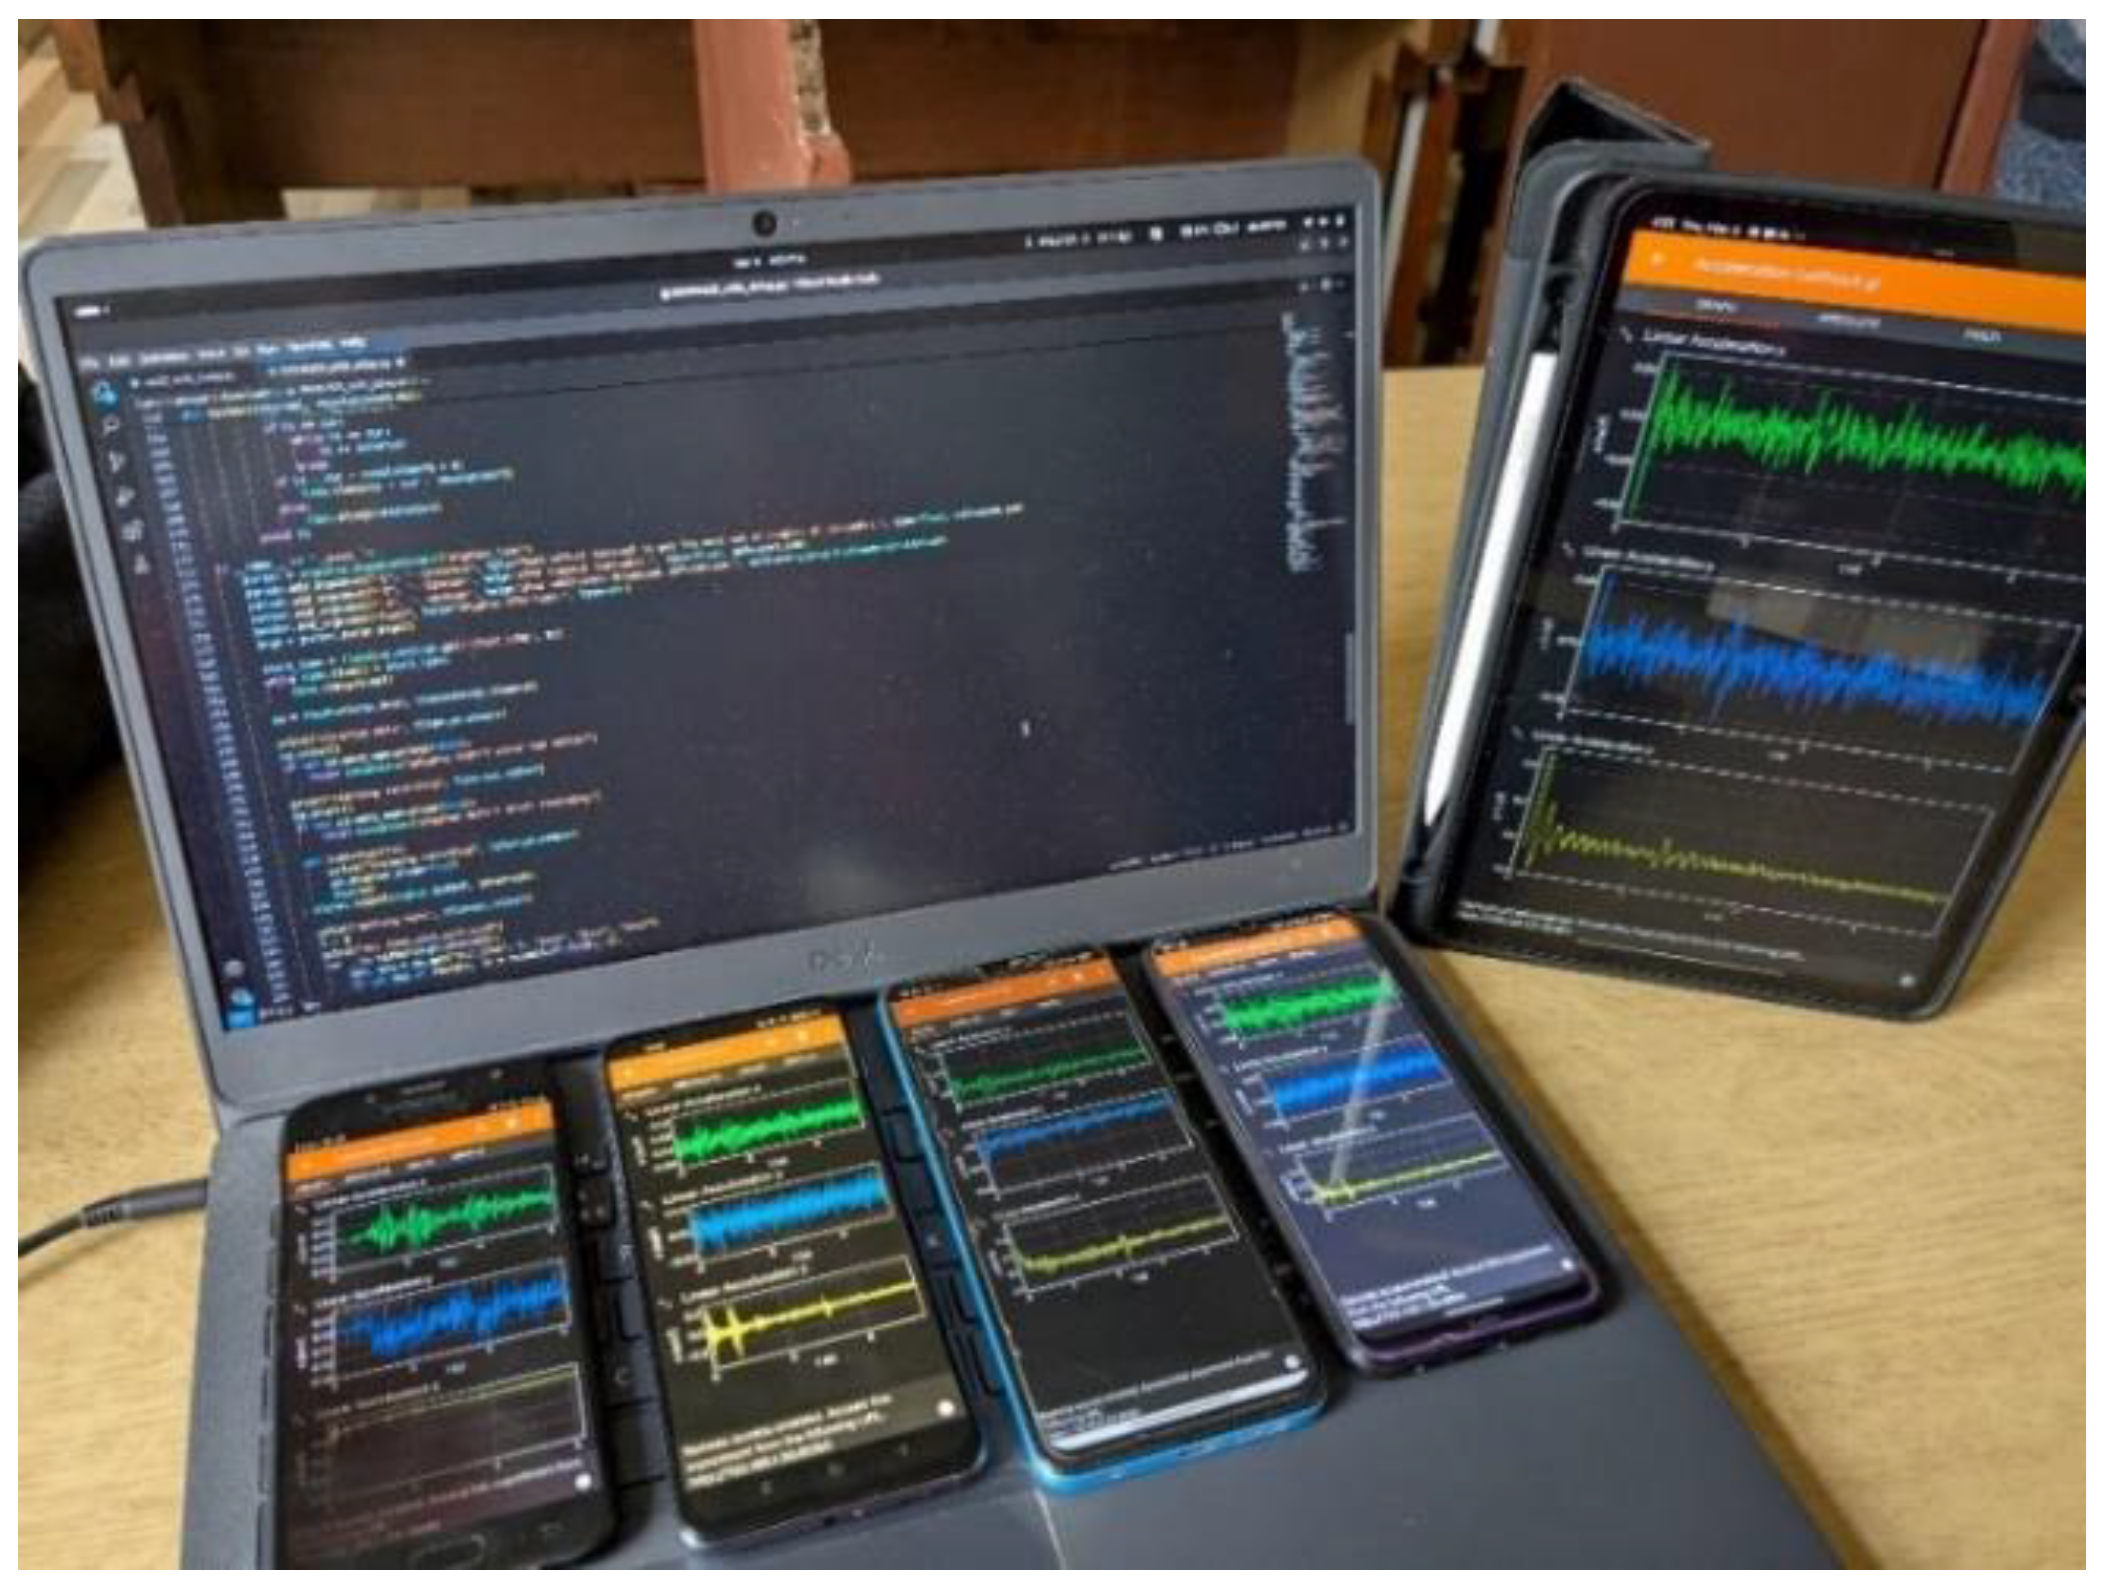

Table 2.
Deviation of ICMP Latency Between Two Smartphone Sensors.
| Smartphone 1 Ping (ms) | Smartphone 2 Ping (ms) | Deviation (ms) |
| 2.30 | 3.14 | 0.84 |
| 1.94 | 2.99 | 1.05 |
| 2.07 | 2.97 | 0.90 |
| 2.26 | 2.91 | 0.65 |
| 2.18 | 3.27 | 1.09 |
| 1.88 | 3.00 | 1.12 |
| 2.15 | 2.94 | 0.79 |
| 2.11 | 3.20 | 1.09 |
| 2.23 | 3.21 | 0.98 |
| 2.26 | 3.14 | 0.88 |
| 1.99 | 2.85 | 0.86 |
| 2.30 | 2.84 | 0.54 |
| 1.93 | 3.20 | 1.27 |
| 2.06 | 3.05 | 0.99 |
| 2.15 | 2.86 | 0.71 |
| 2.18 | 2.90 | 0.72 |
| 1.73 | 2.82 | 1.09 |
| 1.92 | 2.81 | 0.89 |
| 2.29 | 2.92 | 0.63 |
| 1.95 | 2.99 | 1.04 |
The ICMP latency table shows that both Smartphone Sensor 1 and Sensor 2 show good, consistent response times, with an average deviation of less than 1ms between them. This indicates minimal network-induced variability in their latency measurements.
3.2. Signal Processing
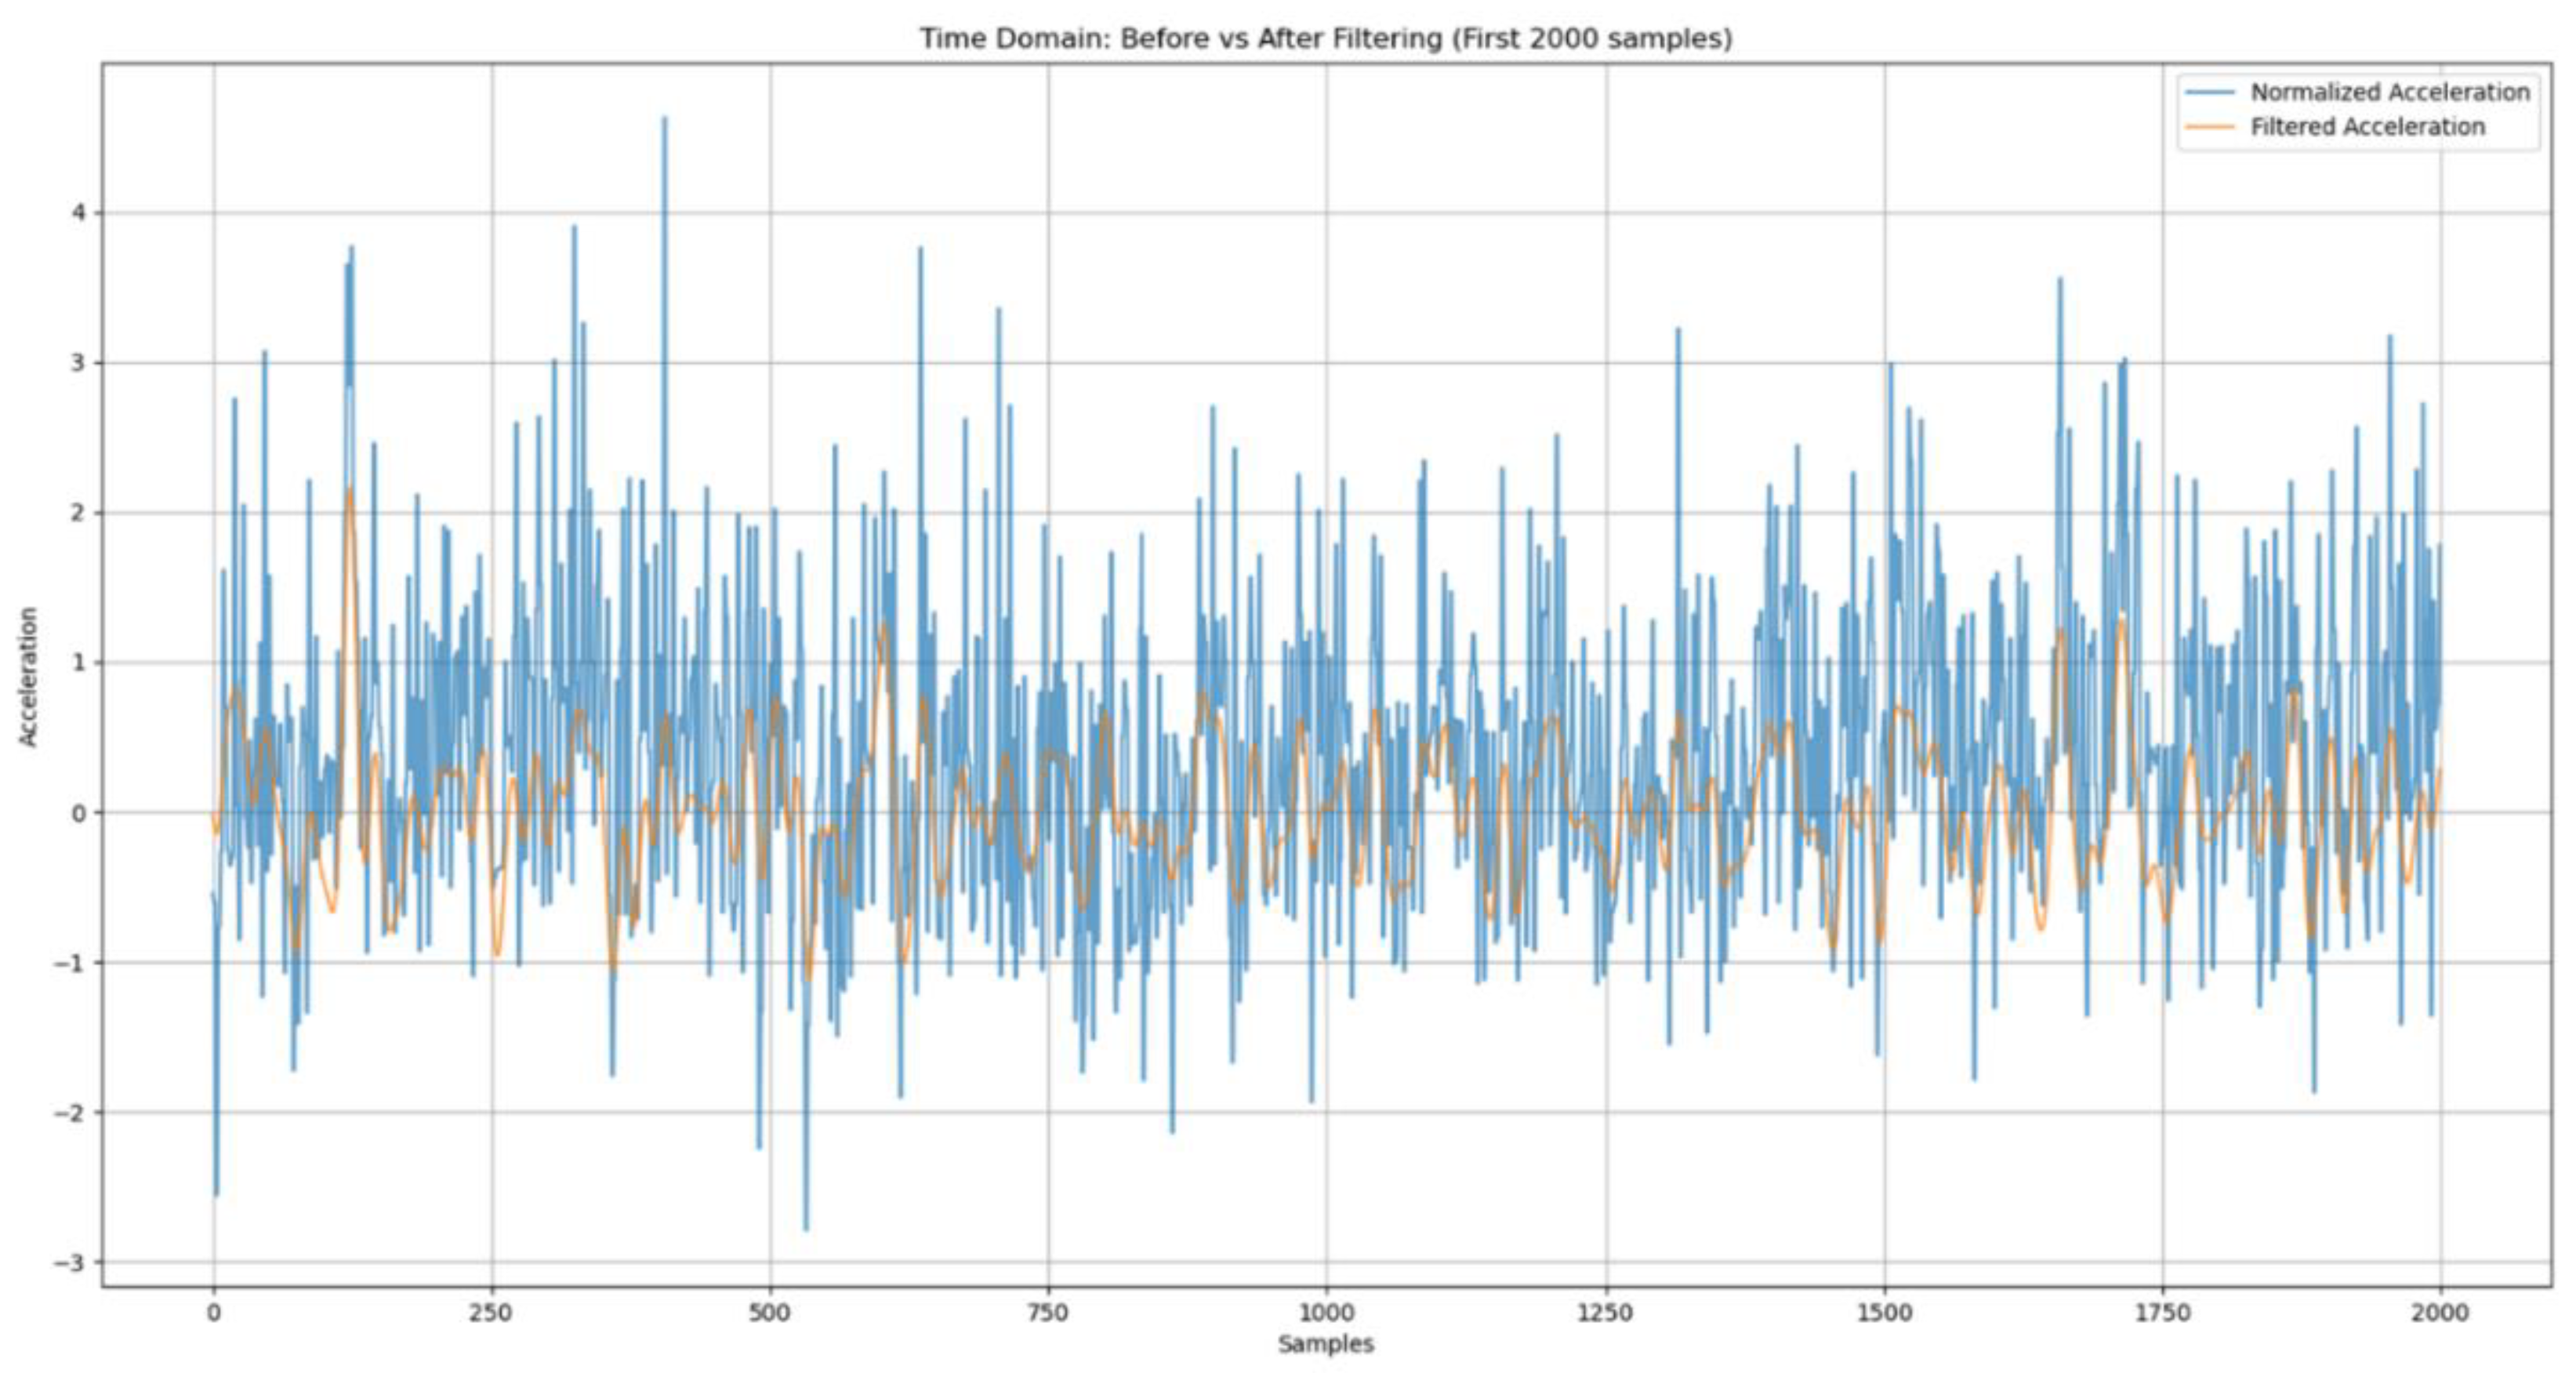
The raw acceleration data collected from MEMS-IMU sensors, particularly smartphone-based, form the foundation of the system. These data are critical for capturing the dynamic response of the KEC Block-E building under ambient conditions. Measurements are recorded along the X, Y, and Z axes, with the absolute acceleration magnitude computed. Due to the low-cost nature of the sensors, the SNR is often low, particularly in ambient vibration conditions. Environmental noise, sensor drift, and hardware limitations contribute to this challenge. Visual representations of the raw acceleration time series are shown in Figure 4. The median-centered normalization removes the baseline drifts and is used instead of the mean. The data are scaled using IQR as discussed before. Then, a zero-phase Butterworth band-pass filter with a frequency range of 0.5 to 5 Hz is applied to isolate the structural vibration modes.
Figure 3.
Recorded Time Series Data CSV.
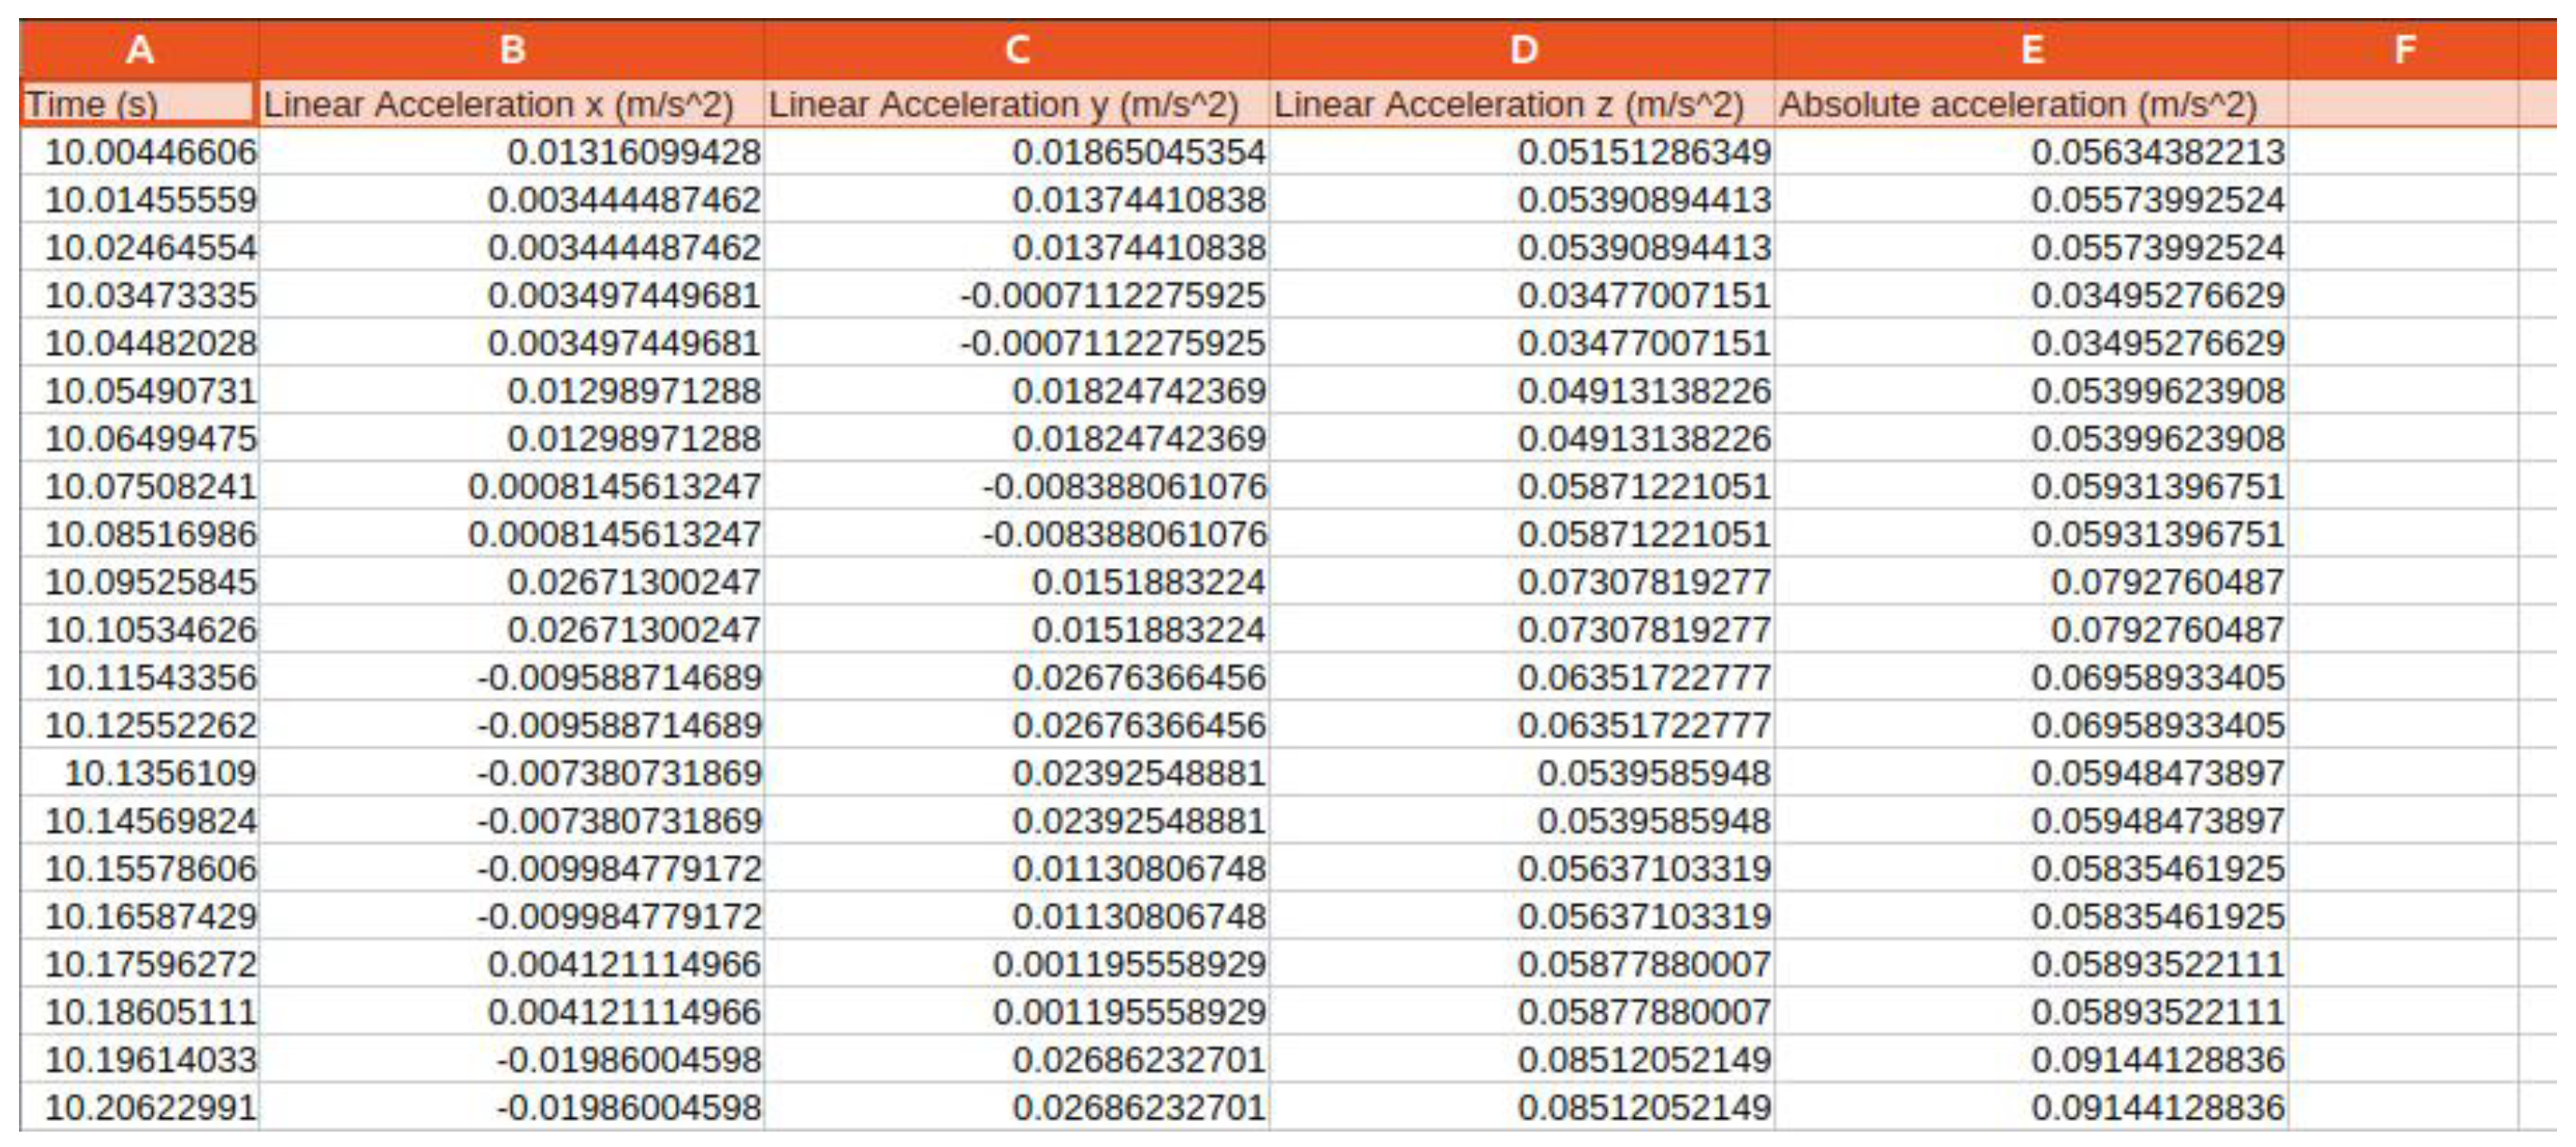
Figure 4.
Raw Acceleration Time Series.
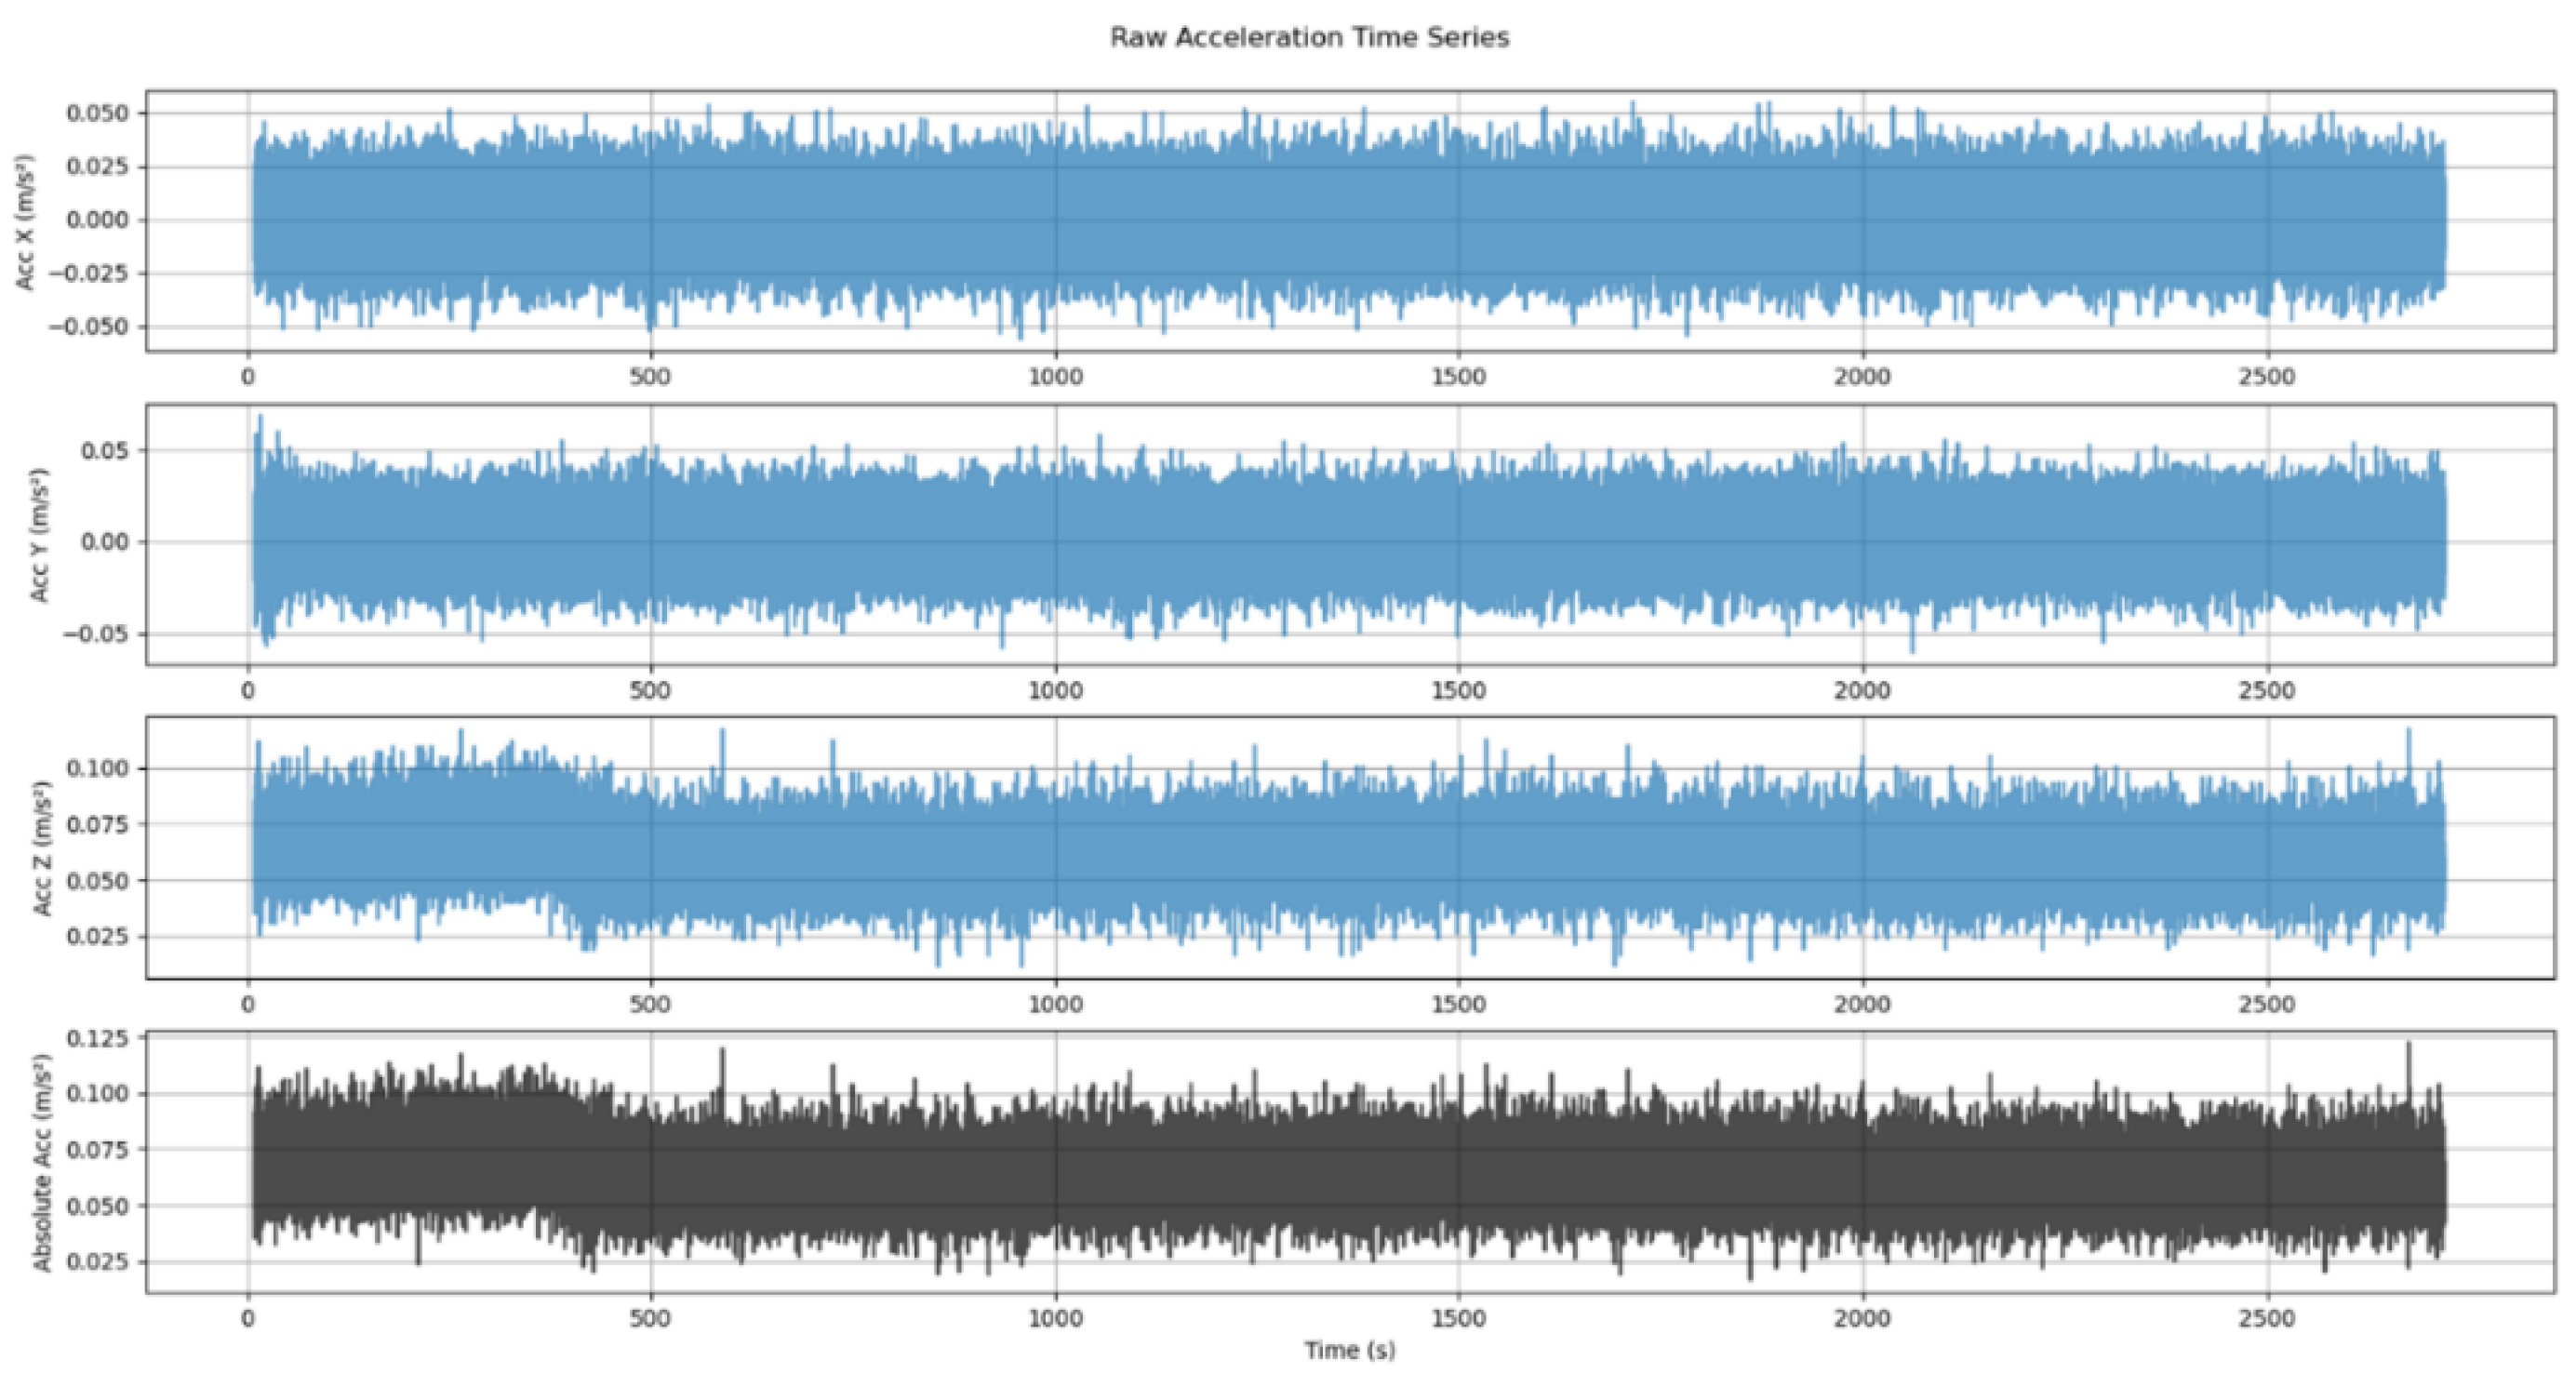
Figure 5.
Normalized Acceleration Time Series.
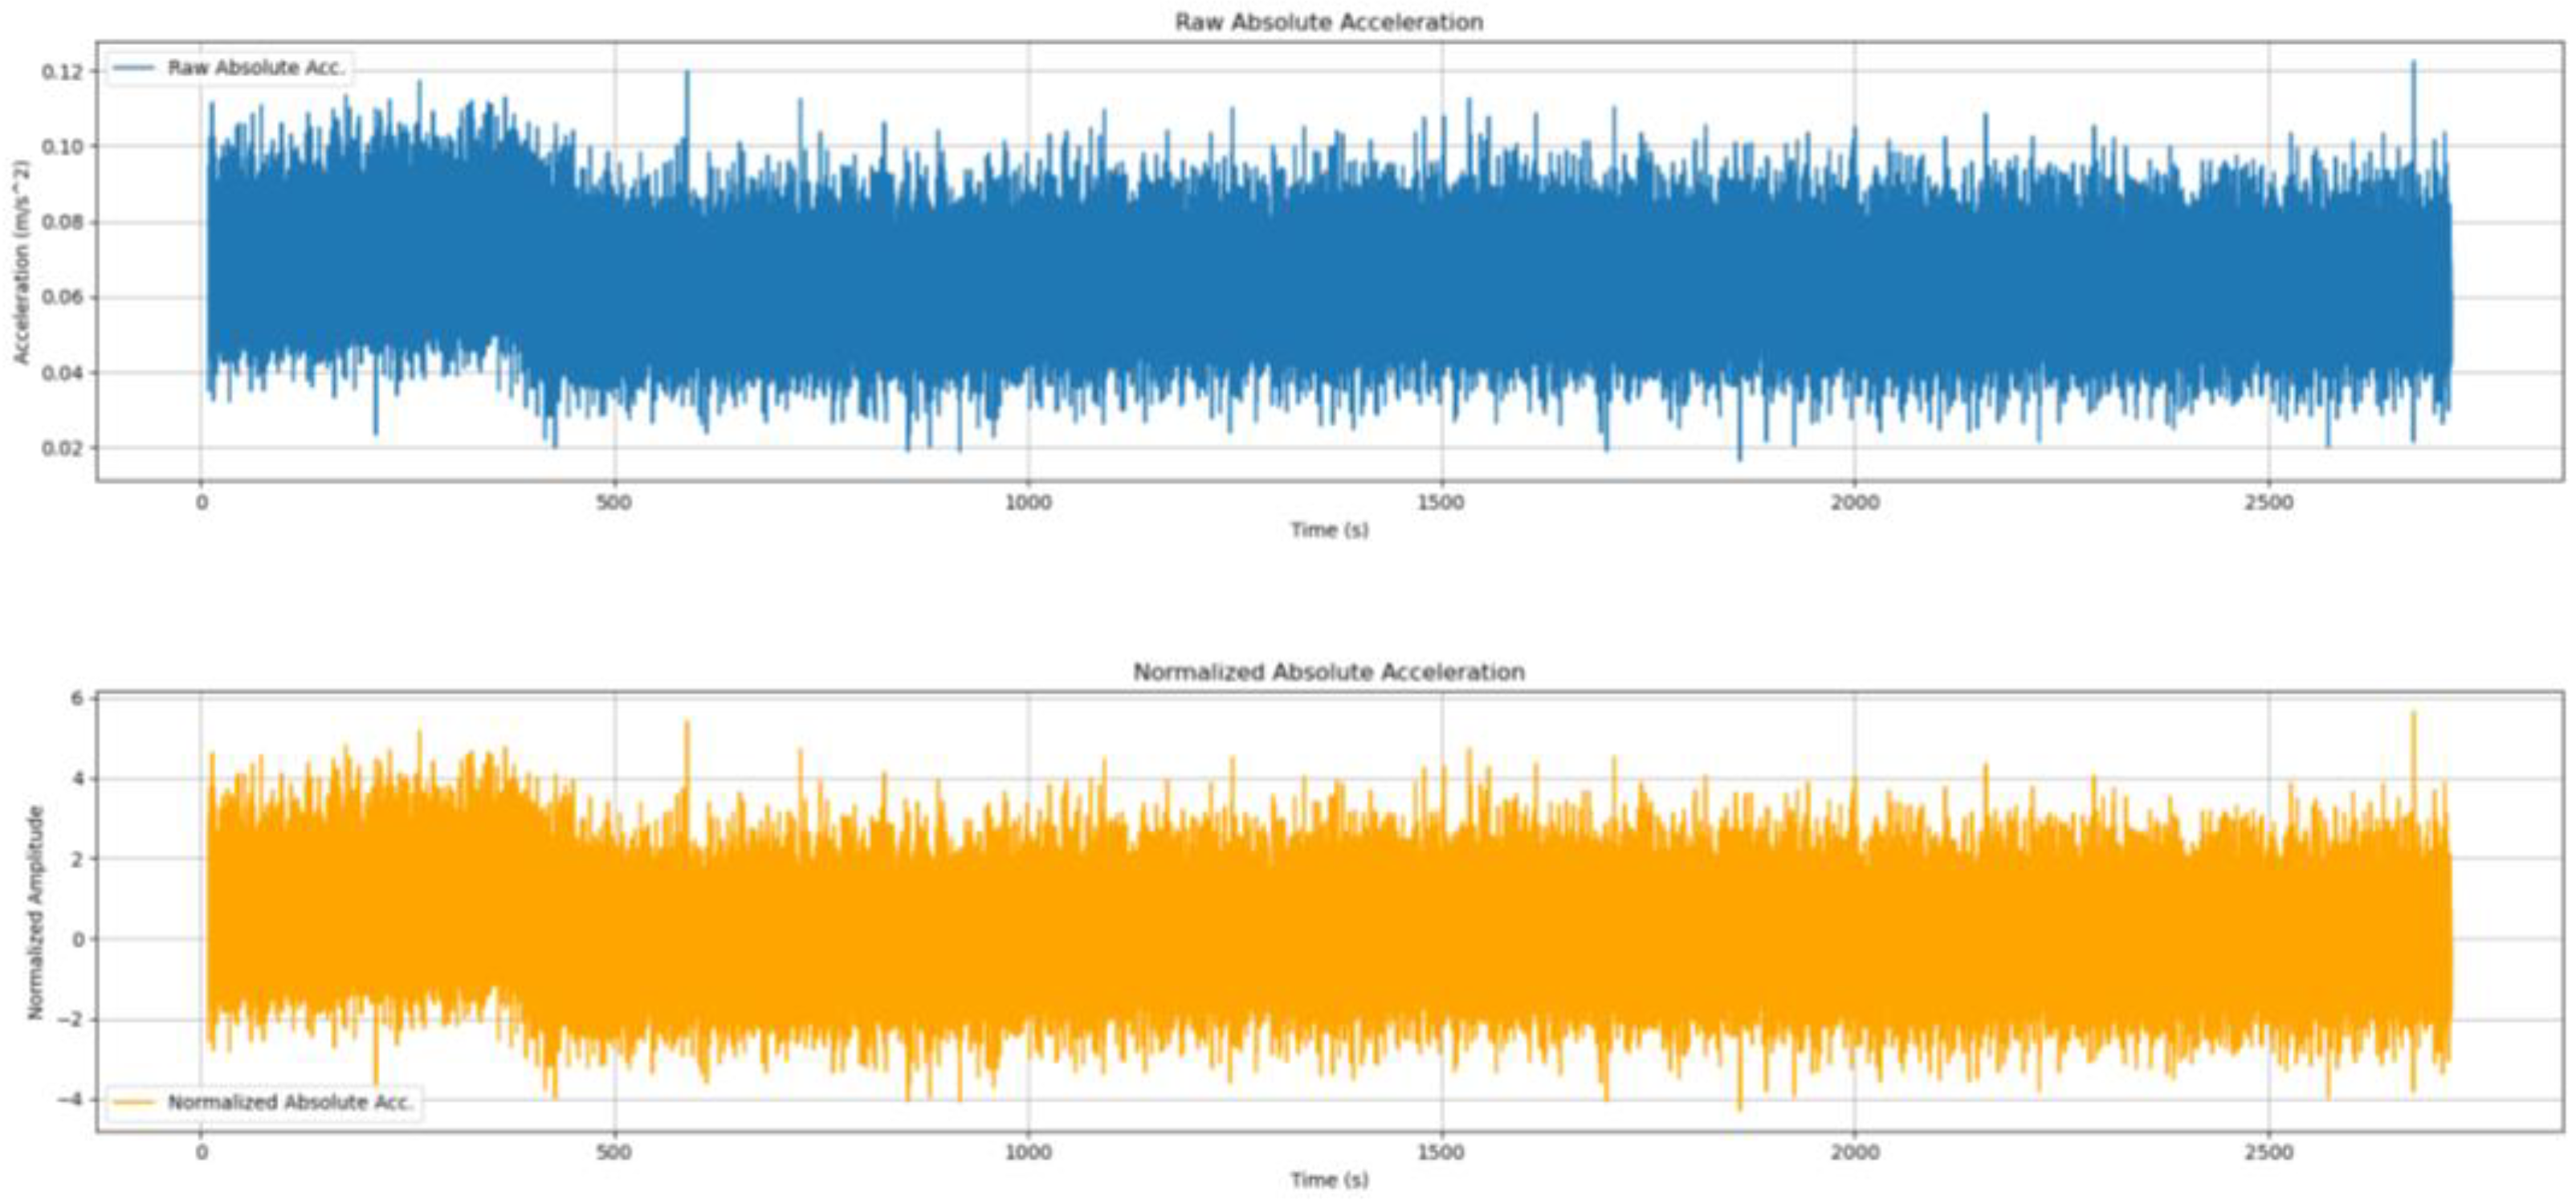
Figure 6.
Time Domain: Before vs. After Filtering.
3.3. Welch’s PSD Estimation
The estimation of the power spectral density (PSD) is a cornerstone of the Structural Health Monitoring (SHM) system, as it allows for the identification of modal frequencies from the vibration data. This work employs a Welch’s PSD estimation method, which enhances the traditional Welch’s method by addressing biases and improving frequency resolution, particularly in low Signal-to-Noise Ratio (SNR) conditions.
In the Welch’s PSD estimation, the choice of window function is crucial for minimizing spectral leakage, which can occur due to the finite length of the data segments. The Hann window, also known as the Hanning window, is selected for its ability to provide a good balance between the main lobe width and side lobe attenuation. The window function applies a smooth taper to the data segments, reducing the discontinuities at the edges and thereby minimizing the introduction of spurious frequency components in the PSD estimates. The Hann window is defined as:
where and is the length of the window.
By using the Hann window, the method ensures that the PSD estimation is less affected by leakage, allowing for more accurate identification of the true spectral peaks corresponding to the structural modal frequencies. To further enhance the accuracy of the PSD estimation, bias-correction filters are applied to each periodogram to remove systematic errors introduced by the windowing process and to account for noise-induced biases, particularly in low SNR conditions. These filters adjust the spectral estimates by identifying and subtracting the bias components, ensuring that the final PSD is a more faithful representation of the underlying signal. Additionally, adaptive overlap weighting can be adopted, where the overlap between consecutive data segments is adjusted based on the signal’s stationarity. For non-stationary components, a higher overlap is used to capture more of the signal’s variability, while for stationary regions, a lower overlap is applied to reduce computational redundancy. Each segment is then weighted in the averaging process based on its SNR and local stationarity measures, with higher weights assigned to segments that are more reliable.
The extraction of modal frequencies from the PSD estimates is achieved through an automated peak detection algorithm that incorporates several validation steps to ensure the reliability of the identified peaks. Initially, local maxima in the PSD are identified, with a minimum prominence threshold set at 1.5 times the median of the power values to filter out insignificant peaks. Additionally, a minimum separation between peaks is enforced to avoid detecting closely spaced frequencies as separate modes. To further refine the peak detection, SNR thresholding is applied where peaks with power less than three times the local noise floor are discarded. This step ensures that only peaks with a sufficient SNR are considered, reducing the impact of noise on the modal frequency identification. Harmonic screening is also performed to eliminate peaks that are harmonics of other identified frequencies, as these can arise from nonlinearities or environmental factors and do not represent independent structural modes. Finally, only peaks within the physically plausible frequency range of 0.5 to 5Hz are focused. The validated peaks are then subjected to cluster analysis, where similar peaks are grouped based on their frequency, proximity, and energy content. The dominant mode is selected as the cluster with the largest integrated area under the PSD curve, representing the most significant vibration mode.
3.4. Numerical Modeling
A numerical model of the KEC Block-E building was developed in SAP2000 (CSI) to simulate its dynamic behavior. The KEC Block-E was chosen for its regular geometry, simple structural layout, and availability of detailed drawings. It is an educational facility with a reinforced concrete special moment-resisting frame, designed to resist seismic forces per Indian Standard IS 1893-1 [22]. The model includes defining the building’s geometry, material properties, loads, and boundary conditions. The key characteristics of the building are:
- Owner: Kathmandu Engineering College
- Location: Kalimati, Kathmandu, Nepal
- Floor-to-floor height: 10 ft
- Plan dimensions: 150.167 ft × 50.16 ft
- Number of stories: Ground + 5 (G+5)
- Total height: 60 ft
- Plan shape: Regular
- Category: Educational
- Plinth area: 6019.94 sq. ft
- Building type: RC special moment-resisting frame
Modal analysis was then performed in SAP2000 as shown in Figure 7 (b) to extract the building’s natural frequencies, periods, and mode shapes. The computed modal results serve as a baseline for comparison with experimental Operational Modal Analysis (OMA) data.
4. Results
4.1. Numerical Modeling
The SAP2000 numerical model of the KEC Block-E building yielded the building’s modal periods and frequencies. The first twelve modes are summarized in Table 3, listing each mode’s period and frequency. The first mode (dominant) has a period of 0.77237 s (frequency 1.2947 Hz). For completeness, Table 4 shows the modal load participation ratios (translation in X and Y, and vertical) for the first mode, indicating that the dominant mode is almost entirely in the horizontal directions (UX, UY). These results provide a reference against which to compare the field-collected data.
As expected for an educational building with a regular plan, the first mode is primarily horizontal. The first mode’s parameters (period 0.77237 s, frequency 1.2947 Hz) describe the structure’s fundamental vibration.
4.2. Comparison Between OMA and Numerical Modal Results
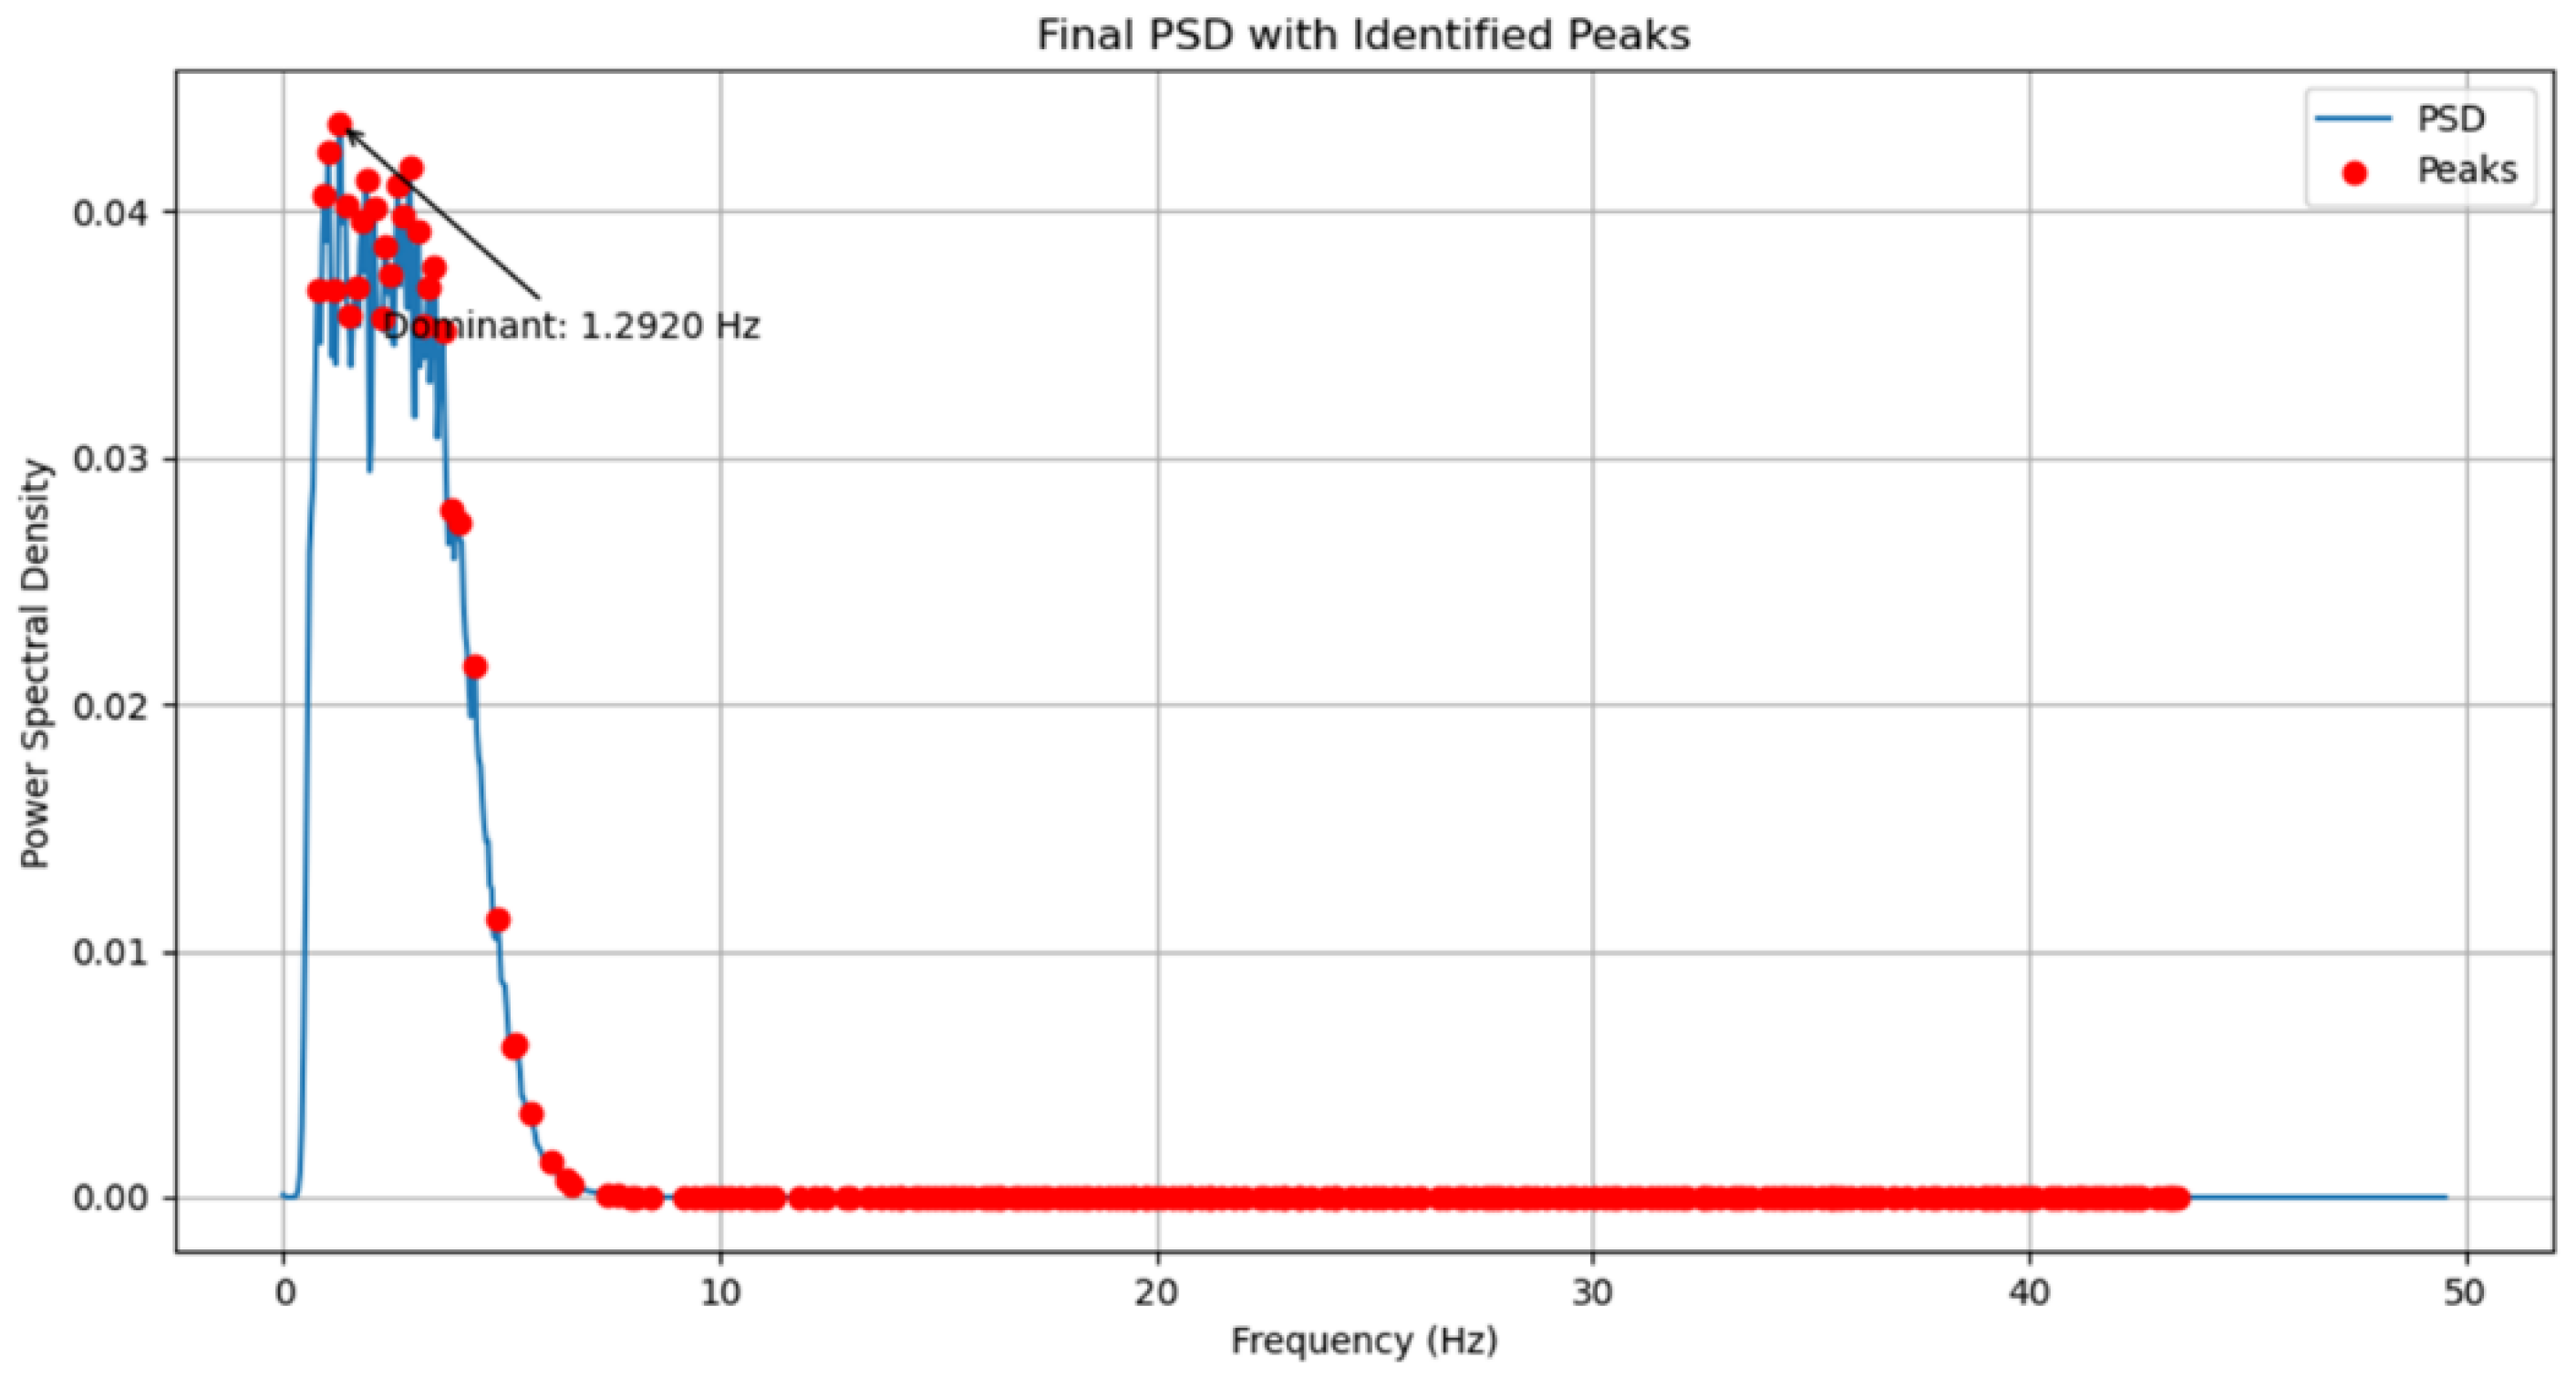
The experimentally obtained modal frequency (dominant) from OMA is compared with Numerical results from SAP2000 to validate the integrity of the structure.OMA Results: The dominant modal frequency is identified as 1.2920 Hz using the Welch’s PSD method, and from the SAP2000 Results: The numerical modal analysis predicts a fundamental natural frequency of 1.2947 Hz.
Discrepancy: The difference between the experimental and numerical frequencies is only 0.2085%, calculated as:
Figure 8.
PSD with Identified Peaks.
5. Discussion
The results indicate that the proposed smartphone-based SHM system can achieve commendable accuracy given its constraints. For the KEC Block-E test case, the fundamental frequency identified via OMA (1.2920Hz) matched the SAP2000 prediction (1.2947 Hz) with only 0.2085% error. This small discrepancy highlights the system’s accuracy: it was able to capture the building’s dynamic property almost as well as a high-fidelity analysis. The accuracy is attributable to the robust signal processing and synchronization. The preprocessing chain (median normalization, zero-phase Butterworth filtering, Welch PSD) effectively extracted the true modal peak despite noisy data. Likewise, the tight time synchronization (millisecond-level alignment across phones) preserved phase information, minimizing distortions in the modal estimation. However, the achieved precision also depends on consistent sensor performance. Different smartphone models may exhibit varying noise and drift characteristics, so careful calibration of each device is necessary to maintain this level of accuracy.
The system’s design emphasizes scalability and efficiency, making it suitable for large-scale deployment in resource-limited settings. By leveraging ubiquitous smartphones, monitoring can be decentralized across many structures without specialized equipment. The modular REST-API architecture allows easy integration of additional sensors or advanced analytics. Using low-cost phone accelerometers dramatically lowers the financial barrier to SHM. This opens the possibility of broad monitoring coverage in places like Nepal, where budgets typically restrict use of traditional systems. For instance, thousands of smartphones could be networked to monitor many buildings in parallel, providing rapid situational awareness after an earthquake. The asynchronous, fault-tolerant design also means that monitoring can continue even if some devices lose connection temporarily. The analysis underscores the system’s potential as a cost-effective preliminary assessment tool. It can reliably detect large shifts in modal frequencies, which are primary indicators of damage (e.g., a significant drop in fundamental frequency often signals stiffness loss). By automating alerts when such shifts occur, the system can prioritize detailed inspections where they are most needed. Thus, the approach moves SHM practice toward predictive resilience: rather than waiting for a post-earthquake survey to discover damage, the system provides early warning based on subtle changes in dynamic behavior.
6. Limitations
Despite its advantages, the proposed system has several limitations that can constrain its applicability. First, wireless communication inherently suffers from latency and unreliability. Signal propagation and processing delays introduce some timing uncertainty, no matter how well the synchronization and post hoc correction are implemented. Random packet drops (due to interference or congestion) can lead to gaps in the data, potentially compromising the completeness of the structural assessment. Mitigation strategies such as redundant transmissions or error correction coding could help, but add complexity. In areas with poor wireless coverage, a specialized mesh network might be required to maintain connectivity; however, deploying such a network would increase cost and complexity, partially offsetting the low-cost appeal. Second, smartphone clocks cannot be easily adjusted (without rooting), which limits the ultimate synchronization accuracy. Clock drift over long durations can still accumulate despite our linear correction method. Third, the low SNR inherent in consumer IMUs means weak structural signals (e.g., from small vibrations) may remain hidden in noise. In very noisy environments or with very subtle structural damage, the system’s sensitivity could be insufficient. Also, in many Android smartphones, ICMP echo requests may not be a priority, which may lead to inconsistent latency.
A practical limitation of this study is the lack of further cross-validation with industry-grade sensors. This study relied on comparison to numerical models (SAP2000) for validation. Although the agreement was strong, the absence of professional accelerometer data means we cannot fully benchmark performance against the gold standard. Acquiring and deploying high-end reference sensors would improve confidence in the results, but it was not possible within this resource-constrained study. Future work should incorporate such equipment for thorough validation. Additionally, smartphone variability (different models, sensor drift, temperature effects, etc.) may introduce calibration challenges. The system’s reliance on local Wi-Fi also means it is best suited for relatively small monitoring areas (e.g., one building at a time) unless broader network infrastructure is provided. These limitations suggest the method is most appropriate for preliminary, scalable screening rather than high-precision, safety-critical assessments.
7. Conclusions
This research has demonstrated a scalable, low-cost approach for structural integrity diagnosis using commodity smartphones. By developing a REST-API synchronized monitoring platform and an enhanced spectral analysis pipeline, we have shown that accurate modal frequencies can be extracted from ambient vibrations. The system was applied to the KEC Block-E building, where it identified the fundamental frequency in close agreement with a detailed SAP2000 model. Such data can be used to rapidly classify buildings into categories like safe, restricted, or unsafe shortly after an earthquake, based on observed frequency shifts. The proposed method’s strengths (cost-effectiveness, ease of deployment, scalability) make it well-suited for preliminary assessments in earthquake-prone, resource-constrained regions. At the same time, we have outlined its limitations and the need for further work. validation against high-end instruments, which will be an important next step. By addressing these areas, future iterations of the system could further enhance reliability and broaden applicability. Overall, the framework offers a promising path toward predictive resilience, enabling communities to turn ubiquitous smartphone sensors into actionable insights for infrastructure safety.
Author Contributions
All listed authors contributed significantly to the work. A.R. developed the method, wrote the method code, applied it to the experimental data, and prepared the original draft. B.P. conducted the literature review and investigation and provided input during drafting. A.D. and H.RS. carried out the numerical analysis of the building and assisted in project administration. G.BM. supervised the project and contributed to the manuscript’s revision.
Funding
This research received no external funding.
Data Availability Statement
The recorded acceleration data, Python scripts for synchronization, signal processing, and PSD analysis are available from the corresponding author upon request.
Conflicts of Interest
The authors declare no conflicts of interest.
Abbreviations
The following abbreviations are used in this manuscript:
| REST | Representational State Transfer |
| API | Application Programming Interface |
| MEMS | Micro-Electro-Mechanical Systems |
| IMU | Inertial Measurement Unit |
| PSD | Power Spectral Density |
| SHM | Structural Health Monitoring |
| OMA | Operational Modal Analysis |
| Mw | Magnitude |
| GPS | Global Positioning System |
| SNR | Signal-to-Noise Ratio |
| Hz | Hertz |
| ms | Millisecond |
| NTP | Network Time Protocol |
| RC | Reinforced Concrete |
| μs | Microsecond |
| WSN | Wireless Sensor Network |
| MACL | Medium Access Control Layer |
| FTSP | Flooding Time Synchronization Protocol |
| GNSS | Global Navigation Satellite System |
| SAP | Structural Analysis Program |
| CG | Center of Gravity |
| iOS | iPhone Operating System |
| HTTP | Hyper Text Transfer Protocol |
| Wi-Fi | Wireless Fidelity |
| ICMP | Internet Control Message Protocol |
| SSID | Service Set Identifier |
| kB | Kilobyte |
| CSV | Comma-Separated Values |
| IQR | Inter-Quartile Range |
| KEC | Kathmandu Engineering College |
| CSI | Computers and Structures, Inc. |
| sq.ft | Square-Feet |
| RMS | Root Mean Square |
| LSB | Least Significant Bit |
| ODR | Output Data Rate |
| g | Acceleration due to gravity |
| dps | Degrees Per Second |
| µg/√Hz | Micro-g per square root Hertz |
References
- Zhang, D.; Tian, J.; Li, H. Design and Validation of Android Smartphone Based Wireless Structural Vibration Monitoring System. Sensors 2020, 20, 4799. [CrossRef]
- Ozer, E.; et al. Smartphone Based Vibration Monitoring Studies of a Pedestrian Link Bridge. Proc. 11th European Workshop on Structural Health Monitoring, 2024, 1–11. [CrossRef]
- Cronin, L.; Sen, D.; Marasco, G.; Dabbaghchian, I.; Benedetti, L.; Matarazzo, T.; Pakzad, S. A Roadmap for Ubiquitous Crowdsourced Mobile Sensing-Based Bridge Modal Identification. Sensors 2025, 25, 2528. [CrossRef]
- Kang, J.-D.; Baek, E.-R.; Park, S.-H. Evaluation of Vibration Detection Using Smartphones in a Two-Story Masonry-Infilled RC Frame Building. Buildings 2023, 13, 1069. [CrossRef]
- Occhipinti, G.; Lo Iacono, F.; Tusa, G.; Costanza, A.; Fertitta, G.; Lodato, L.; Macaluso, F.; Martino, C.; Mugnos, G.; Oliva, M.; et al. Shake Table Tests on Scaled Masonry Building: Comparison of Performance of Various Micro-Electromechanical System Accelerometers (MEMS) for Structural Health Monitoring. Sensors 2025, 25, 1010. [CrossRef]
- Elhattab, A.; Uddin, N.; OBrien, E. Extraction of Bridge Fundamental Frequencies Utilizing a Smartphone MEMS Accelerometer. Sensors 2019, 19, 3143. [CrossRef]
- Ozer, E.; Kromanis, R. Smartphone Prospects in Bridge Structural Health Monitoring, a Literature Review. Sensors 2024, 24, 3287. [CrossRef]
- Kong, Q.; Allen, R.M.; Kohler, M.D.; Heaton, T.H.; Bunn, J. Structural Health Monitoring of Buildings Using Smartphone Sensors. Seismol. Res. Lett. 2018, 89, 594–602. [CrossRef]
- Patel, S.C.; Günay, S.; Marcou, S.; Gou, Y.; Kumar, U.; Allen, R.M. Toward Structural Health Monitoring with the MyShake Smartphone Network. Sensors 2023, 23, 8668. [CrossRef]
- Ozer, E.; Feng, M.Q.; Feng, D. Citizen Sensors for SHM: Towards a Crowdsourcing Platform. Sensors 2015, 15, 14591-14614. [CrossRef]
- Dash, P.; Sharma, A. Wireless-Based Smart Sensor Technology for Structural Health Monitoring: Opportunities and Challenges. Int. J. Eng. Res. Technol. 2015, 4(03), RACEE–2015, Article ID IJERTCONV4IS03042.
- Figueiredo, E.; Moldovan, I.; Alves, P.; Rebelo, H.; Souza, L. Smartphone Application for Structural Health Monitoring of Bridges. Sensors, 22, 2022, 8483. [CrossRef]
- Hasani, H.; Freddi, F.; Piazza, R.; Ceruffi, F. A Wireless Data Acquisition System Based on MEMS Accelerometers for Operational Modal Analysis of Bridges. Sensors 2024, 24, 2121. [CrossRef]
- Villacorta, J.J.; del-Val, L.; Martínez, R.D.; Balmori, J.-A.; Magdaleno, Á.; López, G.; Izquierdo, A.; Lorenzana, A.; Basterra, L.-A. Design and Validation of a Scalable, Reconfigurable and Low-Cost Structural Health Monitoring System. Sensors 2021, 21, 648. [CrossRef]
- Li, J.; Mechitov, K.A.; Kim, R.E.; Spencer, B.F. Jr. Efficient Time Synchronization for Structural Health Monitoring Using Wireless Smart Sensor Networks. Struct. Control Health Monit. 2016, 23(3), 470–486. [CrossRef]
- Sundararaman, B.; Buy, U.; Kshemkalyani, A.D. Clock Synchronization for Wireless Sensor Networks: A Survey. Ad Hoc Netw. 2005, 3, 281–323. [CrossRef]
- Yu, L.; Qiao, Z.; Xing, S.; Wu, Y.; Ji, H. A Novel Structural Vibration Sensing Approach Based on a Miniaturized Inertial Measurement Unit. Sensors 2025, 25, 3958. [CrossRef]
- Tran, T.T.X.; Ozer, E. Synergistic bridge modal analysis using frequency domain decomposition. Mech. Syst. Signal Process. 2021, 160, 107818. [CrossRef]
- Liu, Z. Smart Sensors for Structural Health Monitoring and Nondestructive Evaluation. Sensors 2024, 24, 603. [CrossRef]
- Eisermann, C.; Voigt, C.; Marx, S.; Kang, C. The Initial Structural Health Monitoring System of the Nibelungen Bridge Worms. e-J. Nondestr. Test. 2024, 29(7), Proceedings of the 10th European Workshop on Structural Health Monitoring (EWSHM 2024), Potsdam, Germany, 10–13 June 2024. [CrossRef]
- Li, H.; Di, B.; Zheng, Y.; Ma, H.; Huang, X.; Wu, H.; Zhang, J. Concrete Damage Identification and Localization for Structural Health Monitoring Based on Piezoelectric Sensors. Sensors 2025, 25, 2532. [CrossRef]
- Bureau of Indian Standards. Criteria for Earthquake Resistant Design of Structures – Part 1: General Provisions and Buildings (IS 1893-1:2002); Bureau of Indian Standards: New Delhi, India, June 2002. Available online: https://law.resource.org/pub/in/bis/S03/is.1893.1.2002.pdf (accessed on 27 June 2025).
- Staacks, S.; Hütz, S.; Heinke, H.; Stampfer, C. Advanced Tools for Smartphone-Based Experiments: Phyphox. Phys. Educ. 2018, 53, 045009. [CrossRef]
Figure 7.
(a) North Elevation of the Building; (b)Numerical Modeling Using SAP2000.
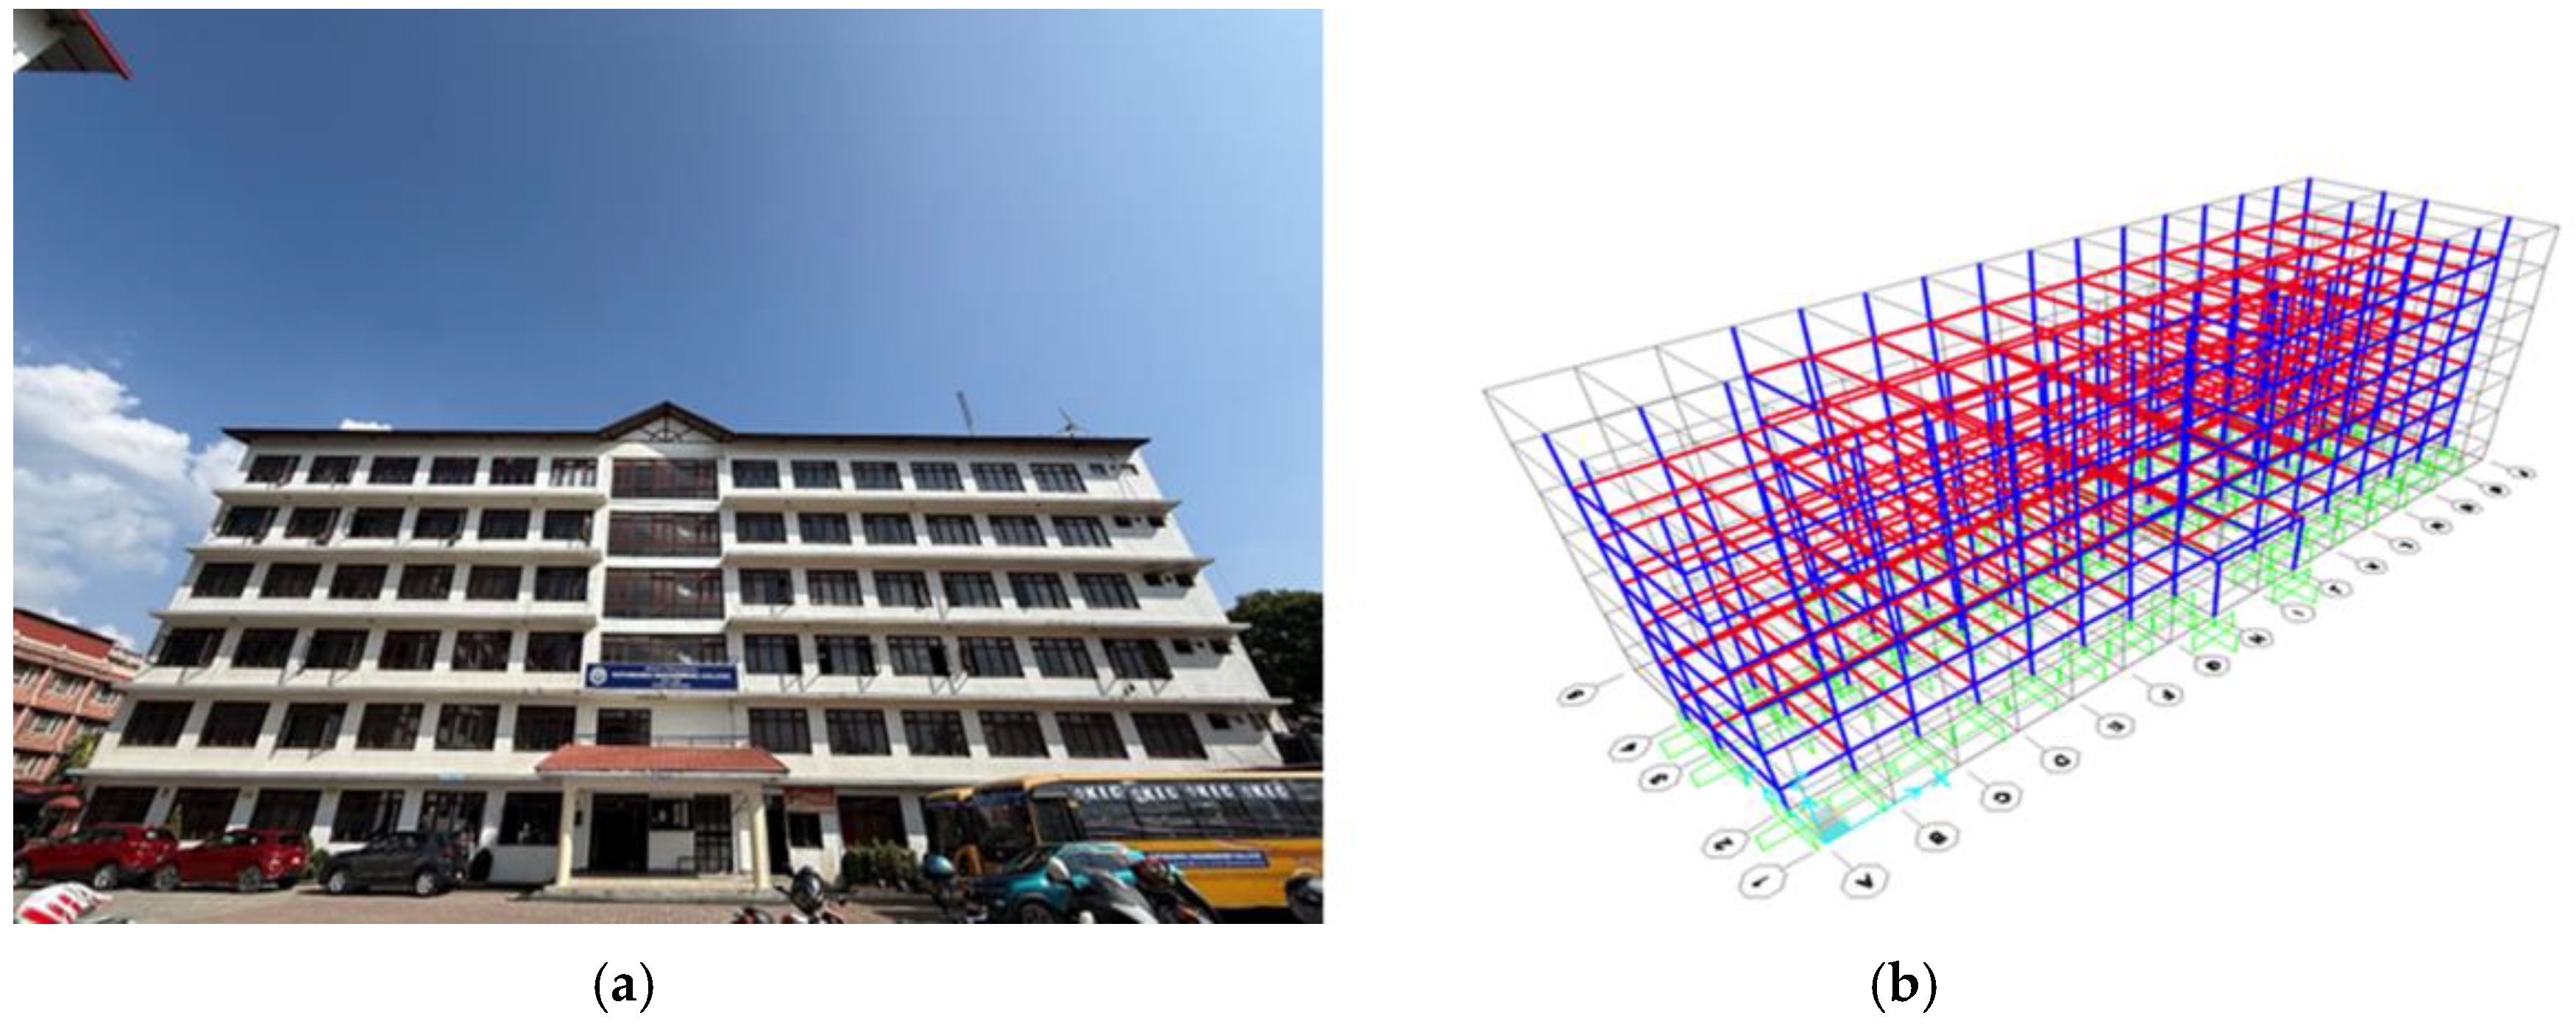
Table 1.
Smartphone IMU Details.
| Description | Device | Sm-S911B/DS |
Iphone 16 Pro Max |
Google Pixel 6a |
Xiaomi Redmi Note 12 |
SM-J730F |
| General | Accelerometer Name, Vendor | LSM6DSO, STMicro | Unknown MEMS, Bosch or STMicro | LSM6DSR, STMicro | icm456xy Accelerometer, TDK-InvenSense | K6DS3TR Accelerometer. STM |
| Footprint | 2.5mm*3mm*0.83mm | Unknown | Unknown | 2.5mm x 3mm x 0.81mm | Unknown | |
| Full-Scale acceleration Range, angular rate range | ±2/±4/±8/±16 g, ±125/±250/±500/±1000/±2000 dps |
Unknown, High-g accelerometer | ±2/±4/±8/±16 g, ±125/±250/±500/±1000/±2000/±4000 dps | Up to ±32 g, Up to ±4000 dps | ±2/±4/±8/±16 g, ±125/± 250/± 500/±1000/±2000 dps |
|
| ODR | 1.6, 12.5, 26, 52, 104, 208, 416, 833, 1666, 3332, 6664 Hz | Unknown | 1.6, 12.5, 26, 52, 104, 208, 416, 833, 1666, 3332, 6664 Hz | Unknown | Up to 1600Hz | |
| Performance | Sensitivity | 0.061 mg/LSB at ±2 g full scale | Unknown | 0.061 mg/LSB at ±2 g full scale | Unknown | Unknown |
| Noise Density | 70 µg/√Hz at ±2 g full scale | Unknown | 60 µg/√Hz at ±2 g full scale | 70 µg/√Hz | Unknown | |
| RMS Noise | 1.8 mg (±2 g) | Unknown | 1.8 mg (±2 g) | Unknown | Unknown |
Table 3.
Modal Periods And Frequencies.
| Mode | Period(s) | Frequency(Hz) |
| 1 | 0.7724 | 1.2947 |
| 2 | 0.7602 | 1.3154 |
| 3 | 0.7320 | 1.3661 |
| 4 | 0.2726 | 3.6680 |
| 5 | 0.2696 | 3.7093 |
| 6 | 0.2586 | 3.8667 |
| 7 | 0.2523 | 3.9627 |
| 8 | 0.2408 | 4.1520 |
| 9 | 0.2399 | 4.1676 |
| 10 | 0.2374 | 4.2106 |
| 11 | 0.2358 | 4.2407 |
| 12 | 0.2344 | 4.2668 |
Table 4.
Modal Load Participation Ratios.
| Output Case | Item Type | Item | Static (%) | Dynamic (%) |
| MODAL | Acceleration | UX | 99.6014 | 98.5744 |
| MODAL | Acceleration | UY | 99.5817 | 91.9926 |
| MODAL | Acceleration | UZ | 0.0274 | 0.0014 |
Disclaimer/Publisher’s Note: The statements, opinions and data contained in all publications are solely those of the individual author(s) and contributor(s) and not of MDPI and/or the editor(s). MDPI and/or the editor(s) disclaim responsibility for any injury to people or property resulting from any ideas, methods, instructions or products referred to in the content. |
© 2025 by the authors. Licensee MDPI, Basel, Switzerland. This article is an open access article distributed under the terms and conditions of the Creative Commons Attribution (CC BY) license (http://creativecommons.org/licenses/by/4.0/).
Copyright: This open access article is published under a Creative Commons CC BY 4.0 license, which permit the free download, distribution, and reuse, provided that the author and preprint are cited in any reuse.


