Submitted:
08 July 2025
Posted:
08 July 2025
You are already at the latest version
Abstract
Cannabidiol (CBD), a phytocannabinoid derived from Cannabis sativa, has demonstrated therapeutic potential across various diseases, including cancer. This study evaluates the cytotoxic effects of CBD on three human cancer cell lines (HeLa, MDA-MB-231, and CaCo-2) and two non-cancerous cell lines (HaCaT and HUVEC) used as a control. Cells were treated with CBD at concentrations of 5, 10, and 20 µM for 24, 48, 72, and 96 h. Cytotoxicity was assessed using MTT assays, nuclear morphology was evaluated via DAPI staining, and cell death mechanisms were analyzed through flow cytometry with apoptosis/necrosis markers. The LC50 values at 24 h were determined as follows: HeLa (9.4 µM), MDA-MB-231 (10.3 µM), and CaCo-2 (4.3 µM). CBD treatment induced morphological changes characteristic of cell stress and death in cancer cells, observed by optical microscopy after 24, 48, 72, and 96 h of exposure. These findings highlight the potential of CBD as an adjunctive therapeutic agent for cancer treatment versus non-malignant cells.
Keywords:
Cannabidiol (CBD)
; phytocannabinoids
; citotoxicity
; apoptosis
; cancer cell lines
; LC50
1. Introduction
Cancer is one of the leading causes of mortality worldwide, posing a significant burden on public health and healthcare systems. According to the World Health Organization (WHO), over 19.2 million new cases and approximately 9.9 million cancer-related deaths were reported in 2020 [1]. Characterized by uncontrolled cell proliferation and the ability to invade surrounding tissues, cancer presents a highly complex therapeutic challenge. While conventional treatments, including surgery, radiotherapy, and chemotherapy, have demonstrated efficacy in targeting tumor cells, they are often associated with adverse side effects such as anemia, nausea, vomiting, and severe fatigue, significantly compromising patients’ quality of life [2].
Cannabidiol (CBD), a non-psychoactive phytocannabinoid derived from Cannabis sativa, has gained attention for its therapeutic potential. It exhibits analgesic, anti-inflammatory, antioxidant, and neuroprotective properties [3,4]. In addition, recent research has suggested that CBD has anticancer potential, by inducing molecular mechanisms associated with cell death in breast cancer cells MDA-MB-231, MCF-7, SK-BR-3, and ZR-75-1 [5], as well as in ER-positive, well-differentiated, T-47D and the triple negative, poor differentiated, MDA-MB-231 cells. In both cell lines, CBD inhibited cell survival and induced apoptosis dose-dependent observed by MTT assay, morphological changes, DNA fragmentation, and ELISA apoptosis assay [6]. These effects are thought to be mediated through the endocannabinoid system (ECS), a regulatory complex involving cannabinoid receptors (CB1 and CB2), transient receptor potential channels, and lipid ligands [7].
Despite its promising potential in oncology, CBD’s effects appear to vary depending on cell type, tumor line, concentration, and exposure time [8]. This variability underscores the need for further research to delineate its mechanisms of action and therapeutic applicability. In this study, we evaluated the cytotoxic effects and mechanisms of cell death induced by CBD in three human cancer cell lines (HeLa, MDA-MB-231, and CaCo-2) and two non-cancerous control lines (HaCaT and HUVEC), aiming to explore its potential as an adjunctive therapeutic agent in cancer treatment.
2. Results
2.1. CBD Induces Morphological Changes in Cancer Cells
The cytotoxic effects and morphological changes induced by CBD were evaluated in HaCaT, HUVEC, HeLa, MDA-MB-231, and CaCo-2 cell lines through optical microscopy. Cells were treated with CBD at concentrations of 5, 10, and 20 μM, as well as controls, for 24, 48, 72, and 96 h. Representative photomicrographs are shown in the corresponding figures.
In HaCaT cells treated for 24 h (Figure 1), a reduction in cell confluence was observed at 5 μM, accompanied by morphological alterations such as cell rounding, shrinkage, and loss of adhesion. These effects intensified with higher CBD concentrations (10 and 20 μM), leading to decreased cell confluence and morphological features indicative of stress and cell death. Nevertheless, some cells retained their typical morphology. In comparison, cells treated with vincristine exhibited pronounced changes, including cell rounding, shrinkage, and widespread loss of adhesion.
At 48 h, CBD treatment led to pronounced cytotoxic effects at all tested concentrations, with notable morphological changes associated with stress and cell death. Similarly, vincristine treatment caused cell rounding, shrinkage, poor adhesion, and the presence of cells in suspension.
After 72 h of treatment, HaCaT cells displayed a near-complete loss of adhesion across all CBD concentrations, a characteristic consistent with cell death. Similar effects were observed with vincristine treatment. These findings persisted at 96 h, where cells exposed to CBD and vincristine continued to exhibit the morphological changes observed at earlier time points, suggesting a cumulative cytotoxic effect.
CBD treatment induced morphological changes consistent with cellular stress and death in HeLa cells, as observed by optical microscopy at 24, 48, 72, and 96 h of exposure. At 24 h, a reduction in cell confluence was evident at 5 μM, accompanied by cell rounding, shrinkage, and loss of adhesion (Figure 2). These effects were more pronounced at 10 and 20 μM, where nearly all cells exhibited morphologies associated with cell death. Similarly, vincristine treatment caused a marked decrease in confluence and the formation of cell clusters, producing effects comparable to those observed with higher CBD concentrations.
After 48 h of exposure, the cytotoxic effects of CBD intensified. At 10 and 20 μM, most cells were observed in suspension, indicative of severe loss of adhesion. Although some cells treated with 5 μM retained their typical morphology, a noticeable decrease in confluence was observed compared to the controls.
At 72 h, cells exposed to 5 μM of CBD displayed persistent shrinkage, rounding, and cluster formation, whereas treatment with 10 and 20 μM resulted in nearly complete loss of adherence, with cells predominantly in suspension. Vincristine produced similar effects, underscoring the ability of CBD to induce morphological changes characteristic of programmed cell death.
By 96 h, cells treated with 5 μM demonstrated partial resistance, maintaining some cells with typical morphology and showing only a moderate reduction in confluence. However, at 10 and 20 μM, as well as with vincristine, cytotoxic effects remained pronounced, with cells largely in suspension and exhibiting morphologies indicative of cell damage. Similar results in HaCat cells were observed in the HUVEC non-tumor cell line (data not shown).
CBD treatment induced morphological changes characteristic of cell stress and death in MDA-MB-231 cells, observed by optical microscopy after 24, 48, 72, and 96 h of exposure. After 24 h, changes such as shrinkage, rounding, and loss of cell adhesion were identified with an increase in the number of cells in suspension, especially starting at 5 μM (Figure 3). Although some cells retained their normal shape, concentrations of 10 μM intensified the effect with more cells in suspension. At 20 μM and with vincristine, the morphological changes were similar, highlighting shrinkage, cell rounding, and the formation of cell clusters associated with stress and cell death.
After 48 h of exposure, the effects of CBD on the MDA-MB-231 line were evident. At 5 μM, cell shrinkage, rounding, cluster formation, and loss of adhesion were observed, accompanied by an increase in cells in suspension. Concentrations of 10 μM produced a similar effect, while 20 μM and vincristine showed effects consistent with those obtained at 24 h, including a significant decrease in cell confluence.
At 72 h, concentrations of 5 and 10 μM demonstrated a decrease in cell confluence, although some cells retained their typical morphology, indicating some resistance to treatment. However, exposures to 20 μM and vincristine resulted in predominantly round, clustered, and suspended cells, reflecting a severe cytotoxic effect.
Finally, after 96 h of treatment, the 5 and 10 μM concentrations showed a decrease in cell confluence, with evidence of stress and cell death, although cells with typical morphology were still observed in a smaller proportion. The 20 μM concentrations and vincristine presented effects similar to those observed at 72 h, with an almost total loss of cell adherence and morphology.
CaCo-2 cell cultures exposed to different concentrations of CBD for 24 h demonstrated decreased cell confluence and morphological changes only at 10 and 20 μM, as well as in the positive control with vincristine (Figure 4). At 10 μM, intracytoplasmic vesicles were observed adjacent to the nucleus without significant alterations in overall cell morphology. In contrast, exposure to 20 μM resulted in cell shrinkage, rounding, and loss of adherence, indicative of cellular stress and death. Vincristine induced heterogeneous changes, ranging from light-refracting dead cells in suspension to cells with preserved morphology.
After 48 h, a decrease in cell confluence was observed starting at 5 μM, accompanied by the formation of intracytoplasmic vesicles. At 10 μM, vesicle size increased, and apoptotic bodies and nuclear fragmentation were evident. Rounded cells with loss of adherence were also identified. At 20 μM, the cytotoxic effect was pronounced, with a marked reduction in cell confluence and the presence of suspended debris. Cells treated with vincristine exhibited decreased cell junctions and morphological changes indicative of stress, along with scarce debris in suspension.
By 72 h, cells treated with 5 μM CBD exhibited partial recovery of their typical morphology. However, concentrations of 10 and 20 μM caused shrinkage, rounding, and loss of adherence. Cells exposed to vincristine displayed more aberrant changes, though some cell adherence was retained. Shrinkage and rounding were observed in certain cases.
Finally, after 96 h of exposure, cells treated with 5 μM CBD retained their morphology, suggesting resistance to the treatment. In contrast, at 10 and 20 μM, the cytotoxic effects were evident, with a loss of adherence and morphological changes associated with cellular stress. Vincristine treatment resulted in approximately 60% of cells showing alterations characteristic of stress and cell death.
2.2. CBD Decreases Nuclear Fluorescence Intensity in Cancer Cells
Cell viability in CBD-stimulated cells was evaluated by measuring the fluorescence emitted by nuclei stained with the nuclear marker DAPI. This analysis enabled a correlation between fluorescence intensity and the results obtained from the MTT assay.
In the HaCaT cell line, a progressive decrease in nuclear fluorescence was observed with increasing CBD concentrations after 24 h of exposure (Figure 5). This effect became more pronounced after 48, 72, and 96 h (data not shown), respectively. At 10 and 20 μM, cells exhibited less defined nuclei with reduced fluorescence intensity. Similarly, cells treated with vincristine showed significant reductions in fluorescence within the first 24 h. These results were similar to those observed in the HUVEC cells (data not shown).
HeLa cells displayed a comparable pattern of decreased nuclear fluorescence. At 24 h, cells treated with 5 μM showed a moderate reduction in fluorescence, while 10 and 20 μM treatments resulted in more pronounced attenuation and fragmented nuclei. It is possible to observe reduction in cell volume, marginalization of nuclear chromatin, as well as fragmentation of the nucleus and appearance of apoptotic bodies (Figure 6). These effects were progressively exacerbated at 48, 72, and 96 h, with a clear dose-dependent correlation between CBD concentration and reduced fluorescence intensity.
The response in the MDA-MB-231 cell line was initially more variable. After 24 h, cells exposed to 5 and 10 μM showed a slight reduction in nuclear fluorescence, whereas 20 μM and vincristine resulted in a notable decrease. Over time, these effects intensified, as reflected in Figures 26, 27, and 28, where fragmented nuclei and low fluorescence intensity became predominant at higher concentrations.
CaCo-2 cells exhibited a marked initial sensitivity to CBD. At 24 h, treatments with 10 and 20 μM significantly decreased nuclear fluorescence, with nuclei displaying intracytoplasmic vesicles. This effect persisted with longer exposure times (48, 72, and 96 h, where the dose-dependent effects of CBD became evident). Quantitative analyses of fluorescence intensity across all cell lines and exposure times are presented in Figure 7A, highlights cell line-specific responses.
2.3. CBD Induces an Alteration of Metabolism in Cancer Cells
The metabolic effects of CBD on cancer cells were assessed using the MTT assay, which quantifies metabolic activity as an indicator of cell viability. The results are presented in Figure 7B corresponding to different exposure times: 24 h, 48 h, 72 h, and 96 h.
After 24 h of exposure, HeLa cells exhibited a significant decrease in viability starting at 10 μM, reflecting high sensitivity to CBD. MDA-MB-231 cells showed a reduction in viability only at the highest concentration (20 μM), indicating initial resistance. CaCo-2 cells, in contrast, displayed significant sensitivity across all tested concentrations, while HaCaT and HUVEC cells demonstrated a moderate response without notable changes in viability.
At 48 h, HeLa cells maintained their marked sensitivity, with significant reductions in viability at all concentrations except 5 μM. MDA-MB-231 cells began to show a concentration-dependent cytotoxic response, with viability decreasing significantly at 10 and 20 μM. Interestingly, CaCo-2 cells displayed emerging resistance, with smaller reductions in viability compared to earlier exposure times. HaCaT cells continued to exhibit minimal sensitivity during this period.
By 72 h, HeLa cells retained their high sensitivity, showing pronounced viability reductions even at lower concentrations of CBD. MDA-MB-231 cells demonstrated limited sensitivity, with significant viability reductions observed only at 20 μM. CaCo-2 cells showed sustained resistance, suggesting possible adaptive mechanisms. HaCaT cells, however, began to display significant sensitivity, particularly at 10 and 20 μM.
Finally, after 96 h of exposure, HeLa cells continued to exhibit high sensitivity, with significant reductions in viability across all concentrations. MDA-MB-231 cells showed increased sensitivity at 10 and 20 μM, indicating a cumulative cytotoxic effect. CaCo-2 cells maintained their resistance, with higher viabilities compared to the other cell lines. HaCaT and HUVEC cells, despite being non-cancerous, demonstrated a marked decrease in viability, indicating a cytotoxic effect associated with prolonged exposure and higher doses.
These findings emphasize the variability in the response of different cell lines to CBD. HeLa and CaCo-2 cells were most sensitive to treatment during early stages, whereas MDA-MB-231 and HaCaT cells exhibited relative resistance, which evolved over longer exposure times. This differential sensitivity underscores the importance of considering the unique characteristics of each cell type when evaluating the therapeutic potential of CBD.
2.4. CBD Decreases Cell Viability in Cancer Cells
The MTT assay was used to assess cell viability in HaCaT, HUVEC, HeLa, MDA-MB-231, and CaCo-2 cell lines following exposure to various concentrations of CBD (5, 10, and 20 μM) and controls for 24, 48, 72, and 96 h. The results, presented in Figure 7B, underscore the differential sensitivity of the cell lines and the dose- and time-dependent effects of CBD.
In HeLa and HUVEC cells, a significant reduction in cell viability was observed starting at 10 μM after 24 h of exposure. This effect persisted and intensified over time, with more pronounced decreases at 72 and 96 h. In contrast, MDA-MB-231 cells exhibited greater initial resistance, with a notable reduction in viability observed only at 20 μM during the first 24 h. However, prolonged exposure (72 and 96 h) increased their susceptibility, confirming a dose- and time-dependent response.
CaCo-2 cells demonstrated high initial sensitivity, with significant viability reductions even at the lowest concentration (5 μM) after 24 h. Interestingly, these cells exhibited progressive resistance during longer exposures, particularly at 72 and 96 h. This shift suggests the activation of adaptive mechanisms to counteract the cytotoxic effects of CBD.
HaCaT and HUVEC cells, serving as a non-cancerous control, showed minimal sensitivity to CBD during shorter exposures. However, at 72 and 96 h, a substantial decrease in viability was observed, particularly at 10 and 20 μM, highlighting the potential for long-term effects of CBD even in non-malignant cells.
These findings emphasize the heterogeneity in the cellular responses to CBD, which can be attributed to intrinsic differences in metabolism and resistance mechanisms among cell lines. While the results support the potential of CBD as a selective therapeutic agent, they also stress the necessity of optimizing treatment parameters, such as dose and exposure duration, tailored to the characteristics of the target cells (Figure 7).
2.5. Determination of the Median Inhibitory Dose (LC50) of CBD in Cancer Cell Lines
The MTT assay results facilitated the calculation of the LC50 values for each cell line at different exposure times (Figure 7C). These values highlight the varying sensitivity of the tested cell lines to CBD over time.
HaCaT cells, and the HUVEC line as non-cancerous lines, demonstrated progressive sensitivity to CBD, with LC50 values decreasing significantly as exposure times increased, reaching their lowest value (0.183 μM) for the HaCat line and (0.268 μM) for the HUVEC line at 96 h. This indicates a cumulative cytotoxic effect of CBD on this line with prolonged treatment. HeLa cells exhibited high sensitivity to CBD, with an initial LC50 of 9.495 μM at 24 h, which further decreased to approximately 5.5 μM at longer exposure times. This trend suggests that the susceptibility of HeLa cells to CBD intensified with extended exposure. MDA-MB-231 cells, characterized by their intrinsic resistance to various treatments, presented relatively stable LC50 values, ranging between 9 and 10 μM across all exposure times. This stability reflects a resistance mechanism that remains consistent despite prolonged CBD exposure.
In contrast, CaCo-2 cells were the most sensitive at shorter times, with an initial LC50 of 4.34 μM at 24 hours. However, a slight increase in LC50 values at extended exposure times suggests the activation of adaptive resistance mechanisms within this cell line (Figure 7C).
The summarized data in Table 1 reinforce these findings, emphasizing the differential responses of each cell line to CBD and the importance of considering both time and cell type when evaluating CBD’s therapeutic potential.
2.6. Type of Cell Death Induced by CBD
The type of cell death induced by CBD was evaluated using a commercial apoptosis/necrosis detection kit (Abcam, cat. ab176749) and analyzed through flow cytometry. Representative dot plots for the HaCaT, HeLa, MDA-MB-231, and CaCo-2 cell lines are displayed in Figure 8.
In HaCaT cells, CBD primarily induced early and late apoptosis, with minimal levels of necrosis even at the highest concentrations tested. This pattern indicates a preference for programmed cell death pathways in non-cancerous cells under CBD treatment. HeLa cells exhibited a similar response, with significant increases in both early and late apoptosis observed from 5 μM. The apoptotic effect intensified with higher concentrations, while necrosis levels remained low, reinforcing the pro-apoptotic activity of CBD in this cell line. In MDA-MB-231 cells, the response to CBD was more heterogeneous. Initial resistance was observed at lower concentrations, with a notable transition to late apoptosis at higher concentrations, indicating a concentration-dependent apoptotic effect in this triple-negative breast cancer cell line. CaCo-2 cells demonstrated high sensitivity to CBD, with a predominance of early and late apoptosis across all concentrations tested. This response highlights the susceptibility of this colorectal cancer cell line to CBD-induced programmed cell death.
The quantitative analysis of cell viability, apoptosis, and necrosis for each treatment is summarized in Table 2. These findings underscore the ability of CBD to selectively induce apoptosis in cancer cell lines while maintaining minimal necrotic activity, supporting its potential as a therapeutic agent.
3. Discussion
The findings of this study confirm the potential of CBD as a selective cytotoxic agent against cancer cells, with a limited impact on non-malignant cells like HaCaT. These results align with previous research demonstrating that CBD can induce apoptosis and cellular stress in various cancer types, including cervical, breast, and colorectal adenocarcinomas [5,6].
Morphological changes observed under optical microscopy included membrane contraction, cell rounding, loss of adhesion, vesicle formation, and surface protrusions—hallmarks of cellular stress and apoptosis. These findings corroborate earlier reports in HeLa [9] and MDA-MB-231 cells [6]. For CaCo-2 cells, although CBD-induced cytotoxicity has been documented [10, 11], this is the first report describing such detailed morphological changes. Similarly, HaCaT cells exhibited stress and death-related alterations, but some retained their typical morphology, a phenomenon not previously reported in the literature [12, 13, 14].
The MTT assay revealed variability in CBD sensitivity across the cell lines, as evidenced by differences in LC50 values. CaCo-2 cells demonstrated the highest sensitivity, with an LC50 of 4.34 μM at 24 h, which is lower than previously reported values [10,11]. MDA-MB-231 cells exhibited an LC50 of 10.37 μM, higher than reported in other studies (2.2 μM), likely due to differences in experimental conditions [6]. HeLa cells had an LC50 of 9.49 μM, consistent with findings from Lukhele and Motadi (2016) [15]. Interestingly, HaCaT cells showed significant cytotoxicity at higher CBD concentrations, with an LC50 of 5.23 μM, diverging from earlier studies that reported minimal effects at similar concentrations [12].
Nuclear changes detected by DAPI staining, such as chromatin condensation, nuclear fragmentation, and apoptotic body formation, are characteristic of apoptosis and correlated with reduced fluorescence intensity, reflecting diminished cell viability [16,17]. Similar observations were made in cancer cell lines HeLa [15], MDA-MB-231 [18], and CaCo-2 [19], while in HaCaT cells, such changes had not been previously reported in the context of CBD treatment [12,13,14].
The apoptosis/necrosis assay confirmed that CBD predominantly induces apoptosis across all cell lines. In HeLa cells, early apoptosis reached 52.8% at 10 μM, consistent with previous studies [15]. In MDA-MB-231 cells, apoptosis rates were high (82.6% at 5 μM and 81.7% at 10 μM), although not dose-dependent, possibly due to mechanisms like autophagy or bubbling cell death [5, 18]. CaCo-2 cells showed remarkable sensitivity, with 79.1% apoptosis at 5 μM and 87.0% at 10 μM, even at lower concentrations than previously evaluated [19]. HaCaT cells also showed significant levels of apoptosis, but the results differed from earlier findings [13], likely due to experimental variations.
In HaCaT cells, the molecular mechanisms underlying CBD-induced cytotoxicity remain unclear. Evidence suggests that CBD may increase cytosolic calcium levels through activation of TRPV1 receptors [20], which facilitates calcium flux into mitochondria vía VDCA1 receptors. This process could lead to mitochondrial permeability transition pore formation, mitochondrial membrane depolarization, dysfunction, and ultimately, apoptosis [21].
Under stress conditions, such as oxidative stress, autophagy often plays a protective role in maintaining cell homeostasis, for example, CBD induces melanoma cell death by initiating cell autophagy, so it is difficult to observe a direct selectivity between tumor cells and non-malignant cells so that we can consider autophagy as a double-edged sword for cell survival and cell death [22]. Some studies reported the role of CBD in inhibiting NF-κB and in inducing autophagy to protect non-tumor cells, such as SH-SY5Y, from mitochondrial dysfunction [23]. On the other hand, in HUVEC cells CBD induced cytostasis without inducing apoptosis, inhibited migration, invasion, and sprouting of umbilical cells in vitro, and in vivo in matrigel sponges.
These results underscore the potential of CBD as an adjunctive therapy in cancer treatment, particularly for colorectal adenocarcinoma, where it exhibited greater efficacy. However, the variability in responses among cell lines highlights the importance of tailoring CBD-based treatments to the molecular profile of each cancer type. Combining CBD with chemotherapeutic agents could further enhance its efficacy, particularly in resistant lines like MDA-MB-231.
This study’s main limitation is the exclusive use of in vitro models, which limits direct extrapolation to clinical settings. Future research should focus on validating these findings in in vivo models, investigating CBD’s synergistic effects with existing chemotherapeutic agents, and evaluating its activity in complex tumor microenvironments.
4. Material and Methods
4.1. CBD Source and Chemical Characterization
The CBD employed in the present study (1 g, H87 Lote 2347027, Código Comp2) was purchased from Farmacias de Especialidades Dermatológicas de México (FADERMEX.com, Ecatepec de Morelos, Edo de México, México 55090). According to the certificate of analysis (COA) given by the company, chemical characterization analysis revealed the following composition (Table 3).
4.2. Cell Culture
Four cell lines were used: HeLa, MDA-MB-231, CaCo-2, HUVEC, and HaCaT. HeLa cells, derived from human cervical adenocarcinoma, are characterized by rapid proliferation, low p53 expression, and overexpression of cannabidiol receptors. MDA-MB-231 cells, isolated from triple-negative mammary adenocarcinoma, are highly invasive and resistant, with mutations in KRAS and TP53. CaCo-2 cells, derived from colorectal adenocarcinoma, exhibit mutations in APC, β-catenin and TP53, along with overexpression of COX2. HUVEC cells is an endothelial cell line that was isolated from the vein of the umbilical cord which overexpressed vascular endothelial growth factor (VEGF), HaCaT cells, immortalized human keratinocytes, these two lines were included as a non-malignant control for cytotoxicity evaluation.
All cell lines were cultured in Dulbecco’s Modified Eagle Medium (DMEM) supplemented with 10% inactivated fetal bovine serum, 1% penicillin-streptomycin, and 1% glutamine. Cells were incubated at 37°C in a humidified atmosphere containing 5% CO₂. Media were refreshed every two days until cells reached 80% confluence, at which point experiment tests were initiated.
4.3. Cell Viability Assay
Cellular metabolic activity was assessed using the MTT assay (3-[4,5-dimethylthiazol-2-yl]-2,5-diphenyltetrazolium bromide), which measures the reduction of tetrazolium to formazan as an indicator of cell viability. Cells were seeded in 96-well plates at a density of 1 × 10⁴ cells per well and treated with CBD at concentrations of 5, 10, and 20 µM for 24, 48, 72, and 96 h. Control groups included untreated cells (negative control), cells treated with 1 µM vincristine (positive control), and cells exposed to methanol (vehicle control). After incubation, MTT solution (0.5 mg/mL) was added and incubated for 4 hours at 37 °C. The resulting formazan crystals were dissolved in DMSO, and absorbance was measured at 570 nm using a microplate reader. Results were expressed as the percentage of cell viability relative to the negative control, with significant cytotoxicity defined as a ≥30% reduction in cell viability, as per ISO-10993-5-2009 guidelines.
4.4. Nuclear Fragmentation Assay
To investigate nuclear alterations associated with apoptosis, cells were stained with DAPI (4’,6-diamidino-2-phenylindole), which binds specifically to DNA and highlights nuclear morphology [24]. Cells were fixed with 4% paraformaldehyde for 15 minutes at room temperature and permeabilized with 0.1% Triton X-100 for 10 minutes. After staining with DAPI (1 μg/mL) for 15 minutes in darkness, nuclei were visualized using fluorescence microscopy equipped with DAPI-specific filters. Nuclear changes characteristic of apoptosis, such as chromatin condensation and nuclear fragmentation, were analyzed and correlated with cell viability. While these nuclear alterations suggest apoptotic processes, the formation of apoptotic bodies was inferred based on nuclear morphology and further corroborated using complementary flow cytometry assays described below.
4.5. Apoptosis and Necrosis Assay
To complement the analysis of nuclear alterations, cell death mechanisms induced by CBD were assessed using the Apopxin Green/7-AAD kit. This assay differentiates between early apoptosis, late apoptosis, and necrosis. Treated cells were harvested via gentle trypsinization, washed with cold PBS, and resuspended in binding buffer. Staining was performed according to the manufacturer’s instructions. Samples were analyzed using a BD Accuri C6 Plus flow cytometer, collecting at least 10,000 events per sample. The resulting data provided quantitative insights into the distribution of cells in various stages of apoptosis and necrosis, enabling a comprehensive interpretation of the mechanisms underlying reduced cell viability.
4.6. Statistical Analysis
All experiments were conducted in triplicate, with data expressed as mean ± standard deviation (SD). Group differences were evaluated using one-way analysis of variance (ANOVA) followed by Tukey’s post-hoc test, with significance set at p < 0.05. Logarithmic graphs and median inhibitory concentrations (LC50) were determined using GraphPad Prism 9 software.
5. Conclusions
In the present study, we demonstrated that CBD induces apoptosis in human cancer cells (HeLa, MDA-MB-231, and CaCo-2) while delaying apoptotic processes in non-malignant control cells (HaCaT and HUVEC). These findings underscore the potential of CBD as an adjunctive therapeutic agent for cancer treatment, highlighting its selective cytotoxic effects on malignant cells with limited impact on non-malignant cells.
Understanding that the exclusive use of CBD would not be enough to treat or eliminate cancer cells, the combination with agents or in antitumor therapies can be an excel-lent adjuvant and show a synergistic action, likewise, it has clinical benefits such as anti-inflammatory, antioxidant, antiemetic, appetite stimulant activity that can be favorable in the control of such signs associated with chemotherapies, improving the quality of life and adverse effects of these antitumor therapies.
Future studies should focus on optimizing CBD dosing and evaluating its efficacy in combination with conventional therapies to maximize its therapeutic potential in clinical oncology. Also, further studies evaluating the effects of CBD over other non-tumor cell lines like HEK-293, 3T3 fibroblast, Vero cells, etc. should be performed.
Author Contributions
C.R. M.-d.-O.-S.; Methodology, software, validation, formal analysis, investigation, data curation, writing—original draft preparation, writing—review and editing, visualization. J.E. P.-M; Methodology, software, validation, formal analysis, investigation, data curation, writing—original draft preparation, writing—review and editing, visualization. G.A. G.-M; Methodology, software, validation, formal analysis, investigation, data curation, writing—review and editing, visualization. L.E. R.-T; Methodology, formal analysis, investigation, resources, data curation, writing—review and editing, visualization, supervision, project administration, funding acquisition. A.M. N.-G; Methodology, formal analysis, investigation, resources, data curation, writing—review and editing, visualization, supervision, project administration, funding acquisition. A.J. G.-A; Methodology, formal analysis, investigation, data curation, writing—review and editing. O.S.-C; Methodology, formal analysis, investigation, resources, data curation, writing—review and editing, visualization, supervision, project administration, funding acquisition. G.H-V; Resources, writing—review and editing, supervision, project administration, funding acquisition. A. S.-D; Conceptualization, methodology, software, validation, formal analysis, investigation, resources, data curation, writing—original draft preparation, writing—review and editing, visualization, supervision, project administration, funding acquisition. U. C.-V.; Conceptualization, methodology, software, validation, formal analysis, investigation, resources, data curation, writing—original draft preparation, writing—review and editing, visualization, supervision, project administration, funding acquisition. All authors have read and agreed to the published version of the manuscript.
Funding
This study was partially supported by the Programa de Apoyo a la Ciencia, Tecnología e Innovación ProACTI 2024 (UANL), Clave No. 29-MCS-2024.
Data Availability Statement
Data are contained within the article.
Acknowledgments
JEPM was a recipient of a scholarship of the CONAHCyT (Consejo Nacional de Humanidades, Ciencias y Tecnologías) México.
Conflicts of Interest
The authors declare no conflicts of interest. The funders had no role in the design of the study, the collection, analyses, or interpretation of data, the writing of the manuscript, or the decision to publish the results.
References
- Globocan (2020) All cancers. Recuperado de https://gco.iarc.fr/today/data/factsheets/cancers/39-All-cancers-fact-sheet-pdf el 12 de abril del 2023.
- National Cancer Institute. (2022). Tipos de tratamiento del cáncer – Recuperado el 4 de diciembre del 2023, de https://www.cancer.gov/espanol/cancer/tratamiento/tipos.
- Atalay, S. , Jarocka-karpowicz, I., & Skrzydlewskas, E. Antioxidative and anti-inflammatory properties of cannabidiol. Antioxidants 2020, 9. [Google Scholar] [CrossRef]
- Baswan, S. M. Baswan, S. M., Klosner, A. E., Glynn, K., Rajgopal, A., Malik, K., Yim, S., & Stern, N. (2020). Therapeutic potential of cannabidiol (CBD) for skin health and disorders. Clinical, Cosmetic and Investigational Dermatology 2020, 13, 927–942. [Google Scholar] [CrossRef] [PubMed]
- Shrivastava, A. , Kuzontkoski, P. M., Groopman, J. E., & Prasad, A. Cannabidiol induces programmed cell death in breast cancer cells by coordinating the cross-talk between apoptosis and autophagy. Molecular Cancer Therapeutics 2011, 10, 1161–1172. [Google Scholar] [CrossRef] [PubMed]
- Sultan, A. S. , Marie, M. A., & Sheweita, S. A. (2018). Novel mechanism of cannabidiol-induced apoptosis in breast cancer cell lines. Breast, 41, 34–41. [CrossRef]
- Di Marzo, V. , & Piscitelli, F. (2015). The Endocannabinoid System and its Modulation by Phytocannabinoids. In Neurotherapeutics (Vol. 12, Issue 4, pp. 692–698). Springer New York LLC. [CrossRef]
- Taylor, A. H. Tortolani, D., Ayakannu, T., Konje, J. C., & Maccarrone, M. (2021). (Endo)cannabinoids and gynaecological cancers. Cancers 2021, 13, 1–22. [Google Scholar] [CrossRef]
- Ramer, R. , Merkord, J., Rohde, H., & Hinz, B. (2010). Cannabidiol inhibits cancer cell invasion via upregulation of tissue inhibitor of matrix metalloproteinases-1. Biochemical Pharmacology, 79(7), 955–966. [CrossRef]
- Aviello, G. , Romano, B., Borrelli, F., Capasso, R., Gallo, L., Piscitelli, F., Di Marzo, V., & Izzo, A. A. (2012). Chemopreventive effect of the non-psychotropic phytocannabinoid cannabidiol on experimental colon cancer. Journal of Molecular Medicine, 90(8), 925–934. [CrossRef]
- Borrelli, F. , Pagano, E., Romano, B., Panzera, S., Maiello, F., Coppola, D., De Petrocellis, L., Buono, L., Orlando, P., & Izzo, A. A. (2014). Colon carcinogenesis is inhibited by the TRPM8 antagonist cannabigerol, a Cannabis-derived non-psychotropic cannabinoid. Carcinogenesis, 35(12), 2787–2797. [CrossRef]
- Petrosino, S. , Verde, R., Vaia, M., Allará, M., Iuvone, T., & Di Marzo, V. (2018). Anti-inflammatory properties of cannabidiol, a nonpsychotropic cannabinoid, in experimental allergic contact dermatitis. Journal of Pharmacology and Experimental Therapeutics, 365(3), 652–663. [CrossRef]
- Sangiovanni, E. Fumagalli, M., Pacchetti, B., Piazza, S., Magnavacca, A., Khalilpour, S., Melzi, G., Martinelli, G., & Dell’Agli, M. (2019). Cannabis sativa L. extract and cannabidiol inhibit in vitro mediators of skin inflammation and wound injury. Phytotherapy Research 2019, 33(8), 2083–2093. [Google Scholar] [CrossRef]
- Li, Y. , Hao, D., Wei, D., Xiao, Y., Liu, L., Li, X., Wang, L., Gan, Y., Yan, W., Ke, B., & Jiang, X. (2022). Photoprotective Effects of Cannabidiol against Ultraviolet-B-Induced DNA Damage and Autophagy in Human Keratinocyte Cells and Mouse Skin Tissue. Molecules, 27(19). [CrossRef]
- Lukhele, S. T. , & Motadi, L. R. (2016). Cannabidiol rather than Cannabis sativa extracts inhibit cell growth and induce apoptosis in cervical cancer cells. BMC Complementary and Alternative Medicine, 16(1). [CrossRef]
- Collins, J. A. , Schandl, C. A., Young, K. K., Vesely, J., & Willingham, M. C. (1997). Major DNA Fragmentation Is a Late Event in Apoptosis. In The Journal of Histochemistry & Cytochemistry (Vol. 45, Issue 7).
- Crowley, L. , Marfell, B., & Waterhouse, N. (2016). Analyzing Cell Death by Nuclear Staining with Hoechst 33342. Cold Spring Harbor Laboratory Press.
- D’Aloia, A. , Ceriani, M., Tisi, R., Stucchi, S., Sacco, E., & Costa, B. (2022). Cannabidiol Antiproliferative Effect in Triple-Negative Breast Cancer MDA-MB-231 Cells Is Modulated by Its Physical State and by IGF-1. International Journal of Molecular Sciences, 23(13). [CrossRef]
- Williams Nkune, N. , Kruger, C. A., & Abrahamse, H. (2022). Oncotarget 156 www.oncotarget.com Synthesis of a novel nanobioconjugate for targeted photodynamic therapy of colon cancer enhanced with cannabidiol. In Oncotarget (Vol. 13). www.oncotarget.
- Almeida, C. F. , Teixeira, N., Correia-Da-silva, G., & Amaral, C. (2022). Cannabinoids in breast cancer: Differential susceptibility according to subtype. In Molecules (Vol. 27, Issue 1). MDPI. [CrossRef]
- Olivas-Aguirre, M. , Torres-López, L., Valle-Reyes, J. S., Hernández-Cruz, A., Pottosin, I., & Dobrovinskaya, O. (2019). Cannabidiol directly targets mitochondria and disturbs calcium homeostasis in acute lymphoblastic leukemia. Cell Death and Disease, 10(10). [CrossRef]
- Jane, L. Armstrong, David S. Hill, Christopher S. McKee, Sonia Hernandez-Tiedra, Mar Lorente, Israel Lopez-Valero, Maria Eleni Anagnostou, Fiyinfoluwa Babatunde, Marco Corazzari, Christopher P.F. Redfern, Guillermo Velasco, Penny E. Lovat,. Exploiting cannabinoid-induced cytotoxic autophagy to drive melanoma cell death. J. Investig. Dermatol. 2015, 135, 1629–1637. [Google Scholar]
- Kang, S. , Li, J., Yao, Z., & Liu, J. (2021). Cannabidiol induces autophagy to protects neural cells from mitochondrial dysfunction by upregulating SIRT1 to inhibits NF-κB and NOTCH pathways. Frontiers in Cellular Neuroscience, 15, 654340.
- Solinas, M. , Massi P., Cantelmo AR., Cattaneo MG., Cammarota R., Bartolini D., Cinquina V., Valenti M., Vicentini LM, Noonan DM., Albini A., Parolaro D. (2012). Cannabidiol inhibits angiogenesis by multiple mechanisms. British journal of pharmacology, 167(6), 1218-1231. [CrossRef]
- Guillén-Meléndez GA, Villa-Cedillo SA, Pérez-Hernández RA, Castillo-Velázquez U, Salas-Treviño D, Saucedo-Cárdenas O, Montes-de-Oca-Luna R, Gómez-Tristán CA, Garza-Arredondo AJ, Zamora-Ávila DE, de Jesús Loera-Arias M, Soto-Domínguez A. (2021). Cytotoxic Effect In Vitro of Acalypha monostachya Extracts over Human Tumor Cell Lines. Plants (Basel). 10(11):2326. [CrossRef] [PubMed] [PubMed Central]
Figure 1.
HaCaT cells treated with CBD and controls for 24, 48, 72, and 96 h. Treatments included CBD at concentrations of 5, 10, and 20 μM, 1 μM vincristine, methanol (vehicle), and culture medium (control). Scale bar: 300 μm.
Figure 1.
HaCaT cells treated with CBD and controls for 24, 48, 72, and 96 h. Treatments included CBD at concentrations of 5, 10, and 20 μM, 1 μM vincristine, methanol (vehicle), and culture medium (control). Scale bar: 300 μm.
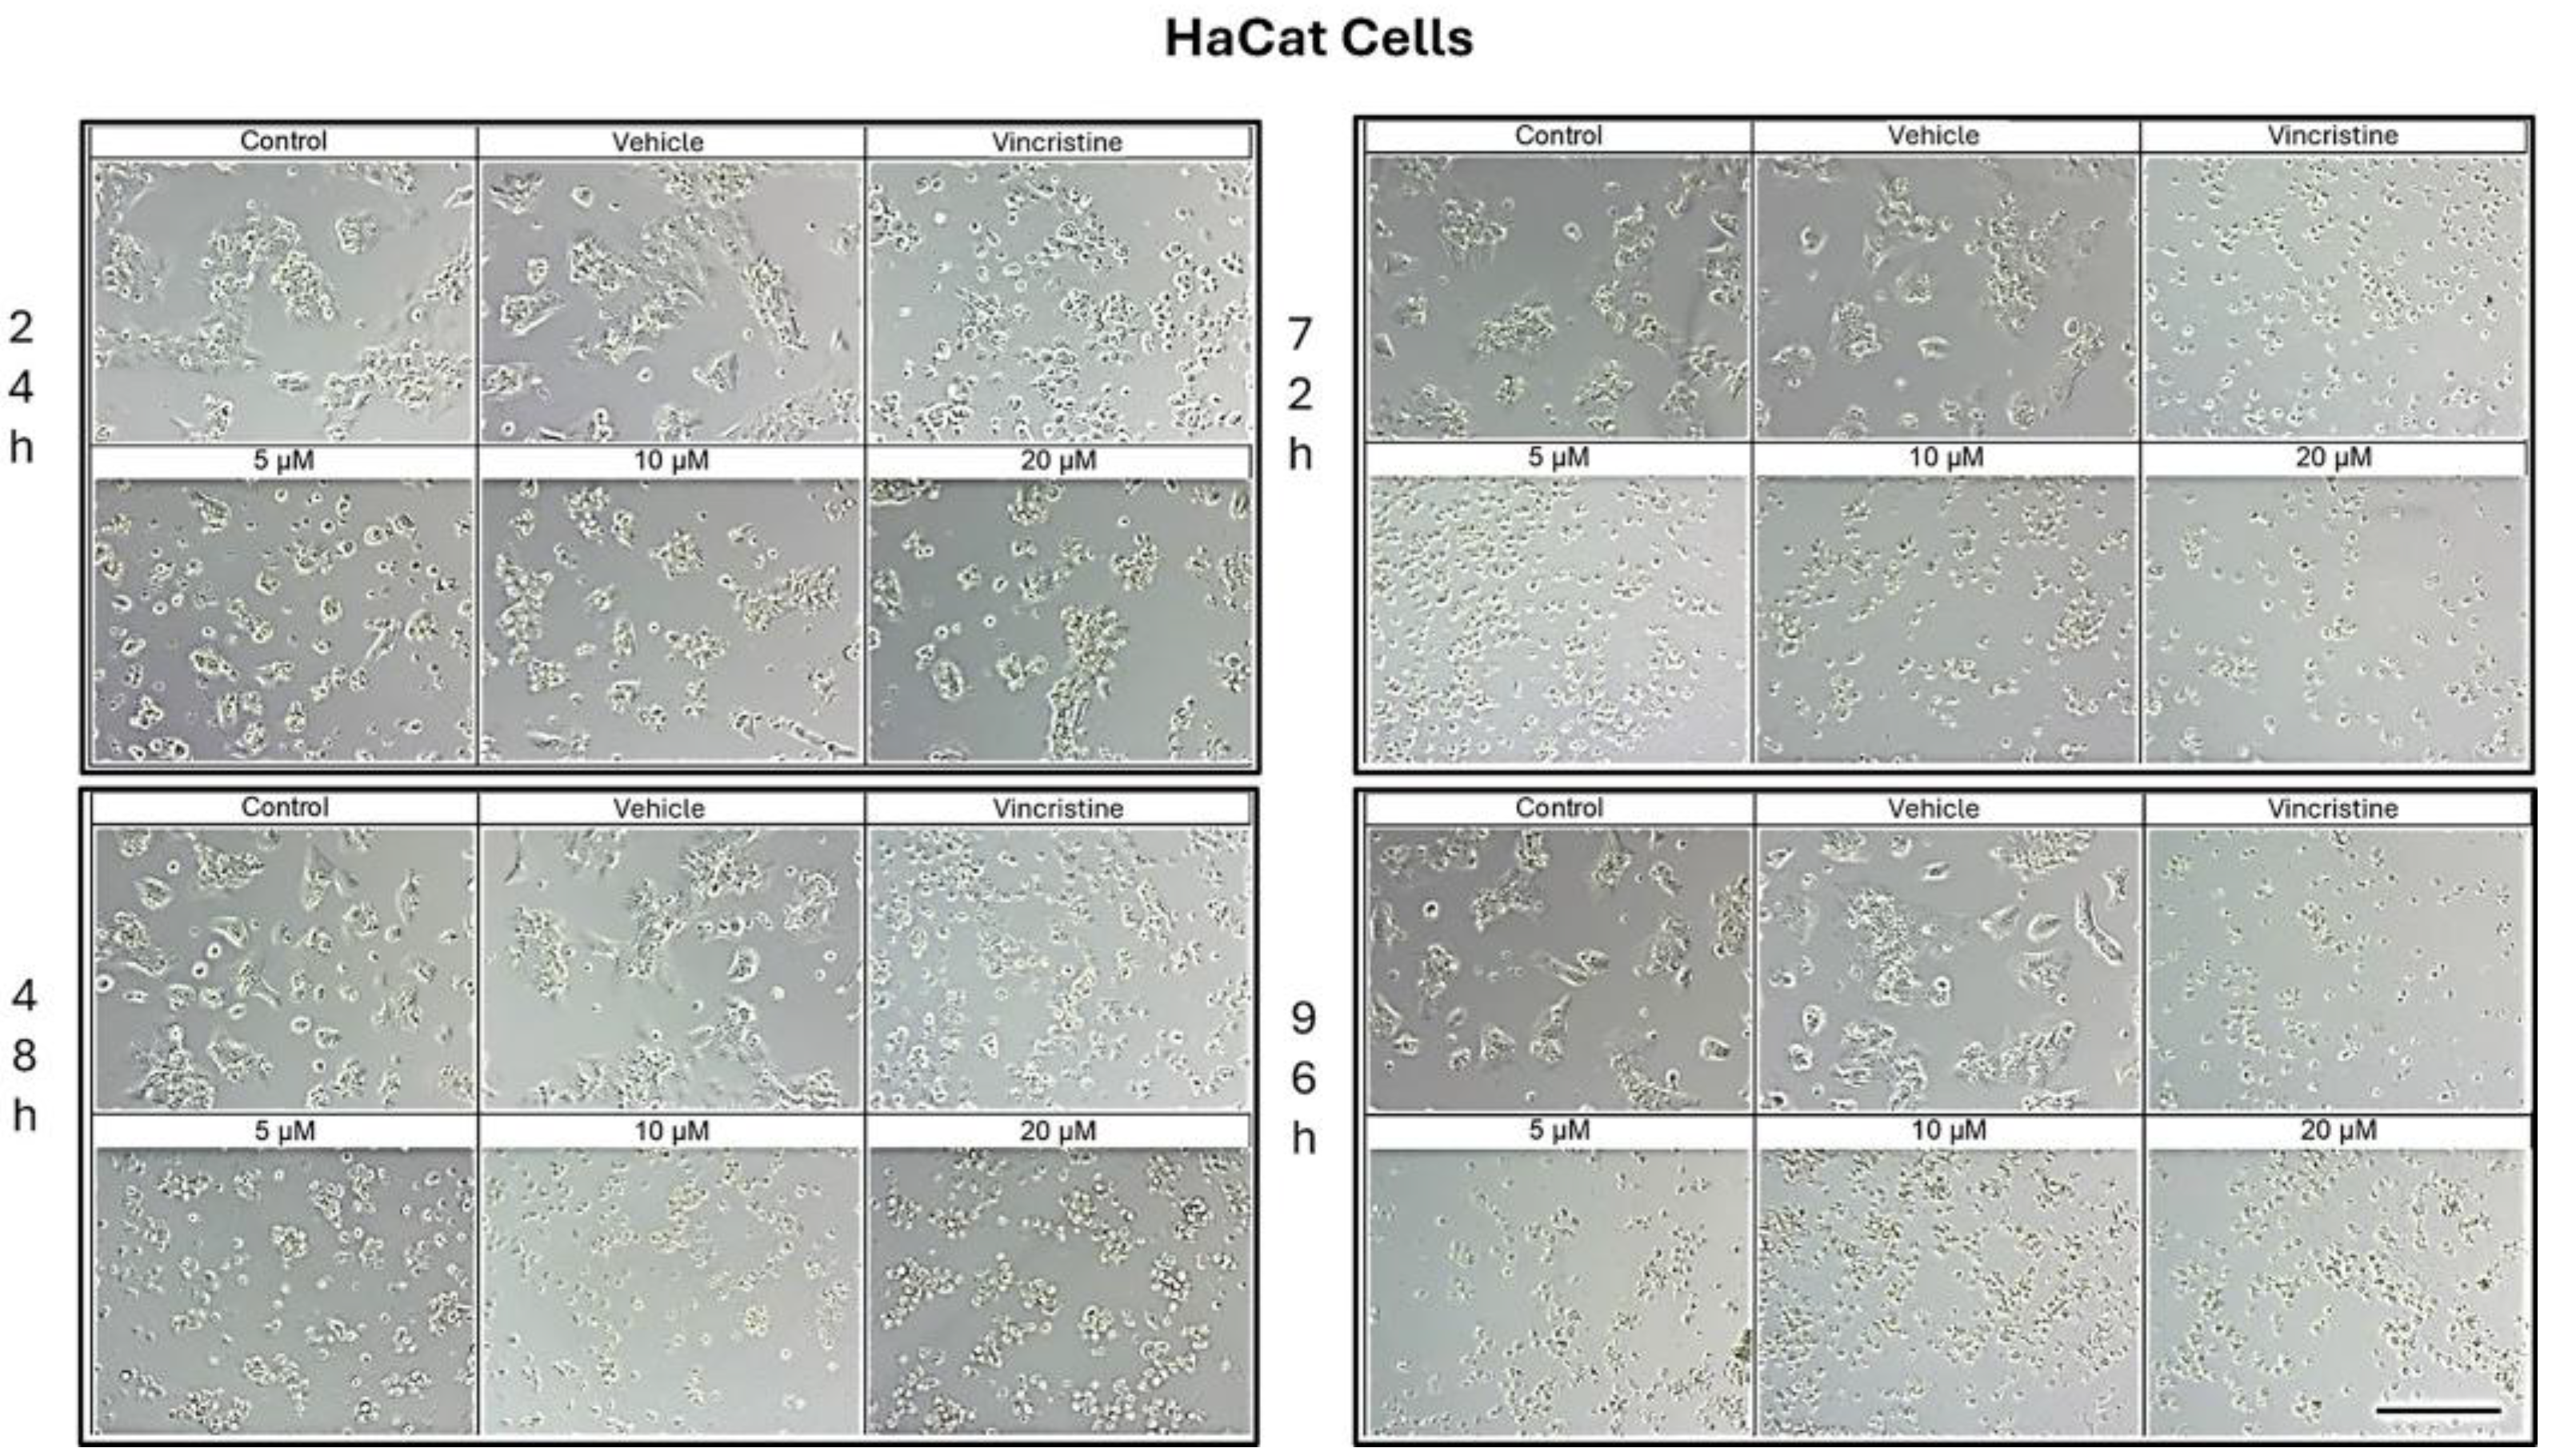
Figure 2.
HeLa cells treated with CBD and controls for 24, 48, 72, and 96 h. Treatments included CBD at concentrations of 5, 10, and 20 μM, 1 μM vincristine, methanol (vehicle), and culture medium (control). Scale bar: 300 μm.
Figure 2.
HeLa cells treated with CBD and controls for 24, 48, 72, and 96 h. Treatments included CBD at concentrations of 5, 10, and 20 μM, 1 μM vincristine, methanol (vehicle), and culture medium (control). Scale bar: 300 μm.
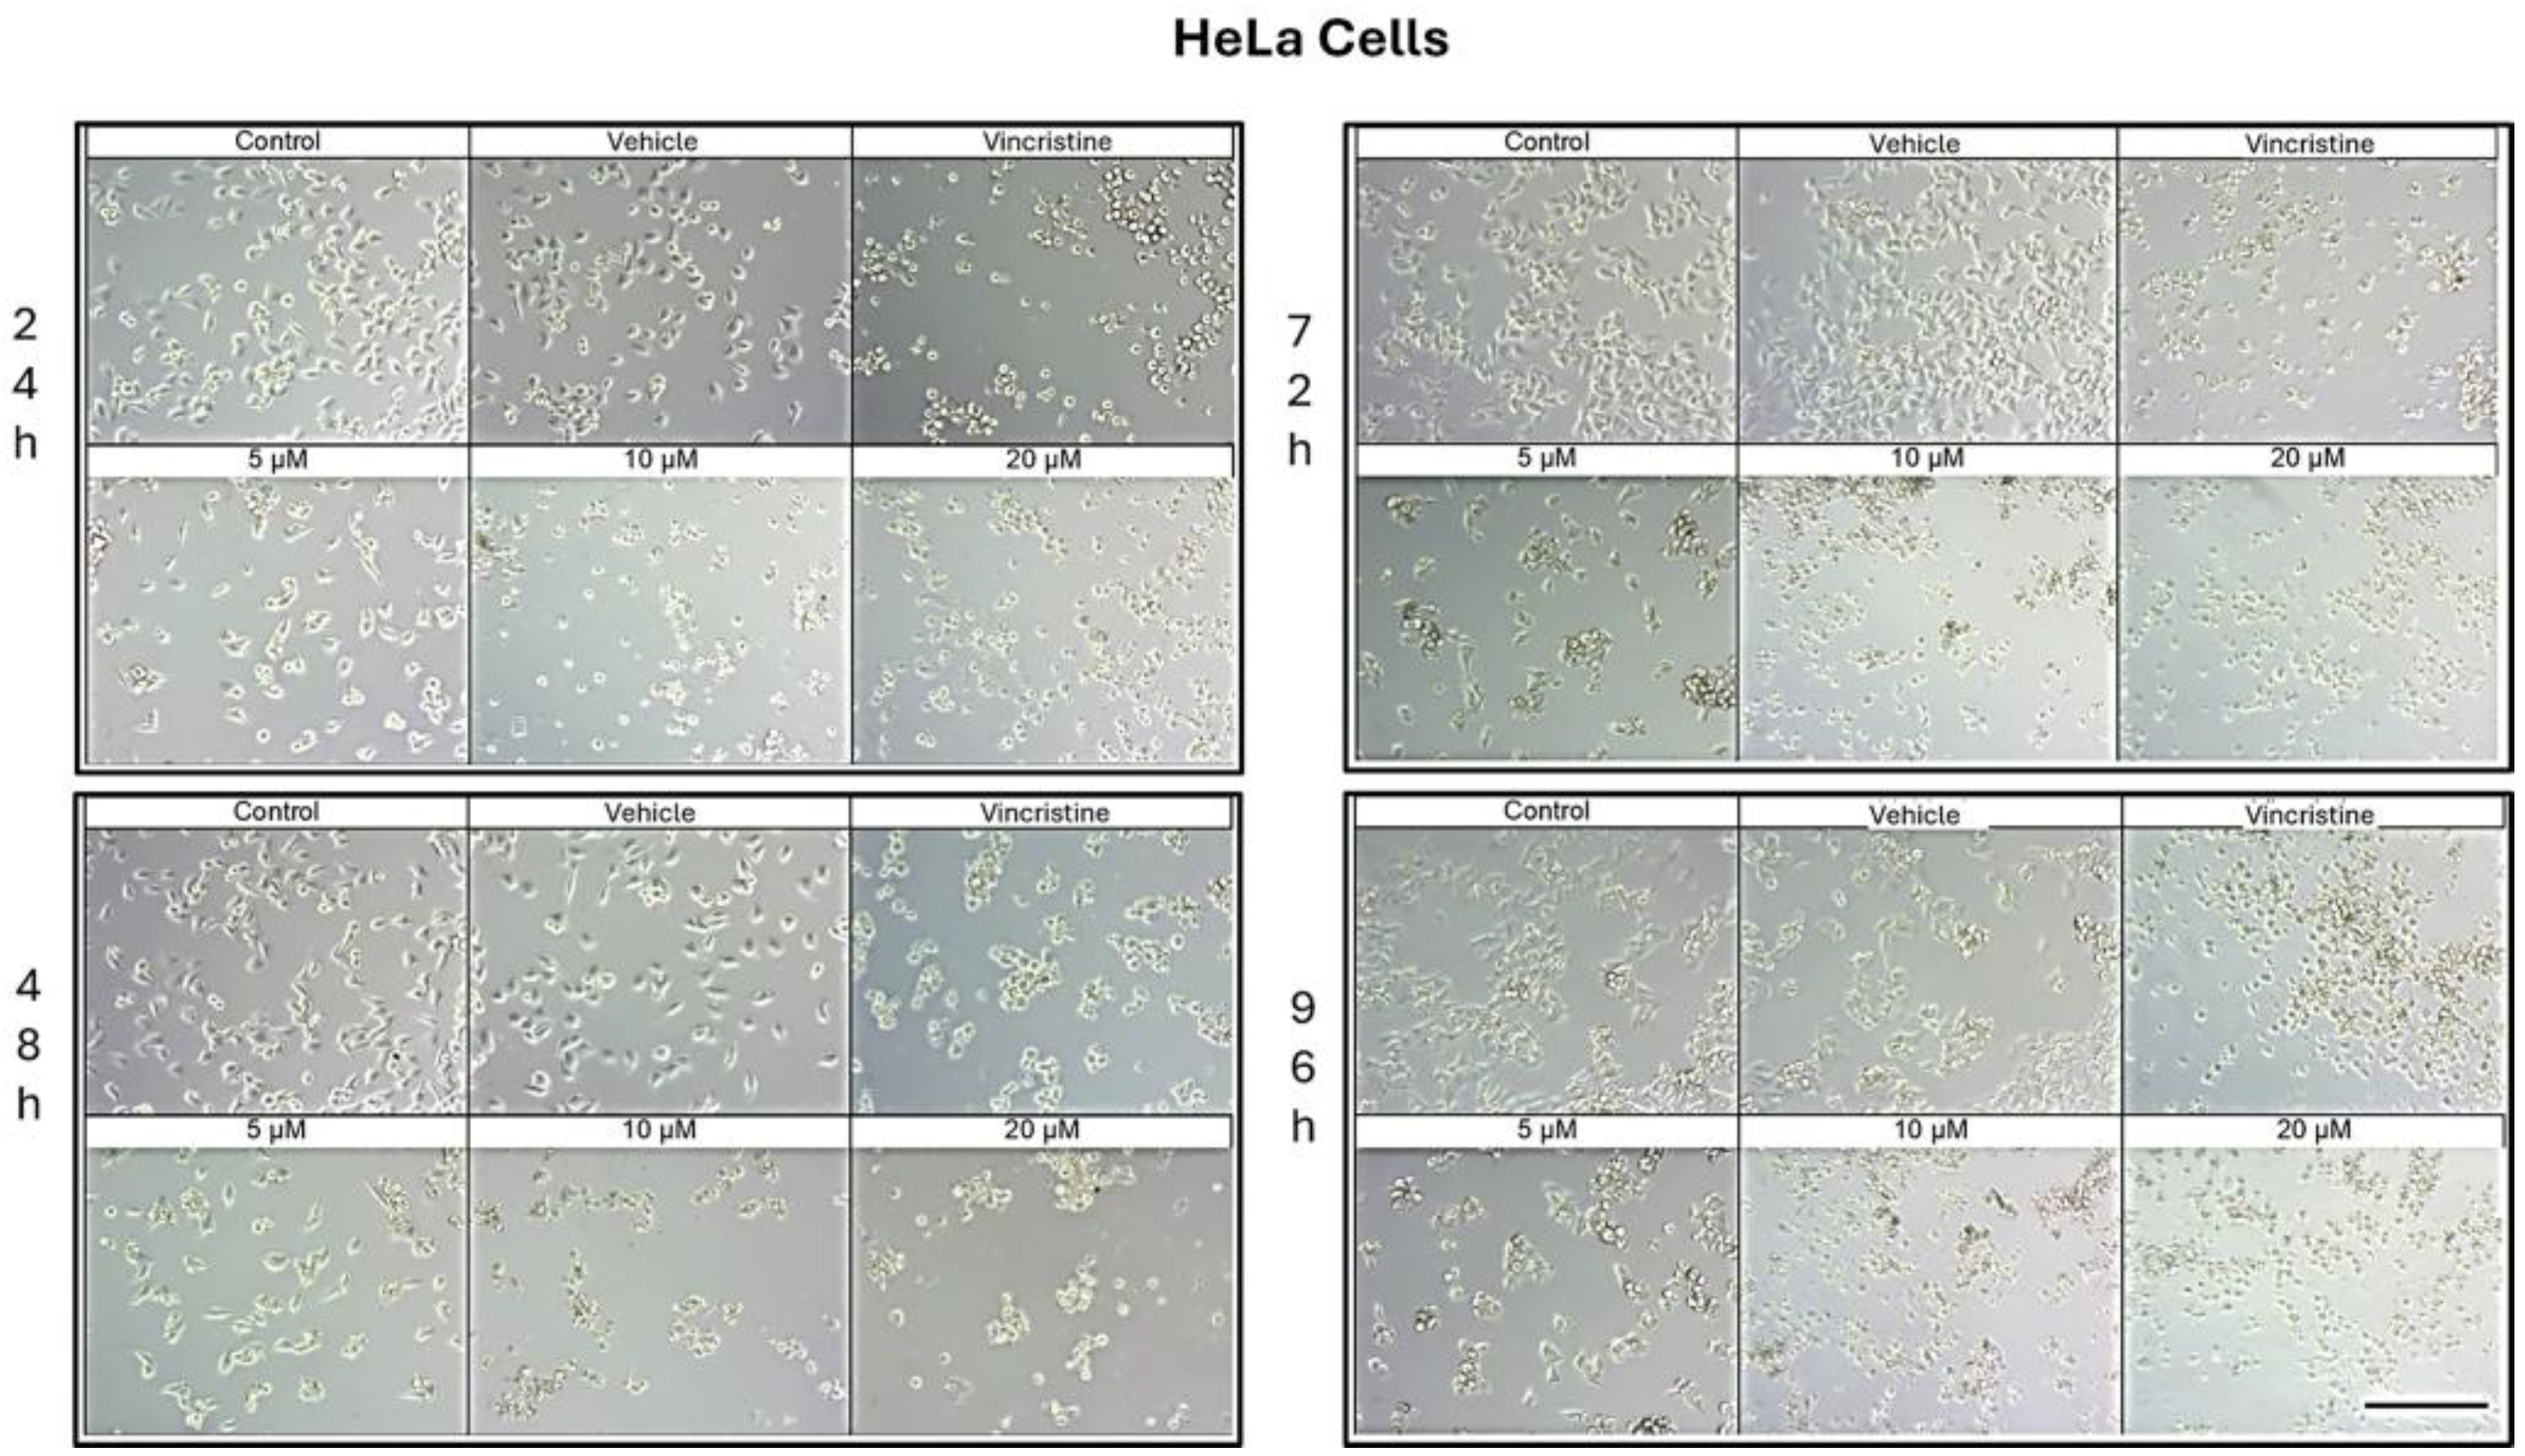
Figure 3.
MDA-MB-231 cells treated with CBD and controls for 24 h. Treatments included CBD at concentrations of 5, 10, and 20 μM, 1 μM vincristine, methanol (vehicle), and culture medium (control). Scale bar: 300 μm.
Figure 3.
MDA-MB-231 cells treated with CBD and controls for 24 h. Treatments included CBD at concentrations of 5, 10, and 20 μM, 1 μM vincristine, methanol (vehicle), and culture medium (control). Scale bar: 300 μm.
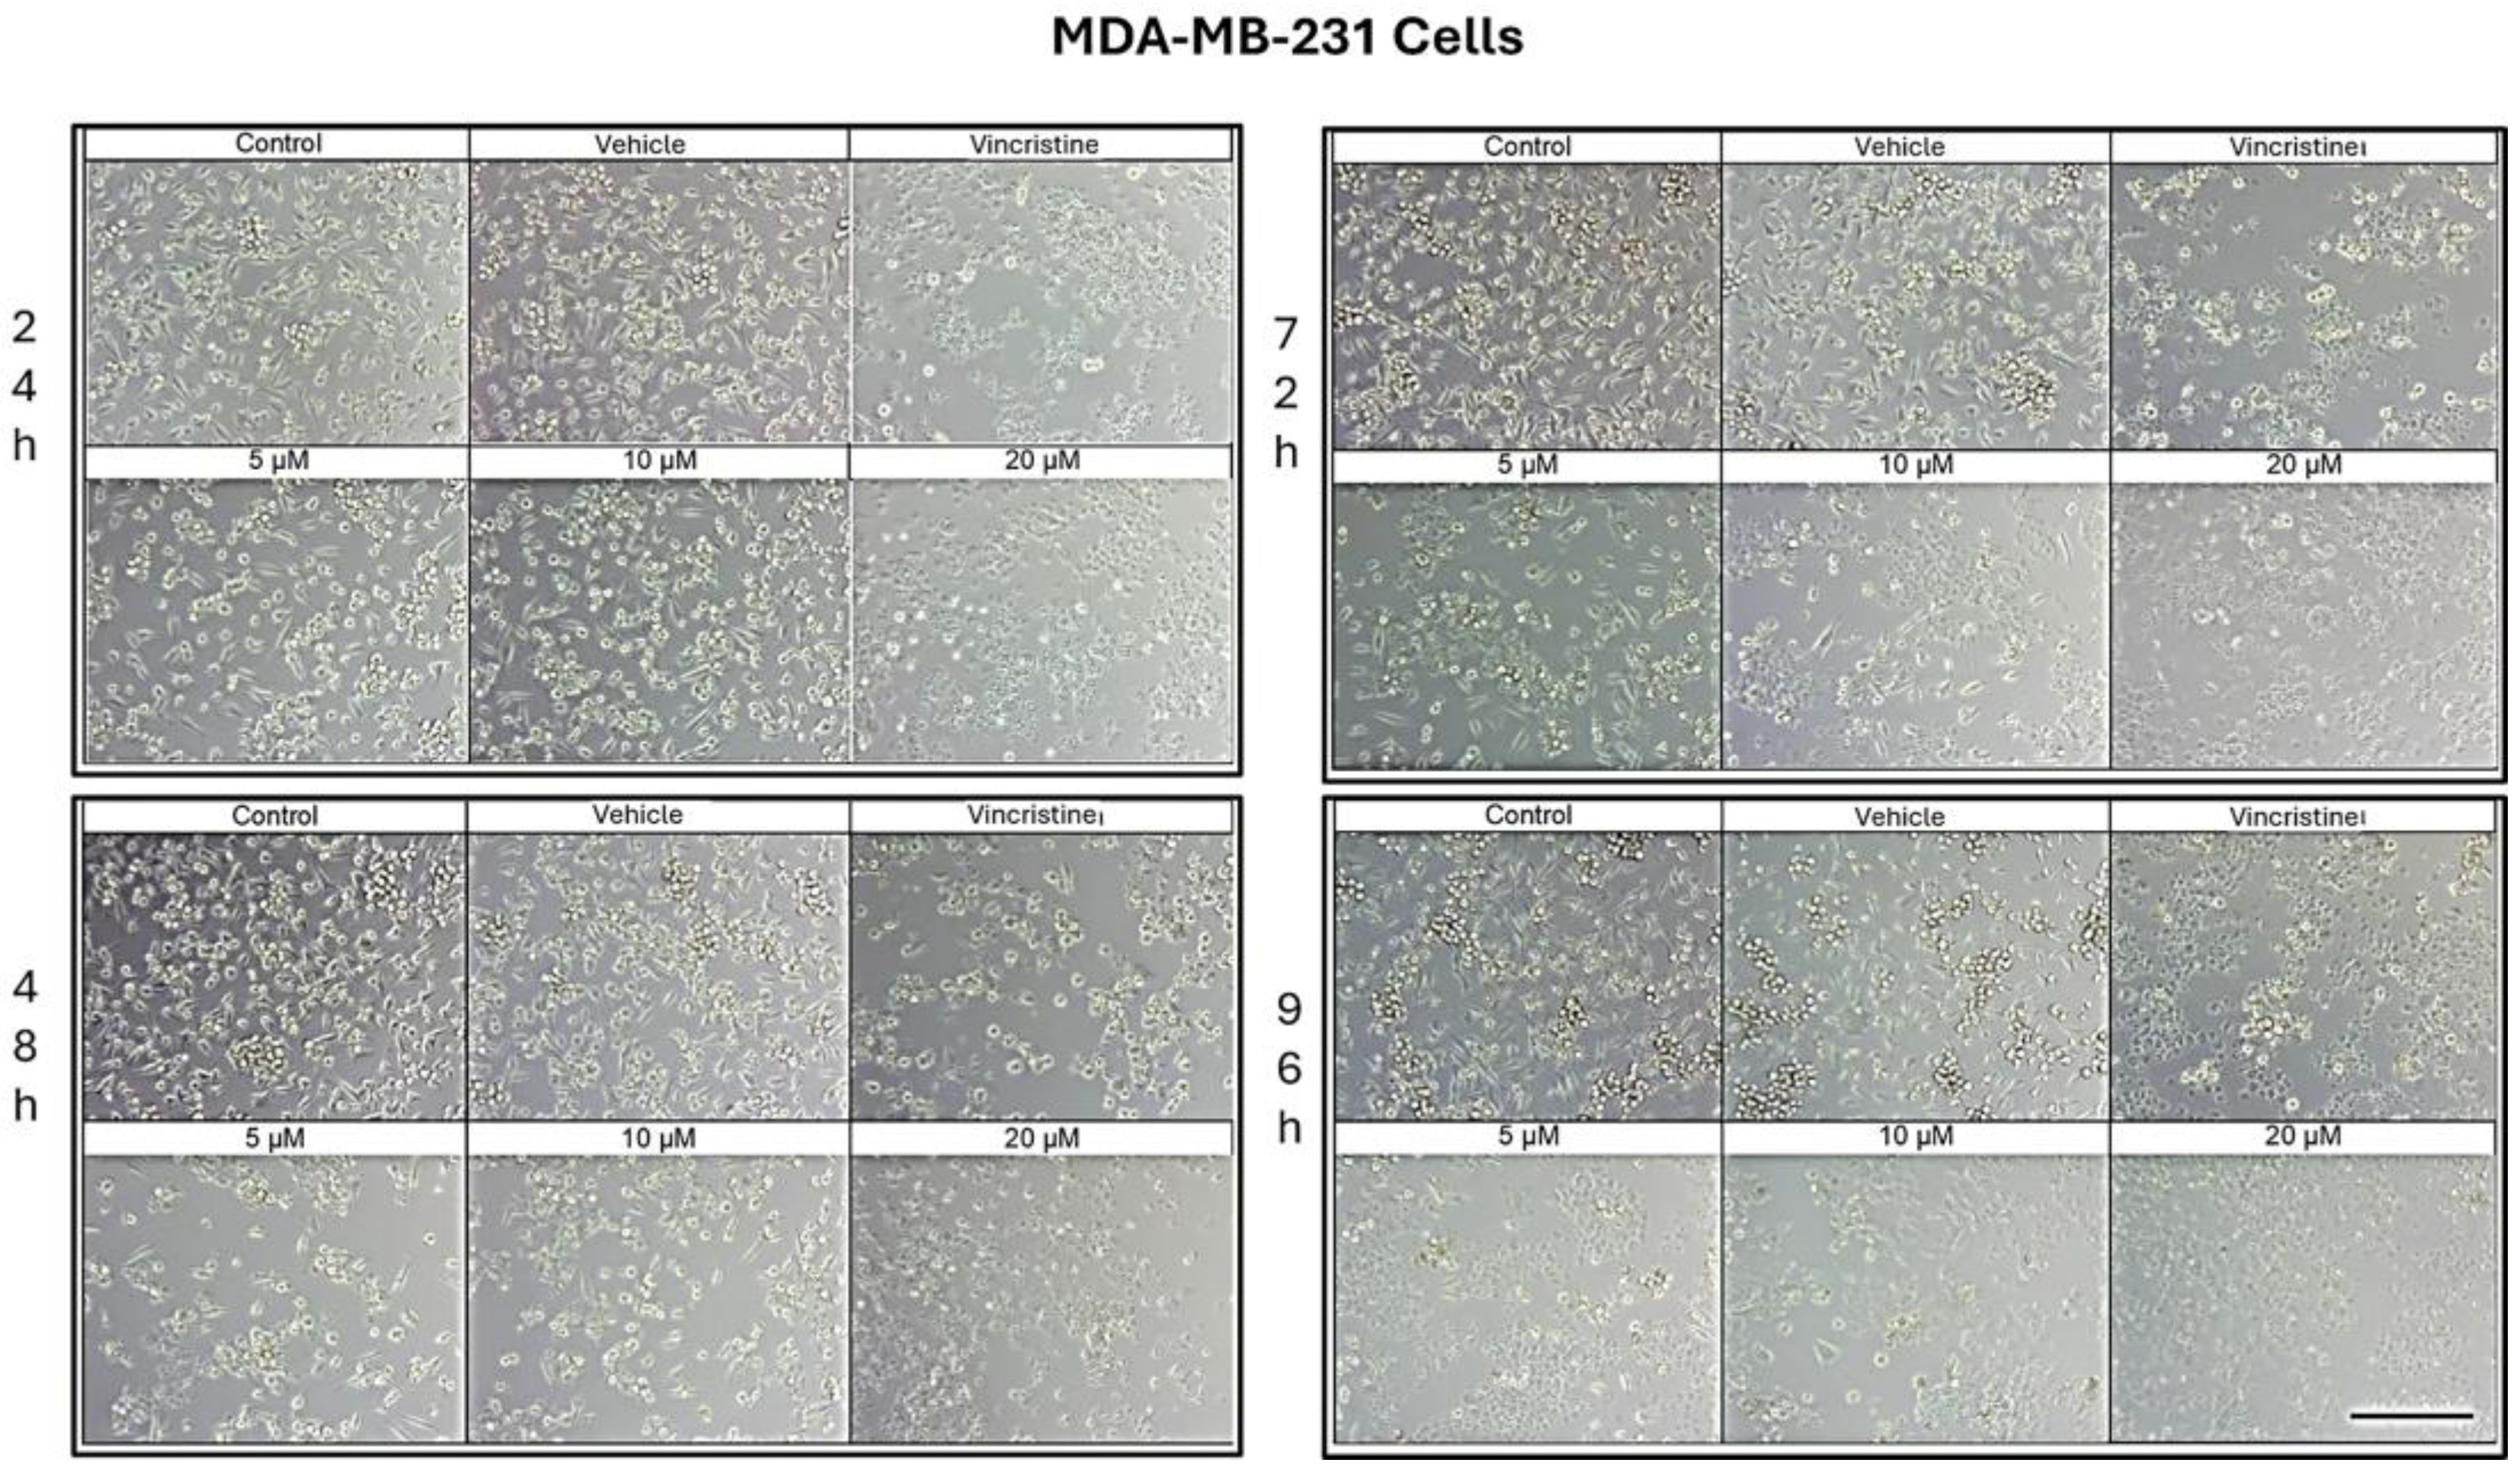
Figure 4.
CaCo-2 cells treated with CBD and controls for 24, 48, 72, and 96 h. Treatments included CBD at concentrations of 5, 10, and 20 μM, 1 μM vincristine, methanol (vehicle), and culture medium (control). Scale bar: 300 μm.
Figure 4.
CaCo-2 cells treated with CBD and controls for 24, 48, 72, and 96 h. Treatments included CBD at concentrations of 5, 10, and 20 μM, 1 μM vincristine, methanol (vehicle), and culture medium (control). Scale bar: 300 μm.
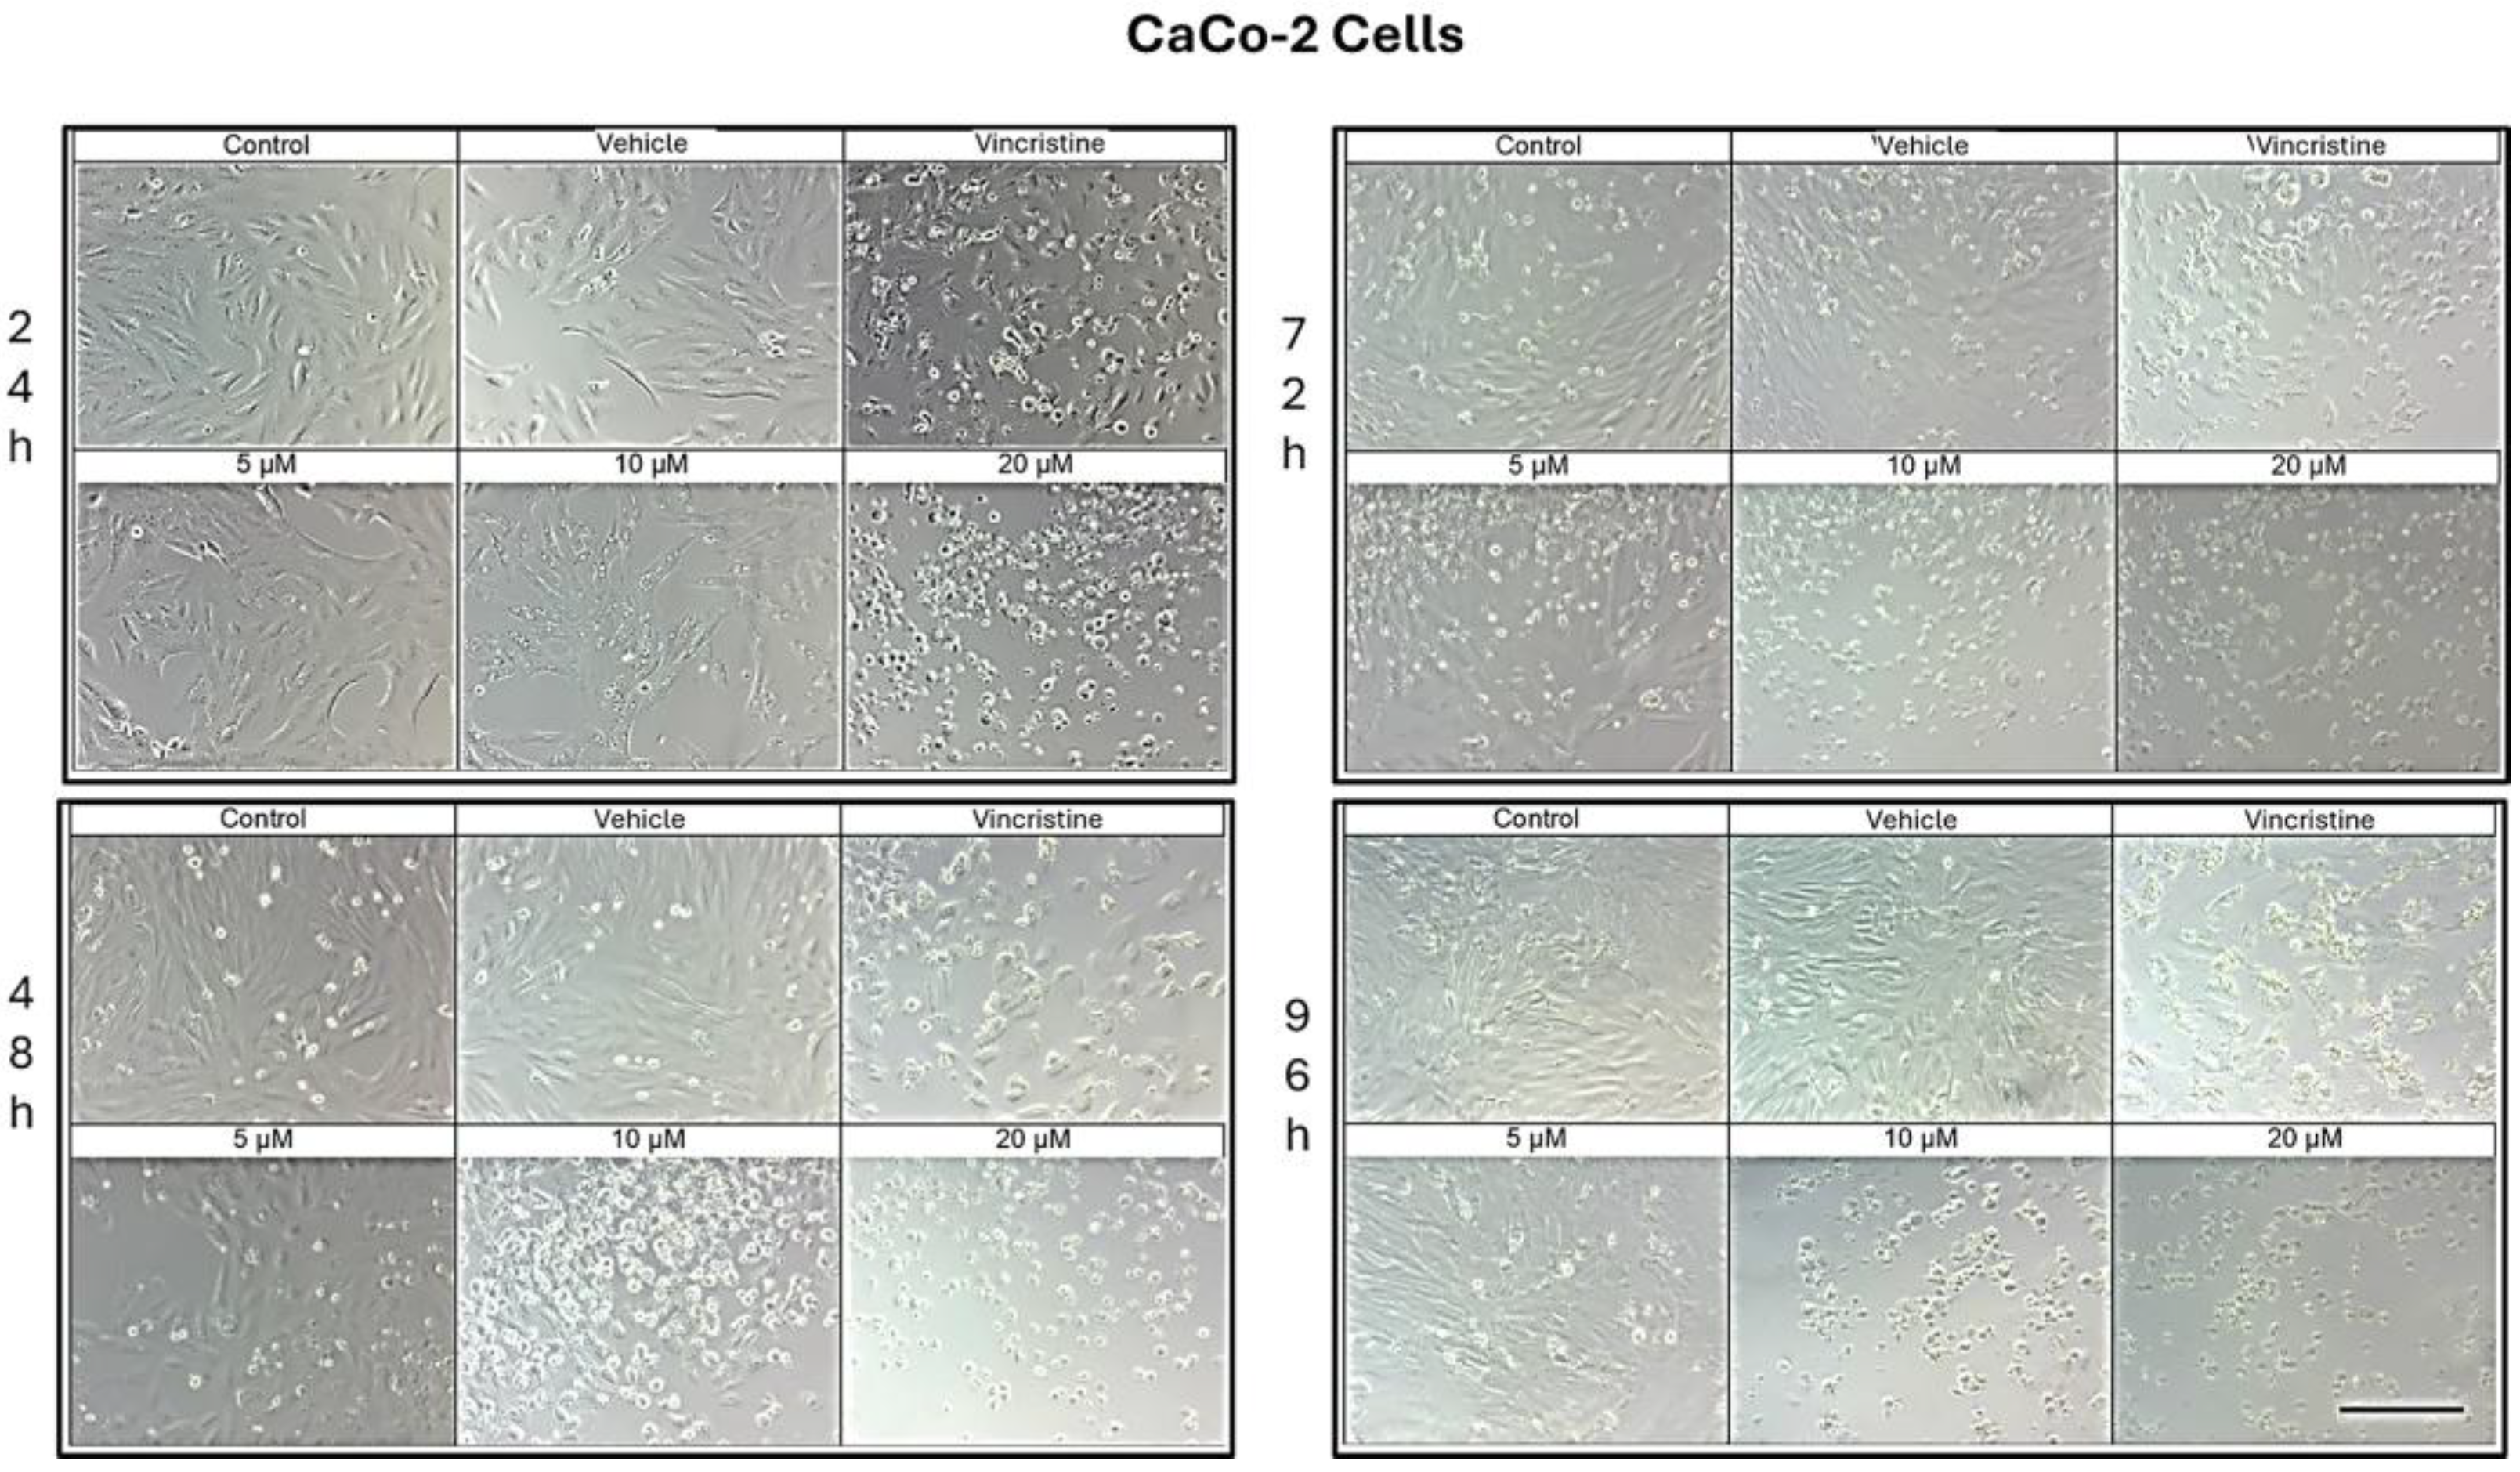
Figure 5.
DAPI fluorescence in HaCaT, HeLa, MDA-MB-231, and CaCo-2 cell lines treated for 24 h with different concentrations of CBD and controls. Treatments included 5, 10, and 20 μM of CBD, 1 μM of vincristine (positive control), methanol (vehicle), and culture medium (control). Scale bar: 50 μm.
Figure 5.
DAPI fluorescence in HaCaT, HeLa, MDA-MB-231, and CaCo-2 cell lines treated for 24 h with different concentrations of CBD and controls. Treatments included 5, 10, and 20 μM of CBD, 1 μM of vincristine (positive control), methanol (vehicle), and culture medium (control). Scale bar: 50 μm.
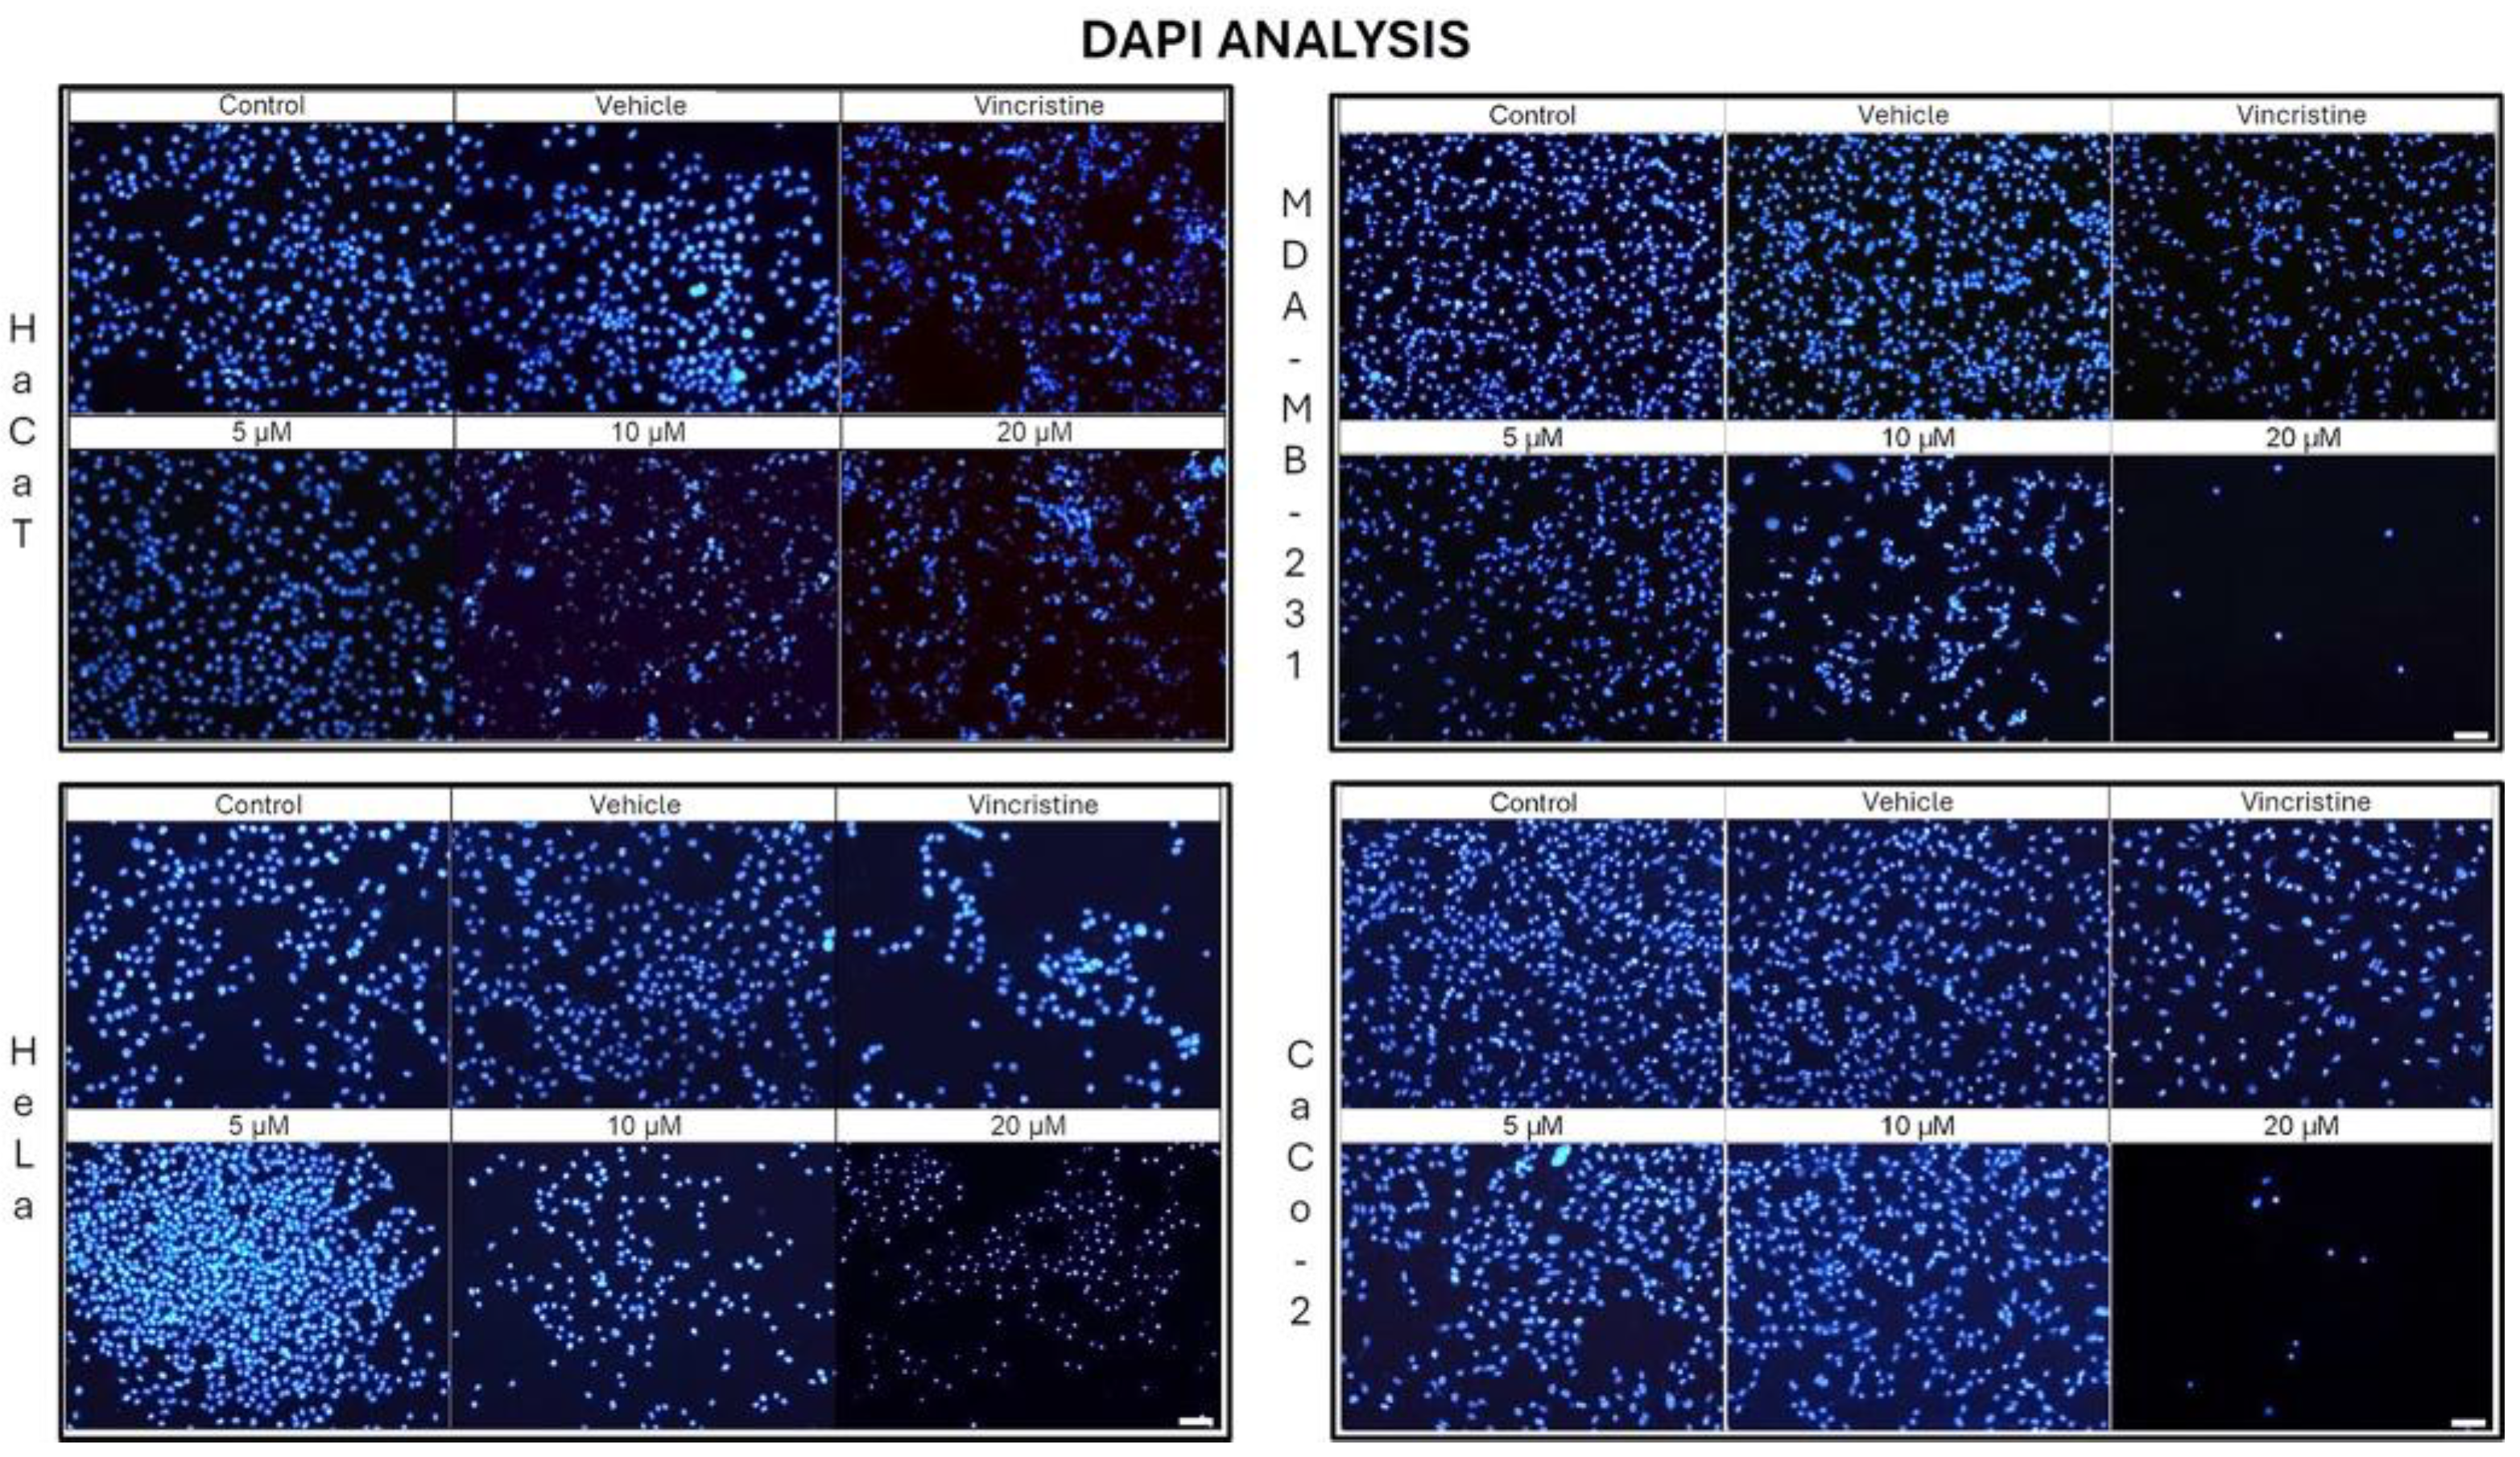
Figure 6.
DAPI fluorescence in HeLa cell line treated for 24 h with different concentrations of CBD and controls. Treatments included 5, 10, and 20 μM of CBD and culture medium (control). Scale bar: 10 μm.
Figure 6.
DAPI fluorescence in HeLa cell line treated for 24 h with different concentrations of CBD and controls. Treatments included 5, 10, and 20 μM of CBD and culture medium (control). Scale bar: 10 μm.
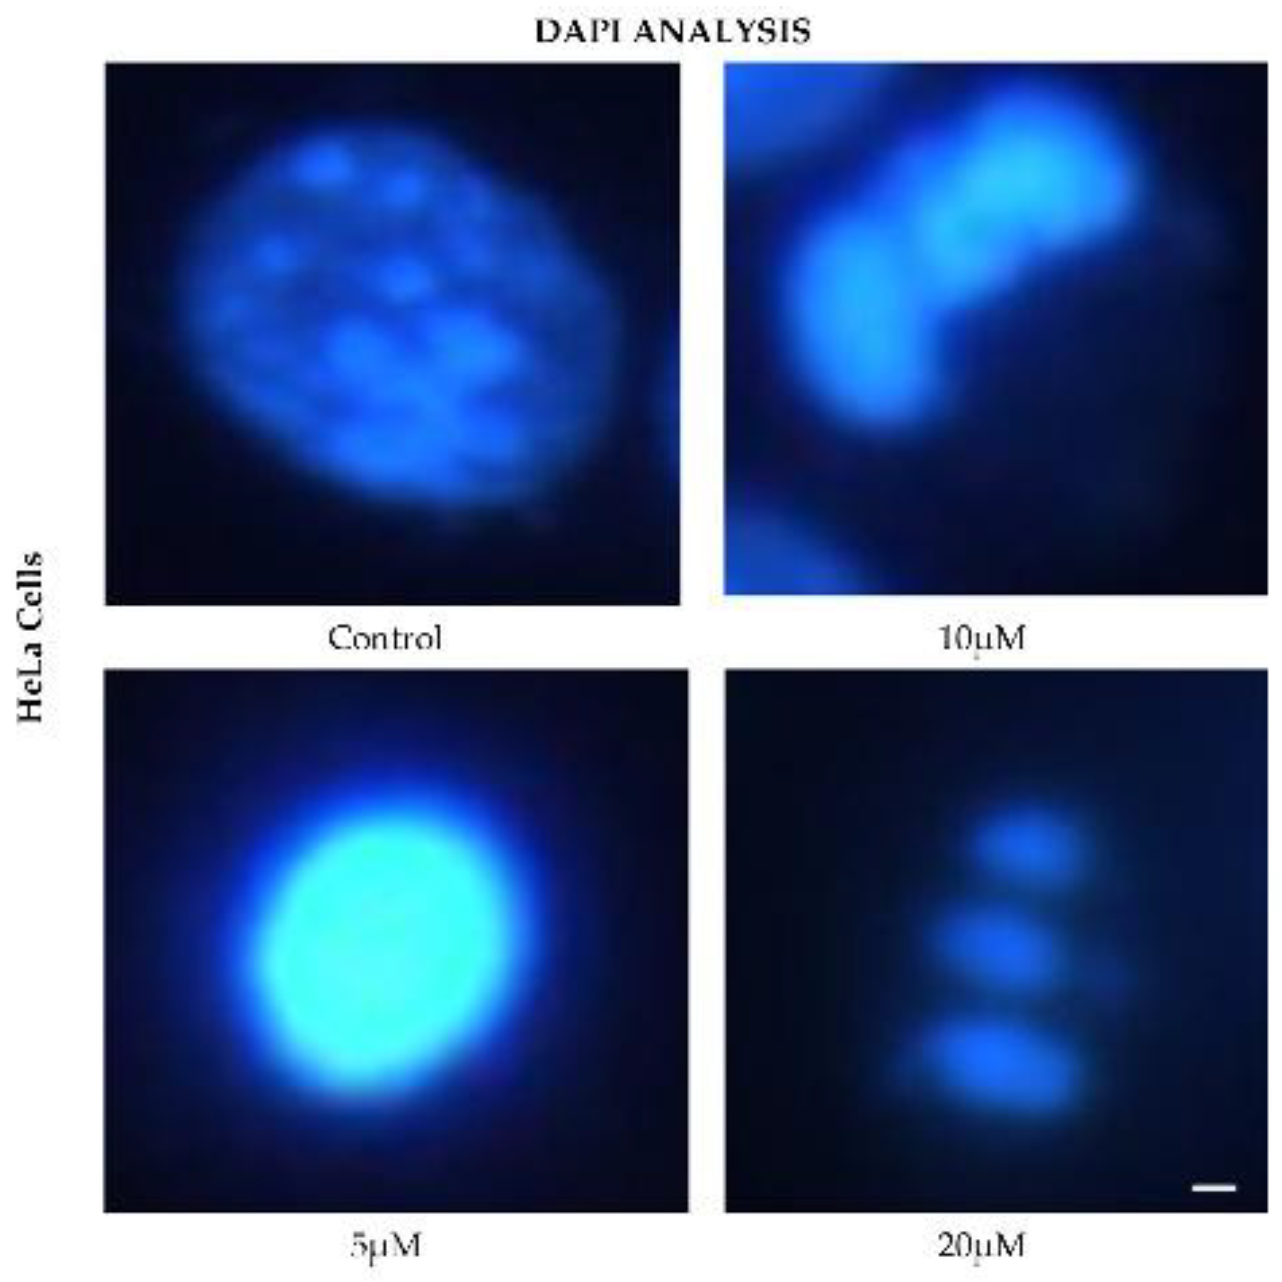
Figure 7.
Cell behavior under different CBD concentrations evaluated using the MTT assay. Panels (A, B) show the effects of CBD on HaCaT, HeLa, MDA-MB-231, and CaCo-2 cell lines after 24 h (blue), 48 h (red), 72 h (green), and 96 h (pink) of treatment. Graphs represent the percentage of viable cells and oxidative stress as a function of CBD concentrations. *p < 0.05, Tukey’s multiple comparison test vs. vehicle-treated cells. Panel (C) displays dose-response curves, where cell viability (y-axis) is plotted as a function of increasing CBD concentrations (0 to 20 µM; x-axis). LC50 values were determined from these curves for each cell line and exposure time. Data are presented as mean ± SEM (n = 3 independent biological experiments, each performed in triplicate).
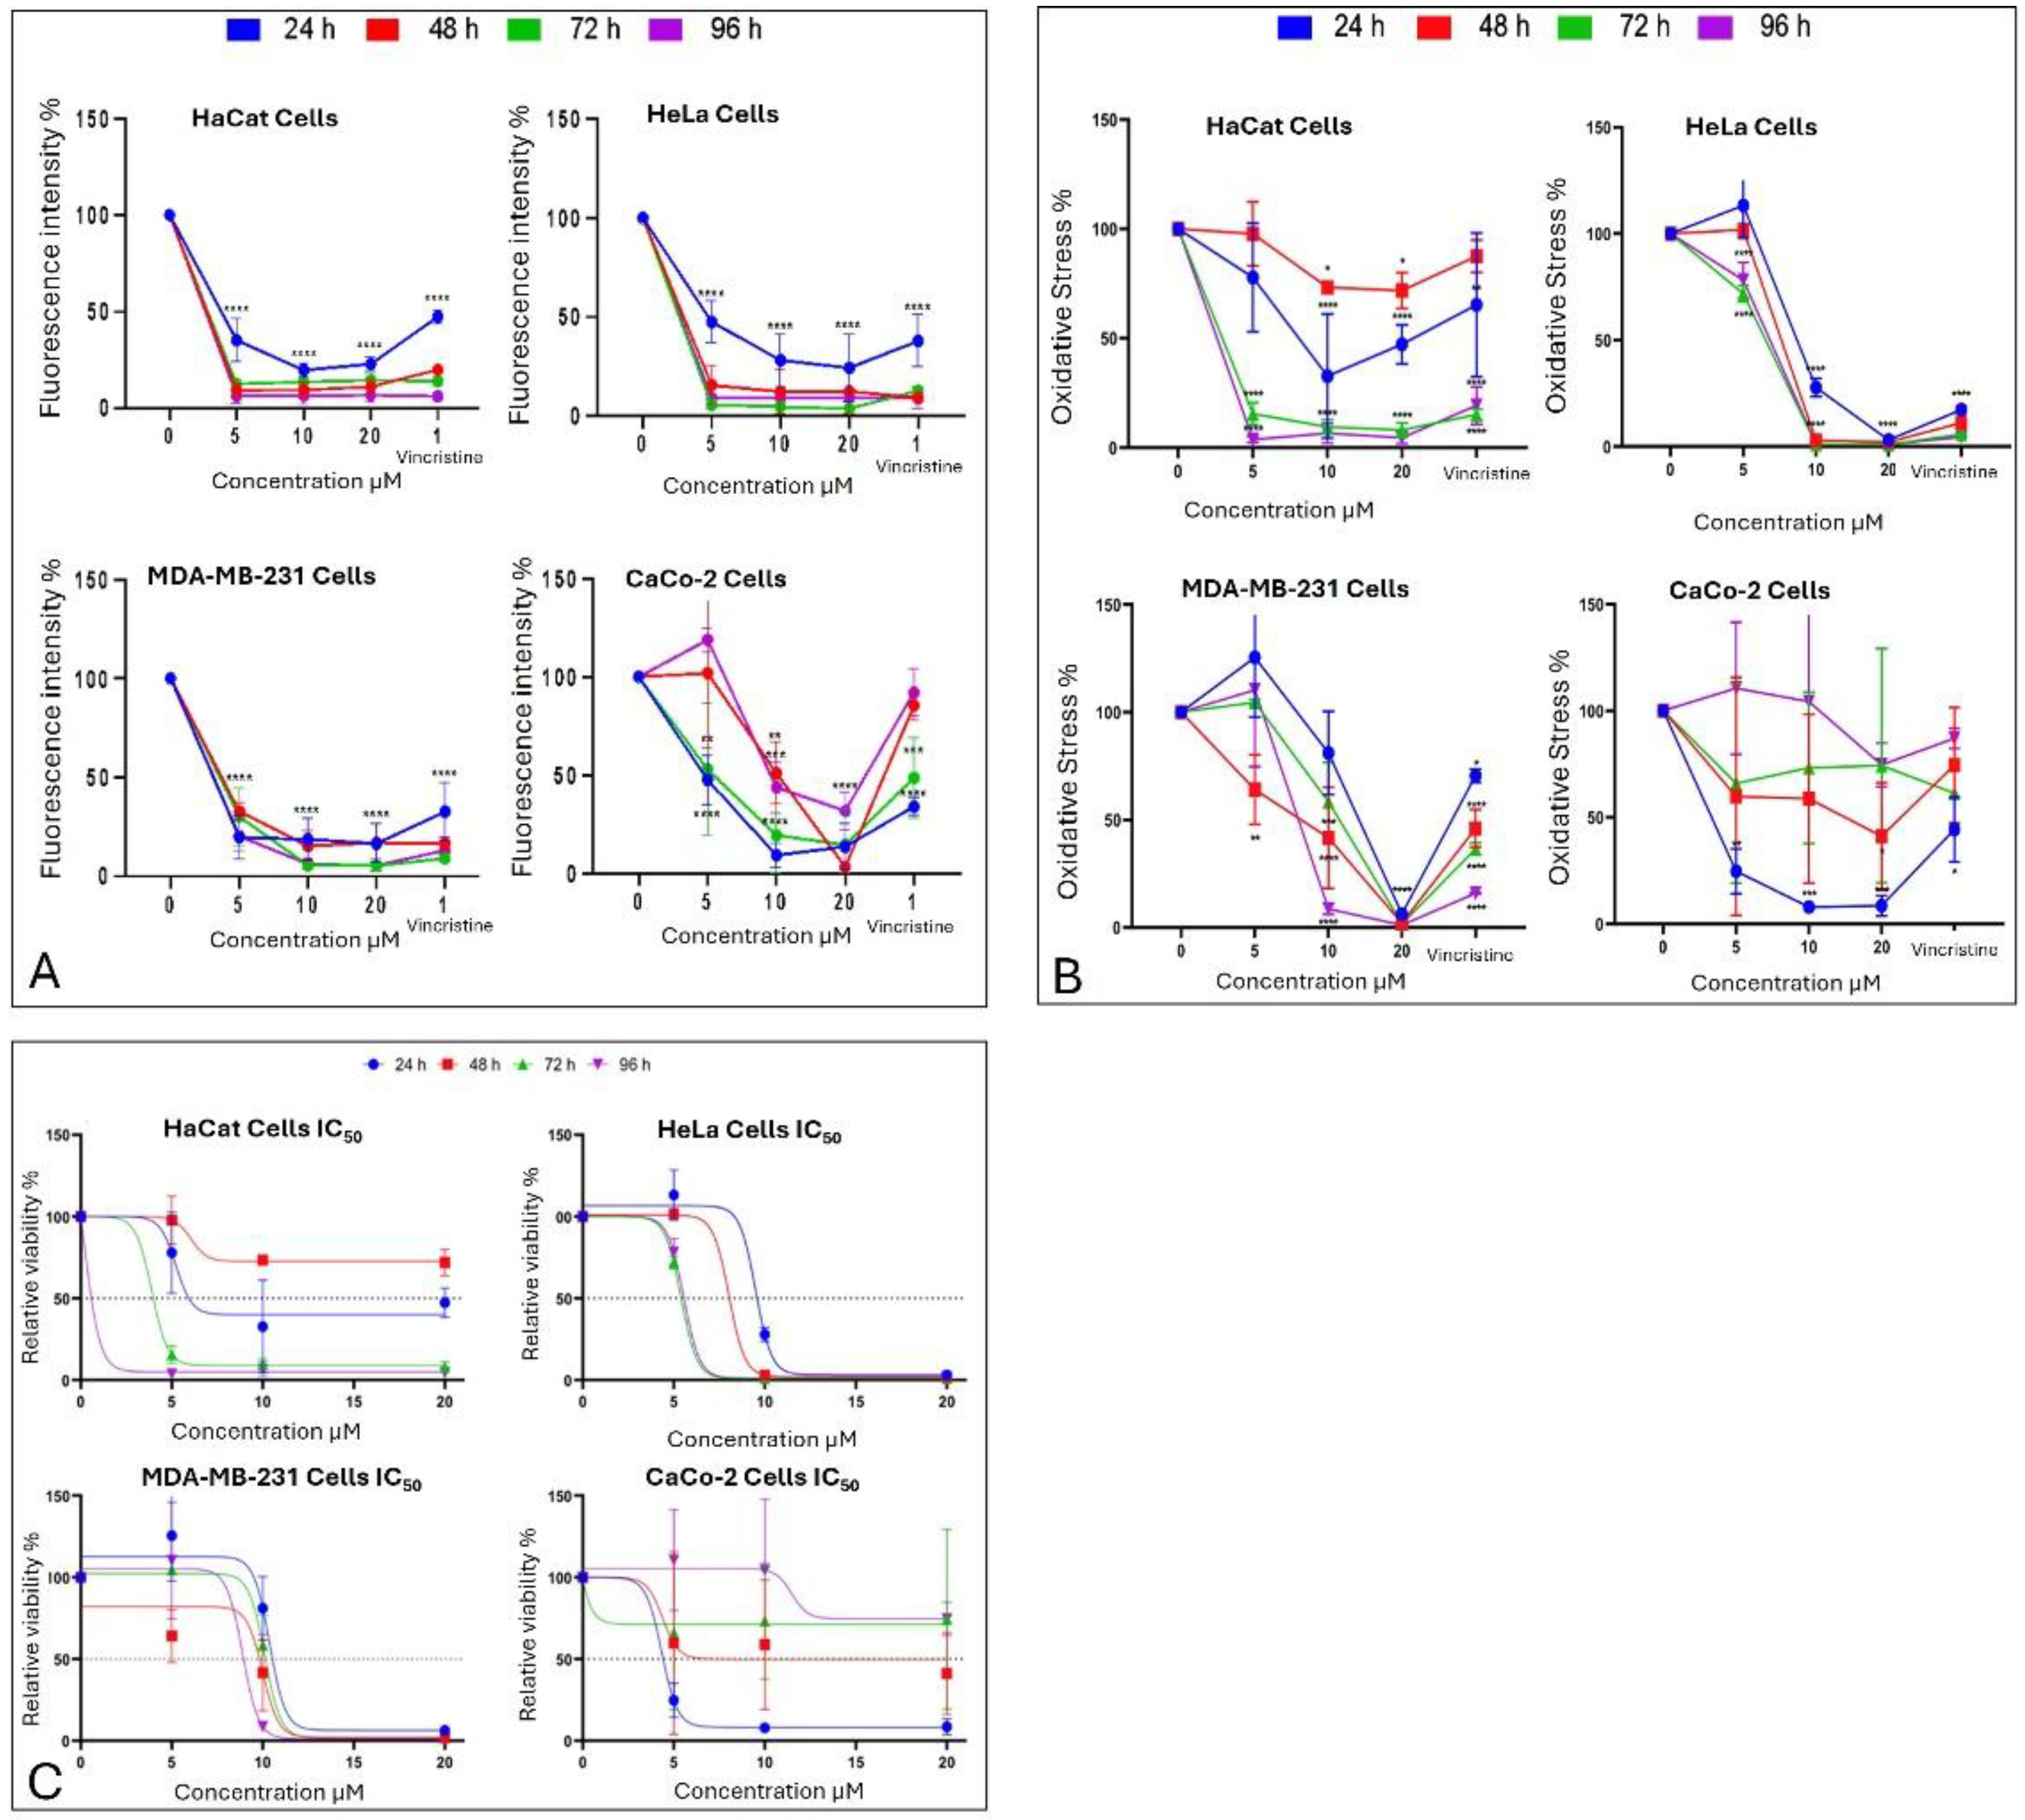
Figure 8.
Figure 8. Flow cytometry analysis of cell death types in HaCaT, HeLa, MDA-MB-231, and CaCo-2 cells treated with CBD and controls for 24 h. Cells were stained with 7-AAD and Apopxin Green to differentiate stages of cell death. Each large panel corresponds to a specific cell line: HaCaT, HeLa, MDA-MB-231, and CaCo-2. Within each panel, dot plots represent the treatment conditions: control, vehicle (methanol), vincristine (positive control), 5 μM CBD, and 10 μM CBD. In each dot plot, the quadrants are defined as follows: the lower-left quadrant shows viable cells, the lower-right quadrant shows cells in early apoptosis, the upper-right quadrant corresponds to late apoptosis, and the upper-left quadrant indicates necrotic cells.
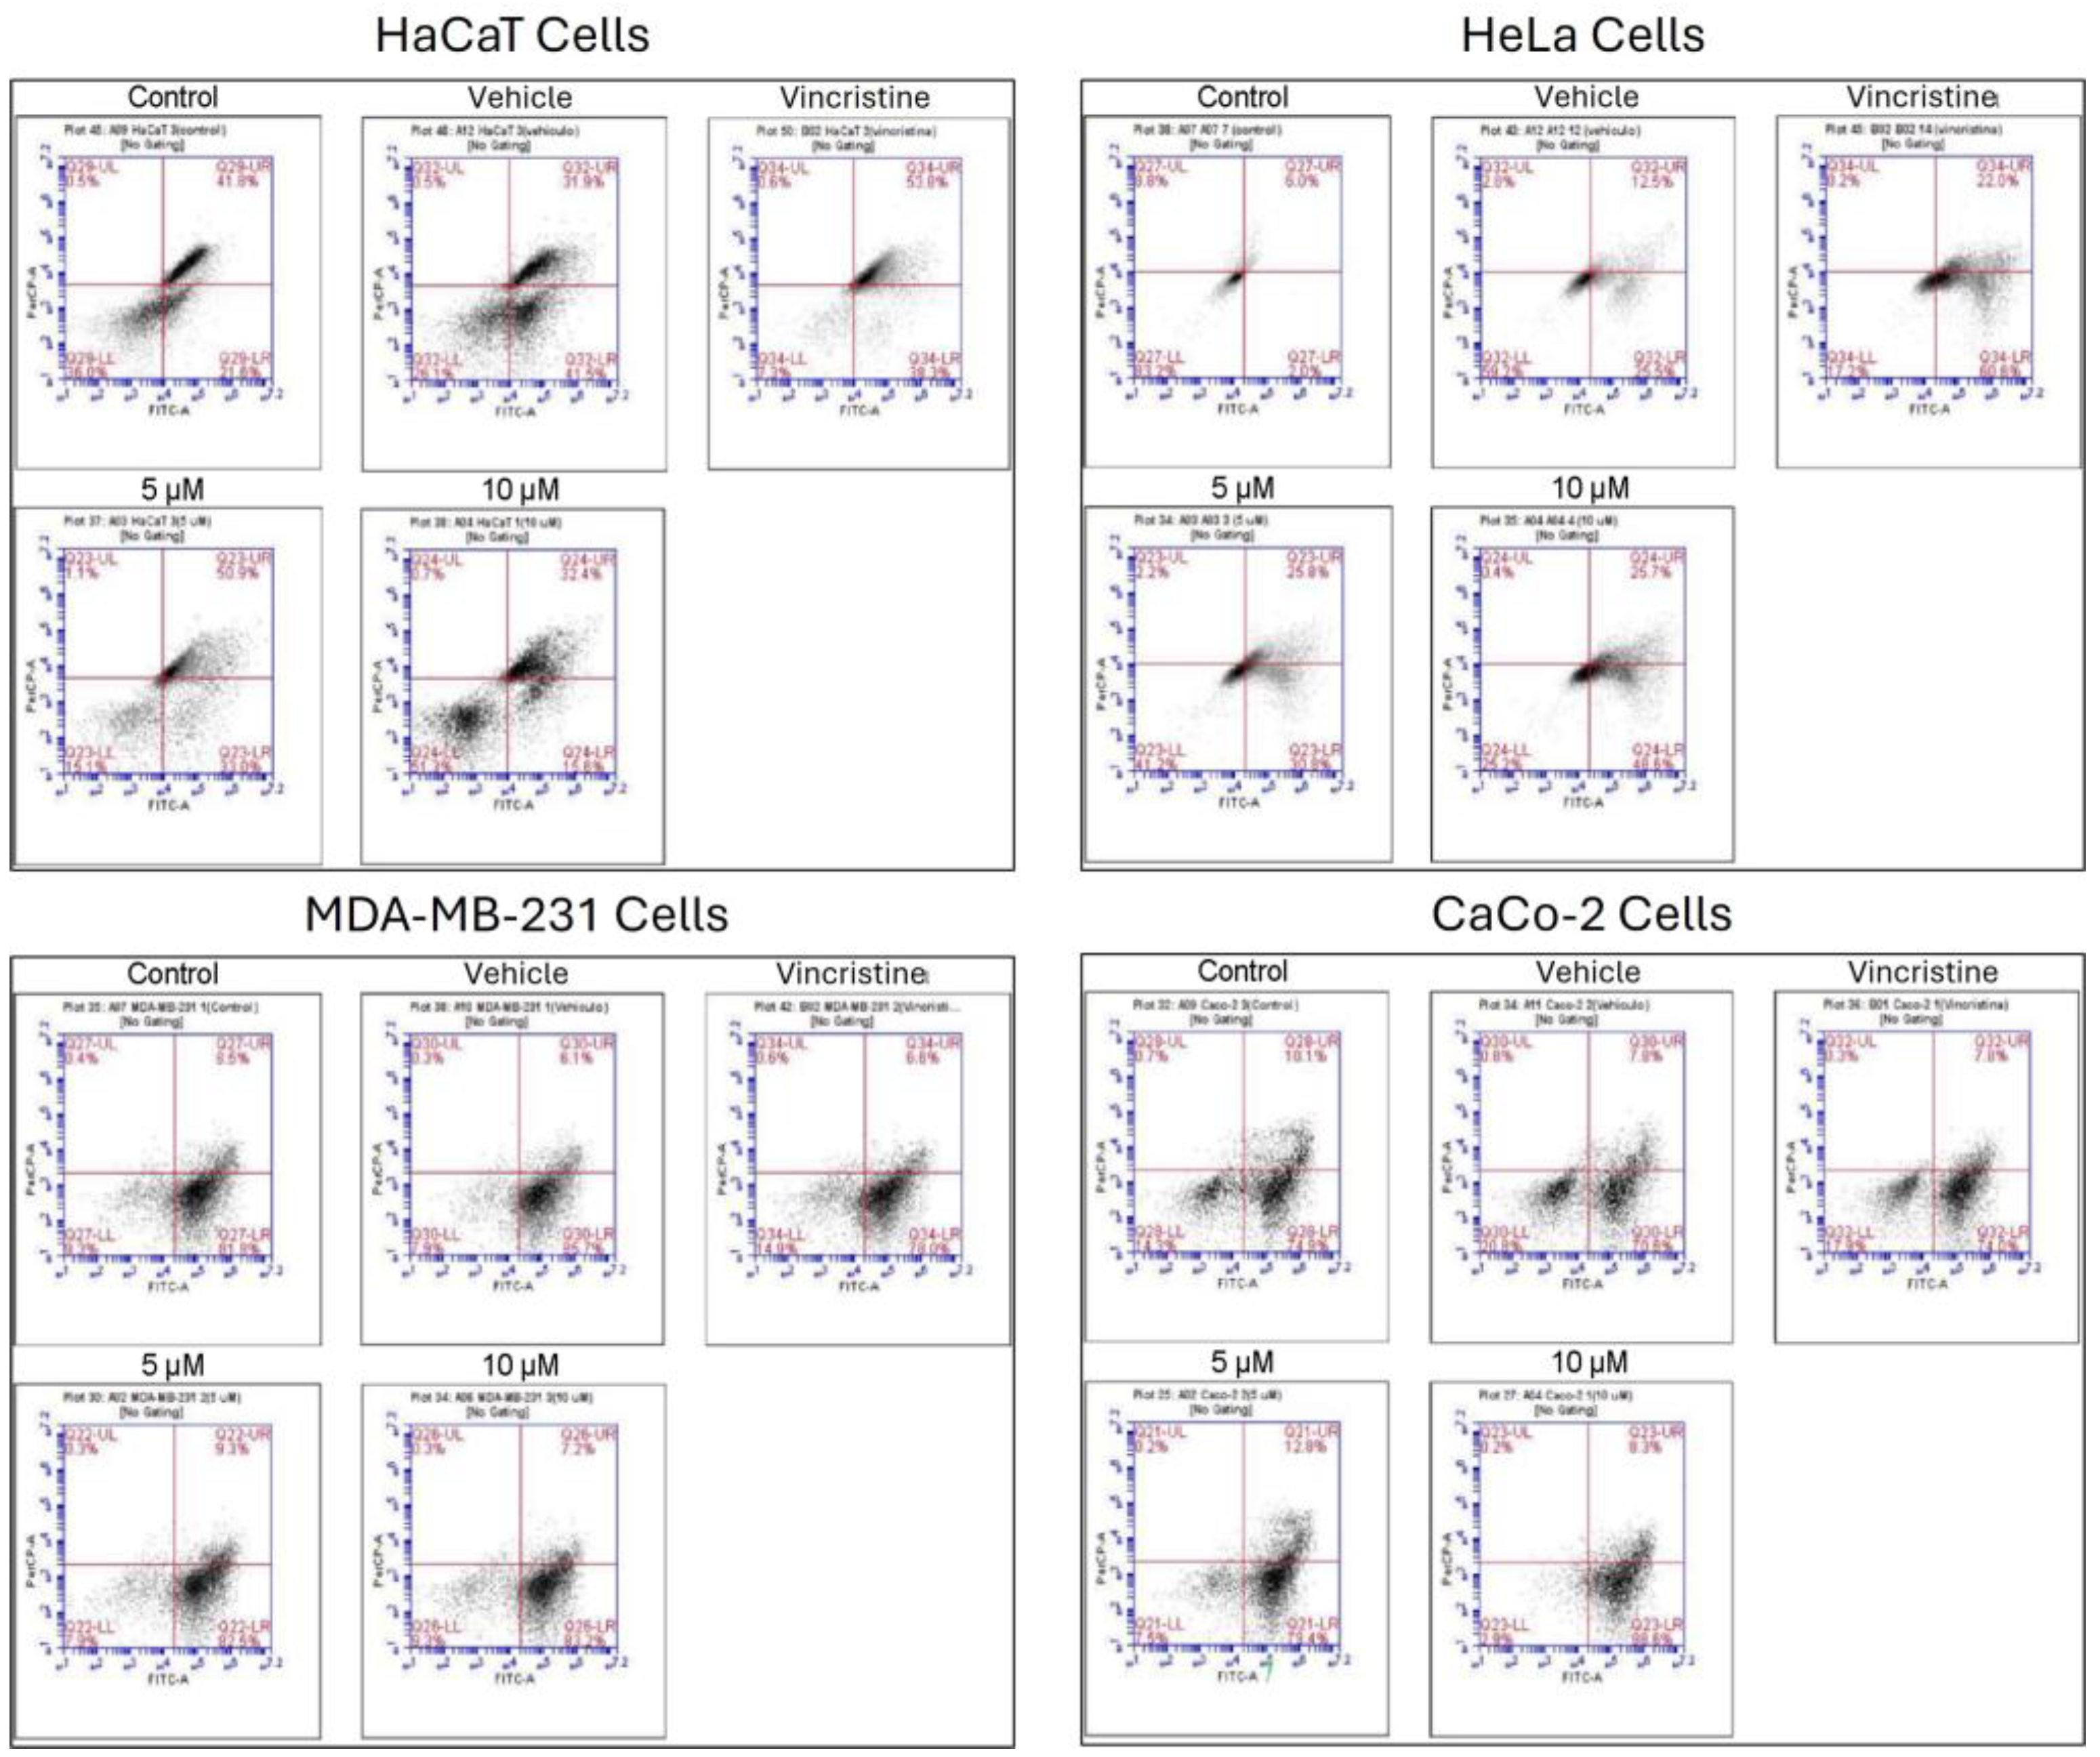

Table 1.
Determination of mean inhibitory dose LC50 per cell line under CBD exposition.
| Cell line | Time of exposure | LC50 | SEM |
|---|---|---|---|
| HaCaT | 24 h | 5.233 | 0.417 |
| 72 h | 3.903 | 0.157 | |
| 96 h | 0.183 | 1.525 | |
| HUVEC | 24 h | 2.1647 | 0.419 |
| 48 h | 2.6887 | 0.265 | |
| 72 h | 1.3471 | 0.256 | |
| 96 h | 0.268 | 0.058 | |
| HeLa | 24 h | 9.495 | 0.157 |
| 48 h | 8.034 | 0.555 | |
| 72 h | 5.400 | 0.029 | |
| 96 h | 5.547 | 0.074 | |
| MDA-MB-231 | 24 h | 10.373 | 0.248 |
| 48 h | 9.993 | 0.292 | |
| 72 h | 10.110 | 0.105 | |
| 96 h | 8.893 | 0.848 | |
| CaCo-2 | 24 h | 4.340 | 0.122 |
| 48 h | 4.389 | 1.299 |
Table 2.
Type of cell death induced by 5 and 10 µM CBD and controls in cell lines after 24 h of exposure, analyzed by flow cytometry.
Table 2.
Type of cell death induced by 5 and 10 µM CBD and controls in cell lines after 24 h of exposure, analyzed by flow cytometry.
| Flow Cytometry Analysis | |||||
|---|---|---|---|---|---|
| Cell Line | Concentration | Viability | Early Apoptosis | Late Apoptosis | Necrosis |
| HaCaT | Control | 38.87% | 18.16% | 42.28% | 0.68% |
| Vehicle | 26.42% | 35.38% | 37.68% | 0.51% | |
| 5 µM | 17.91% | 29.54% | 51.05% | 1.49% | |
| 10 µM | 48.07% | 22.30% | 28.79% | 0.85% | |
| Positive Control | 7.53% | 41.56% | 50.35% | 0.56% | |
| HeLa | Control | 80.99% | 4.20% | 7.11% | 7.70% |
| Vehicle | 60.66% | 22.86% | 13.30% | 3.18% | |
| 5 µM | 45.23% | 28.01% | 24.52% | 2.24% | |
| 10 µM | 24.37% | 52.87% | 22.38% | 0.38% | |
| Positive Control | 22.10% | 56.47% | 20.90% | 0.53% | |
| MDA-MB-231 | Control | 9.40% | 79.70% | 10.48% | 0.41% |
| Vehicle | 8.87% | 82.71% | 7.98% | 0.44% | |
| 5 µM | 7.41% | 82.68% | 9.53% | 0.38% | |
| 10 µM | 8.24% | 81.78% | 9.68% | 0.31% | |
| Positive Control | 12.56% | 80.74% | 6.23% | 0.48% | |
| CaCo-2 | Control | 14.62% | 75.26% | 9.67% | 0.45% |
| Vehicle | 20.42% | 70.36% | 8.48% | 0.75% | |
| 5 µM | 7.60% | 79.19% | 12.90% | 0.32% | |
| 10 µM | 3.05% | 87.36% | 9.26% | 0.33% | |
| Positve Control | 15.26% | 75.63% | 8.81% | 0.30% | |
Table 3.
Phytocannabinoid Content of CBD Isolate (Analyzed by Dry Weight).
| Abbreviation | Dry Wt. % | Dry Wt. mg/g |
|---|---|---|
| THCA | < LOQ | < LOQ |
| Δ-9-THC | < LOQ | < LOQ |
| Δ-8-THC | < LOQ | < LOQ |
| THCV | < LOQ | < LOQ |
| CBDA | < LOQ | < LOQ |
| CBD | 99 % (A) | 990.0 mg/g |
| CBGA | < LOQ | < LOQ |
| CBG | < LOQ | < LOQ |
| CBDVA | < LOQ | < LOQ |
| CBDV | 1.00% | 10.0 mg/g |
| CBN | < LOQ | < LOQ |
| CBL | < LOQ | < LOQ |
| CBC | < LOQ | < LOQ |
Disclaimer/Publisher’s Note: The statements, opinions and data contained in all publications are solely those of the individual author(s) and contributor(s) and not of MDPI and/or the editor(s). MDPI and/or the editor(s) disclaim responsibility for any injury to people or property resulting from any ideas, methods, instructions or products referred to in the content. |
© 2025 by the authors. Licensee MDPI, Basel, Switzerland. This article is an open access article distributed under the terms and conditions of the Creative Commons Attribution (CC BY) license (http://creativecommons.org/licenses/by/4.0/).
Copyright: This open access article is published under a Creative Commons CC BY 4.0 license, which permit the free download, distribution, and reuse, provided that the author and preprint are cited in any reuse.


