Submitted:
06 July 2025
Posted:
08 July 2025
You are already at the latest version
Abstract
Given the outstanding magnetic characteristics of lanthanide ions, the development of lanthanide complexes, transitioning from mononuclear to multinuclear, becomes imperative. Previous research utilized rhodamine Schiff base ligands to synthesize a series of mononuclear complexes exhibiting remarkable single-molecule magnetic properties alongside fluorescence characteristics. In the current study, we designed analogous ligands to synthesize complexes [Dy(HL1-o)(NO3)2(CH3OH)2]NO3·CH3OH (complex 1) and tetranuclear [Ln4(L1-c)2(L2)2(μ3-OH)2(NO3)2(CH3OH)4](NO3)2·2CH3CN·5CH3OH·2H2O (Ln = Dy, complex 2; Ln = Gd, complex 3), spanning from mononuclear to tetranuclear molecules. Magnetic susceptibility measurements show that 1 is a single-molecule magnet with Ueff = 33.2(10) K, 2 shows slow magnetic relaxation and 3 is a magnetic cooling material with the magnetic entropy change of 9.81 J kg−1 K−1 at 2 K and 5 T.
Keywords:
single-molecule magnets
; magnetocaloric effect
; lanthanide
; rhodamine
; Schiff base
1. Introduction
Single-molecule magnets (SMMs) are a type of molecular complexes that exhibit slow magnetic relaxation at the single molecular level [1,2,3,4,5]. They have a unique electronic and magnetic structure that allows for the storage and retrieval of information, making them promising candidates for next-generation data storage devices [6,7]. It has seen a significant increase in the pursuit of SMMs due to the potential for high-density data storage, longevity of data retention, and low-power consumption. However, the primary challenge in developing SMMs for practical applications stems from their low effective energy barriers (Ueff) and blocking temperatures (TB), thereby restricting their stability and applicability in technological devices. In recent years, there have been many works focused on improving SMMs’ performance, including using lanthanide ions to obtain higher Ueff, seeking matched symmetry (D4h, D5h, D6h), and designing suitable ligand fields for lanthanide ions to enhance the magnetic anisotropy required for SMMs [8,9]. In addition, the rare earth complexes of the cyclopentadiene series also have excellent SMM properties, constantly breaking the record of Ueff [10,11,12]. Currently, the record for the highest Ueff is held by the binuclear Dysprosium cyclopentadiene complexes (CpiPr5)2Dy2I4, which features a Dy-Dy bond and an effective energy barrier exceeding 2600 K [13,14].
The bifunctional research of SMMs is currently a hot topic, including chiral SMMs and fluorescent SMMs [15,16,17,18,19,20,21,22]. Combining fluorescence enhances our understanding of SMMs' properties and broadens their application prospects. For instance, fluorescence-labeled SMMs allow tracking their locations and behaviors in solutions or solids, while the fluorescence lifetime reveals their local environment, such as temperature and solvent polarity, thereby investigating their magnetic properties in various environments. There are also many ways to construct the bifunctional materials of fluorescent SMMs. In addition to the intrinsic fluorescence of 4f rare earth ions, fluorescence can be induced by incorporating fluorescent ligands, such as those based on spiropyran, rhodamine, tetraethylene, and pyrene chromophores [17]. The studies on fluorescent lanthanide SMMs reveals that the choice of ligands can significantly influence the magnetic and optical properties of the resulting compounds.
Our research group has been interested in coordination compounds of rhodamine ligands. We have found that rhodamine Fe(II) complexes [23,24] show the coupling effect of spin crossover and fluorescence, in addition the SMM properties of rhodamine dysprosium complexes were improved [25,26,27,28,29] by incorporating the phenolic hydroxyl group. The above studies have all focused on mononuclear species, as the designed tridentate chelate ligands are more favorable of coordinating with the same central metal ion. We extend our research to polynuclear lanthanide complexes. We choose the ligand HL1 (Scheme 1(a)) by incorporating a methoxy group at the ortho position of the phenolic hydroxyl group, potentially enabling formation of multinuclear structures [30]. To assemble linear polynuclear complexes, we utilize compartmental hexadentate ligands H2L2 (Scheme 1(b)) to coordinate with different lanthanide metal ions. Herein, we report the synthesis, crystal structures and magnetic properties of three lanthanide complexes, i.e. mononuclear [Dy(HL1-o)(NO3)2(CH3OH)2]NO3·CH3OH (complex 1) and tetranuclear [Ln4(L1-c)2(L2)2(μ3-OH)2(NO3)2(CH3OH)4](NO3)2·2CH3CN·5CH3OH·2H2O (Ln = Dy, complex 2, Ln = Gd, complex 3).
2. Materials and Methods
2.1. Synthesis
All reagents used in this study were commercially available and used without further purification. The ligands HL1 and H2L2 were synthesized by a literature method [28,29]. All syntheses were performed under ambient conditions at room temperature.
2.1.1. Synthesis of [Dy(HL1-o)(NO3)2(CH3OH)2]NO3·CH3OH (Complex 1)
Dy(NO3)3·5H2O (0.2 mmol, 112.5 mg) and HL1 (0.2 mmol, 86.5 mg) were stirred in methanol (10 mL) to give a red solution. Well-shaped small red crystals suitable for single-crystal structural determination can be obtained by evaporation of the above solution at room temperature for a week.
2.1.2. Synthesis of [Dy4(L1-c)2(L2)2(μ3-OH)2(NO3)2(CH3OH)4](NO3)2·2CH3CN·5CH3OH·2H2O (Complex 2)
Mixing Dy(NO3)3·5H2O (0.5 mmol, 216 mg) and HL1 (0.2 mmol, 112.5 mg) in 5 mL methanol and 5 mL acetonitrile gave a red solution, to which H2L2 (0.2 mmol, 60 mg) in CH2Cl2 (2 mL) and Et3N (100 μL, 2.16 mmol) were added successively. The solution turned yellow and became turbid. After filtration, the filtrate was put into a glass tube, covered with ether for slow diffusion. After a week, yellow crystals can be obtained for X-ray single crystal diffraction analysis.
2.1.3. Synthesis of [Gd4(L1-c)2(L2)2(μ3-OH)2(NO3)2(CH3OH)4](NO3)2·2CH3CN·5CH3OH·2H2O (Complex 3)
The synthetic method is similar to that of complex 2, except that Dy(NO3)3·5H2O is replaced with Gd(NO3)3·6H2O (0.5 mmol, 225 mg). High-quality yellow single crystals were obtained.
2.2. Physical Measurements
The atmospheric pressure solid UV-vis diffuse reflection spectra were measured with a U-3900 spectrophotometer between 280 to 600 nm. Single-crystal X-ray data were collected on a Rigaku SuperNova, Dual, Cu at zero, AtlasS2. The structure was solved by program SHELXT and refined by a full matrix least-squares method based on F2 using SHELXL-2014/7 method. Hydrogen atoms were added geometrically and refined using a riding model. Temperature- and field-dependent magnetic susceptibility measurements were carried out on a Quantum Design MPMS-XL5 SQUID magnetometer.
3. Results and Discussion
According to the previous reports, the rhodamine-based ligand shows interesting ring-opened and ring-closed properties under different acid-base conditions (Scheme 2). Upon addition of Ln(NO3)3, the reactant solution turned red, indicating formation of ring-opened HL1-o. Red single crystals of 1 suitable for single crystal X-ray diffraction were obtained from the resulting red solution. Yellow single crystals of 2 and 3 are obtained when HL1 and H2L2 react with Ln(NO3)3 in the presence of Et3N, showing that the ring-closed ligand (L1-c)− is present in the tetranuclear complexes.
3.1. Crystal Structures
High-quality single crystals of 1-3 were used for X-ray single crystal diffraction measurements. Since complexes 2 and 3 are isomorphic, the structure of complex 2 is described in detail as a representative. The crystallographic data are given in Table S1, and the selected bond distances and bond angles are listed in Tables S2 and S3.
The crystal data shows that complex 1 crystallize in the triclinic space group of P-1. It consists of the [Dy(HL1-o)(NO3)2(CH3OH)2]+ cation (Figure 1(a)) and a NO3− charge-balancing anion. Dy(III) has a typical O8N nine coordination, with two chelating nitrates, two methanol, and one ring-closed ligand HL1-o participating in the coordination. Calculated by SHAPE software, the local symmetry of the Dy(III) ion is close to Cs (Table S4), and the deviation parameter is 1.359. The coordination pattern is shown in the Figure S1. The bond length for Dy1-N1 is 2.508(3) Å. The shortest Dy-O bond length is 2.192(3) Å (Dy1-O1), and the longest bond length is 2.498(3) Å for Dy1-O7. This indicates that the short Dy-Ophenoxy bond is dominant. The ligand HL1-o is in an ring-opened form (Figure S2), with only three atoms available for coordination, while the oxygen on the methoxy group is free. It is worth noting that the hydrogen on the phenol of the ligand is removed, but an additional hydrogen is added to the nitrogen of the carbonyl group. This can be seen from the bond angle data, where the hydrazide C9-N2-N1 bond angle is 116.71°, which is a clear proof of the presence of hydrogen on N2. Otherwise, the C-N-N bond angle is smaller than 110° owing to the electrostatic repulsion of lone pair toward two bond pairs. This results in the entire neutral ligand. This hydrogen (H22) attached to N2 forms a significant hydrogen bond with free nitrate (O11), with a O11∙∙∙H22 distance of 1.970 Å. Interestingly, this nitrate (O13) also forms another hydrogen bond with the free methanol molecule (O14), with a O13∙∙∙H14A distance of 1.954 Å (Figure S3), leading to the stability of crystallization. The shortest intermolecular Dy∙∙∙Dy distance is 6.637 Å. The short intermolecular Dy∙∙∙Dy distance may lead to appreciable intermolecular magnetic interactions. Complex 1 also forms a supramolecular one-dimensional chain structure. As shown in Figure S4, π-π stacking is present between adjacent open oxyanthracene planes with the interplane distance of 3.311 Å.
The crystal data for complex 2 show that it crystallizes in the monoclinic space group of C2/c. It comprises a C2 rotation axis-related [Dy4(L1-c)2(L2)2(μ3-OH)2(NO3)2(CH3OH)4]2+ cation (Figure 1(b)), with two charge balancing NO3− anions. There are two different coordination environments of Dy(III) ions within the molecule, as shown in Figure S5. Dy1 exhibits nine-coordination, and Dy2 is eight-coordinate. Calculated by SHAPE software, Dy1 is close to the local symmetry of C4v (Table S5) with the deviation parameter is 0.375; Dy2 is close to the local symmetry of D4d (Table S6), and the deviation parameter is 1.216. The coordination pattern is shown in the Figure S6. The distance between Dy1∙∙∙Dy2 is 3.538 Å and Dy1∙∙∙Dy1A is 3.904 Å. Besides, Dy1∙∙∙Dy2A is 4.327 Å and Dy2∙∙∙Dy2A is 6.757 Å. The four Dy(III) ions are not coplanar (Figure S7), forming a space quadrangle with a dihedral angle of 23.0°. Their coordination pattern is shown in the Figure S8. The ligand (L1-c)− is in a ring-closed form, the four coordination atoms of (L1-c)− are all involved in coordination, bridging Dy1 and Dy2. Ligand (L2)2− is a hexadentate ligand, but only five atoms participate in the coordination and bridge three Dy ions (Figure S8). The N-N single bond in the middle of the ligand (L2)2− undergoes rotation, and the dihedral angle between the two benzene planes is 65.76°. The shortest bond length between Dy1-O is 2.328(6) Å, and the longest is 2.442(6) Å with the average bond length of 2.395 Å. The shortest bond length between Dy2-O is 2.202(8) Å, and the longest Dy2-O bond length is 2.501(7) Å. In addition, solvent molecules crystallize together, including two CH3CN, five CH3OH and two H2O molecules. The nearest intermolecular Dy∙∙∙Dy distance for complex 2 is 9.454 Å, large enough to exclude any intermolecular magnetic interaction.
3.2. Characterizations
The infrared spectra of complexes 1-3 and the ligands HL1 and H2L2 were examined for comparison. As shown in Figure S9, the peak at 1693 cm–1 for HL1 disappears, which may be due to the fact that the C=O bond of ligand HL1 participates in the coordination in the enol form, which weakened the vibration peak of C=O. The strong peaks at 1625 cm–1 of ligand HL1 and 1616 cm–1 of complex 1 may be the stretching vibration peaks of C=N bond of the ligand. The peak of complex 1 at 1368 cm–1 is the characteristic peak of nitrate ion compared with ligand HL1. For complexes 2 and 3 (Figure S10), the spectra are very similar. The strong peaks at 1090 cm–1 of ligand HL1 and 1070 cm–1 of ligand H2L2 may be attributed to the methoxyl group. Upon coordination of this oxygen, the peak intensities undergo a notable weakening, particularly evident in the spectra of complexes 2 and 3. The emergence of new peaks at 1382 cm–1 and 1380 cm–1 in complexes 2 and 3, respectively, can be attributed to the asymmetric vibration of nitrate.
UV-Vis spectra of complexes 1-3 in ethanol (10–5 mol/L) were shown in Figure S11. The absorption peaks of ligand HL1 and complex 1 at 302 nm and 306 nm should be due to the ligand-to-ligand charge transfer (LLCT) of the ligand, while the new absorption peak at 534 nm for complex 1 indicates that ligand HL1 is in the ring-opened form. The oxaanthracene group in HL1-o has a planar conjugated rigid structure, which can cause π-π* transition. Complexes 2 and 3, however, have no absorption peaks in the visible region, which is consistent with the presence of ring-closed HL1.
The fluorescence spectra of the complexes in ethanol (10–5 mol/L) are shown in Figures S12 and S13. Complex 1 is pink in EtOH, and complexes 2 and 3 are nearly colorless in EtOH. The fluorescence emission spectrum (λex = 354 nm) of complex 1 shows a maximum emission at 569 nm (Figure 2), indicating that the ring-opening rhodamine ligand emits green light upon excitation. This fluorescence behavior is consistent with that of complexes with ring-opened rhodamine ligand. When excited by the light of 378 nm, the emission spectra of complexes 2 and 3 are obtained. It can be found that complex 2 has almost no fluorescence, and complex 3 still has weak fluorescence at 549 nm, presumably due to the presence of trace ring-opened ligand.
3.3. Magnetic Measurements
The direct current (DC) and alternating current (AC) magnetic susceptibilities of complexes 1-3 were measured on a MPMS-5XL SQUID magnetometer. Figure 3 shows the temperature dependence of χMT for complexes 1-3 at 2-300 K under 1000 Oe field. At room temperature, the maximum χMT values are 14.00 cm3 K mol−1, 56.21 cm3 K mol−1 and 31.36 cm3 K mol−1, which are close to the theoretical values of a Dy(III) ion (14.18 cm3 K mol−1, S = 5/2, L = 5, gJ = 4/3), four Dy(III) ions (56.72 cm3 K mol−1) and four Gd(III) ions (31.52 cm3 K mol−1, S = 7/2, L = 0, g = 2.0), respectively. For complex 1, the χMT value first decreases slowly with the decrease of temperature from 300 K to 18 K, reaching 12.27 cm3 K mol−1 at 18 K. Further cooling down to 2 K, the χMT value rapidly increased to 16.29 cm3 K mol−1. The increase in low-temperature magnetic susceptibility may be attributed to strong intermolecular ferromagnetic interactions in complex 1. The shortest distance between Dy∙∙∙Dy of 6.637 Å should be responsible for the intermolecular magnetic interaction. For complex 2, reducing the temperature to 12 K, χMT value decreases slowly with the decrease of temperature, and then quickly and slightly increased to 52.40 cm3 K mol−1. The minimum χMT occurs at 12 K. The increase of χMT below 12 K may be related to the intramolecular Dy∙∙∙Dy ferromagnetic interaction. As for complex 3, it cools down and decreases monotonically throughout the entire temperatures. From 300 K to 10 K, the χMT value decreases slowly, and then from 10 K to 2 K, rapidly reduces to 20.74 cm3 K mol−1, which suggests that there is an intramolecular antiferromagnetic interaction between the tetranuclear Gd(III) ions in the complexes. Magnetic fitting of tetranuclear gadolinium complex 3 was carried out by MagPack software, and the dark blue solid curve was obtained. The Hamiltonian operator expression is:
It was found that the fitting curve was in good agreement with the experimental data with the fitting parameters of J1 = J2 = −0.022 cm–1, J3 = −0.036 cm–1 and g = 2.000, which also indicated that there was weak intramolecular Gd---Gd antiferromagnetic coupling.
Ĥ = −2J1(ŜGd1ŜGd2 + ŜGd1AŜGd2A) −2J2(ŜGd1ŜGd2A + ŜGd1AŜGd2) −2J3ŜGd1ŜGd1A
The field-dependent magnetization of complexes 1-3 in the temperature range of 2 -10 K was measured, as shown in Figure 4 and Figure S14. The magnetization of complex 3 increases with the increase of magnetic field intensity at 2 K, and increases rapidly at 0 T to 3 T, and gradually approaches the maximum magnetization of 28.4 Nβ at 5 T. When the temperature increases, the maximum magnetization value decreases. At 10 K, the magnetization of complex 3 is far from saturated at 5 T. Contrary to complexes 1 and 2 (Figure S14), complex 3 basically reached saturation at a temperature of 2 K and 5 T. The theoretical saturation value of four independent Gd (III) ions is 28 Nβ, which is consistent with the maximum experimental saturation value, indicating that the four Gd (III) ions in complex 3 have negligibly weak magnetic interaction. Magnetic fitting of complex 3 (Figure S15) shows that the experimental M-H curve at 2 K is lower than the calculated Brillouin curve of non-interacting SGd spin, which also indicates that there is weak antiferromagnetic coupling.
Some gadolinium compounds have demonstrated exceptionally outstanding magnetocaloric properties, showcasing remarkable potential in various advanced technological applications [31,32,33,34,35,36,37,38,39,40]. We further characterized the magnetocaloric effect (MCE) of complex 3. Using − (R ≈ 8.314 J mol–1 K–1), the theoretical magnetic entropy of four independent Gd(III) can be calculated to be 8.32R (22.77 J kg−1 K−1). We used the Maxwell equation (2):
The magnetic entropy change values under different temperatures and different external magnetic fields can be calculated (Figure 5). At 2 K and ∆H = 5 T, the value of −∆Sm is 9.81 J kg−1 K−1, which is attributed to the low Gd(III) content that reduces the density of active magnetic moments and thereby limits the cumulative magnetic response, resulting in an unsatisfactory MCE. Moreover, the presence of weak antiferromagnetic coupling within the system also causes the actual value of −∆Sm to be smaller than the theoretical value.
The AC magnetic susceptibility measurements were performed on 1 and 2 to study the slow magnetic relaxation. Figure S16 shows temperature dependence of out-of-phase AC susceptibilities (χ"M) for 1 under 0- and 2000-Oe DC field with the frequency of 997 Hz. Below 10 K, no obvious peak is observed in the χ"M curve under 0 Oe, suggesting a strong quantum tunneling of the magnetization (QTM) effect during the molecular relaxation process. After applying a 2000 Oe DC field, the peak appears at 4 K, indicating that external field can effectively suppresses the low temperature QTM.
In order to find an exact external magnetic field, field dependence of χ"M for complex 1 were measured at 4 K and 997 Hz (Figure S17). With the increase of external magnetic field, the imaginary AC magnetization first increases rapidly, and then decreases slowly, and the optimal external magnetic field corresponds to the maximum value of 600 Oe.
The AC magnetic susceptibility of complex 1 is tested under 600 Oe. As shown in Figure 6(b), with the increase of frequency, the peak of the χ"M curve of AC magnetic susceptibility moves to the high temperature region, which is a typical feature of SMMs. As shown in Figure 6(c), the Cole-Cole curves in the range of 2.0-4.2 K are approximately semicircular, which is well fitted by the generalized Debye model. The fitting parameters are listed in Table S7, and the α value is in the range of 0.13272 to 0.09508, indicating that the relaxation time distribution is relatively narrow and has a single relaxation. The lnτ vs. T−1 plot shows a certain curvature, indicating that there are multiple relaxation paths. Fitting with the formula including Raman and Orbach relaxations:
where τ is the relaxation time obtained by Cole-Cole circle fitting, Ueff represents the effective energy barrier of SMMs, and n and C are the fitting parameters of Raman relaxation process. As can be seen from the Figure 6(d), the fitted curve can well match the data points with the fitting parameters of Ueff = 33.2(10) K, τ0 = 6.6(16)× 10−7 s, n =1.31(6) and C = 32.2(17) s−1 K−1.31. This also shows that the slow magnetic relaxation process of complex 1 includes Raman relaxation and Orbach relaxation.
Figure S18 shows the χ’M and χ"M of AC magnetic susceptibility with temperature at different frequencies of complex 2 under 0 Oe. Within the test temperature range, no obvious peak is observed in the χ"M curve under 0 Oe, suggesting a strong QTM effect during the relaxation process.
3.4. Theoretical Calculations
Complete-active-space self-consistent field (CASSCF) calculations on complex 1 (Figure S19) on the basis of X-ray determined geometry have been carried out with the OpenMolcas [41] and the SINGLE_ANISO [42,43,44] programs (see the Supporting Information for details). The calculated energy levels, g (gx, gy, gz) tensors and the predominant mJ values of the lowest eight Kramers doublets (KDs) of complex 1 are shown in Table S8. The predominant mJ components for the lowest eight KDs of 1 are shown in Table S9, where the ground KD is mostly composed by mJ = ±15/2. The first excited KD of 1 is composed by mJ = ±13/2, which leads to the large transversal magnetic moment in its first excited KD in Figure 7.
The corresponding magnetization blocking barrier of complex 1 is shown in Figure 7, where the transversal magnetic moment in the ground KD is close to 10−2 µB, and thus the QTM in the ground KD is suppressed at low temperature. The transversal magnetic moment in its first excited state of 1 is 0.5×10⁻¹ µB, and therefore allowing the fast thermal-assisted QTMs (TA-QTMs) in its first excited KD. Thus, the calculated energy barrier is 194.6 cm−1. Due to the unfavourable effects of anharmonic phonons, Raman magnetic relaxation, QTM, et al. on energy barrier, the experimental effective energy barrier Ueff is usually smaller than the calculated one [45,46,47,48,49].
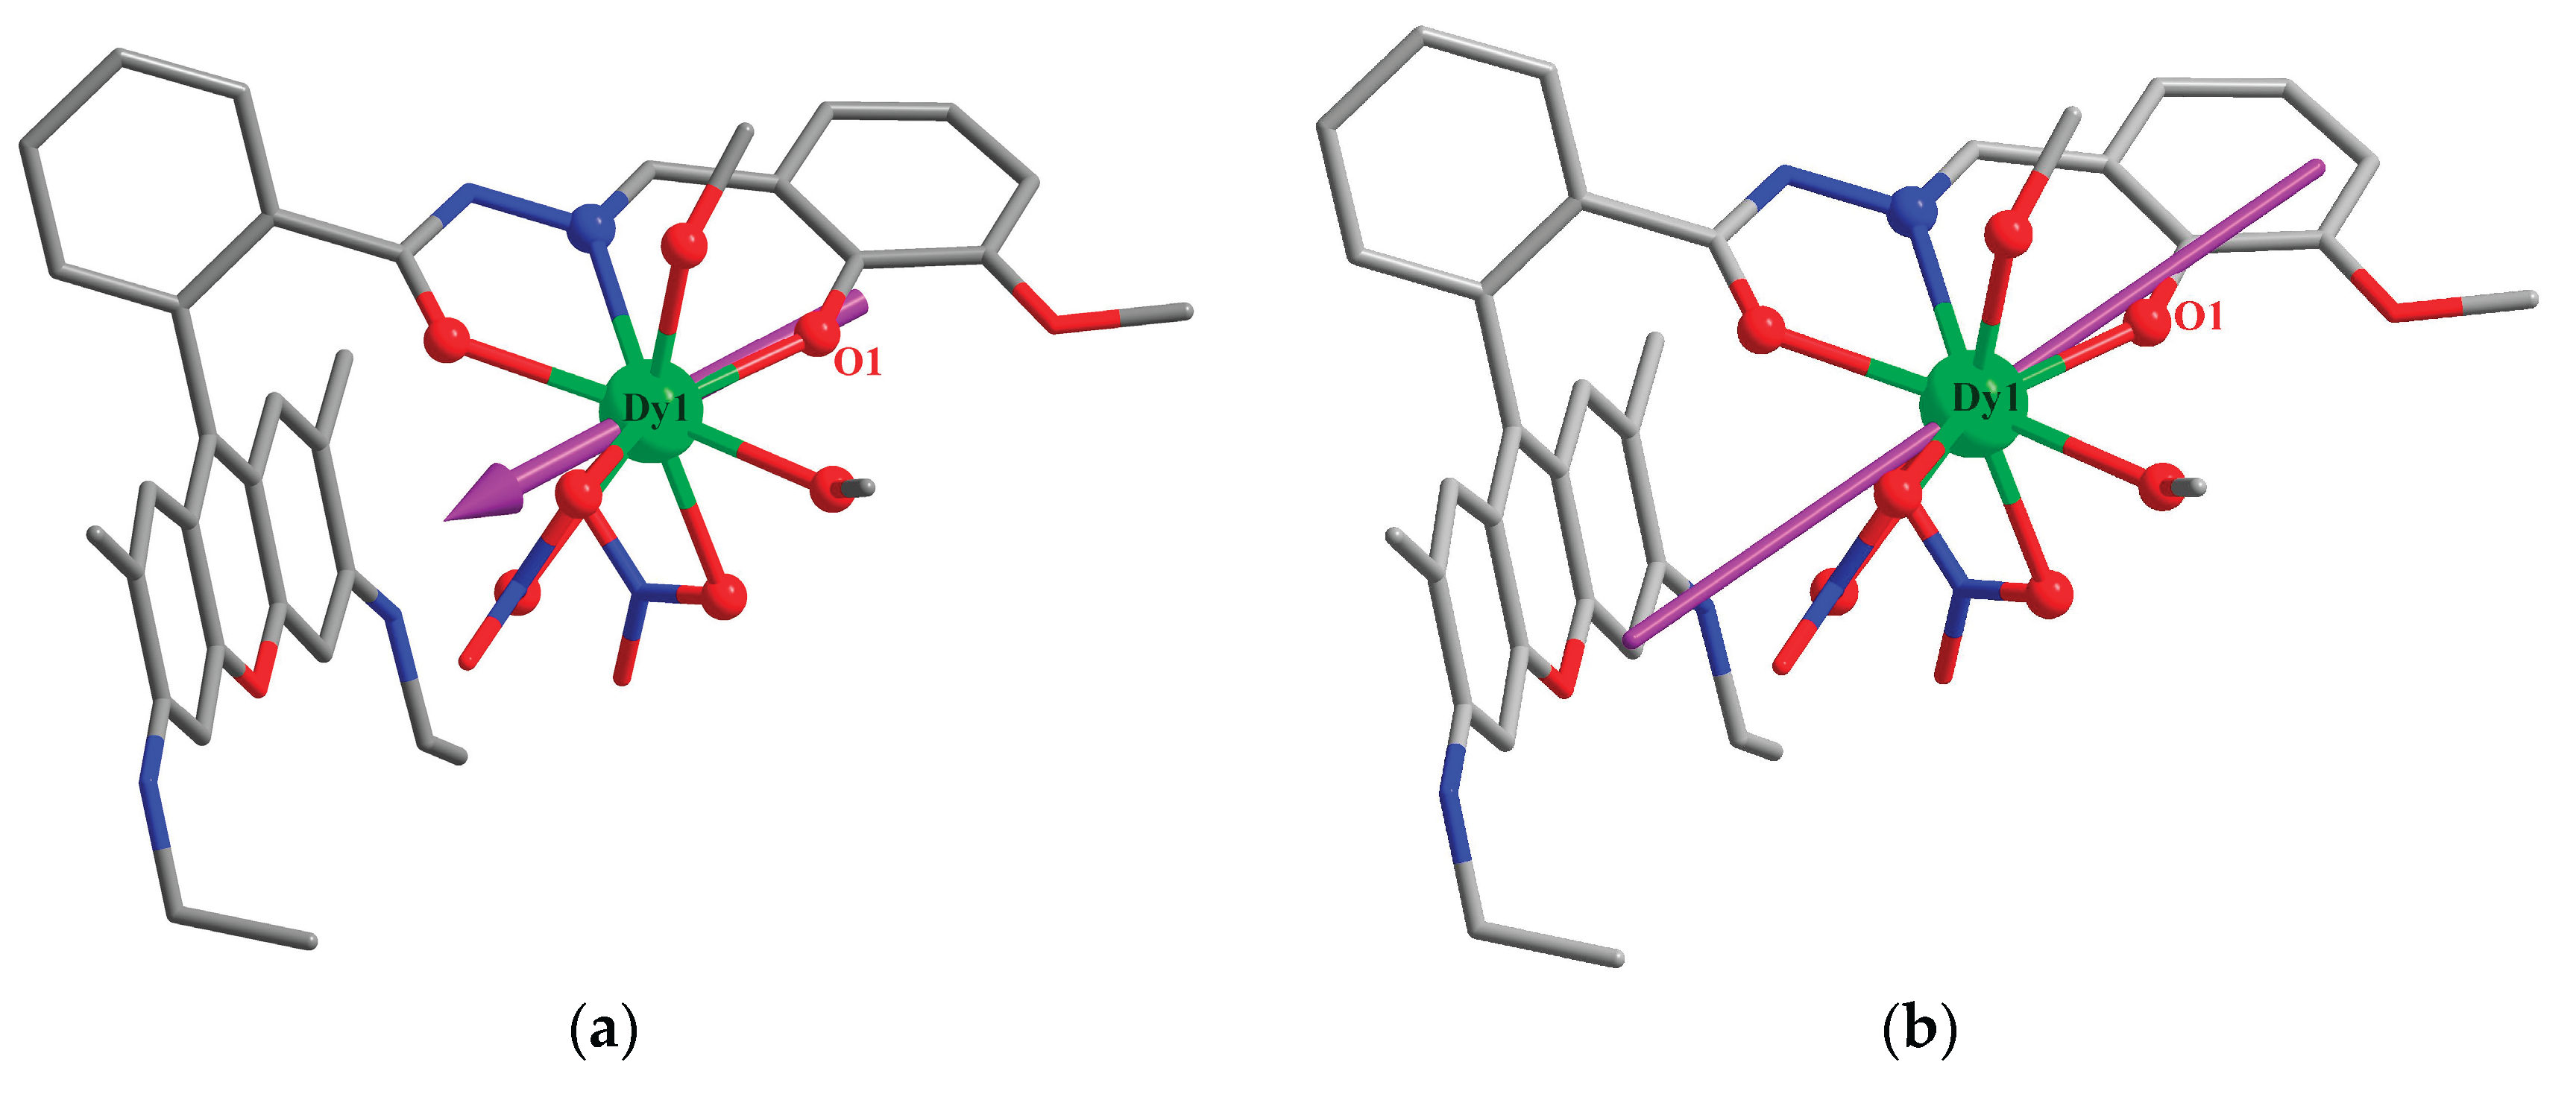
The calculated crystal-field (CF) parameters B (k, q) and corresponding weights are given in Table S10, where the weights of the axial CF parameters B(2,0) and B(4,0) for 1 are 20.70% and 7.73%, respectively, which exceed the non-axial components, indicating a perfectly axial symmetry for 1. The main magnetic axis on Dy(III) ion of 1 is indicated in Figure 8(a). In addition, the main magnetic axis is also calculated by MAGELLAN software, and the obtained results are shown in Figure 8(b). It can also be observed that the direction of the main magnetic axis is almost identical with the direction of the phenol-oxygen bond, showing the the shortest Dy-O bond is dominant in magnetic anisotropy.
It has been documented that the magnetic anisotropy is the key factor affecting the SMM behavior, while the magnetic anisotropy is related to the axiality and coordination geometry of Dy(III). Complex 1 has a single phenol-oxygen bond with a short distance of 2.193 Å, dictating the orientation of the magnetic axis and anisotropy. However, the Ueff of complex 1 is obviously smaller than that (320 K under zero dc field) of a similar Dy(III) complex [Dy(LR)(H2O)4(MeCN)](ClO4)3·2H2O·MeCN (LR = salicylaldehyde rhodamine 6G hydrazone) with a single short Dy-Ophenoxo bond of 2.175 Å [26]. Careful examination of the crystal structure shows that both complexes have eight-coordinate Dy(III) and different coordination geometry: Cs for complex 1 and D2d for the latter. Higher coordination geometry usually favors higher Ueff. Besides, the coordination of nitrate anion in the equatorial positions attenuates the magnetic anisotropy and further Ueff.
4. Conclusions
In this work, we have developed new Schiff base ligands HL1 and H2L2 to obtain a series of Ln(III) complexes from mononuclear to tetranuclear. The mononuclear complex 1 features a ring-opened ligand upon crystallization, and it emits a strong green fluorescence emission at 569 nm in ethanol. Magnetic characterization reveals that complex 1 is a typical field-induced SMM with a Ueff of 33.2(10) K under an applied magnetic field of 600 Oe. The ab initio calculations have revealed that complex 1 exhibits high magnetic anisotropy. The DC magnetic susceptibility shows that there is an intramolecular ferromagnetic coupling in the Dy4 complex (2), whereas complex 3 is weakly antiferromagnetic. The value of magnetic entropy change −∆Sm is 9.81 J kg–1 K–1 at 2 K and ∆H = 5 T, showing that complex 3 can be used as a magnetic refrigeration material.
In summary, the careful selection of ligands and the rational control of coordination modes have led to the development of fluorescent lanthanide single-molecule magnets (Ln-SMMs) and a magnetic refrigeration material. This approach, as demonstrated in recent studies, allows for the fine-tuning of magnetic properties, which is crucial for advancing applications in fields such as information storage, quantum computing, and biomedical detection.
Supplementary Materials
The following supporting information can be downloaded at the website of this paper posted on Preprints.org, Figure S1. The polyhedral structures around the Dy(III) coordination in complex 1. Figure S2. Coordination mode of ligand HL1-o in complex 1. Figure S3. Hydrogen bonding in complex 1. Figure S4. One-dimensional chain structure via π-π stacking in complex 1. Figure S5. Dy4O6 core skeleton of complex 2. Figure S6. The polyhedral structures around the Dy(III) coordination in complex 2. Figure S7. Top and side views of the coordination polyhedron of the tetranuclear Dy(III) surrounding structures in complex 2. Figure S8. Coordination mode of ligand (L1-c)− and (L2)2− in complex 2. Figure S9. Infrared spectra of the ligand HL1 and complex 1. Figure S10. Infrared spectra of the ligands and complexes 2 and 3. Figure S11. UV-Vis spectra of the ligands and complexes 1-3. Figure S12. Fluorescence excitation spectra of complex 1. Figure S13. Fluorescence excitation spectra of complexes 2 and 3. Figure S14. Magnetization curves of the complex 1 (a) and 2 (b). Figure S15. Magnetization curves and Brillouin curve at 2 K of complex 3. Figure S16. Temperature dependence of χ"M for complex 1 under 0 and 2000 Oe DC field. Figure S17. Plots of χ"M for complex 1 at 4 K and 997 Hz. Figure S18. The AC magnetic susceptibility data of complex 2 under 0 Oe: the χ’M (a) and χ"M (b) of AC magnetic susceptibility with temperature at different frequencies. Figure S19. Calculated complete structure of complex 1; H atoms are omitted for clarify. Table S1. Crystal data and refinement parameters for complexes 1-3. Table S2. Selected bond lengths (Å) and angles (º) for complex 1. Table S3. Selected bond lengths (Å) and angles (º) for complexes 2 and 3. Table S4. The results of coordination geometric configurations evaluated by SHAPE software for complex 1. Table S5. The results of coordination geometric configurations evaluated by SHAPE software for Dy1 of complex 2. Table S6. The results of coordination geometric configurations evaluated by SHAPE software for Dy2 of complex 2. Table S7. Cole-Cole plots fitting parameters for complex 1. Table S8. Calculated energy levels (cm−1), g (gx, gy, gz) tensors and predominant mJ values of the lowest eight Kramers doublets (KDs) of complex 1 using CASSCF/RASSI-SO with the OpenMolcas. Table S9. Wave functions with definite projection of the total moment | mJ > for the lowest eight KDs of complex 1. Table S10. Calculated crystal-field parameters B (k, q) and corresponding weights for compound 1 using CASSCF/RASSI-SO with the OpenMolcas.
Author Contributions
Conceptualization and formal analysis, L.M. and C.M.L.; ab initio calculations, D.M.Z.; writing—original draft preparation, L.M. and D.M.Z.; writing—review and editing, supervision, project administration and funding acquisition, H.Z.K. and Y.Q.Z.. All authors have read and agreed to the published version of the manuscript.
Funding
This research was funded by the National Natural Science Foundation of China, grant numbers 22271171 and 21971142.
Conflicts of Interest
The authors declare no conflicts of interest.
Abbreviations
The following abbreviations are used in this manuscript:
| SMMs | Single-molecule magnets |
| PXRD | Powder X-ray diffraction |
| LLCT | Ligand-to-ligand charge transfer |
| DC | Direct current |
| AC | Alternating current |
| MCE | Magnetocaloric effect |
| χ"M | Out-of-phase AC susceptibilities |
| QTM | Quantum tunneling of the magnetization |
| CASSCF | Complete-active-space self-consistent field |
| KDs | Kramers doublets |
| TA-QTMs | Thermal-assisted QTMs |
| CF | Crystal-field |
References
- Caneschi, A.; Gatteschi, D.; et al. Alternating current susceptibility, high field magnetization, and millimeter band EPR evidence for a ground S = 10 state in [Mn12O12(CH3COO)16(H2O)4]·2CH3COOH·4H2O. J. Am. Chem. Soc. 1991, 113, 5873–5874. [Google Scholar] [CrossRef]
- Sessoli, R.; Gatteschi, D.; Caneschi, A.; Novak, M. A. , Magnetic bistability in a metal-ion cluster. Nature 1993, 365, 141–143. [Google Scholar] [CrossRef]
- Aubin, S. M. J.; Wemple, M. W.; Adams, D. M.; Tsai, H.-L.; Christou, G.; Hendrickson, D. N. , Distorted MnIVMnIII3 Cubane Complexes as Single-Molecule Magnets. J. Am. Chem. Soc. 1996, 118, 7746–7754. [Google Scholar] [CrossRef]
- Friedman, J.-R.; Sarachik, M.-P. Macroscopic Measurement of Resonant Magnetization Tunneling in High-Spin Molecules. Phys. Rev. Lett. 1996, 76, 3830–3833. [Google Scholar] [CrossRef] [PubMed]
- Leuenberger M., N.; Loss D. J., N. Quantum computing in molecular magnets. Nature 2001, 410, 789–793. [Google Scholar] [CrossRef]
- Sorace, L.; Benelli, C.; Gatteschi, D. Lanthanides in Molecular Magnetism: Old Tools in a New Field. Chem. Soc. Rev, 2011, 40, 3092–3104. [Google Scholar] [CrossRef]
- Troiani, F.; Affronte, M. Molecular Spins for Quantum Information Technologies. Chem. Soc. Rev., 2011, 40, 3119–3129. [Google Scholar] [CrossRef]
- Wang, J.; Li, Q.-W.; Wu, S.-G.; Chen, Y.-C.; Wan, R.-C.; Huang, G.-Z.; Liu, Y.; Liu, J.-L.; Reta, D.; Giansiracusa, M.; Wang, Z.-X.; Chilton, N.; Tong, M.-L. Opening Magnetic Hysteresis by Axial Ferromagnetic Coupling: From Mono-Decker to Double-Decker Metallacrown. Angew. Chem. Int. Ed. 2021, 60, 5299. [Google Scholar]
- Wu, S.-G.; Ruan, Z.-Y.; Huang, G.-Z.; Zheng, J.-Y.; Vieru, V.; Taran, G.; Wang, J.; Chen, Y.-C.; Liu, J.-L.; Ho, L.; Chibotaru, L.; Wernsdorfer, W.; Chen, X.-M.; Tong, M.-L. Field-induced oscillation of magnetization blocking barrier in a holmium metallacrown single-molecule magnet. Chem 2021, 7, 982–992. [Google Scholar] [CrossRef]
- Jiang, S.-D.; Wang, B.-W.; Sun, H.-L.; Wang, Z.-M.; Gao, S. An Organometallic Single-Ion Magnet. J. Am. Chem. Soc. 2011, 133, 4730–4733. [Google Scholar] [CrossRef]
- Goodwin, C.; Ortu, F.; Reta, D.; Chilton, N.; Mills, D. Molecular magnetic hysteresis at 60 kelvin in dysprosocenium. Nature 2017, 548, 439–442. [Google Scholar] [CrossRef] [PubMed]
- Guo, F.-S.; Day, B.; Chen, Y.-C.; Tong, M.-L.; Mansikkamäki, A.; Layfield, R. Magnetic hysteresis up to 80 kelvin in a dysprosium metallocene single-molecule magnet. Science 2018, 362, 1400–1403. [Google Scholar] [CrossRef]
- Gould, C.; McClain, R.; Reta, D.; Kragskow, J.; Marchiori, D.; Lachman, E.; Choi, E.-S.; Analytis, J.; Britt, D.; Chilton, N.; Harvey, N.; Long, J. Ultrahard Magnetism from Mixed-Valence Dilanthanide Complexes with Metal-Metal Bonding. Science 2022, 375, 198–202. [Google Scholar] [CrossRef]
- Shang, T.; Lu, F.; Tao, J.; Zhang, Y.-Q. Understanding the Magnetic Relaxation Mechanism in Mixed-Valence Dilanthanide Complexes with Metal–Metal Bonding: A Theoretical Investigation. J. Phys. Chem. A 2023, 127, 3088–3095. [Google Scholar] [CrossRef] [PubMed]
- Hojorat, M.; Sabea, H.-A.; Norel, L.; Bernot, K.; Roisnel, T.; Gendron, F.; Guennic, B.; Trzop, E.; Collet, E.; Long, J.; Rigaut, S. Hysteresis Photomodulation via Single-Crystal-to-Single-Crystal Isomerization of a Photochromic Chain of Dysprosium Single Molecule Magnets. J Am. Chem. Soc. 2020, 142, 931–936. [Google Scholar] [CrossRef] [PubMed]
- Bünzli, J.-C. Benefiting from the Unique Properties of Lanthanide Ions, Acc. Chem. Res. 2006, 39, 53–61. [Google Scholar] [CrossRef]
- Jia, J.-H.; Li, Q.-W.; Chen, Y.-C.; Liu, J.-L.; Tong, M.-L. Luminescent single-molecule magnets based on lanthanides: Design strategies, recent advances and magneto-luminescent studies. Coord. Chem. Rev, 2019, 378, 365–381. [Google Scholar] [CrossRef]
- Ruiz, J.; Mota, A.; Rodríguez-Diéguez, A.; Titos, S.; Herrera, J.; Ruiz, E.; Cremades, E.; Costes, J.; Colacio, E. Field and Dilution Effects on the Slow Relaxation of a Luminescent DyO9 Low-Symmetry Single-Ion Magnet. Chem. Commun. 2012, 48, 7916–7918. [Google Scholar] [CrossRef]
- Bi, Y.; Chen, C.; Zhao, Y.-F.; Zhang, Y.-Q.; Jiang, S.-D.; Wang, B.-W.; Han, J.-B.; Sun, J.-L.; Bian, Z.-Q.; Wang, Z.-M.; Gao, S. Thermostability and Photoluminescence of Dy(Ⅲ) Single-Molecule Magnets Under a Magnetic Field. Chem. Sci., 2016, 7, 5020–5031. [Google Scholar] [CrossRef]
- Zeng, M.; Zhou, Z.-Y.; Wu, X.-R.; Liu, C.-M.; Kou, H.-Z. Assembly of a Heterotrimetallic Zn2Dy2Ir Pentanuclear Complex toward Multifunctional Molecular Materials. Inorg. Chem. 2022, 61, 14275–14281. [Google Scholar] [CrossRef]
- Liu, K.; Zhang, X.-J.; Meng, X.-X.; Shi, W.; Cheng, P.; Powell, A. Constraining the Coordination Geometries of Lanthanide Centers and Magnetic Building Blocks in Frameworks: a New Strategy for Molecular Nanomagnets. Chem. Soc. Rev. 2016, 45, 2423–2439. [Google Scholar] [CrossRef]
- Wang, X.-Q.; Geng, Y.-. Wei Zhimo Wang, Changjian Xie, Tian Han, Peng Cheng, Two-Dimensional Metal−Organic Framework with HighPerformance Single-Molecule Magnets as Nodes Showing Magnetic Coercivity Photomodulation. J. Am. Chem. Soc. 2025, 147, 21, 18044–18053. [Google Scholar] [PubMed]
- Yuan, J.; Wu, S.-Q.; Liu, M.-J.; Sato, O.; Kou, H.-Z. Rhodamine 6G-Labeled Pyridyl Aroylhydrazone Fe(II) Complex Exhibiting Synergetic Spin Crossover and Fluorescence. J. Am. Chem. Soc. 2018, 140, 9426–9433. [Google Scholar] [CrossRef]
- Yuan, J.; Liu, M.-J.; Wu, S.-Q.; Zhu, X.; Zhang, N.; Sato, O.; Kou, H.-Z. , Substituent effects on the fluorescent spin-crossover Fe(II) complexes of rhodamine 6G hydrazones. Inorg. Chem. Front. 2019, 6, 1170–1176. [Google Scholar] [CrossRef]
- Liu, M.-J.; Yuan, J.; Tao, J.; Zhang, Y.-Q.; Liu, C.-M.; Kou, H.-Z. , Rhodamine Salicylaldehyde Hydrazone Dy(III) Complexes: Fluorescence and Magnetism. Inorg. Chem. 2018, 57, 4061–4069. [Google Scholar] [CrossRef]
- Liu, M.-J.; Wu, S.-Q.; Li, J.-X.; Zhang, Y.-Q.; Sato, O.; Kou, H.-Z. , Structural Modulation of Fluorescent Rhodamine-Based Dysprosium(III) Single-Molecule Magnets. Inorg. Chem. 2020, 59, 2308–2315. [Google Scholar] [CrossRef]
- Liu, M.-J.; Fu, Z.-Y.; Sun, R.; Yuan, J.; Liu, C.-M.; Zou, B.; Wang, B.-W.; Kou, H.-Z. , Mechanochromic and Single-Molecule Magnetic Properties of a Rhodamine 6G Dy(III) Complex. ACS Appl. Electron. Mater. 2021, 3, 1368–1374. [Google Scholar] [CrossRef]
- Miao, L.; Liu, M.-J.; Ding, M.-M.; Zhang, Y.-Q.; Kou, H.-Z. A Dy(III) Fluorescent Single-Molecule Magnet Based on a Rhodamine 6G Ligand. Inorganics 2021, 9, 51. [Google Scholar] [CrossRef]
- Miao, L.; Liu, M.-J.; Zeng, M.; Kou, H.-Z. Chiral Zn3Ln3 Hexanuclear Clusters of an Achiral Flexible Ligand. Inorg. Chem. 2023, 62, 12814–12821. [Google Scholar] [CrossRef]
- Guo, Y.-N.; Xu, G.-F.; Gamez, P.; Zhao, L.; Lin, S.-Y.; Deng, R.-P.; Tang, J.-K.; Zhang, H.-J. Two-Step Relaxation in a Linear Tetranuclear Dysprosium(III) Aggregate Showing Single-Molecule Magnet Behavior. J. Am. Chem. Soc. 2010, 132, 8538–8539. [Google Scholar] [CrossRef] [PubMed]
- Gschneidner, K. A.; Pecharsky, V. K. Thirty years of near room temperature magnetic cooling: Where we are today and future prospects. Int. J. Refrig. 2008, 31, 945–961. [Google Scholar] [CrossRef]
- Evangelisti, M.; Brechin, E. K. Recipes for enhanced molecular cooling. Dalton Trans. 2010, 39, 4672–4676. [Google Scholar] [CrossRef] [PubMed]
- Koskelo, E. C.; Liu, C.; Mukherjee, P.; Kelly, N. D.; Dutton, S. E. Free-Spin Dominated Magnetocaloric Effect in Dense Gd3+ Double Perovskites. Chem. Mater. 2022, 34, 3440–3450. [Google Scholar] [CrossRef] [PubMed]
- Lorusso, G.; Sharples, J. W.; Palacios, E.; Roubeau, O.; Brechin, E. K.; Sessoli, R.; Rossin, A.; Tuna, F.; McInnes, E. J. L.; Collison, D.; Evangelisti, M. A Dense Metal-Organic Framework for Enhanced Magnetic Refrigeration. Adv. Mater. 2013, 25, 4653–4656. [Google Scholar] [CrossRef]
- Yang, Y.; Zhang, Q.-C.; Pan, Y.-Y.; Long, L.-S.; Zheng, L.-S. Magnetocaloric effect and thermal conductivity of Gd(OH)3 and Gd2O(OH)4(H2O)2. Chem. Commun. 2015, 51, 7317–7320. [Google Scholar] [CrossRef]
- Palacios, E.; Rodríguez-Velamazán, J. A.; Evangelisti, M.; McIntyre, G. J.; Lorusso, G.; Visser, D.; de Jongh, L. J.; Boatner, L. A. Magnetic structure and magnetocalorics of GdPO4. Phys. Rev. B: Condens. Mater. Phys. 2014, 90, 214423. [Google Scholar] [CrossRef]
- Chen, Y.-C.; Qin, L.; Meng, Z.-S.; Yang, D.-F.; Wu, C.; Fu, Z.; Zheng, Y.-Z.; Liu, J.-L.; Tarasenko, R.; Orendáč, M.; Prokleška, J.; Sechovský, V.; Tong, M.-L. Study of a magnetic-cooling material Gd(OH)CO3. J. Mater. Chem. A 2014, 2, 9851–9858. [Google Scholar] [CrossRef]
- Chen, Y.-C.; Prokleška, J.; Xu, W.-J.; Liu, J.-L.; Liu, J.; Zhang, W.-X.; Jia, J.-H.; Sechovský, V.; Tong, M.-L. A brilliant cryogenic magnetic coolant: magnetic and magnetocaloric study of ferromagnetically coupled GdF3. J. Mater. Chem. C 2015, 3, 12206–12211. [Google Scholar] [CrossRef]
- Xu, Q. F.; Liu, B. L.; Ye, M. Y.; Zhuang, G. L.; Long, L. S.; Zheng, L. S. Gd(OH)F2: A Promising Cryogenic Magnetic Refrigerant. J. Am. Chem. Soc. 2022, 144, 13787–13793. [Google Scholar] [CrossRef]
- Chen, Y. W.; Gong, P. F.; Guo, R. X.; Fan, F. D.; Shen, J.; Zhang, G. C.; Tu, H. Improvement on Magnetocaloric Effect through Structural Evolution in Gadolinium Borate Halides Ba2Gd(BO3)2X (X = F, Cl). Inorg. Chem. 2023, 62, 15584–15592. [Google Scholar] [CrossRef]
- Galván, I. F.; Vacher, M.; Alavi, A.; Angeli, C.; Aquilante, F.; Autschbach, J.; Bao, J. J.; Bokarev, S. I.; Bogdanov, N. A.; Carlson, R. K.; Chibotaru, L. F.; Creutzberg, J.; Dattani, N.; Delcey, M. G.; Dong, S. S.; Dreuw, A.; Freitag, L.; Frutos, L. M.; Gagliardi, L.; Gendron, F.; Giussani, A.; González, L.; Grell, G.; Guo, M. Y.; Hoyer, C. E.; Johansson, M.; Keller, S.; Knecht, S.; Kovacevic, G.; Källman, E.; Manni, G. L.; Lundberg, M.; Ma, Y. J.; Mai, S.; Malhado, J. P.; Malmqvist, P. Å.; Marquetand, P.; Mewes, S. A.; Norell, J.; Olivucci, M.; Oppel, M.; Phung, Q. M.; Pierloot, K.; Plasser, F.; Reiher, M.; Sand, A. M.; Schapiro, I.; Sharma, P.; Stein, C. J.; Sørensen, L. K.; Truhlar, D. G.; Ugandi, M.; Ungur, L.; Valentini, A.; Vancoillie, S.; Veryazov, V.; Weser, O.; Wesołowski, T. A.; Widmark, P.; Wouters, S.; Zech, A.; Zobel, J. P.; Lindh, R. OpenMolcas: From Source Code to Insight. J. Chem. Theory Comput. 2019, 15, 5925–5964. [Google Scholar] [CrossRef] [PubMed]
- Chibotaru, L. F.; Ungur, L.; Soncini, A. The Origin of Nonmagnetic Kramers Doublets in the Ground State of Dysprosium Triangles: Evidence for a Toroidal Magnetic Moment. Angew. Chem., Int. Ed., 2008, 47, 4126–4129. [Google Scholar] [CrossRef] [PubMed]
- Ungur, L.; Van den Heuvel, W.; Chibotaru, L. F. Ab initio investigation of the non-collinear magnetic structure and the lowest magnetic excitations in dysprosium triangles. New J. Chem. 2009, 33, 1224–1230. [Google Scholar] [CrossRef]
- Chibotaru, L. F.; Ungur, L.; Aronica, C.; Elmoll, H.; Pilet, G.; Luneau, D. Structure, Magnetism, and Theoretical Study of a Mixed-Valence CoII3CoIII4 Heptanuclear Wheel: Lack of SMM Behavior despite Negative Magnetic Anisotropy. J. Am. Chem. Soc. 2008, 130, 12445–12455. [Google Scholar] [CrossRef]
- Lunghi, A.; Totti, F.; Sessoli, R.; Sanvito, S. The role of anharmonic phonons in under-barrier spin relaxation of single molecule magnets. Nat. Commun. 2017, 8, 14620–14626. [Google Scholar] [CrossRef] [PubMed]
- Lu, F.; Ding, M. M.; Li, J. X.; Wang, B. L.; Zhang, Y. Q. Why lanthanide ErIII SIMs cannot possess huge energy barriers: a theoretical investigation. Dalton Trans. 2020, 49, 14576–14583. [Google Scholar] [CrossRef]
- Lu, F.; Guo, W. X.; Zhang, Y. Q. Largely Enhancing the Blocking Energy Barrier and Temperature of a Linear Cobalt(II) Complex through the Structural Distortion: A Theoretical Exploration. Inorg. Chem. 2022, 61, 295–301. [Google Scholar] [CrossRef]
- Ding, M. M.; Shang, T.; Hu, R.; Zhang, Y. Q. Understanding the magnetic anisotropy for linear sandwich [Er(COT)]+-based compounds: a theoretical investigation. Dalton Trans. 2022, 51, 3295–3303. [Google Scholar] [CrossRef]
- Shang, T.; Lu, F.; Tao, J.; Zhang, Y. Q. Understanding the Magnetic Relaxation Mechanism in Mixed-Valence Dilanthanide Complexes with Metal–Metal Bonding: A Theoretical Investigation. J. Phys. Chem. A 2023, 127, 3088–3095. [Google Scholar] [CrossRef]
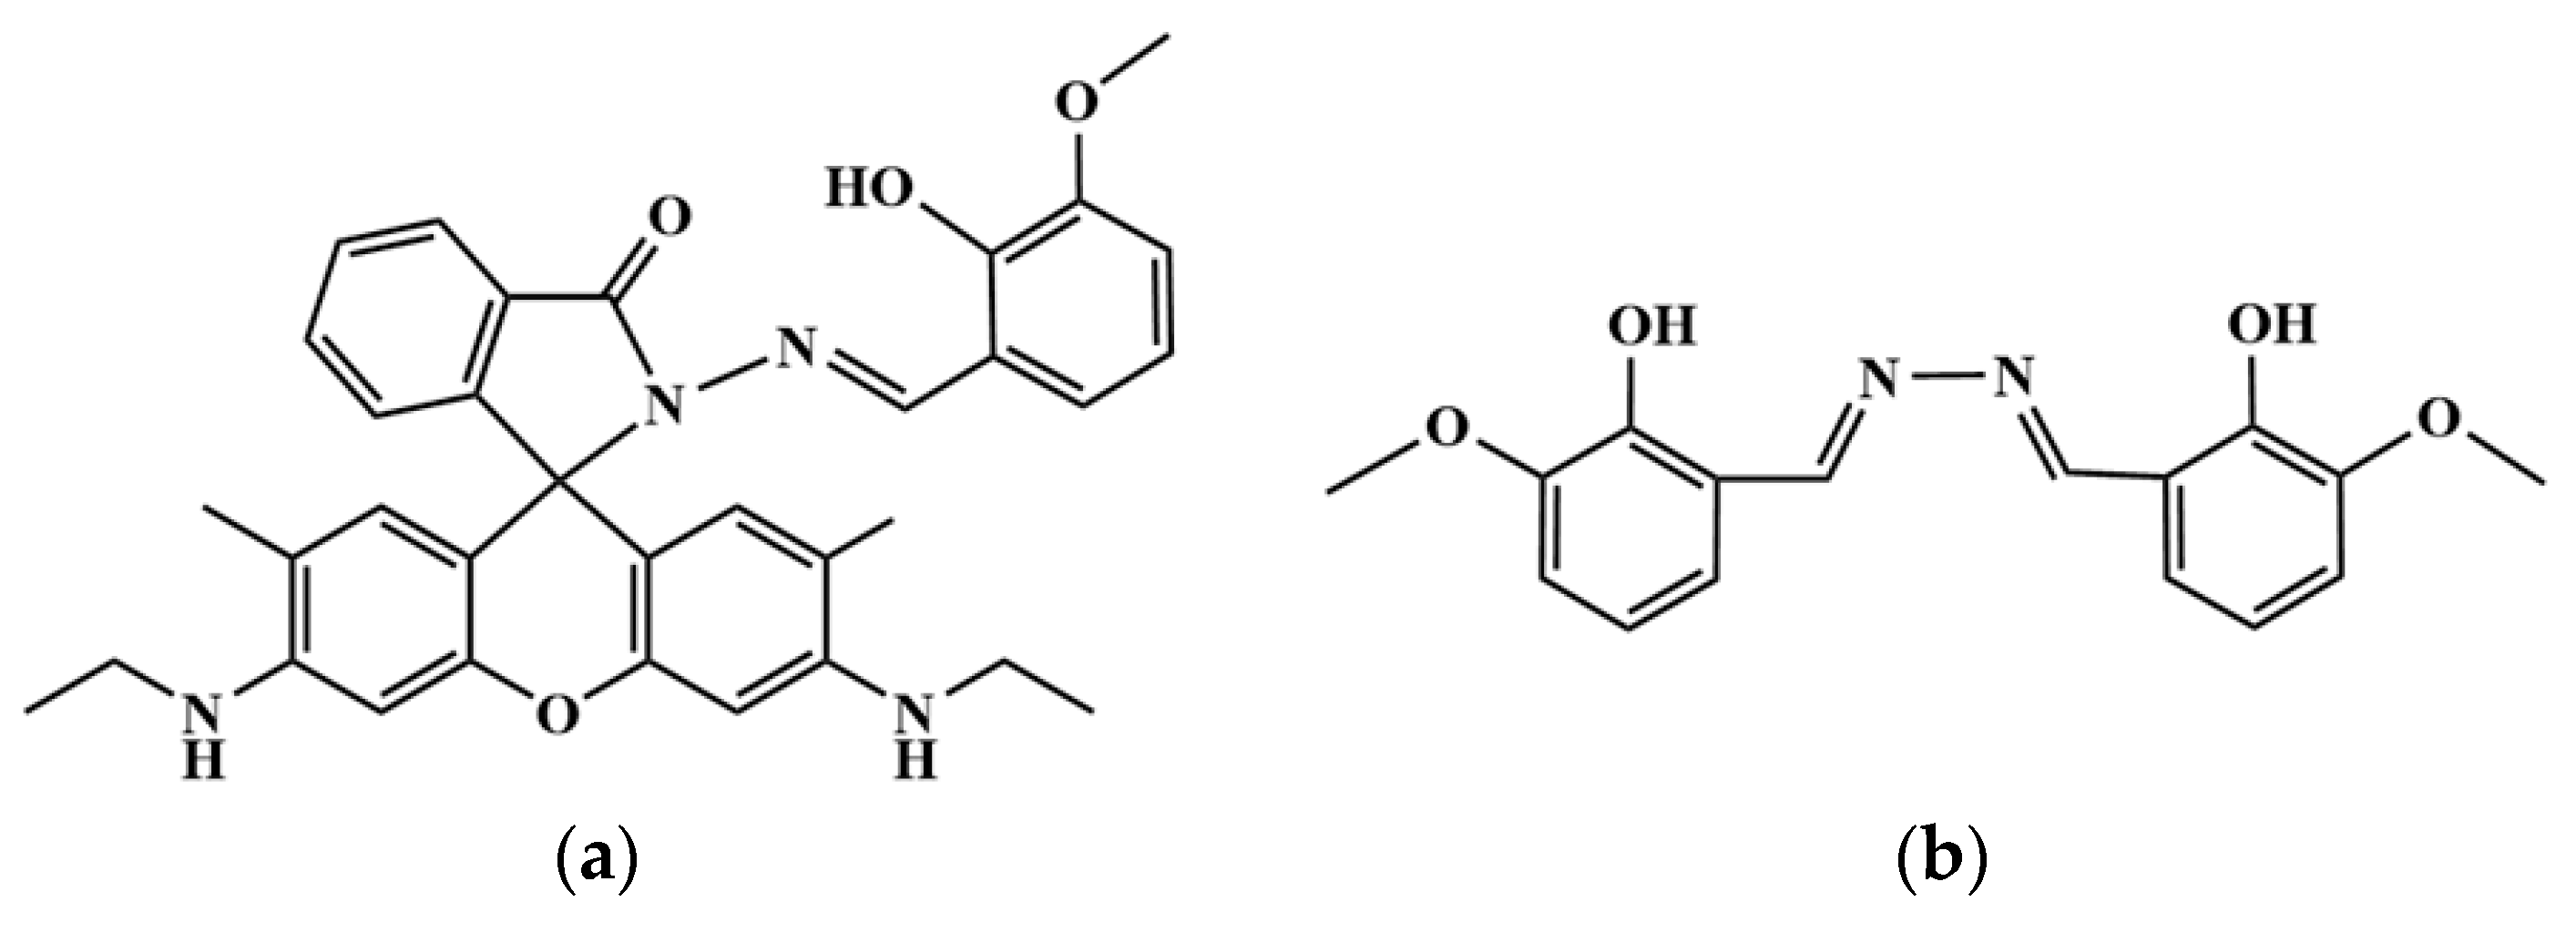
Scheme 1.
Structures of the Ligands HL1 (a) and H2L2 (b).
Scheme 2.
Transformation process of ring-opened HL1-o to ring-closed (L1-c)−.
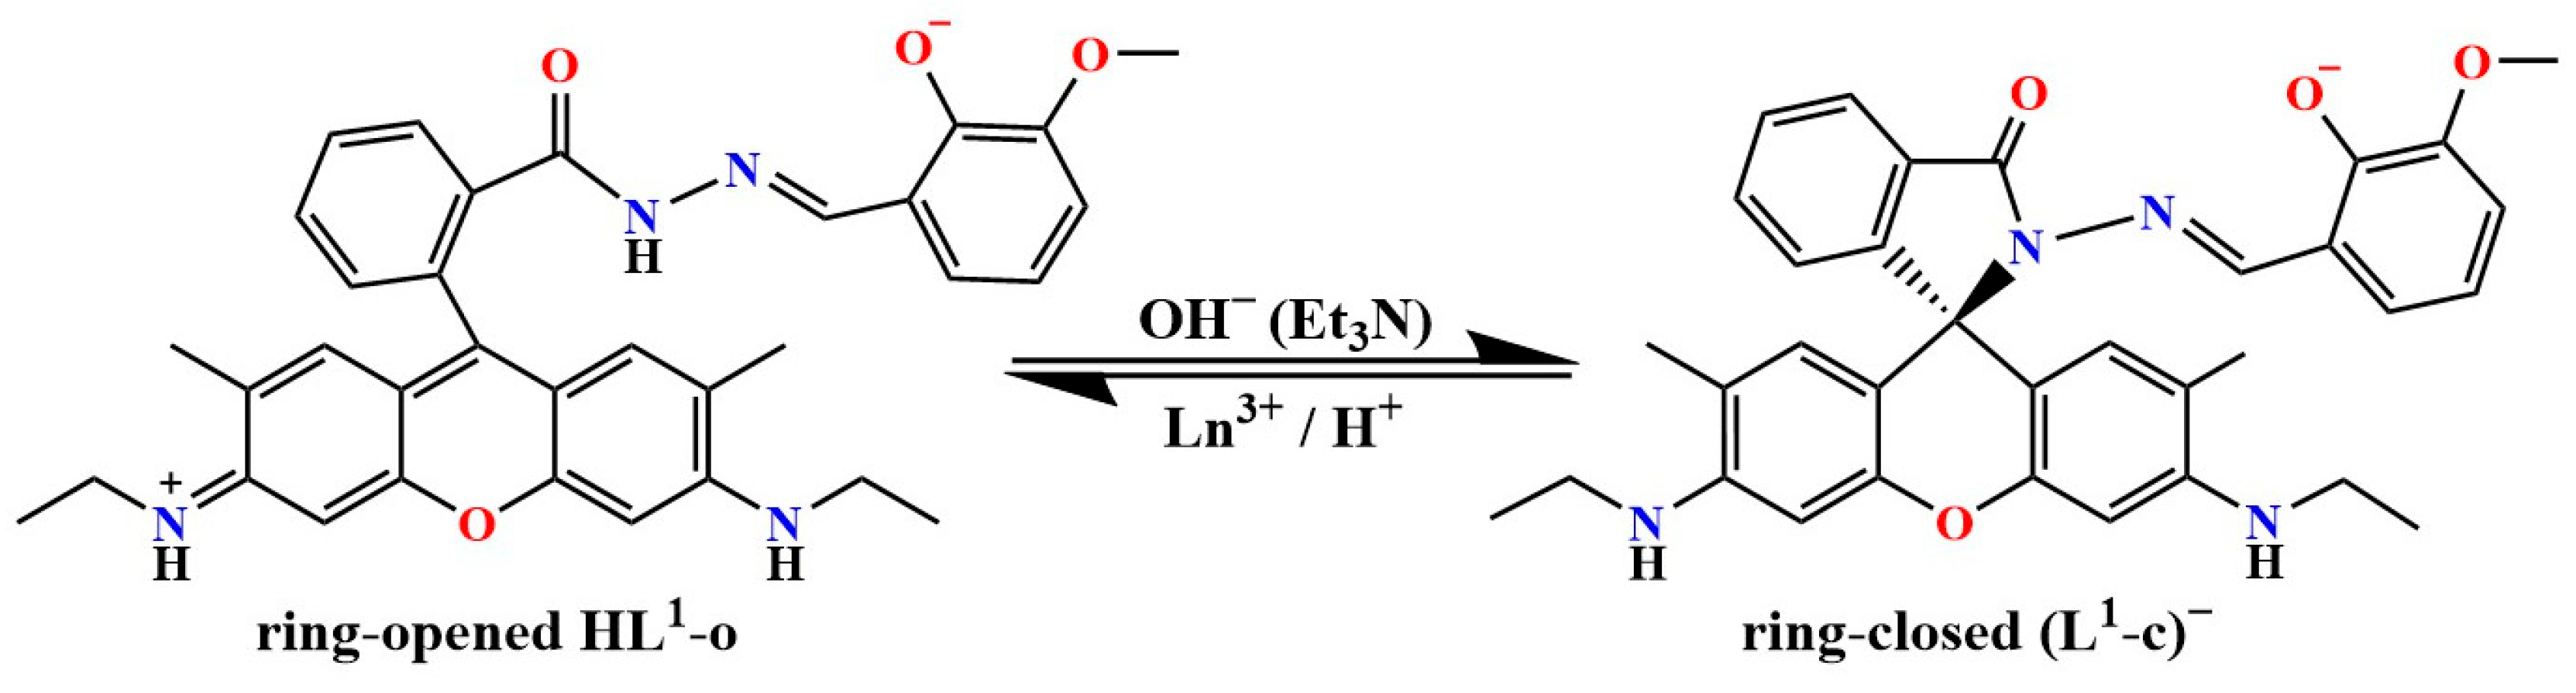
Figure 1.
The crystal structures of complexes 1 (a) and 2 (b). The lattice solvents and hydrogen atoms are omitted for clarity.
Figure 1.
The crystal structures of complexes 1 (a) and 2 (b). The lattice solvents and hydrogen atoms are omitted for clarity.
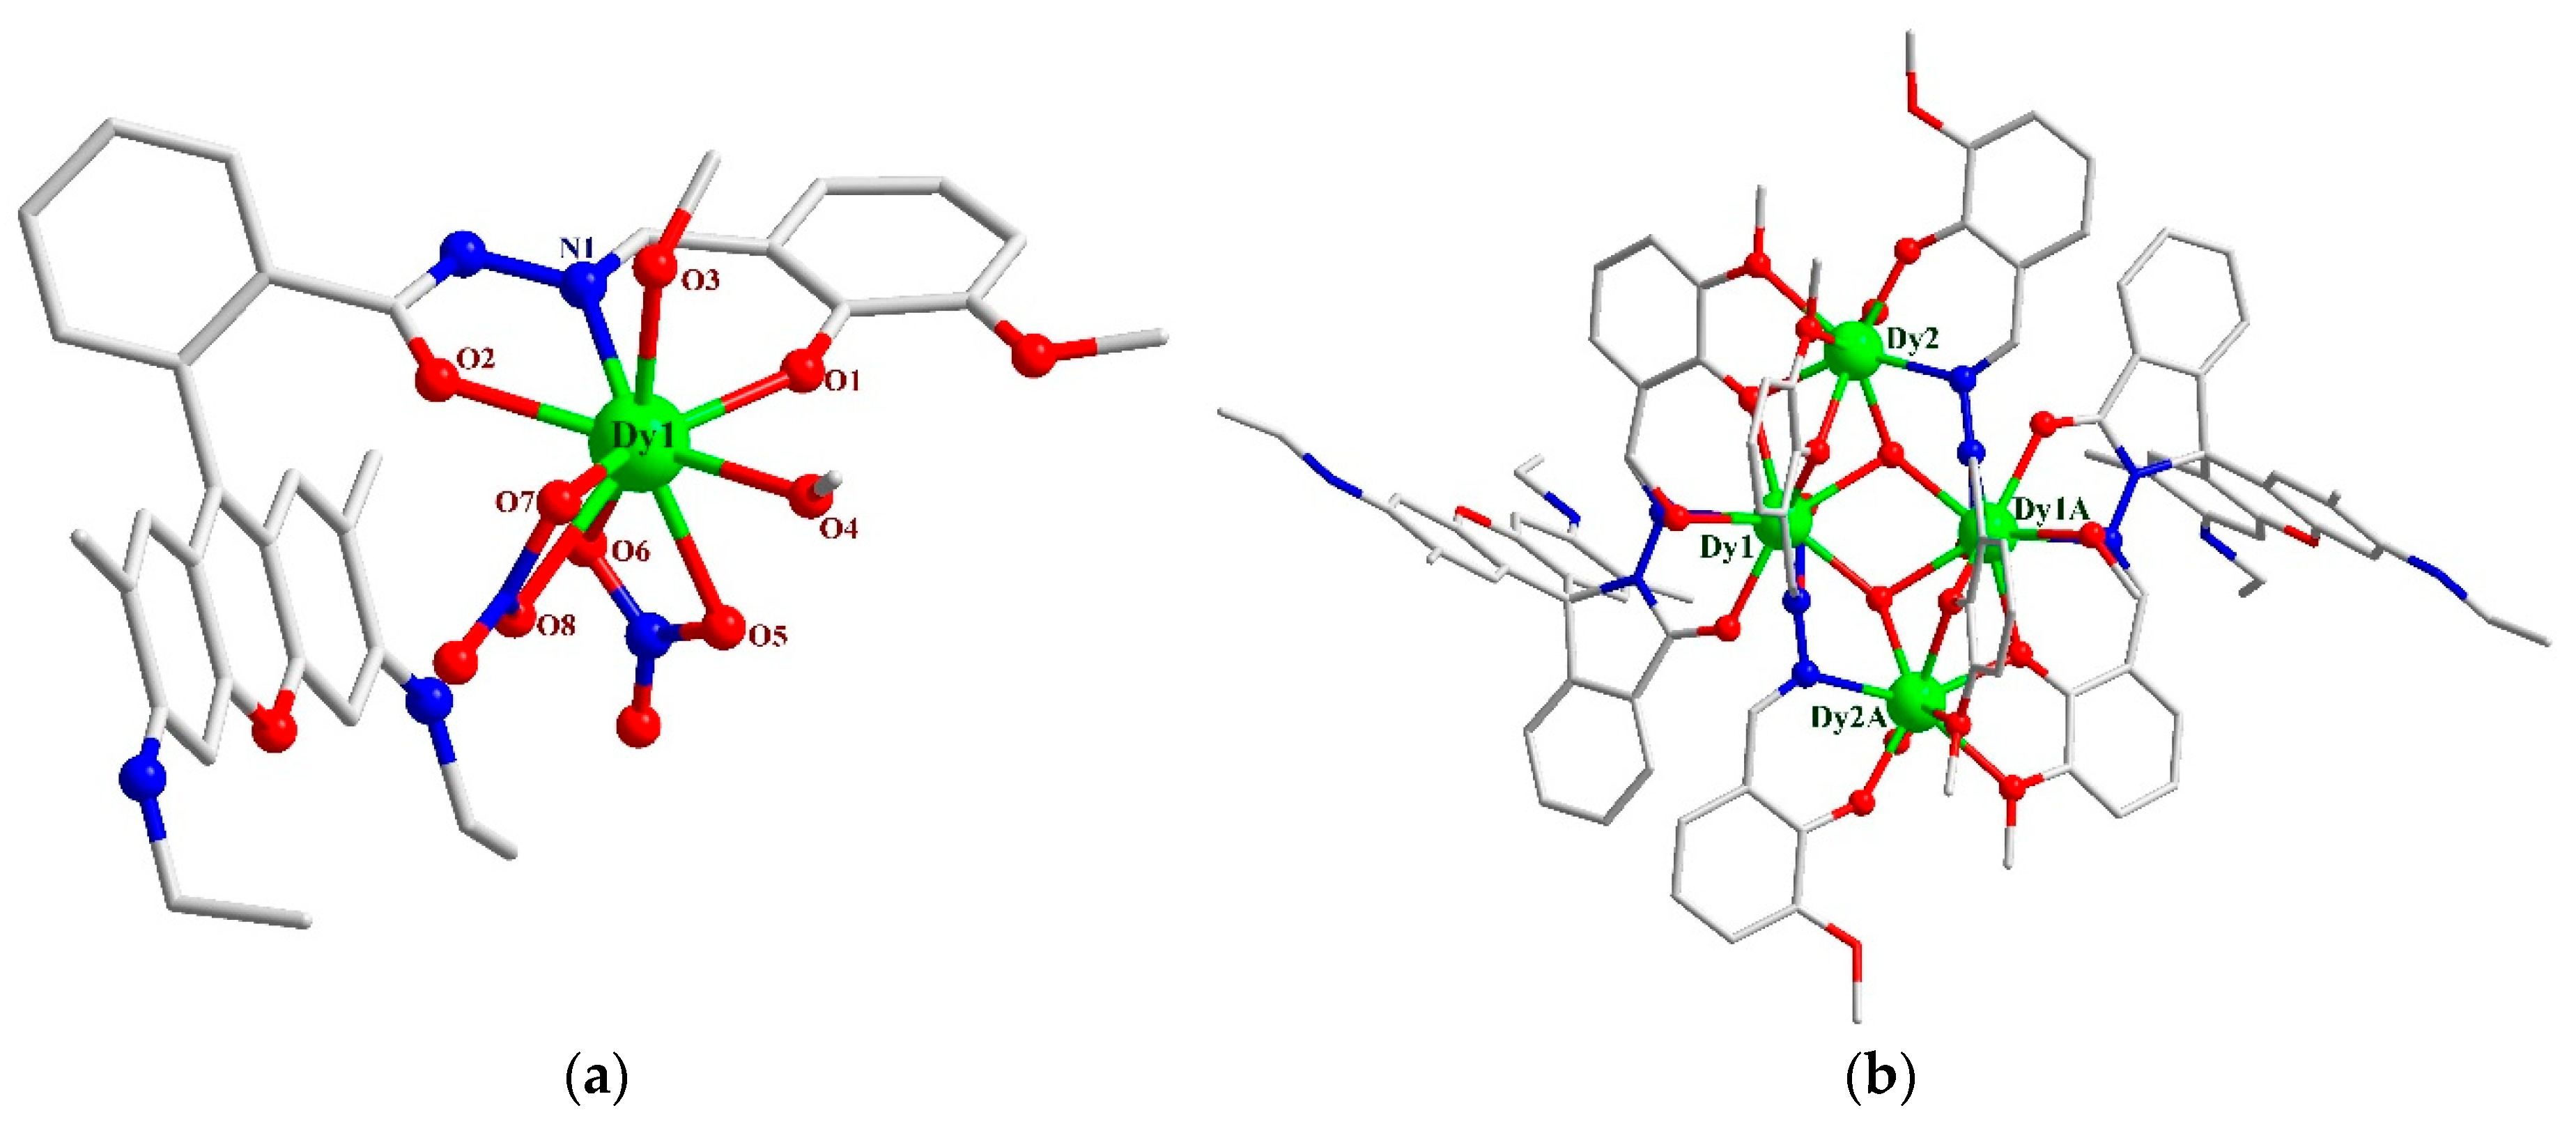
Figure 2.
Fluorescence spectra (λex = 354 nm) for complexes 1-3 in MeOH (10 μM).
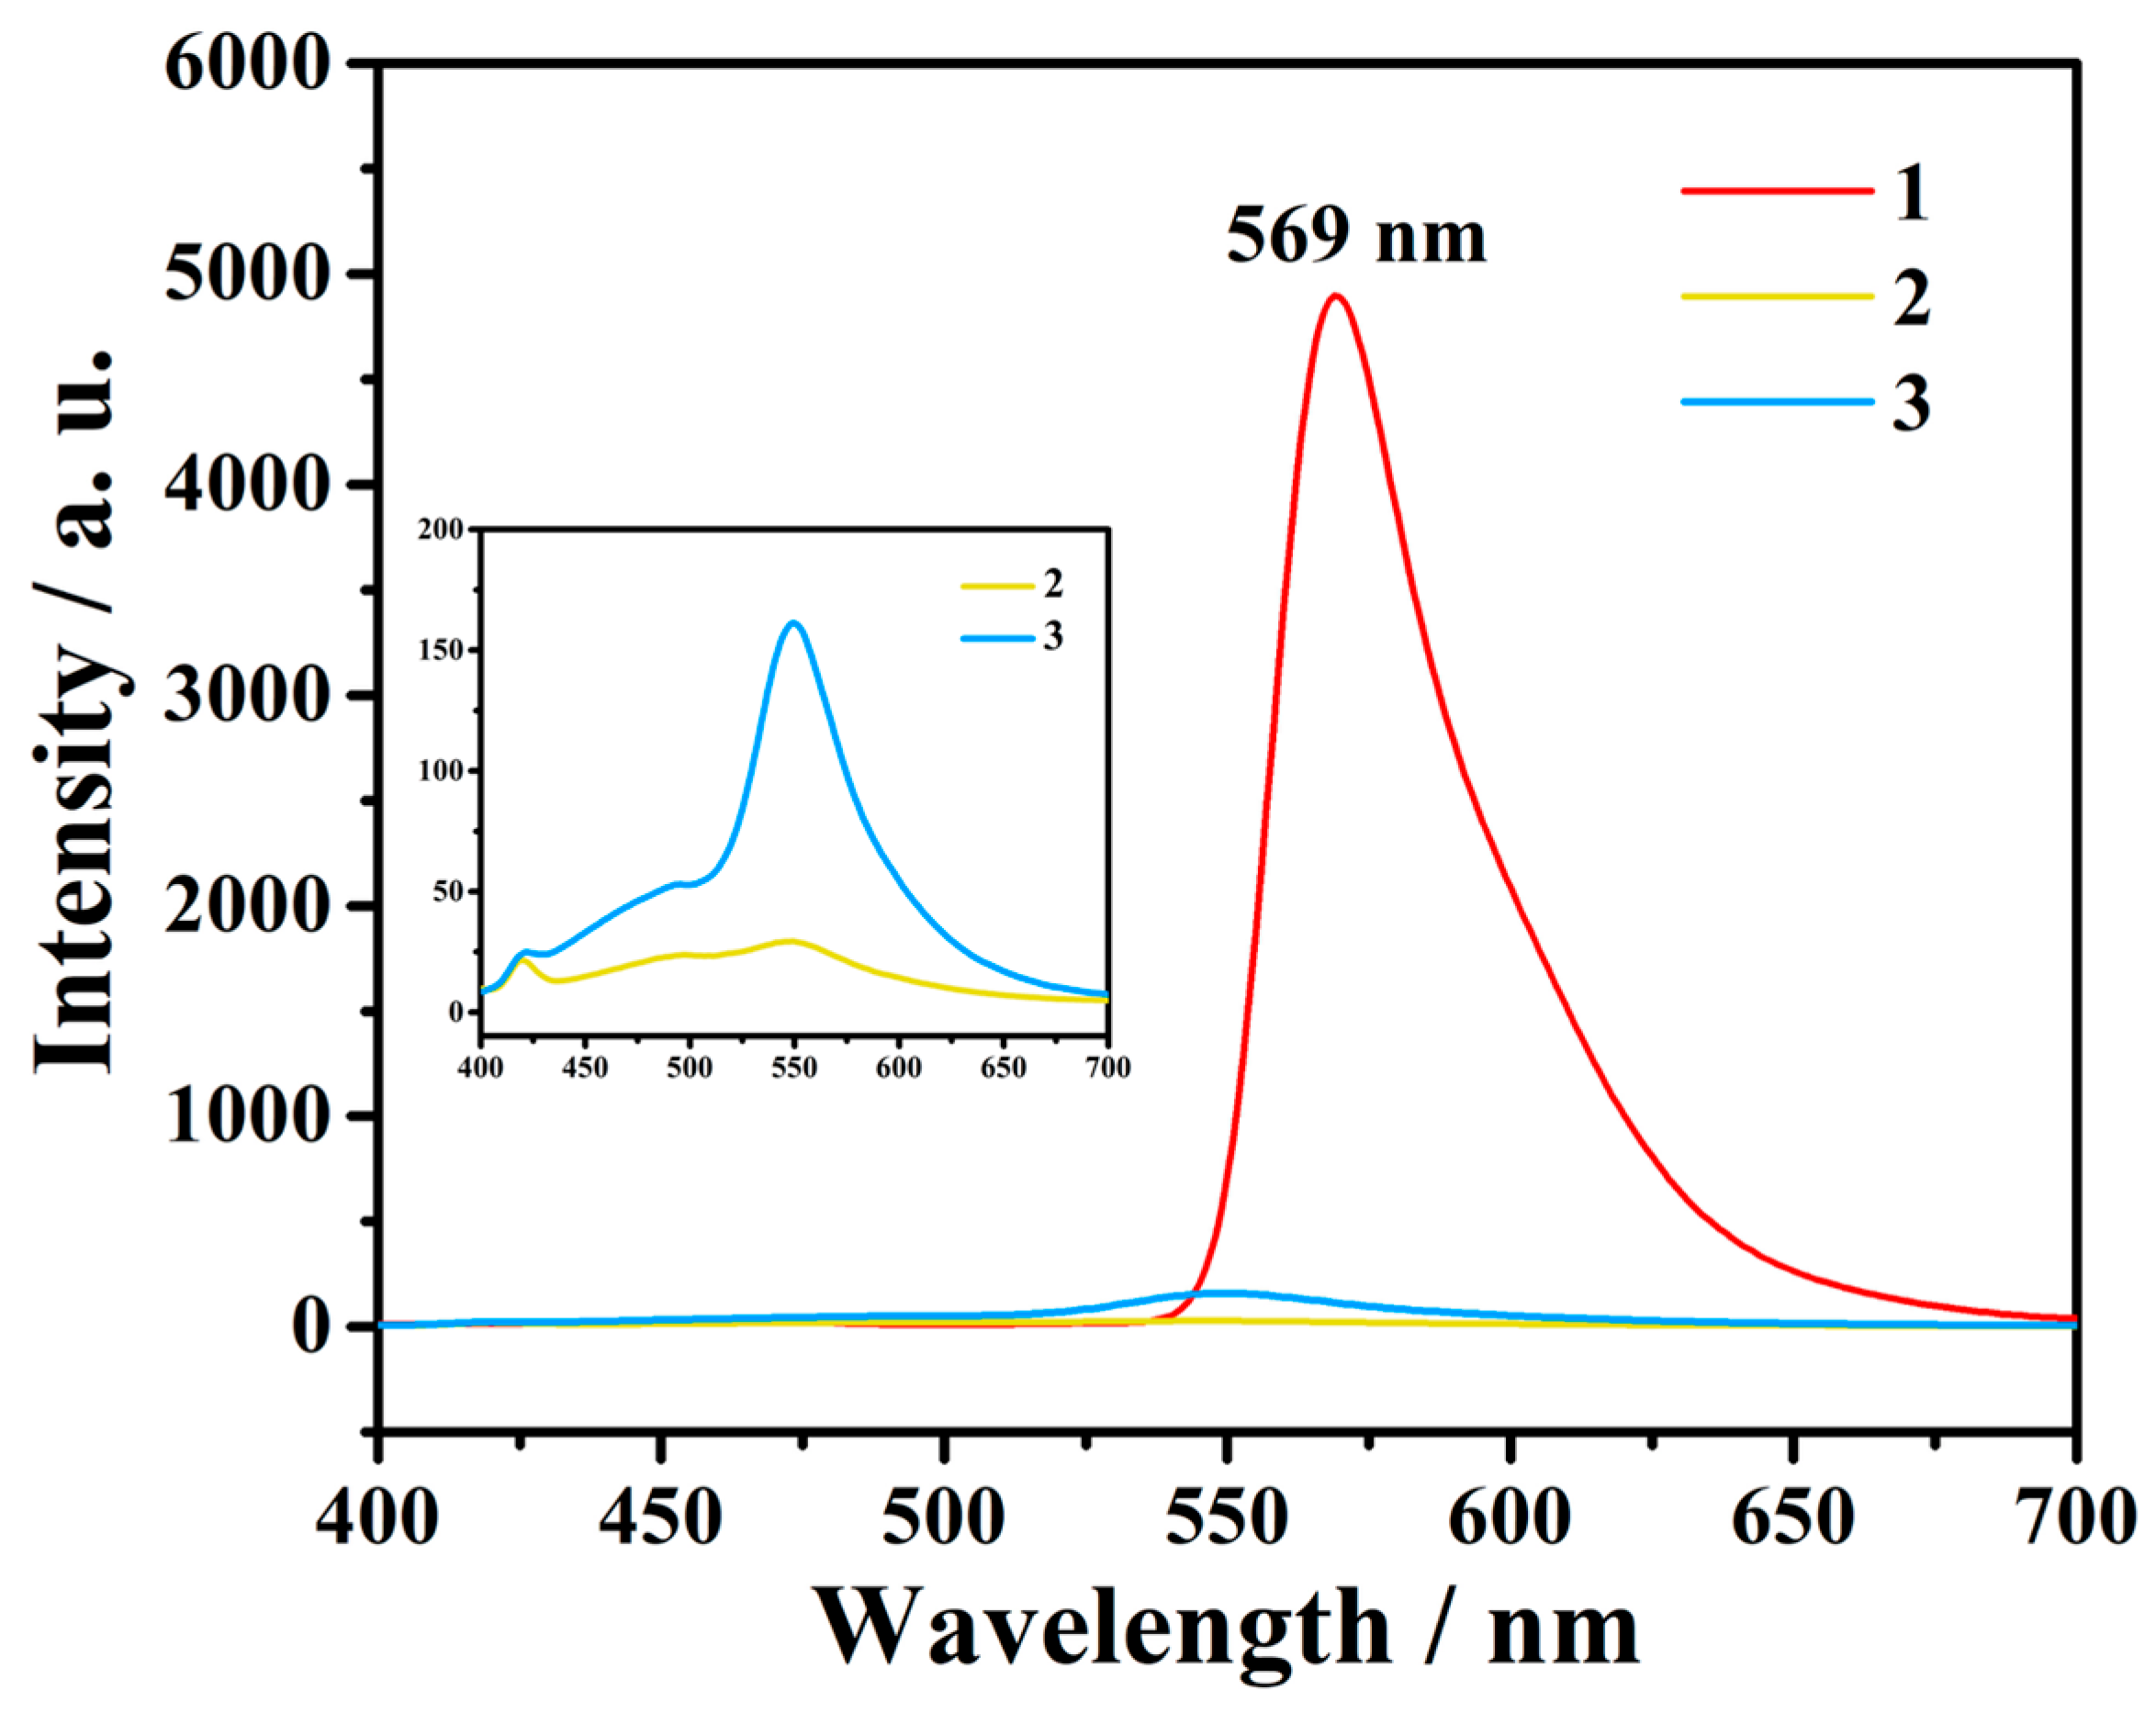
Figure 3.
Temperature dependence of χMT for complexes 1-3 at 2-300 K under 1000 Oe field.
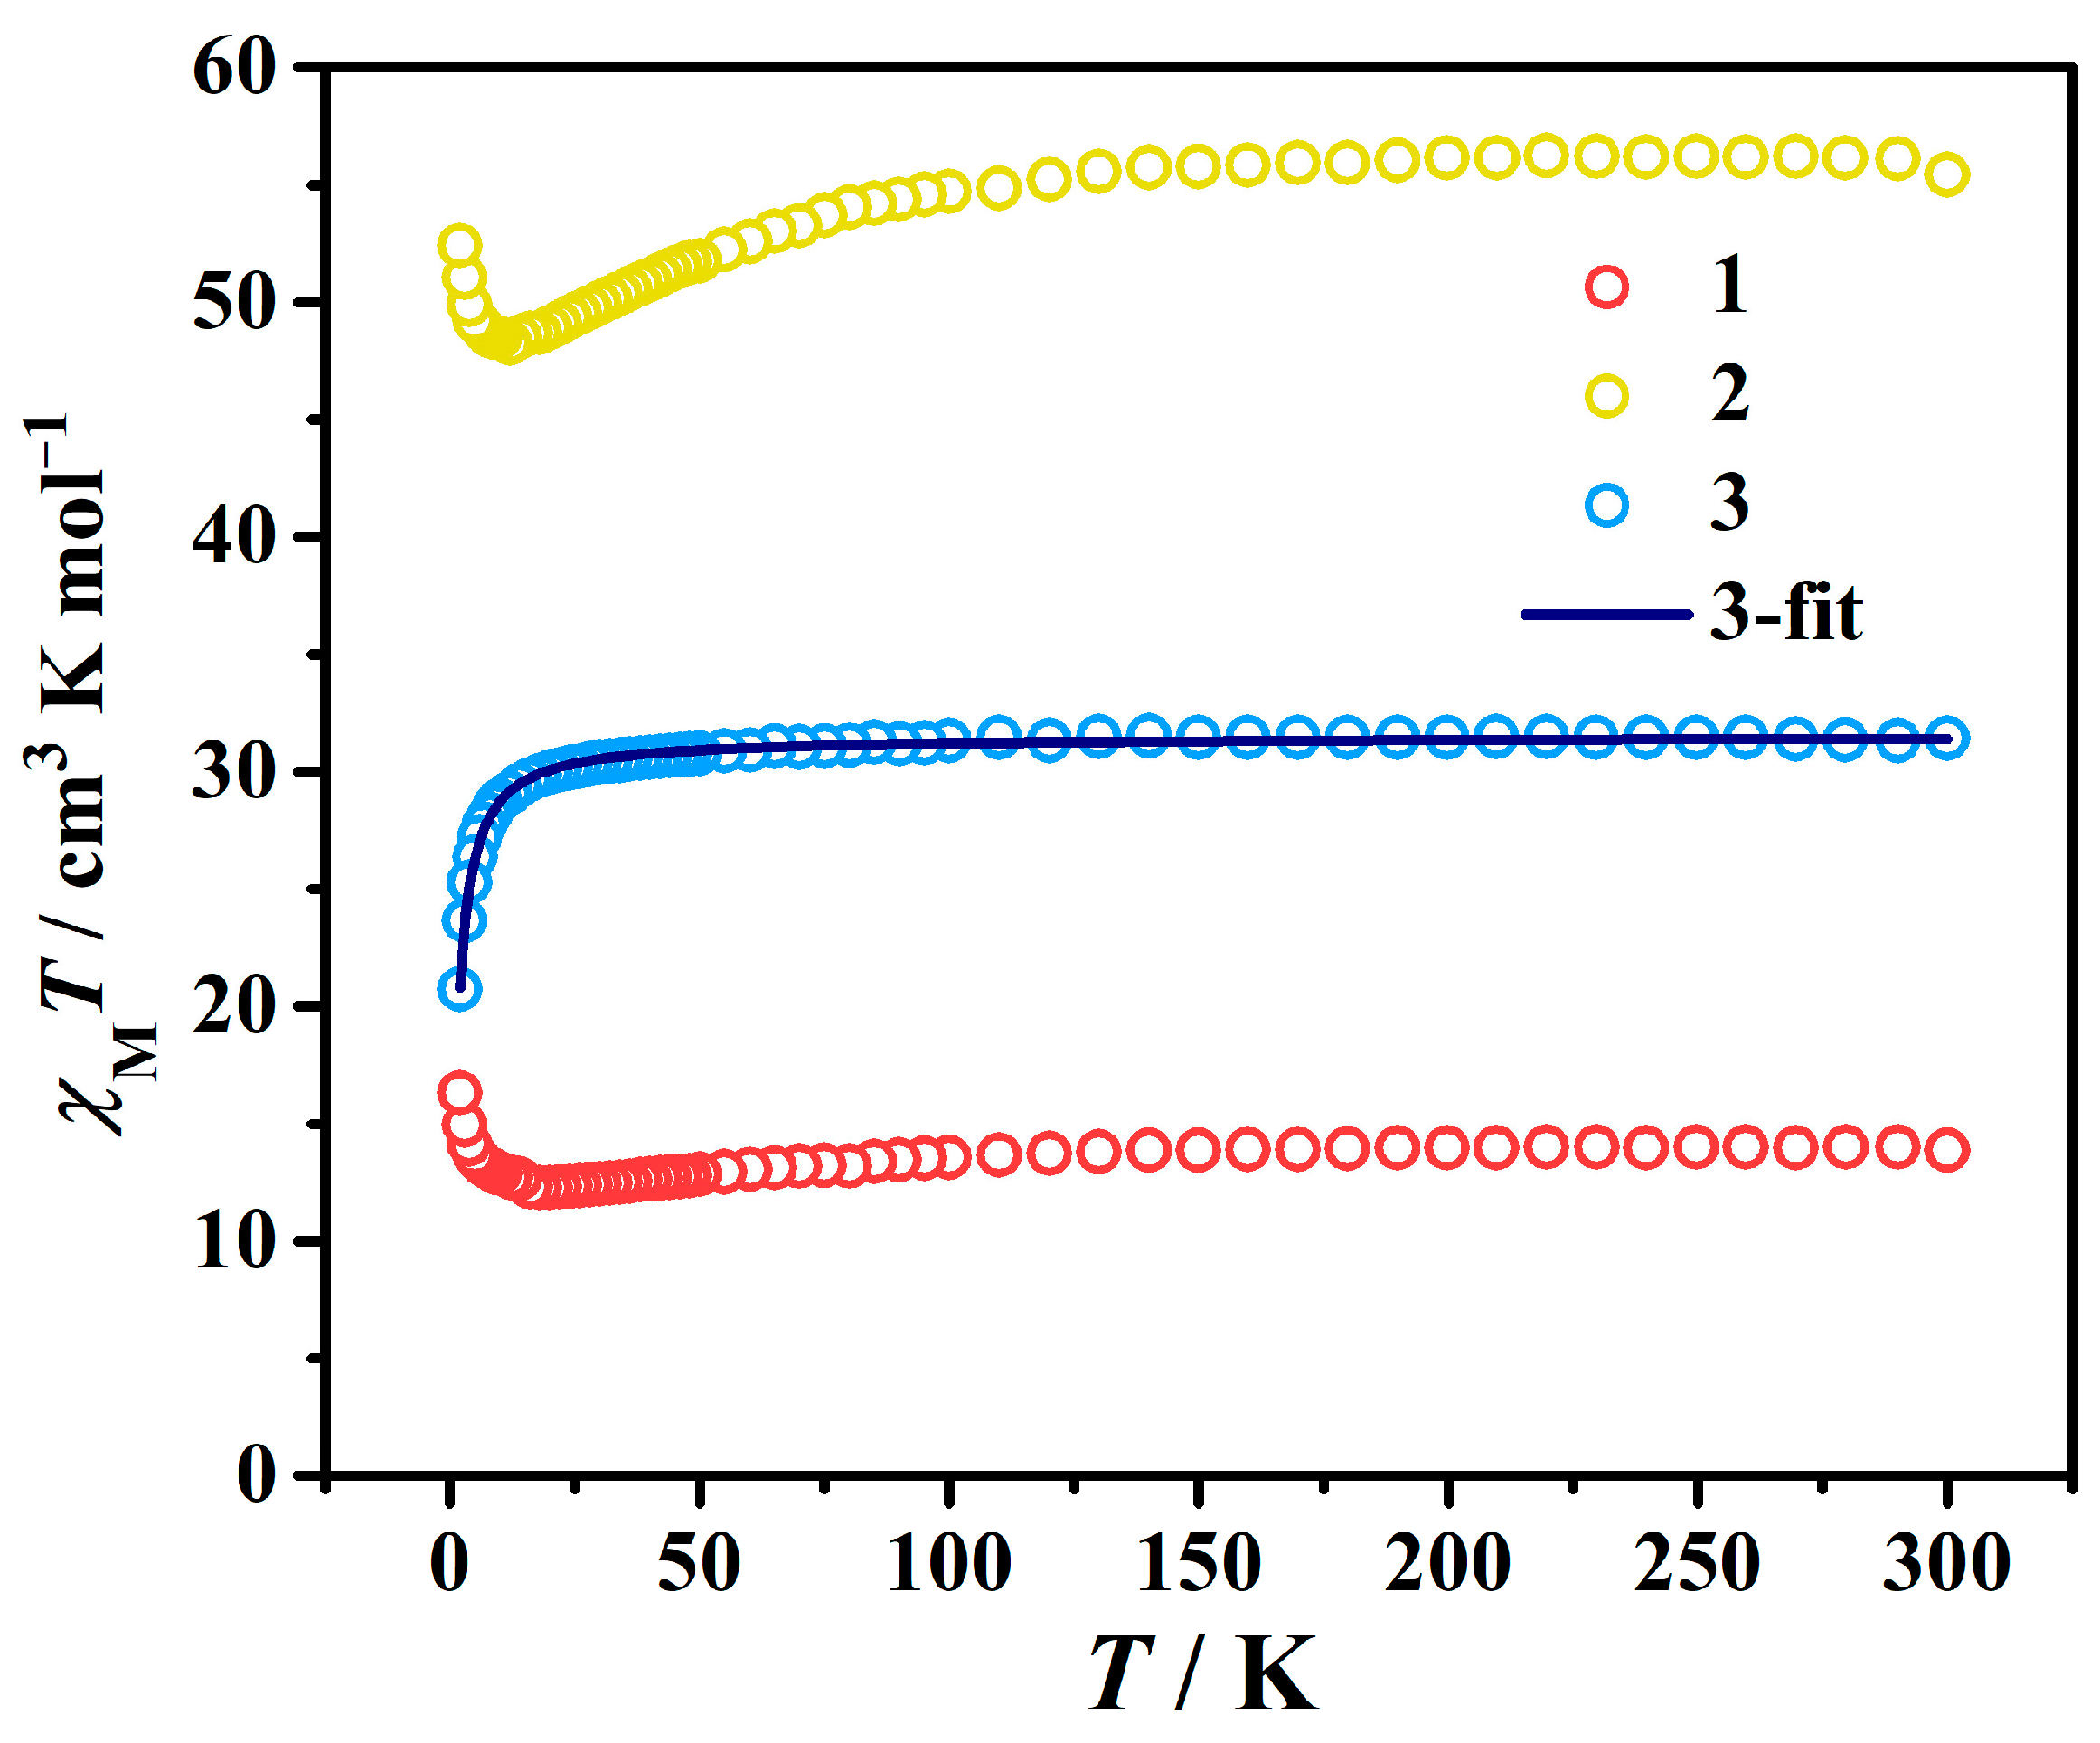
Figure 4.
Magnetization curves of complex 3.
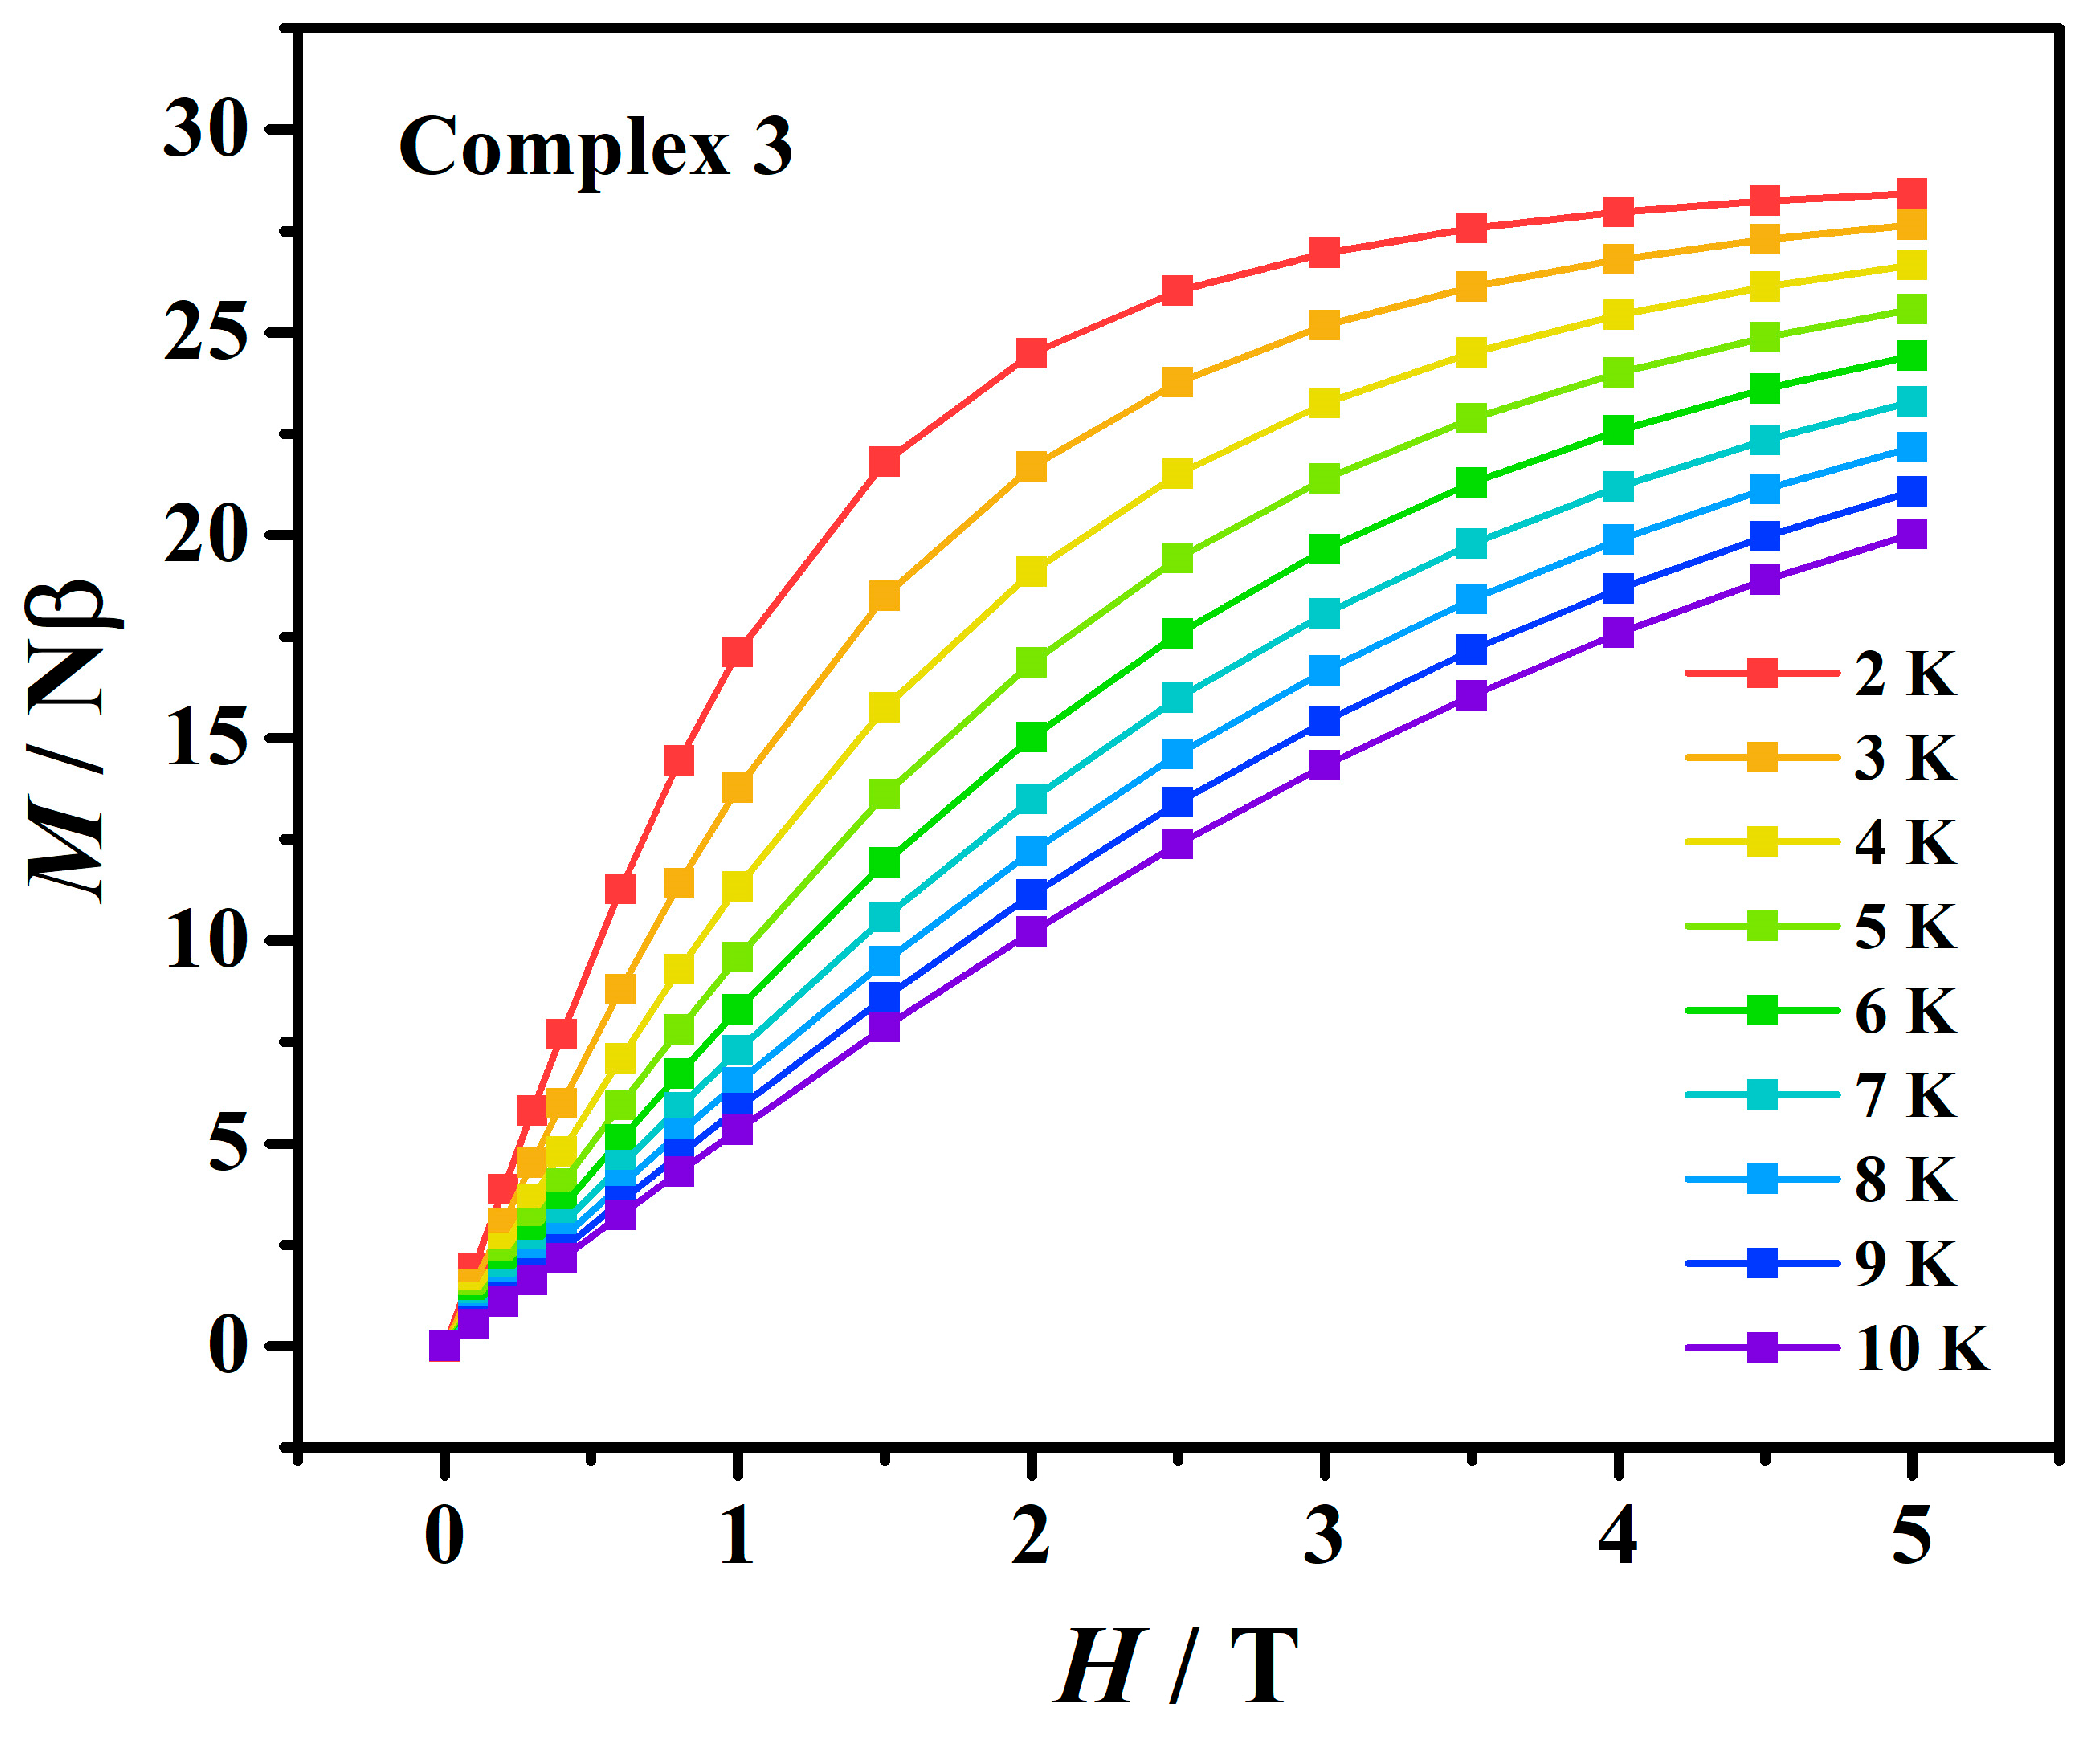
Figure 5.
Magnetic entropy change with temperature of complex 3 under different external magnetic fields.
Figure 5.
Magnetic entropy change with temperature of complex 3 under different external magnetic fields.
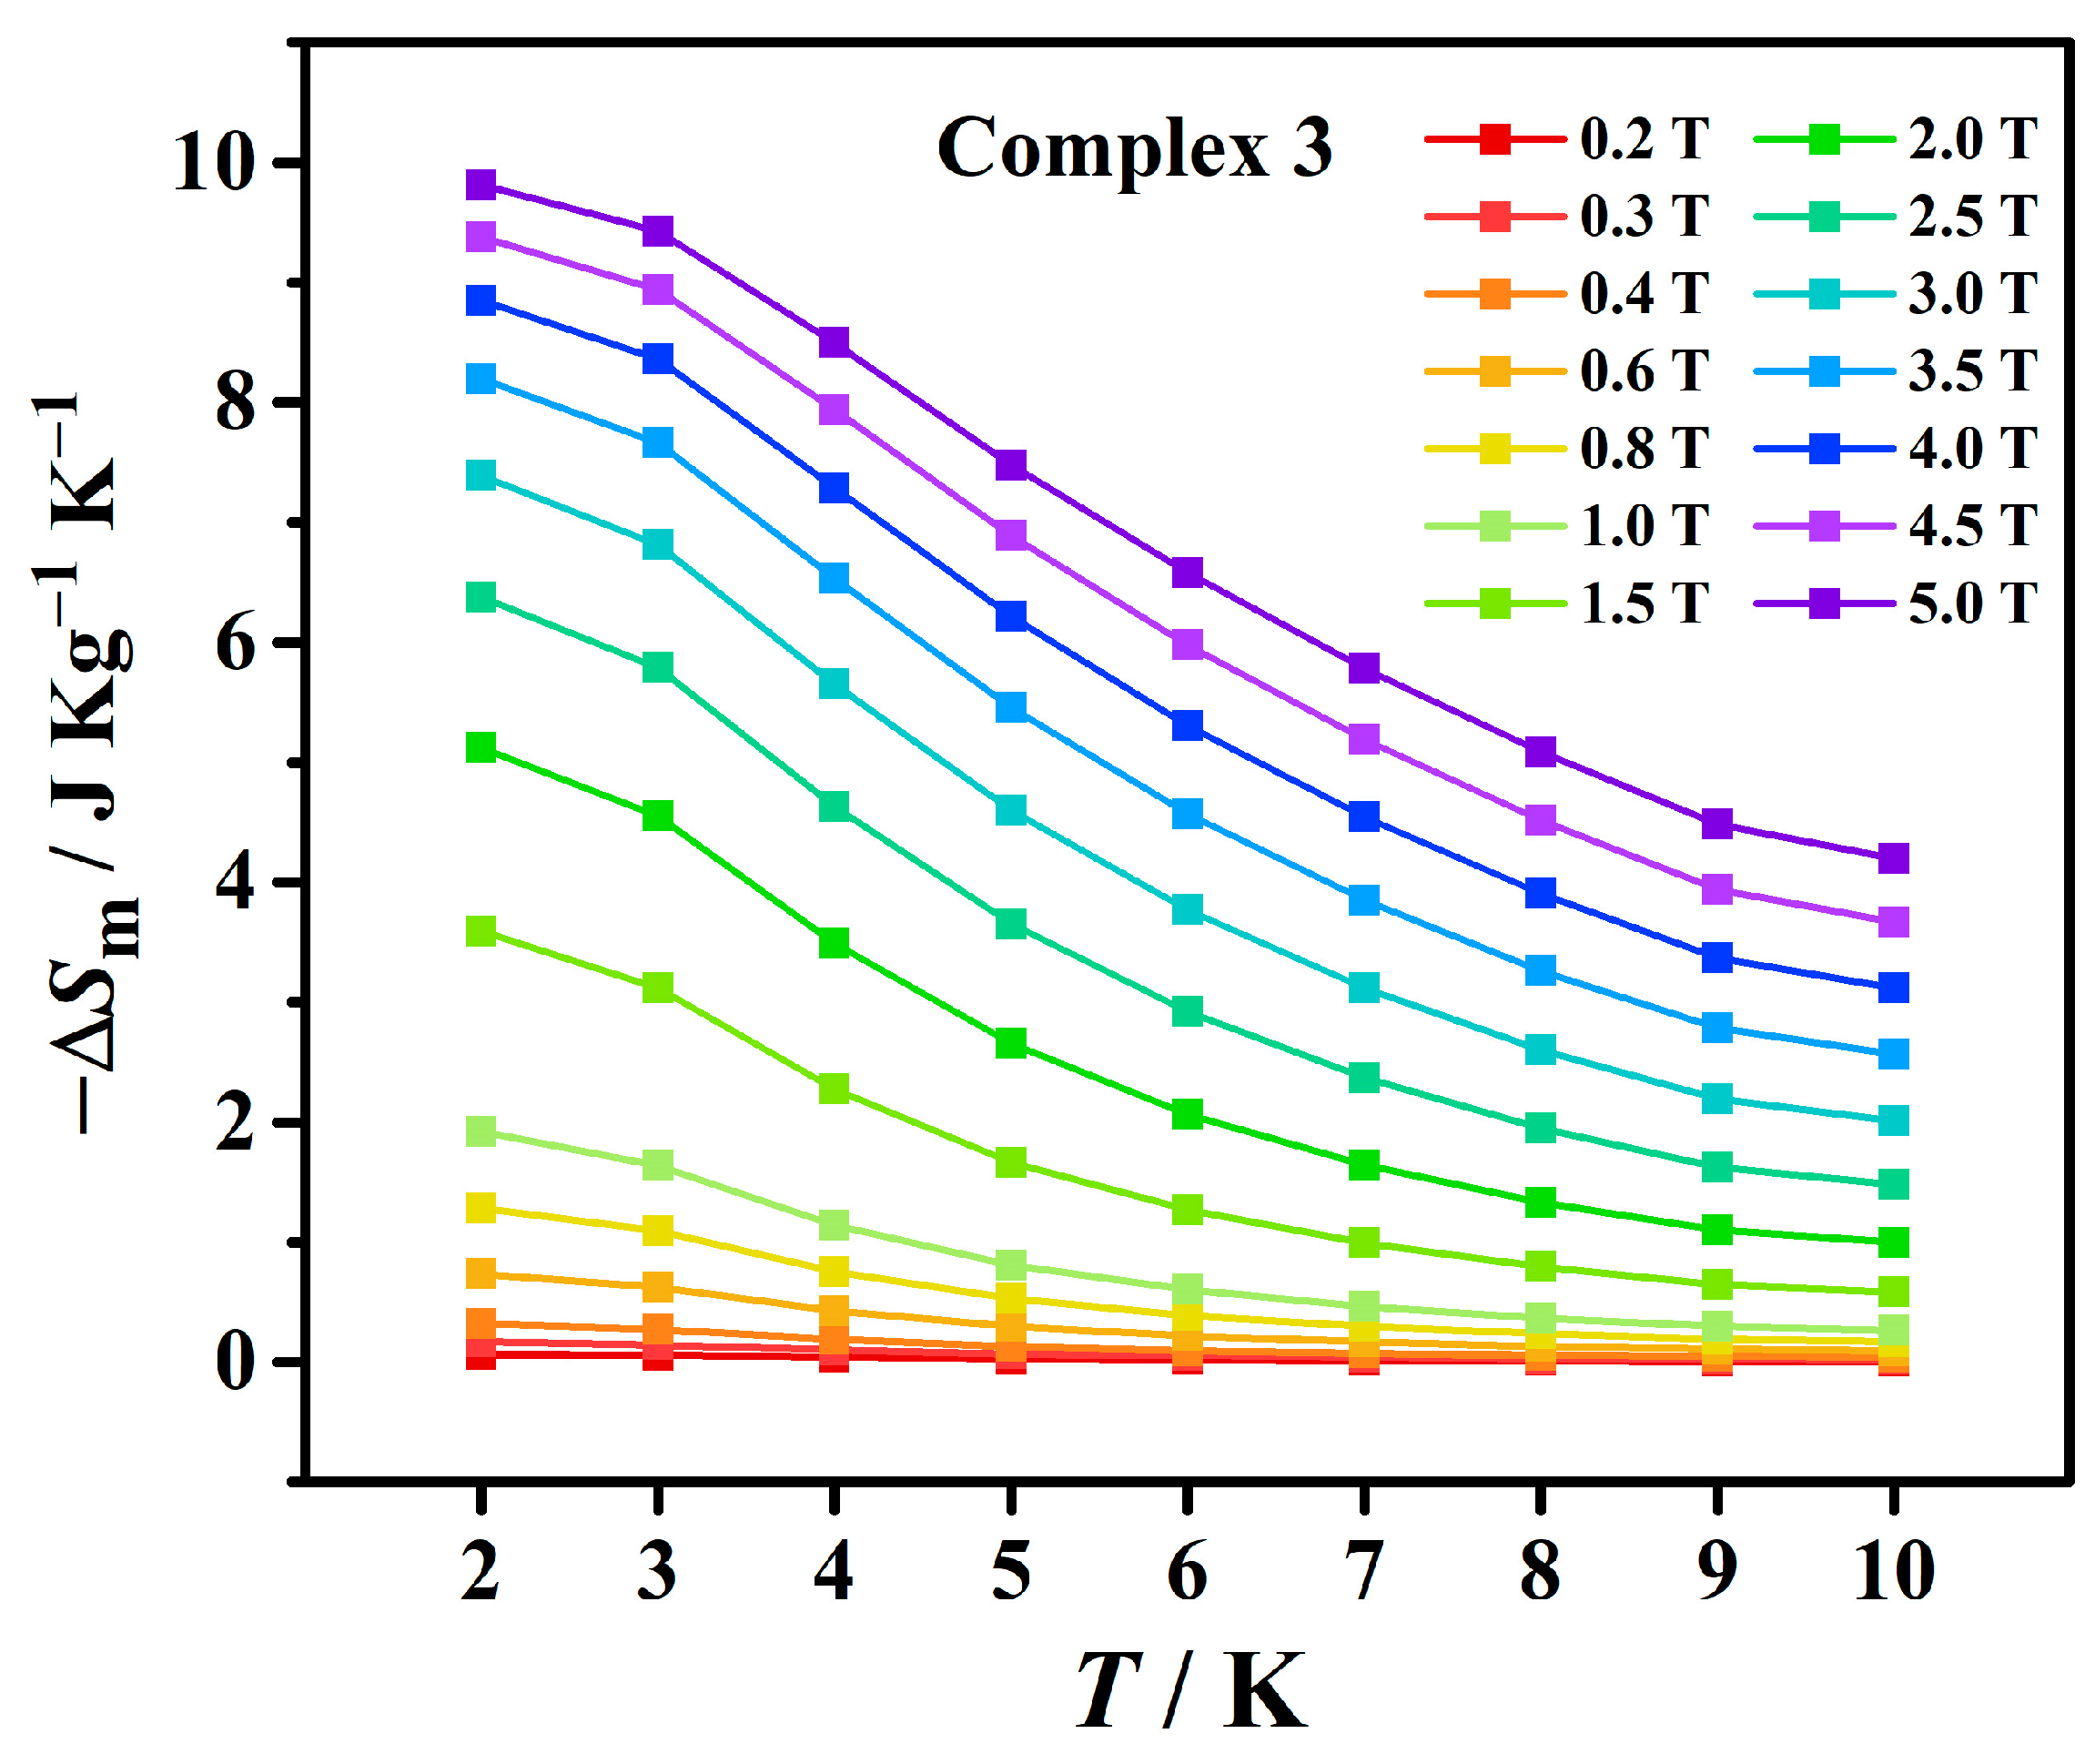
Figure 6.
The AC magnetic susceptibility data of complex 1 under 600 Oe DC field: (a) the χ’M of AC magnetic susceptibility changes with temperature at different frequencies; (b) the χ"M of AC magnetic susceptibility with temperature at different frequencies; (c) the χ"M of AC magnetic susceptibility is plotted against the χ’M at different temperatures (Cole-Cole) and fitted by the generalized Debye model; (d) lnτ is plotted against T−1, and the red line is the fitting result by the formulas of Raman and Orbach relaxations.
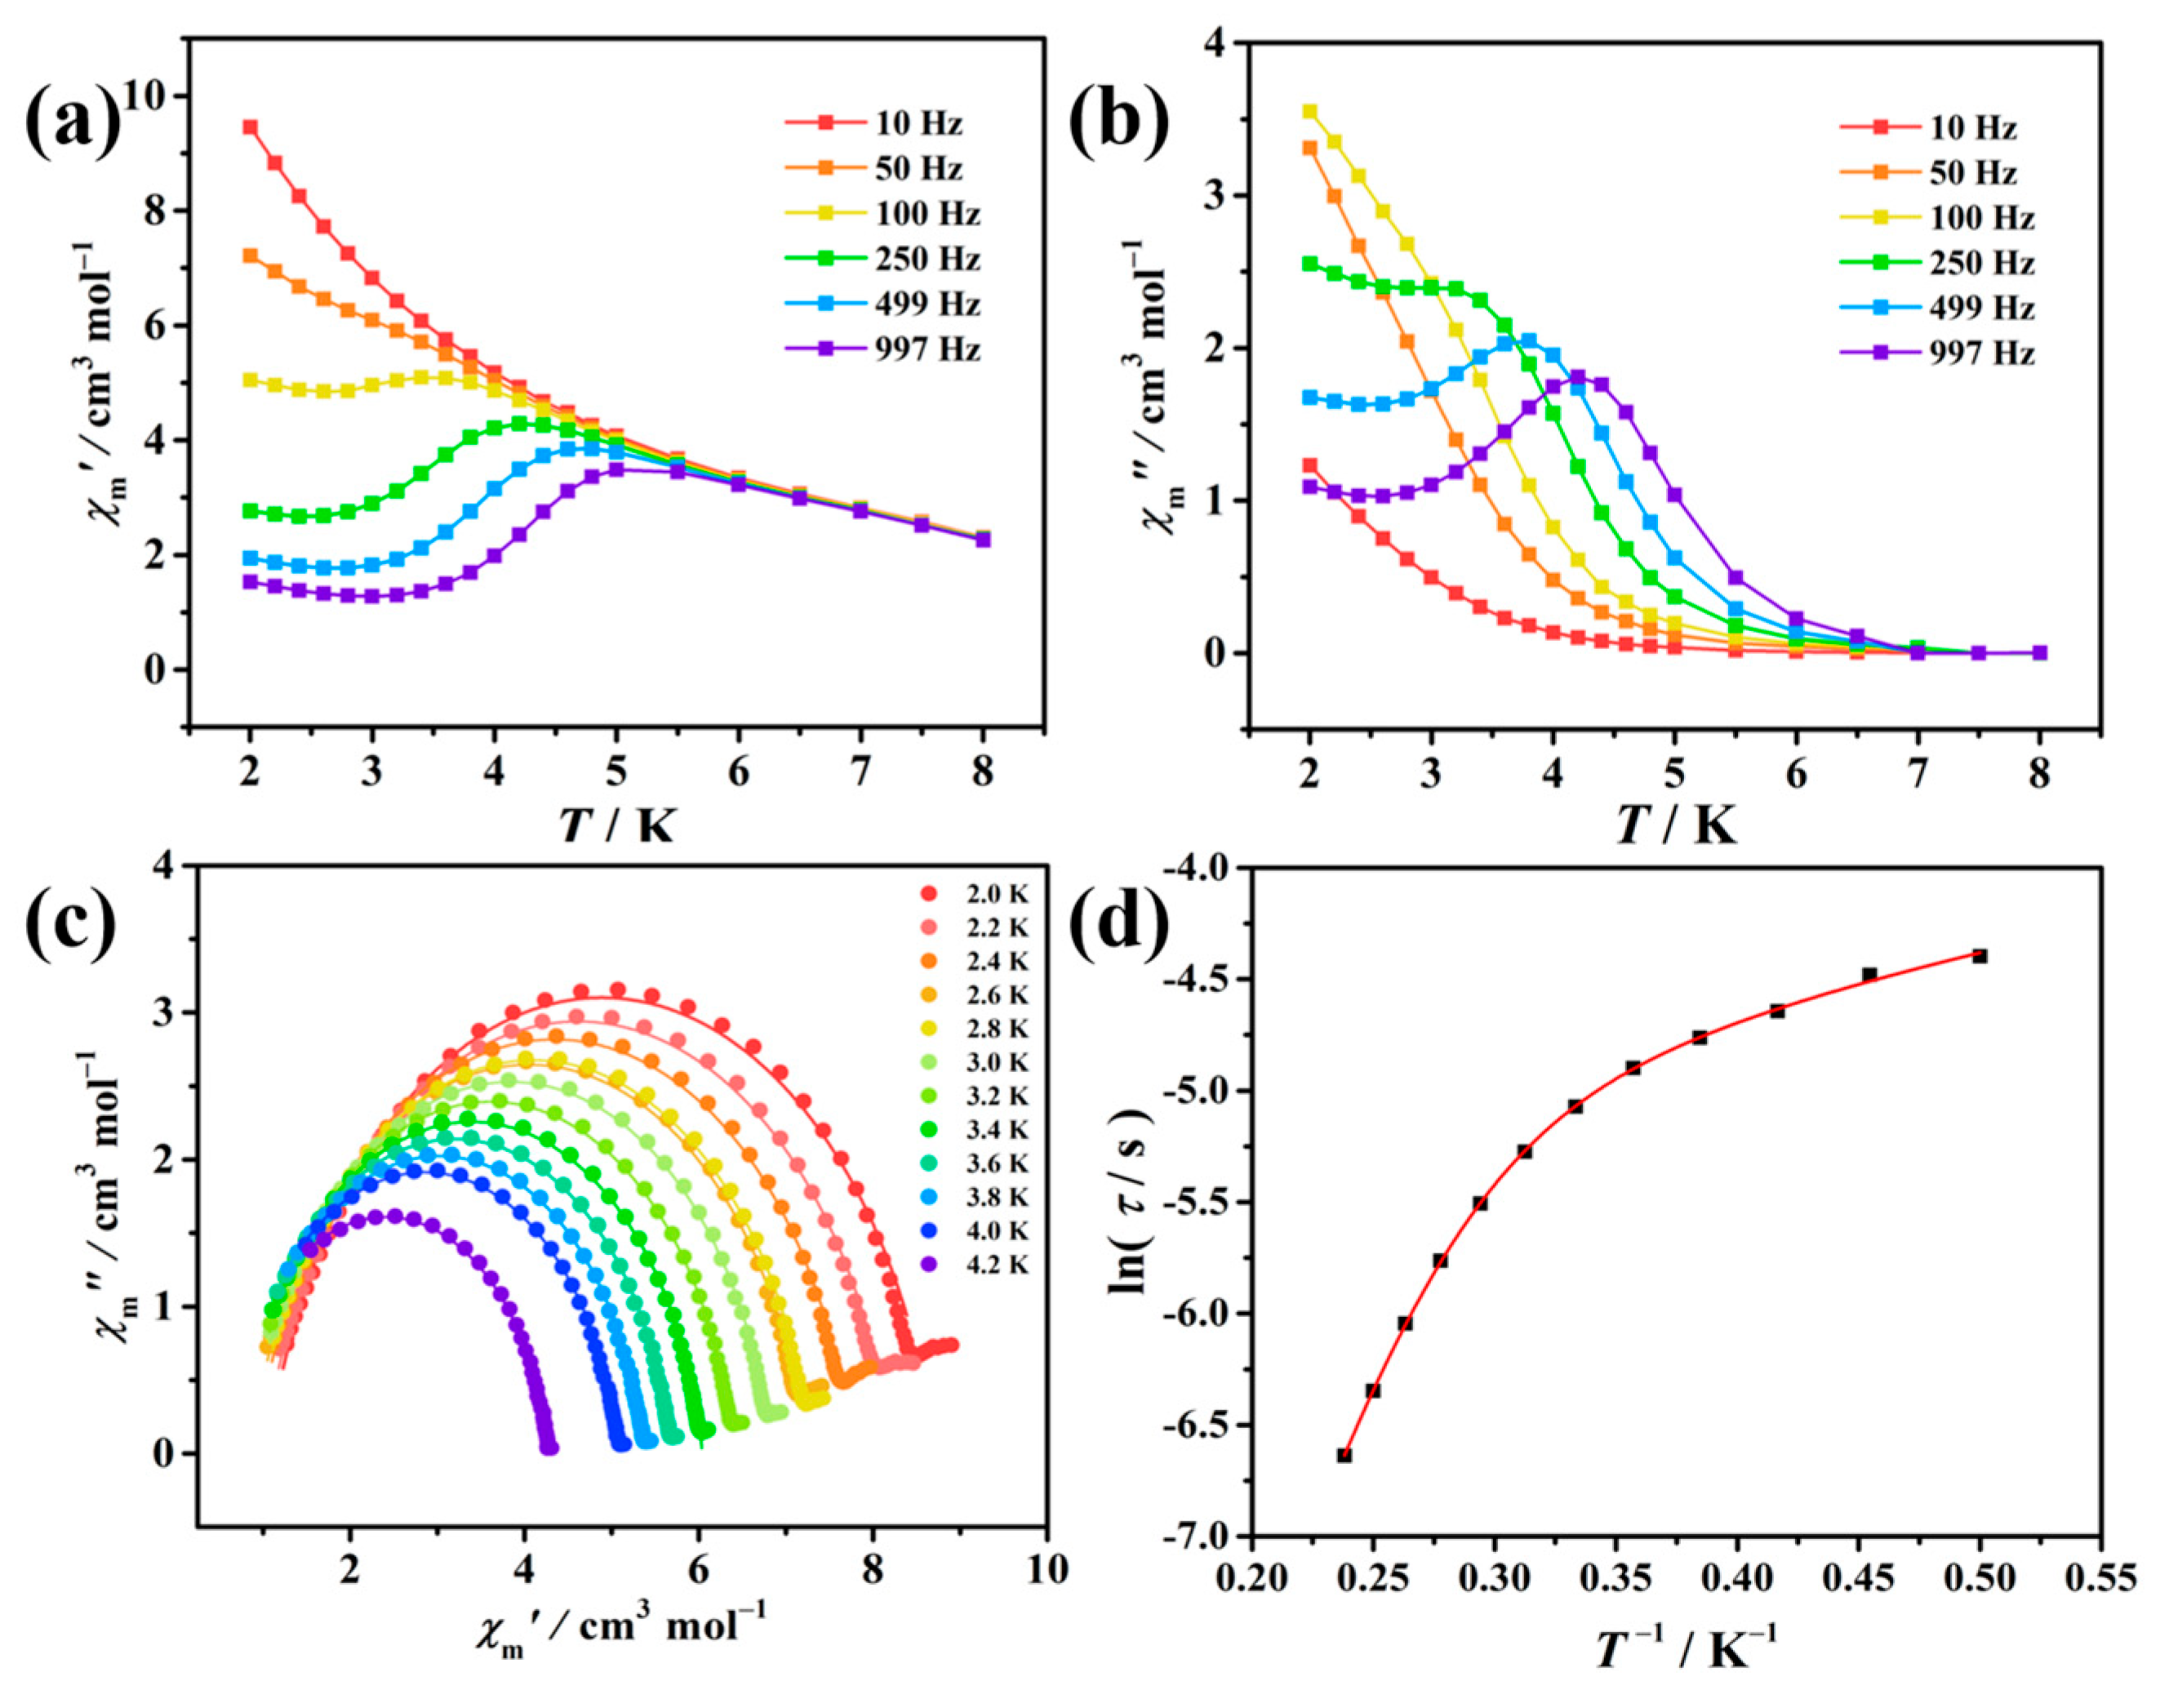
Figure 7.
Magnetization blocking barrier of complex 1. The path shown by the red arrows represents the most probable path for magnetic relaxation in the corresponding compound. The numbers at each arrow stand for the mean absolute value of the corresponding matrix element of transition magnetic moment.
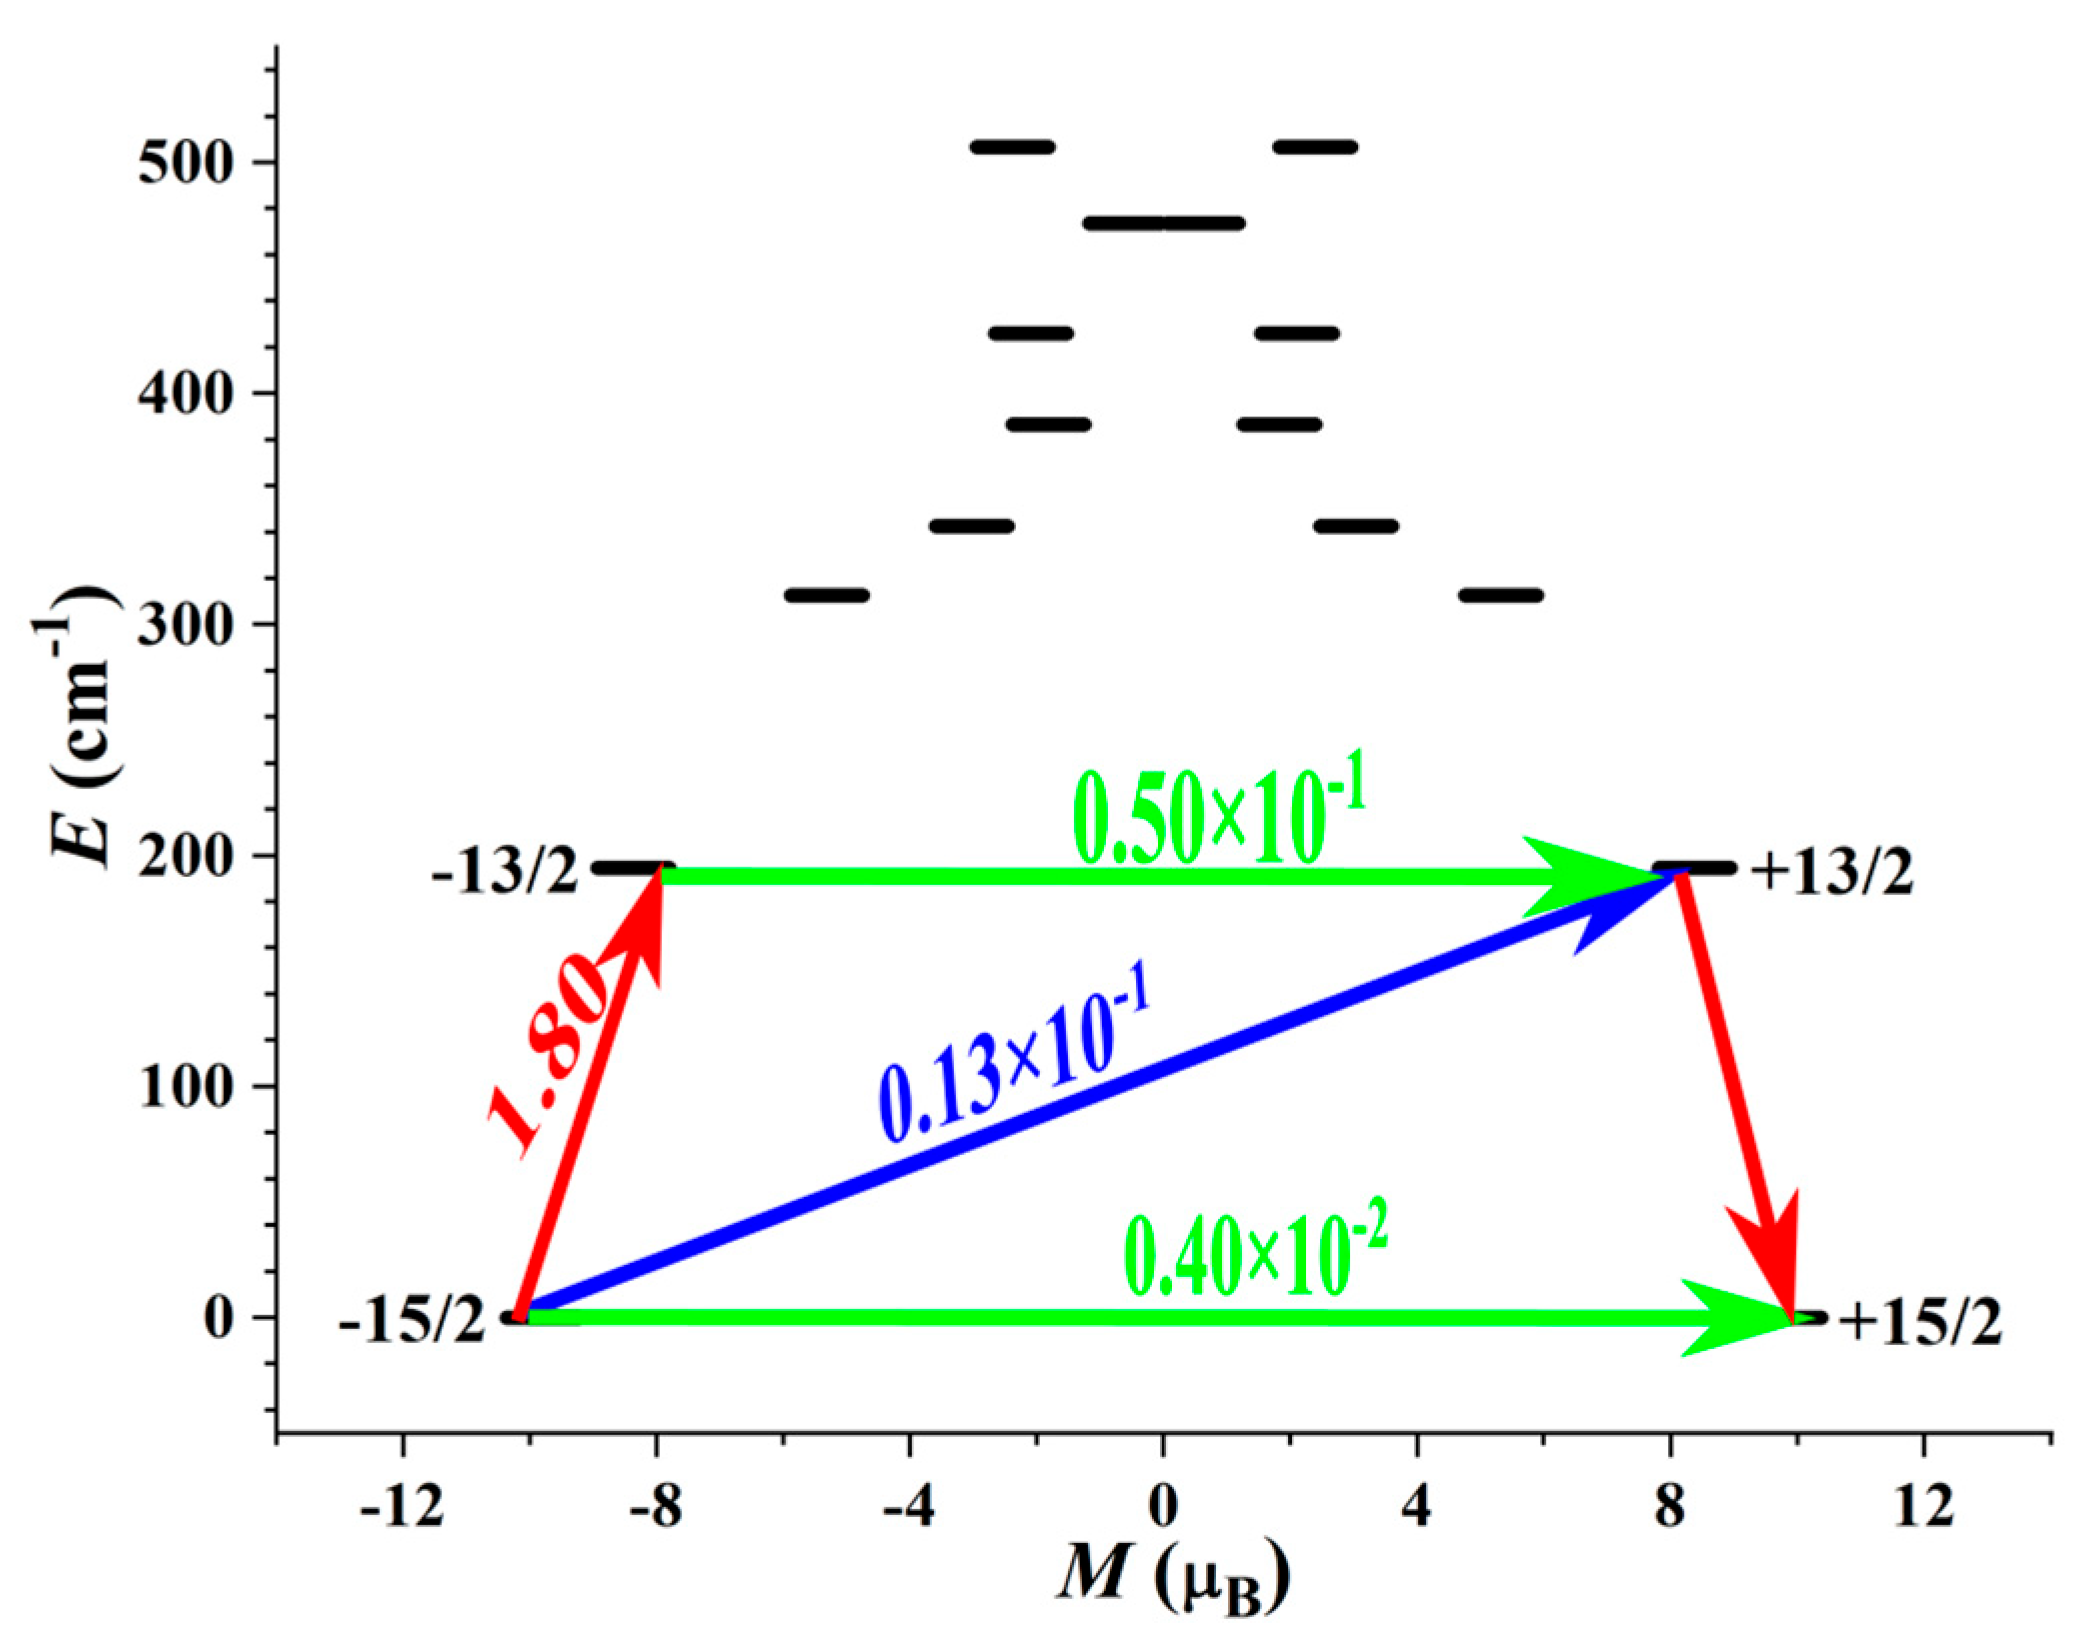
Figure 8.
Calculated orientation of the local main magnetic axis on Dy(III) of complex 1 in the ground KD. (a) ab initio, (b) MAGELLAN.
Figure 8.
Calculated orientation of the local main magnetic axis on Dy(III) of complex 1 in the ground KD. (a) ab initio, (b) MAGELLAN.
Disclaimer/Publisher’s Note: The statements, opinions and data contained in all publications are solely those of the individual author(s) and contributor(s) and not of MDPI and/or the editor(s). MDPI and/or the editor(s) disclaim responsibility for any injury to people or property resulting from any ideas, methods, instructions or products referred to in the content. |
© 2025 by the authors. Licensee MDPI, Basel, Switzerland. This article is an open access article distributed under the terms and conditions of the Creative Commons Attribution (CC BY) license (http://creativecommons.org/licenses/by/4.0/).
Copyright: This open access article is published under a Creative Commons CC BY 4.0 license, which permit the free download, distribution, and reuse, provided that the author and preprint are cited in any reuse.


