Submitted:
05 July 2025
Posted:
07 July 2025
You are already at the latest version
Abstract
Background: Clopidogrel, an antiplatelet prodrug widely prescribed for thrombotic risk reduction in cardiovascular patients, shows marked interindividual response variability due to genetic polymorphisms in CYP2C19 and ABCB1. Objectives: To determine the impact of key polymorphisms (CYP2C19 *2, *3 and ABCB1 3435C>T) on pharmacokinetic parameters and adherence outcomes, using curated PharmGKB data. Methods: Retrospective pharmacogenomic analysis of PharmGKB entries correlating genotypes with plasma concentrations, metabolic ratios, and adherence. Statistical associations were evaluated via ANOVA and regression. Results: Carriers of CYP2C19 *2/*3 alleles displayed significantly reduced active metabolite concentrations (p < 0.01), alongside elevated metabolic ratios and diminished adherence. The ABCB1 3435C>T variant further modulated drug levels. Conclusions: These findings support genotype-informed clopidogrel prescribing. Implementation strategies and prospective validation are recommended.
Keywords:
clopidogrel
; CYP2C19
; ABCB1
; pharmacogenomics
; PharmGKB
; pharmacokinetics
2. Introduction
1.1. Overview of the Topic
Clopidogrel is a prodrug commonly used as an antiplatelet medication to prevent blood clots in patients with cardiovascular diseases, such as those who have suffered from myocardial infarction, ischemic strokes, or acute coronary syndrome (Sibbing et al., 2010). Its effectiveness varies widely among individuals due to genetic differences, specifically polymorphisms in genes involved in drug metabolism and transport, such as CYP2C19 and ABCB1 (Mega et al., 2009; Kim et al., 2010).
1.2. Personal and Global Significance
Understanding the impact of genetic polymorphisms on clopidogrel response is crucial for optimizing treatment regimens and improving patient outcomes. On a global scale, cardiovascular diseases remain a leading cause of morbidity and mortality, making effective management strategies critical. Personalized medicine, which tailors treatment based on individual genetic profiles, holds the potential to enhance therapeutic efficacy and reduce adverse effects (Sofi et al., 2011).
On a personal level, this research resonates with me due to my family history of cardiovascular disease. Witnessing relatives struggle with the side effects of medications and varying treatment outcomes has driven my interest in pharmacogenomics and personalized medicine. By investigating how genetic polymorphisms affect drug adherence to clopidogrel, I hope to contribute to the development of more effective and individualized treatments, ultimately improving the quality of life for patients like my grandfather.
1.3. Introduction to Experimental Approach
The experimental approach involves analyzing secondary data from the PharmGKB database to investigate the impact of CYP2C19 and ABCB1 polymorphisms on the pharmacokinetics of clopidogrel. Moreover, this method is suitable because it allows for the examination of large datasets that have been rigorously collected and curated, providing a robust foundation for the study (Whirl-Carrillo et al., 2012).
The PharmGKB database is an extensive resource that includes pharmacogenomic data linking genetic variants to drug response. Using this database enables the identification of relevant genetic polymorphisms and their association with pharmacokinetic parameters such as plasma concentration and metabolic ratios of clopidogrel (Whirl-Carrillo et al., 2012).
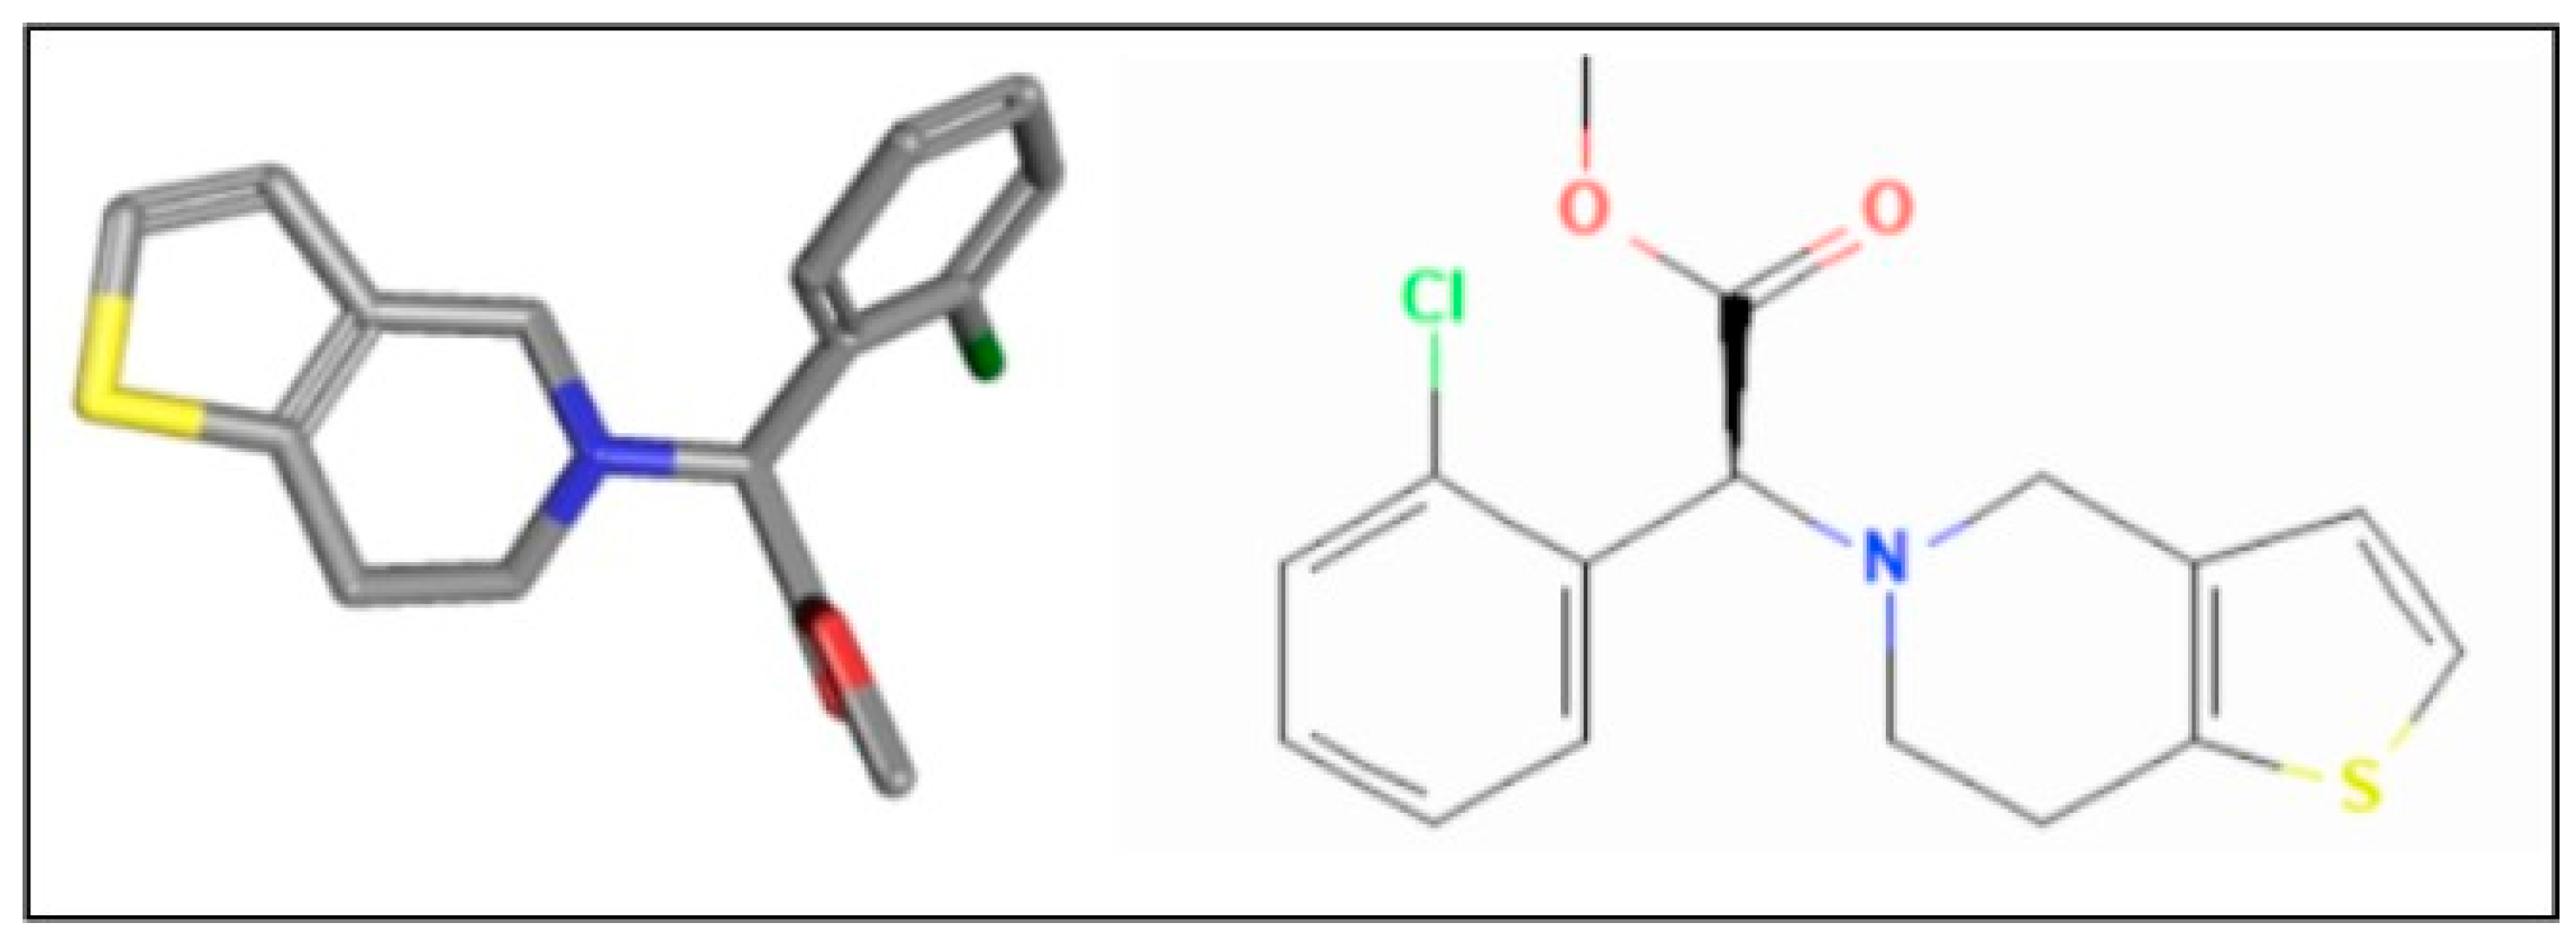
Figure 1.
Molecular and chemical structure of clopidogrel (Source: PharmGKB).
3. Research Question
How does the type of genetic polymorphism, particularly those related to drug metabolism pathways such as CYP2C19 and ABCB1, affects the drug adherence in response to clopidogrel, as evidenced by pharmacokinetic parameters in a pharmacogenomics database (PharmGKB)?
2.1. Hypothesis
Genetic polymorphisms in CYP2C19 and ABCB1 significantly influence the pharmacokinetics of clopidogrel, leading to variability in drug plasma concentrations and metabolic ratios. Specifically, individuals with reduced-function variants of CYP2C19 (e.g., *2, *3) will exhibit lower plasma concentrations of the active metabolite of clopidogrel, potentially resulting in decreased drug adherence and efficacy. Additionally, polymorphisms in ABCB1 (e.g., 3435C>T) will alter drug absorption and distribution, increasing its efficiency.
4. Background
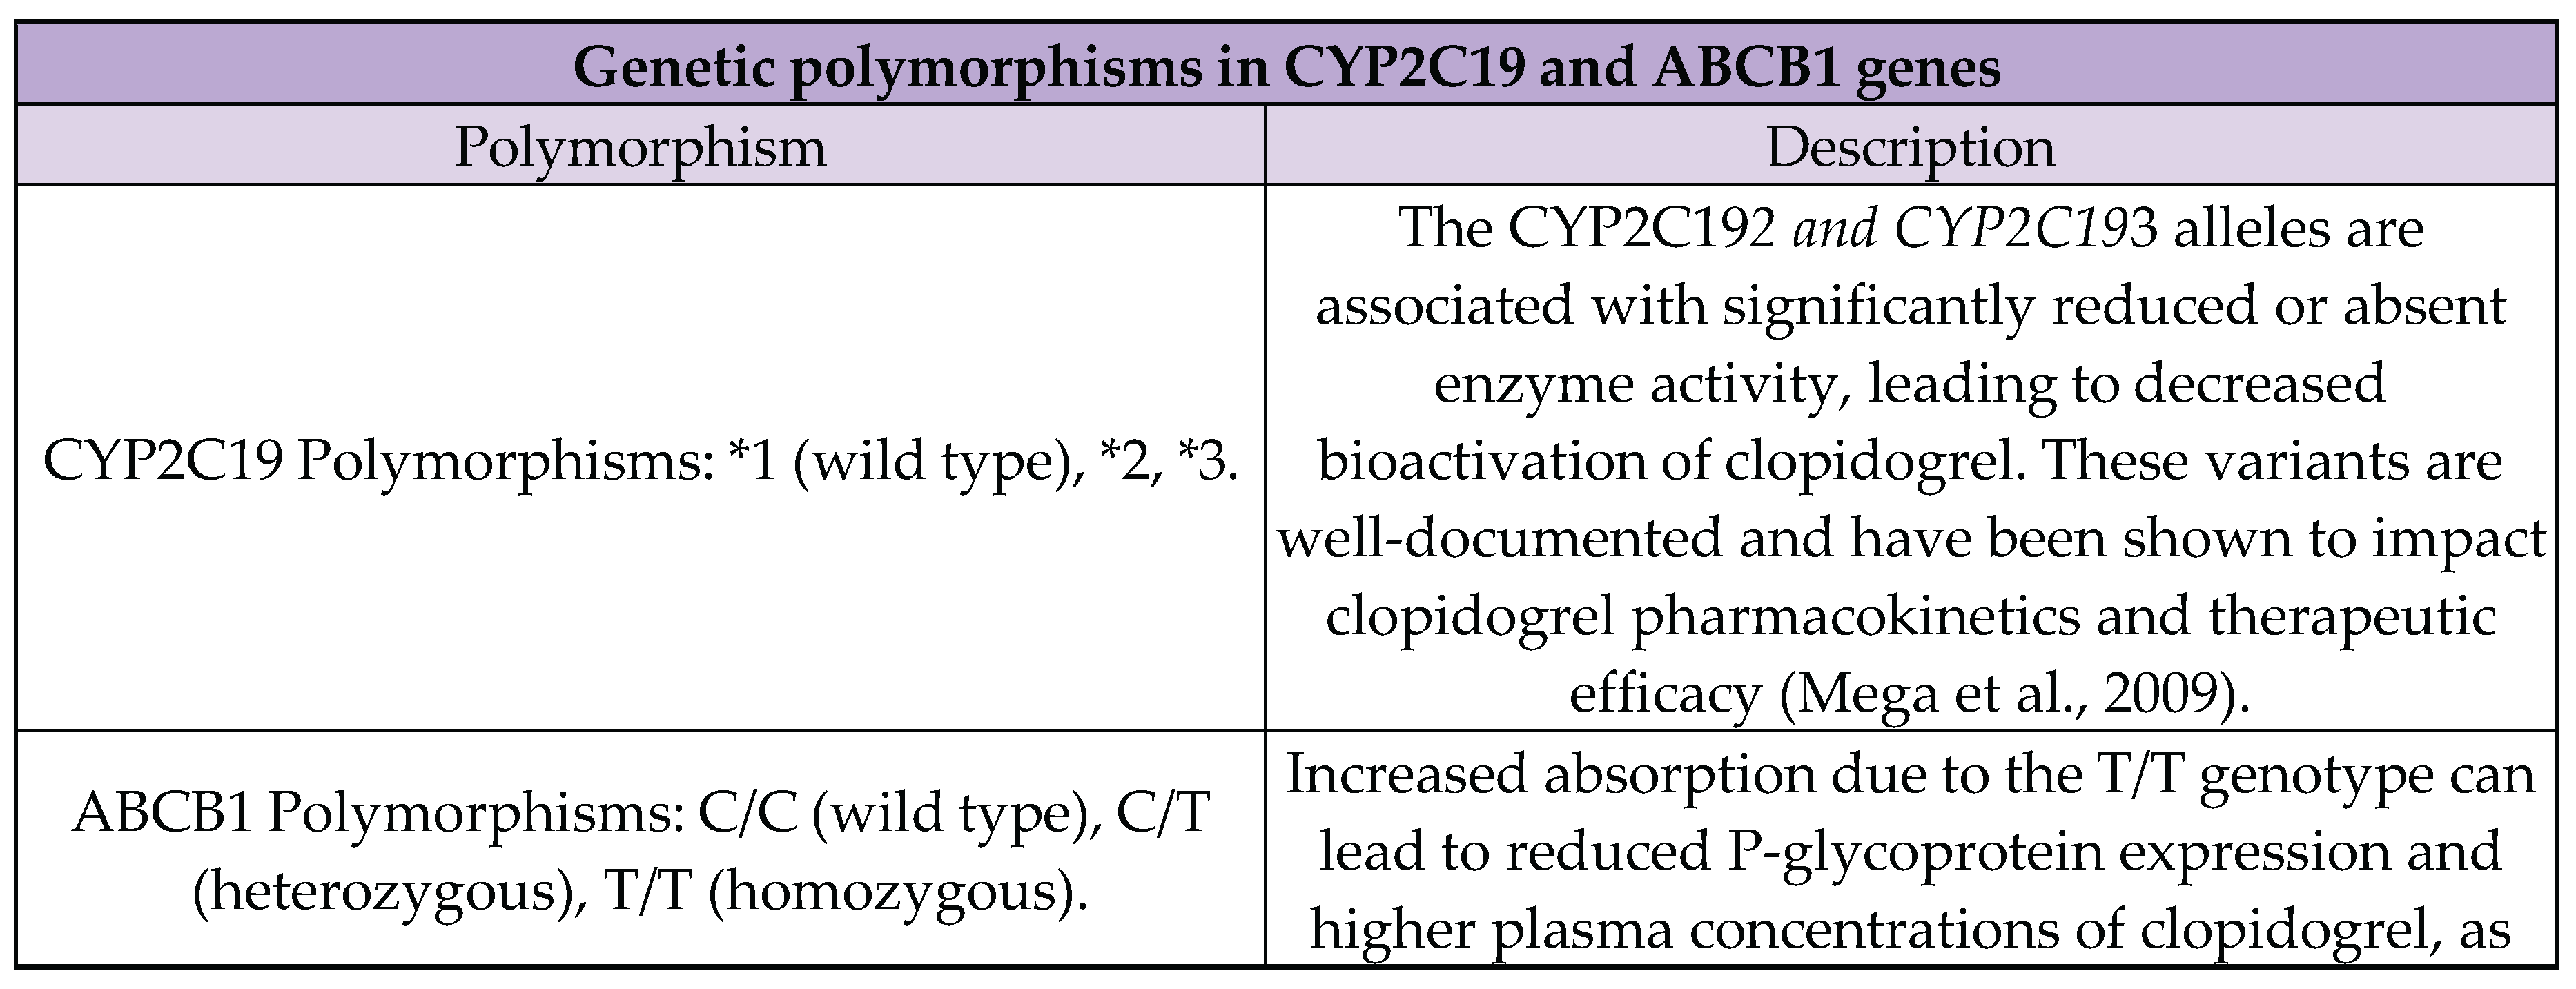
3.1. Genetic Polymorphisms
Genetic polymorphisms refer to the presence of two or more variants of a gene within a population, where the least common allele has a frequency of at least 1% (Rajagopal, 2019). These variations can influence the function of enzymes involved in drug metabolism, impacting how individuals respond to medications (Hockings et al., 2020).
- CYP2C19: The CYP2C19 gene encodes the cytochrome P450 2C19 enzyme, which is crucial for the metabolism of various drugs, including clopidogrel. Common polymorphisms include CYP2C191 (wild type), CYP2C192, and CYP2C19*3. The *2 and *3 alleles result in reduced or null enzyme activity, leading to poor metabolism of clopidogrel and decreased therapeutic effectiveness (Mega et al., 2009).
- ABCB1: The ABCB1 gene encodes P-glycoprotein, a membrane transporter involved in drug absorption and distribution. The 3435C>T polymorphism in the ABCB1 gene affects P-glycoprotein expression levels and function, which can alter the pharmacokinetics of clopidogrel and other drugs (Kim et al., 2010).
3.2. Clopidogrel and Its Relationship with the Metabolism
Clopidogrel is an antiplatelet agent that prevents platelet aggregation by irreversibly inhibiting the P2Y12 ADP receptor on platelets. This inhibition is crucial for reducing the risk of thrombotic cardiovascular events such as heart attacks and strokes (Zhou & Wang, 2018; Johnson et al., 2019). The active metabolite of clopidogrel irreversibly binds to the P2Y12 receptor on platelets, inhibiting their aggregation and thereby reducing the risk of thrombus formation (Sibbing et al., 2010).
Clopidogrel's active metabolite inhibits platelet aggregation, which is critical in preventing cardiovascular events in patients at risk of thrombosis. Imbalances in the levels of this active metabolite, often due to genetic polymorphisms, can lead to either suboptimal drug efficacy or increased risk of bleeding. Patients with reduced-function CYP2C19 alleles (e.g., *2, *3) may not produce sufficient active metabolite, resulting in poor therapeutic outcomes (Mega et al., 2009).
3.3. PharmGKB Database
3.3.1. Data Collection
The data extraction process involves querying the database for studies involving clopidogrel and the specified genetic polymorphisms. This method allows for a robust analysis of the pharmacokinetic parameters, including plasma concentrations and metabolic ratios, linked to genetic variations.
3.6.2. Selection and Sampling Method
The selection criteria for the PharmGKB database include:
- Studies involving clopidogrel and its pharmacokinetics.
- Inclusion of genetic data on CYP2C19 and ABCB1 polymorphisms.
- The availability of detailed pharmacokinetic measurements (e.g., plasma concentration, metabolic ratios).
The sampling method involves systematic extraction of relevant data from multiple studies, ensuring a comprehensive dataset that reflects the genetic diversity of the population under study.
5. Variables
4.1. Independent Variable

Table 1.
Independent variable and specific parameters.

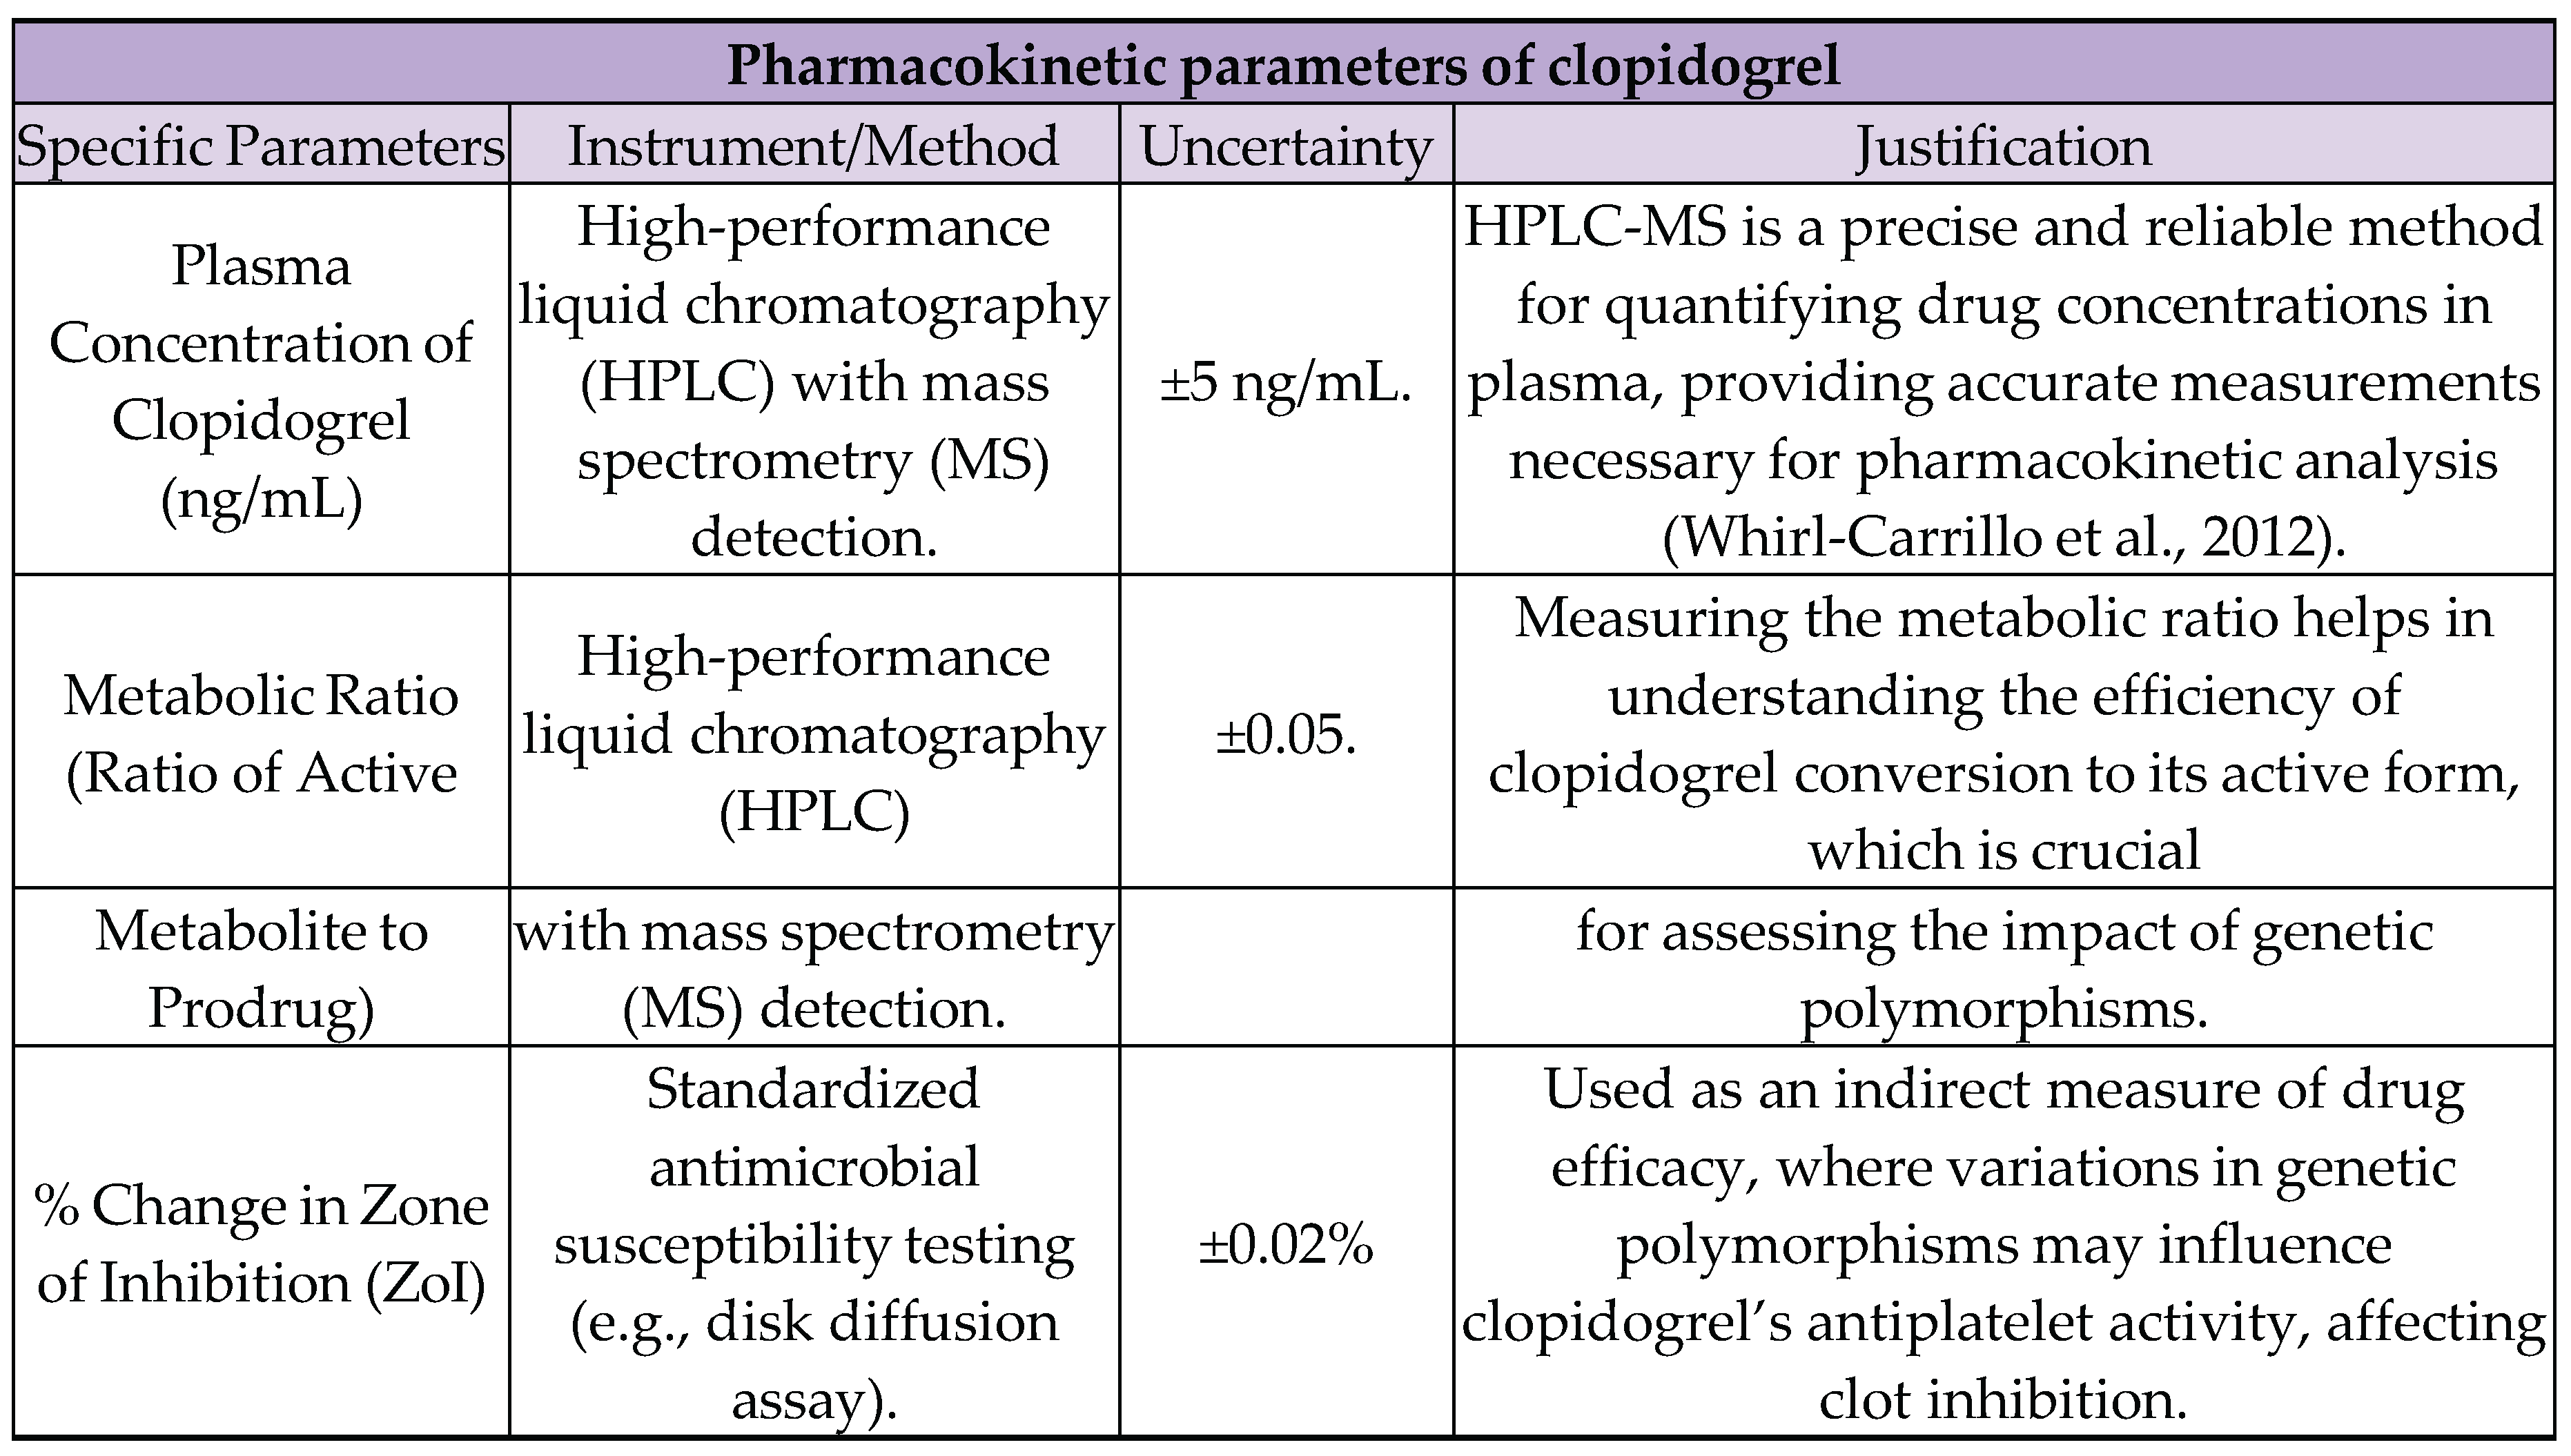
4.2. Dependent Variable
Table 2.
Dependent variable and specific parameters.
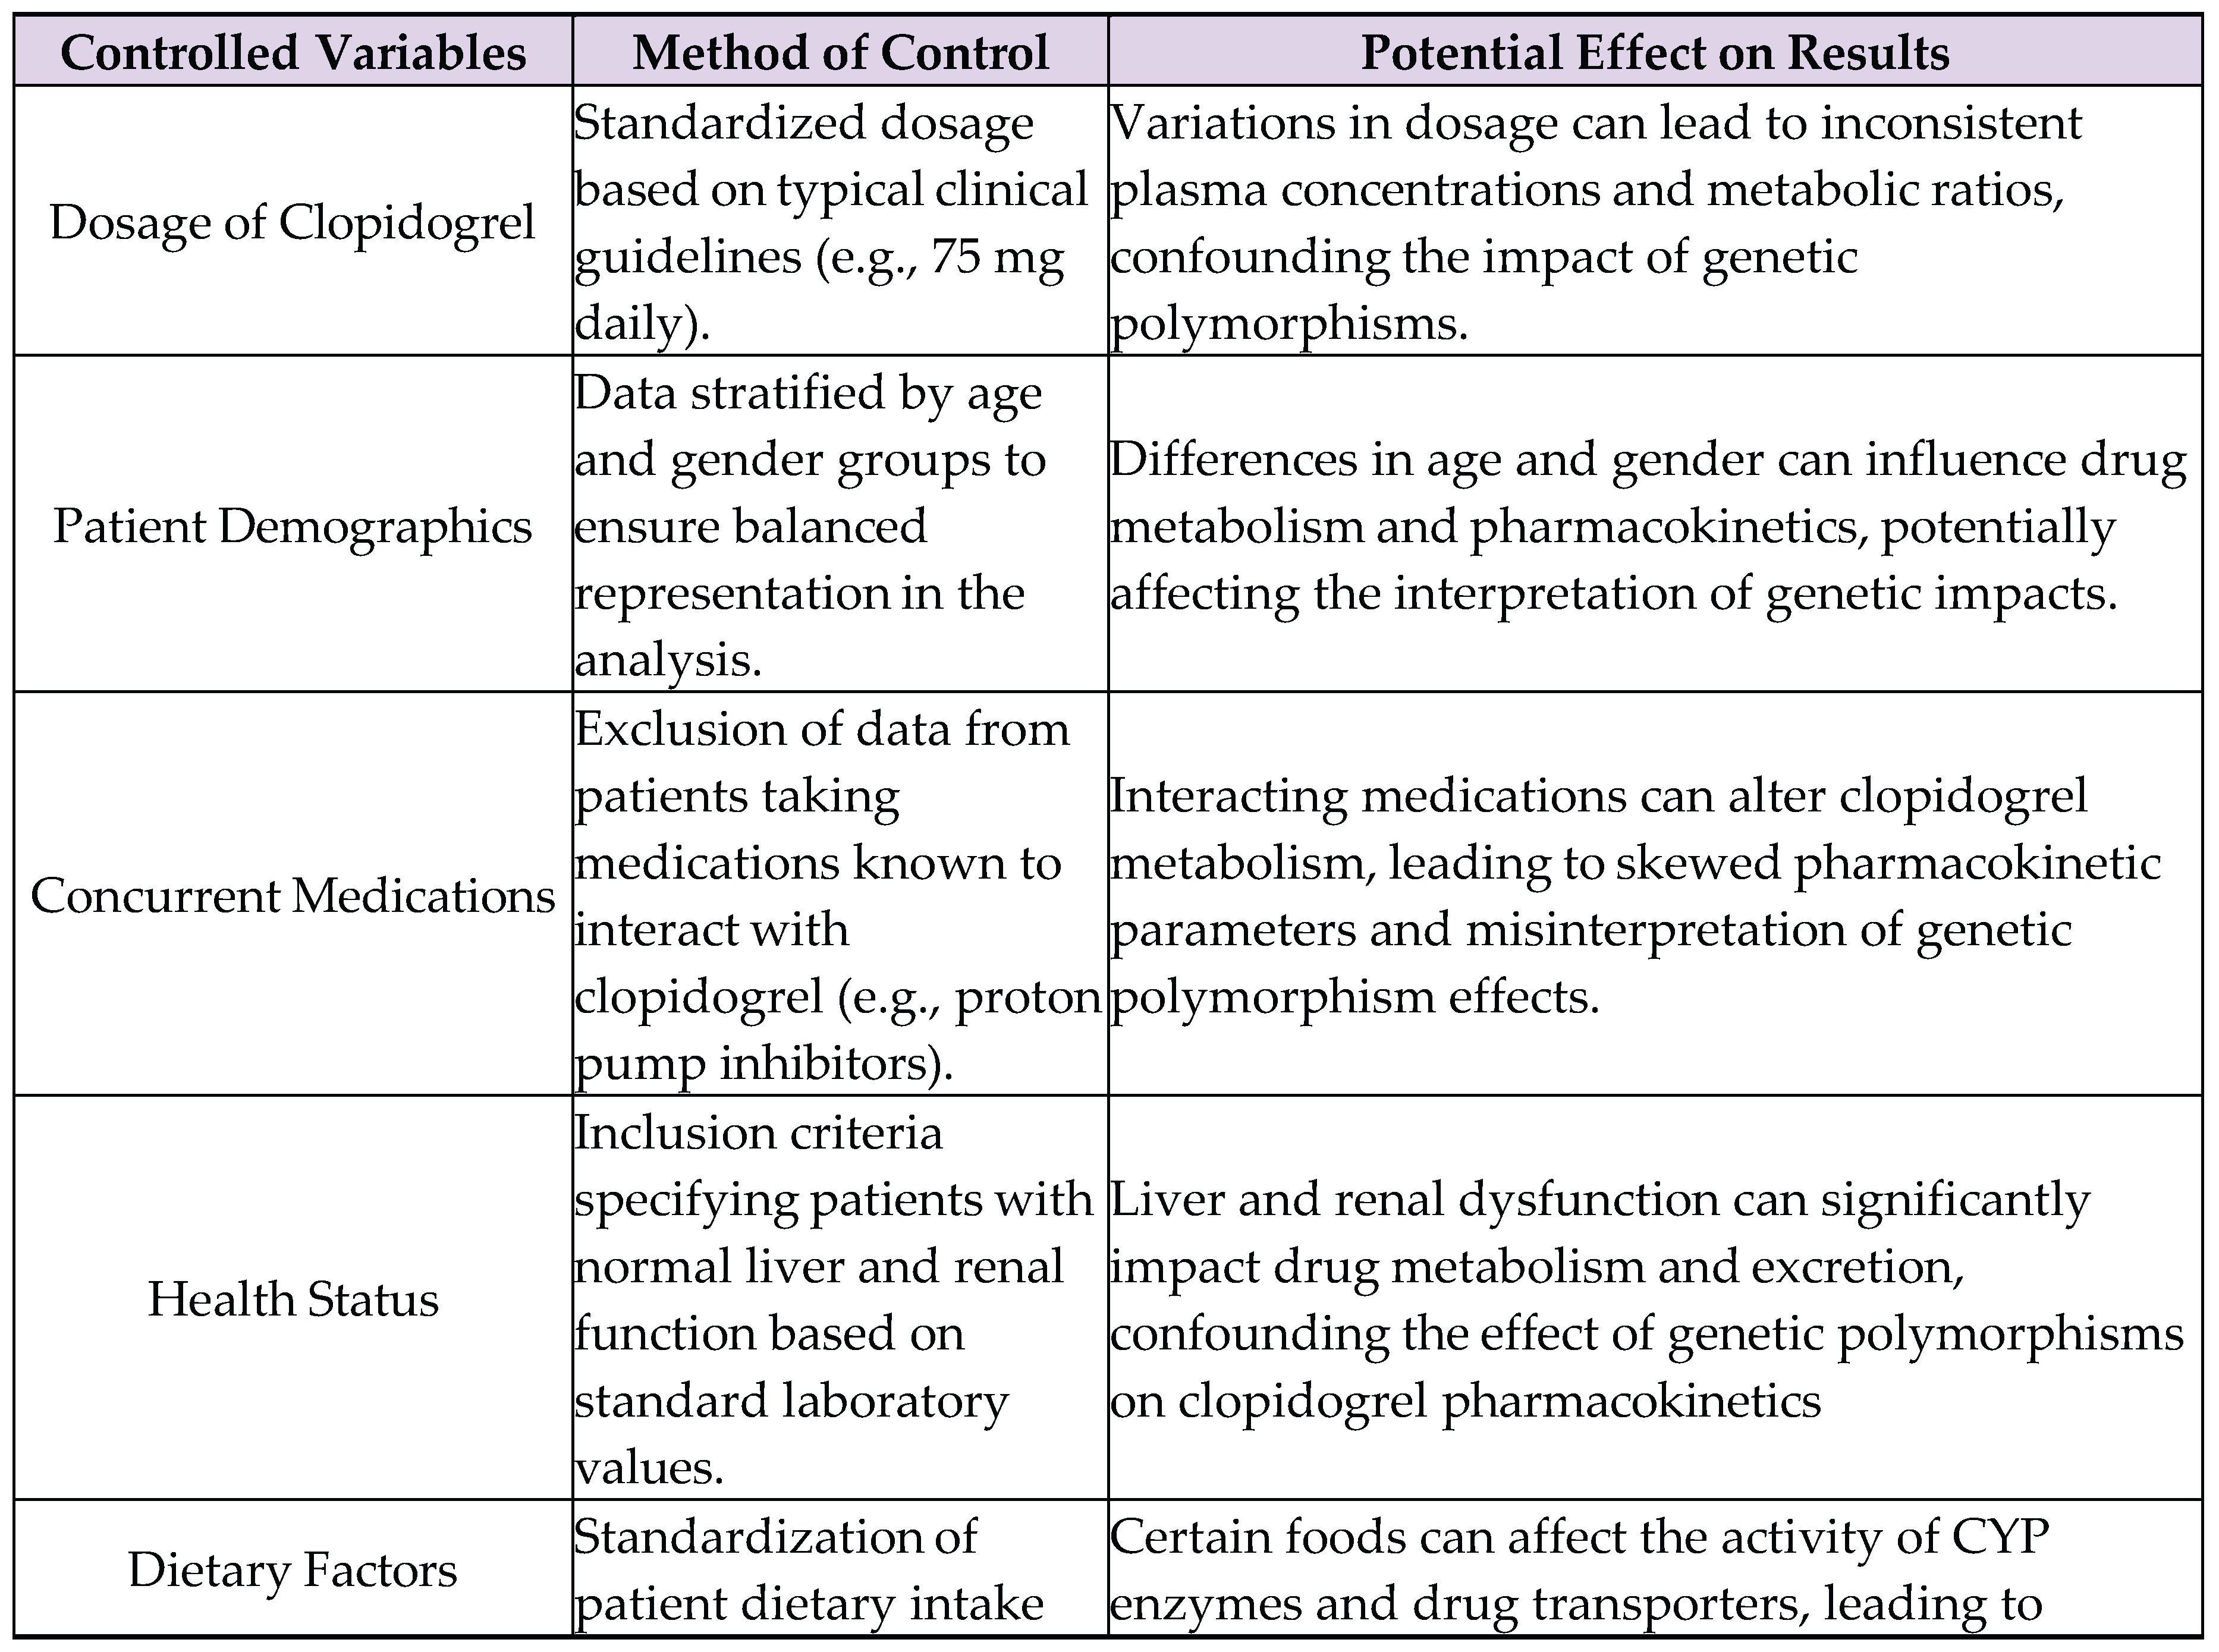
4.3. Controlled and Uncontrolled Variables
Table 2.
Controlled variables.
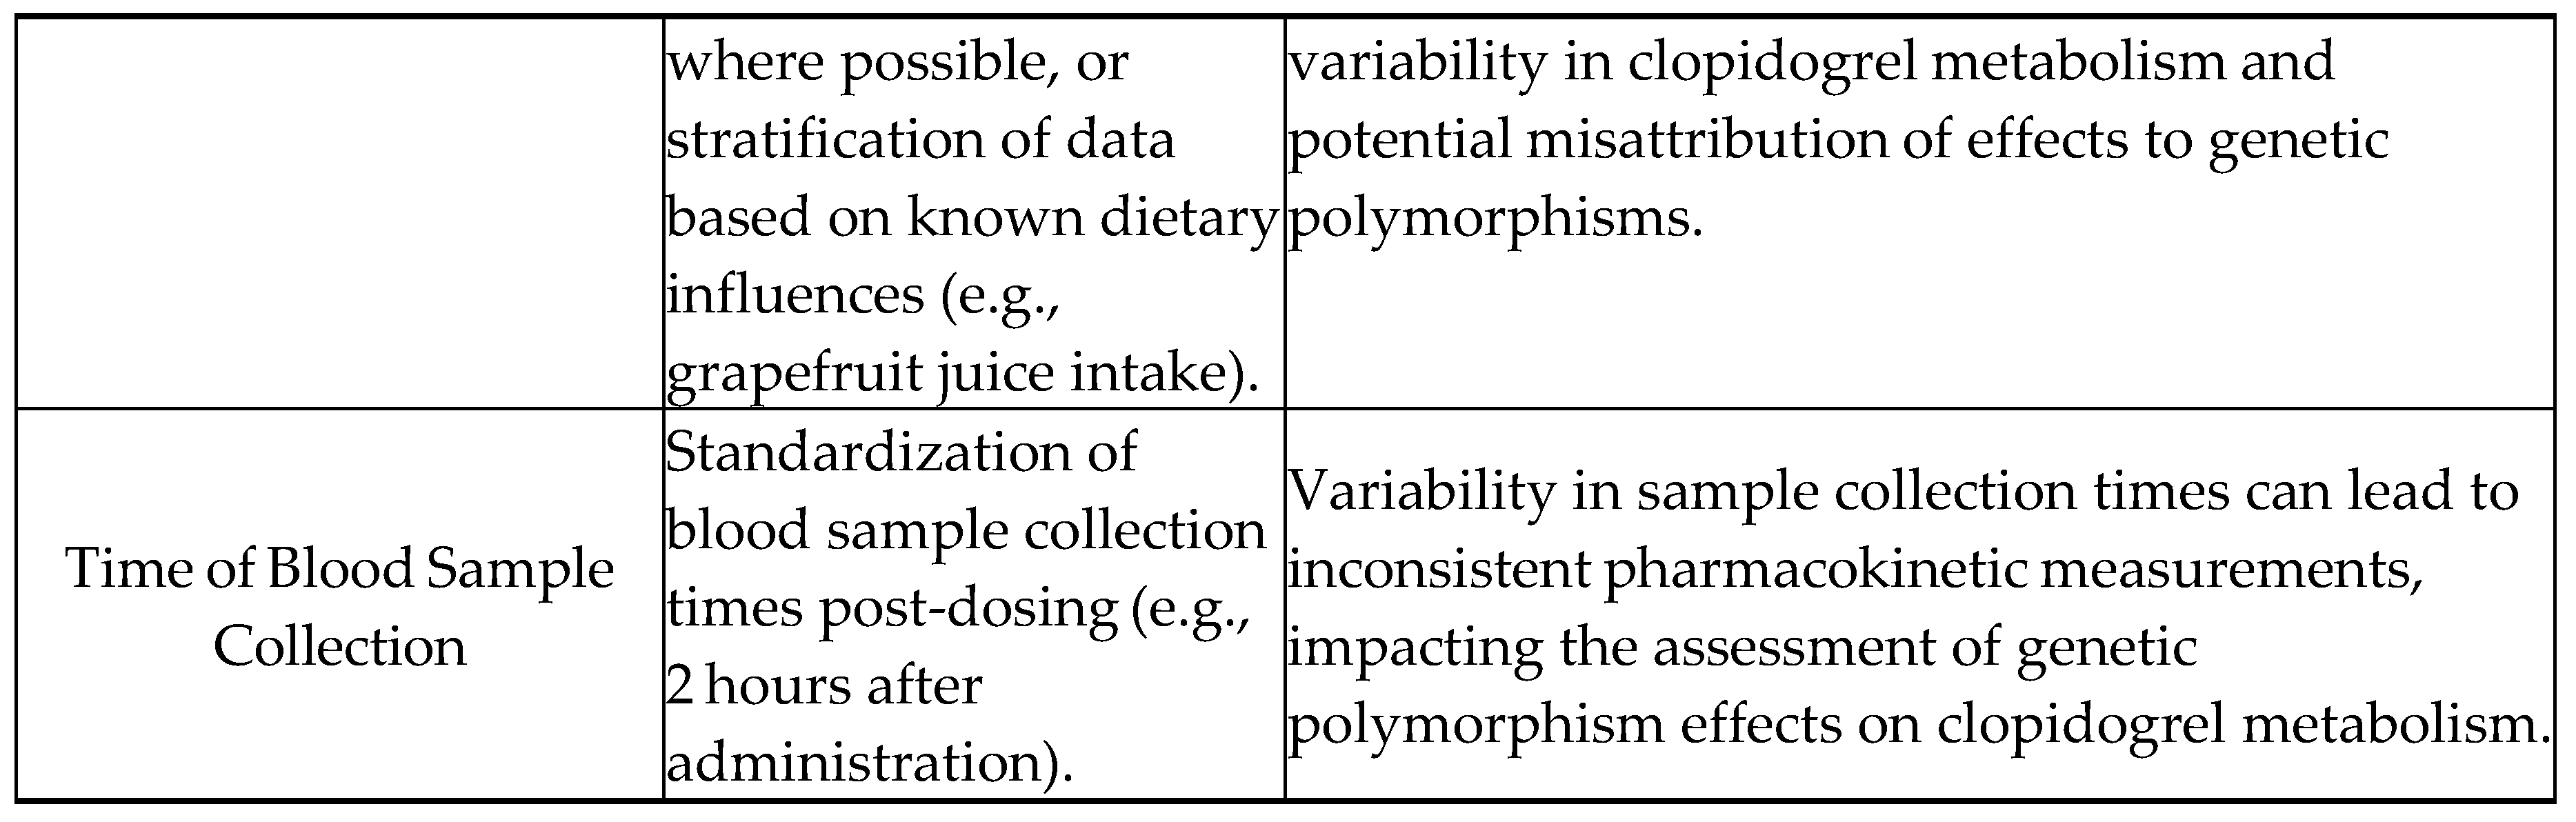
Uncontrolled Variables:
- Environmental factors: Differences in climate, altitude, or exposure to pollutants among patients in the dataset can influence physiological responses and drug metabolism. However, these factors are difficult to standardize or control in a retrospective analysis using secondary data (they aren’t included in PharmGKB).
- Genetic background: Although the study focuses on specific polymorphisms in CYP2C19 and ABCB1, other genetic variations in drug metabolism and transport genes might also affect clopidogrel pharmacokinetics but are not accounted for in this analysis.
- Lifestyle factors: Variations in patients' lifestyles, such as exercise, stress levels, and alcohol consumption, can impact drug metabolism. These factors are often not consistently recorded in pharmacogenomic databases, leading to potential confounding effects.
- Adherence to medication: While the study assumes consistent adherence to prescribed clopidogrel regimens, actual patient adherence may vary, introducing variability in drug plasma concentrations and metabolic ratios that are unrelated to genetic polymorphisms.
6. Materials
Since this study involves the analysis of secondary data, the equipment required is primarily computational and software-based.
5.1. Databases
- 1.
-
PharmGKB (Pharmacogenomics Knowledgebase)
- 1.1.
- Purpose: Provides comprehensive pharmacogenomic information, including gene-drug interactions, pharmacokinetic data, and genetic variant annotations.
- 1.2.
- Data Utilized: Genetic polymorphisms of CYP2C19 and ABCB1, clopidogrel pharmacokinetics.
- 1.3.
-
Features Used:
- 1.3.1.
- Clinical Annotations: Information on the impact of genetic variants on drug response.
- 1.3.2.
- Variant Annotations: Details on specific polymorphisms in genes such as CYP2C19 and ABCB1.
- 1.3.3.
- Drug Pathways: Understanding the metabolic pathways of clopidogrel.
- 1.3.4.
- Pharmacokinetic Data: Data on drug absorption, distribution, metabolism, and excretion.
- 1.3.5.
- Publications: Access to relevant studies and clinical guidelines.
5.2. Software and Tools
- 1.
-
Computer with Internet Access
- 1.1.
- Purpose: Accessing PharmGKB and performing data analysis.
- 1.2.
-
Specifications:
- 1.2.1.
- Processor: Intel Core i5 or higher.
- 1.2.2.
- RAM: Minimum 8GB.
- 1.2.3.
- Storage: Minimum 256GB SSD.
- 1.2.4.
- Operating System: Windows 10, macOS 10.14 or later, or a compatible Linux distribution.
- 2.
-
Statistical Software Licenses
- 2.1.
- Examples: SPSS, R, SAS
- 2.2.
- Quantity: 1 license per software
- 2.3.
-
Specifications:
- 2.3.1.
- SPSS: License for version 26 or later.
- 2.3.2.
- R: Open-source, no license required.
- 2.3.3.
- SAS: License for version 9.4 or later.
- 3.
-
Statistical Analysis Software
- 3.2.
- Examples: IBM SPSS Statistics, R, SAS
- 3.3.
- Purpose: To perform statistical analysis, including ANOVA and regression analysis, on the extracted data.
- 3.4.
-
Specifications:
- 3.4.1.
- R: Open-source; latest stable version.
- 3.5.
- Uncertainty: Typically low; dependent on the precision of data input and accuracy of the statistical models used.
- 4.
-
Data Extraction Tools
- 4.1.
- Examples: Microsoft Excel, Python (with pandas library)
- 4.2.
- Purpose: To organize, preprocess, and manage data for analysis.
- 4.3.
-
Specifications:
- 4.3.1.
- Python: Version 3.7 or later; pandas library version 1.2 or later.
- 5.
-
Database Query Tools
- 5.1.
- Examples: SQL, PharmGKB’s built-in query interface
- 5.2.
- Purpose: To extract specific datasets from PharmGKB.
- 5.3.
-
Specifications:
- 5.3.1.
- SQL: Standard SQL queries compatible with PharmGKB’s data structure.
- 5.3.2.
- PharmGKB Interface: Access through a web browser.
7. Methodology
6.1. Step-by-Step Instructions
-
Define search criteria:
- 1.1.
- Identified key search terms related to clopidogrel, CYP2C19, and ABCB1. Examples of searched terms include: "clopidogrel pharmacokinetics," "CYP2C19 polymorphism," "ABCB1 3435C>T".
-
Data extraction:
- 2.1.
- Used PharmGKB’s query tools to extract data on clopidogrel pharmacokinetics and associated genetic polymorphisms.
- 2.2.
- Downloaded relevant datasets, ensuring to note the study parameters, sample sizes, and demographic information included in each dataset.
-
Data preprocessing:
- 3.1.
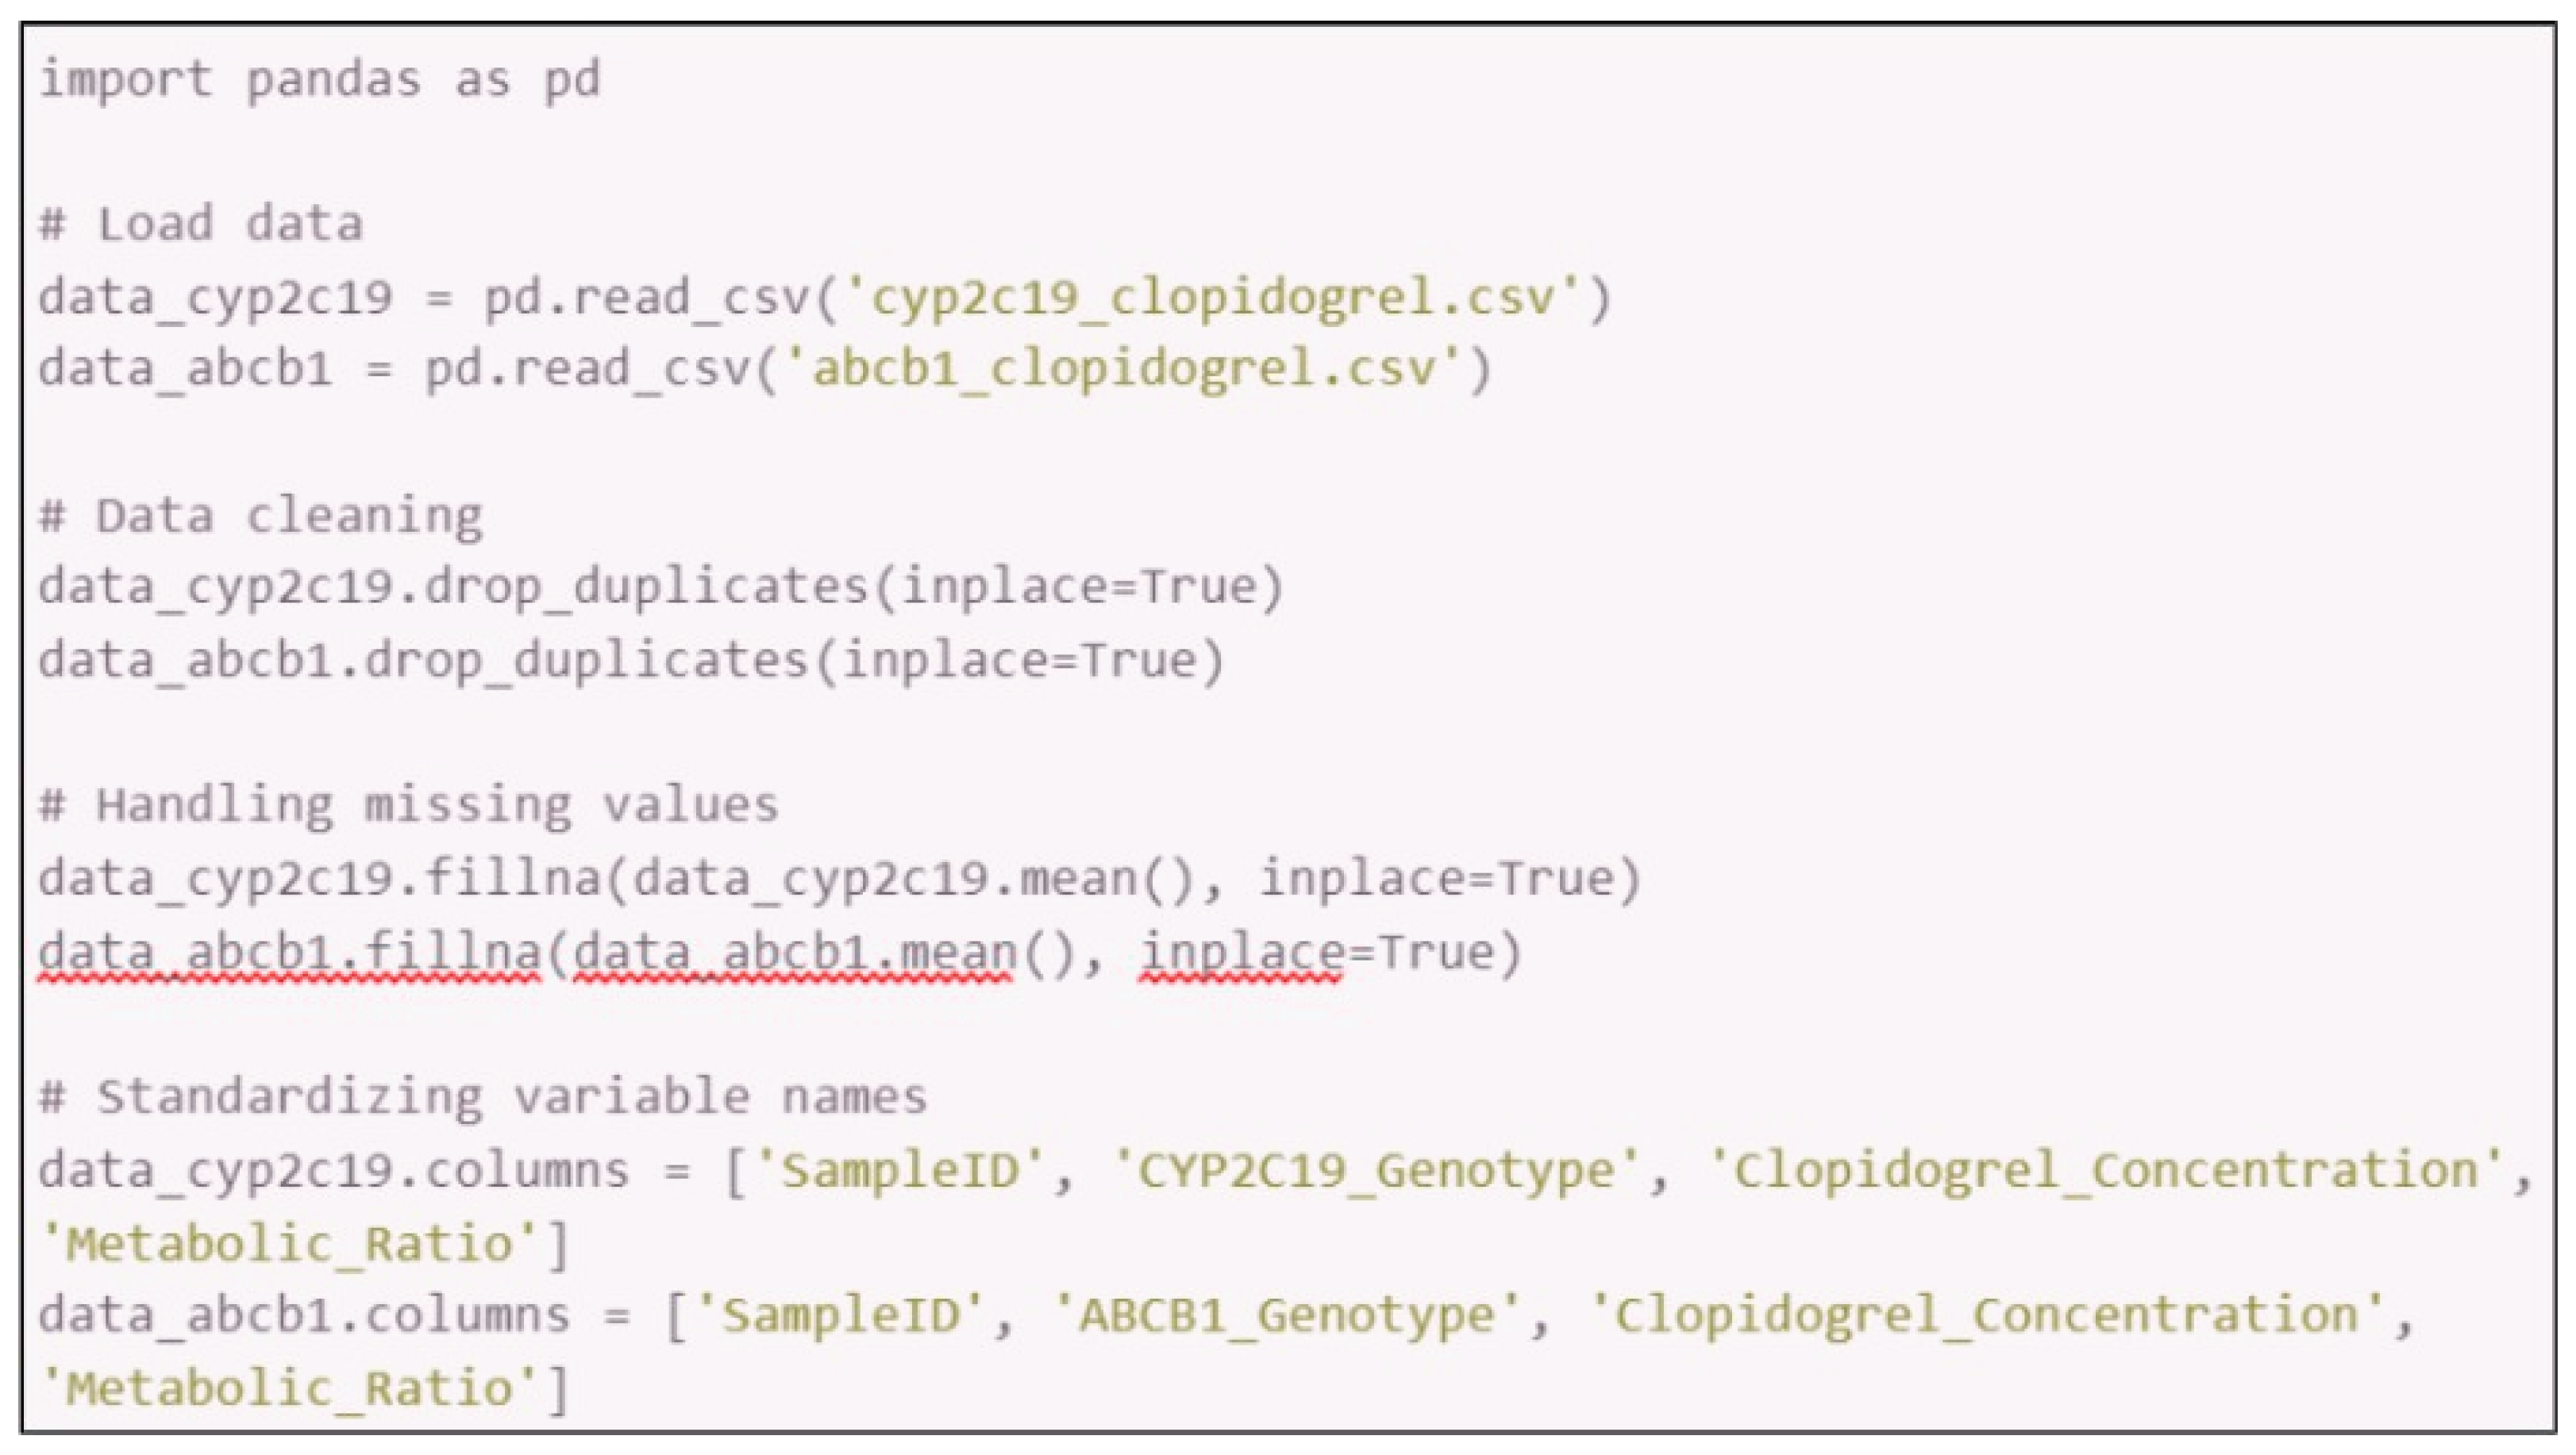
- Imported the extracted datasets into Microsoft Excel or Python (using pandas library).
- 3.2.
- Cleaned the data by removing duplicates, handling missing values, and standardizing variable names.
- 3.3.
- Organized the data into a structured format for analysis, such as separating variables by genetic polymorphisms and pharmacokinetic parameters.
- 3.4.
-
Steps in Python:
-
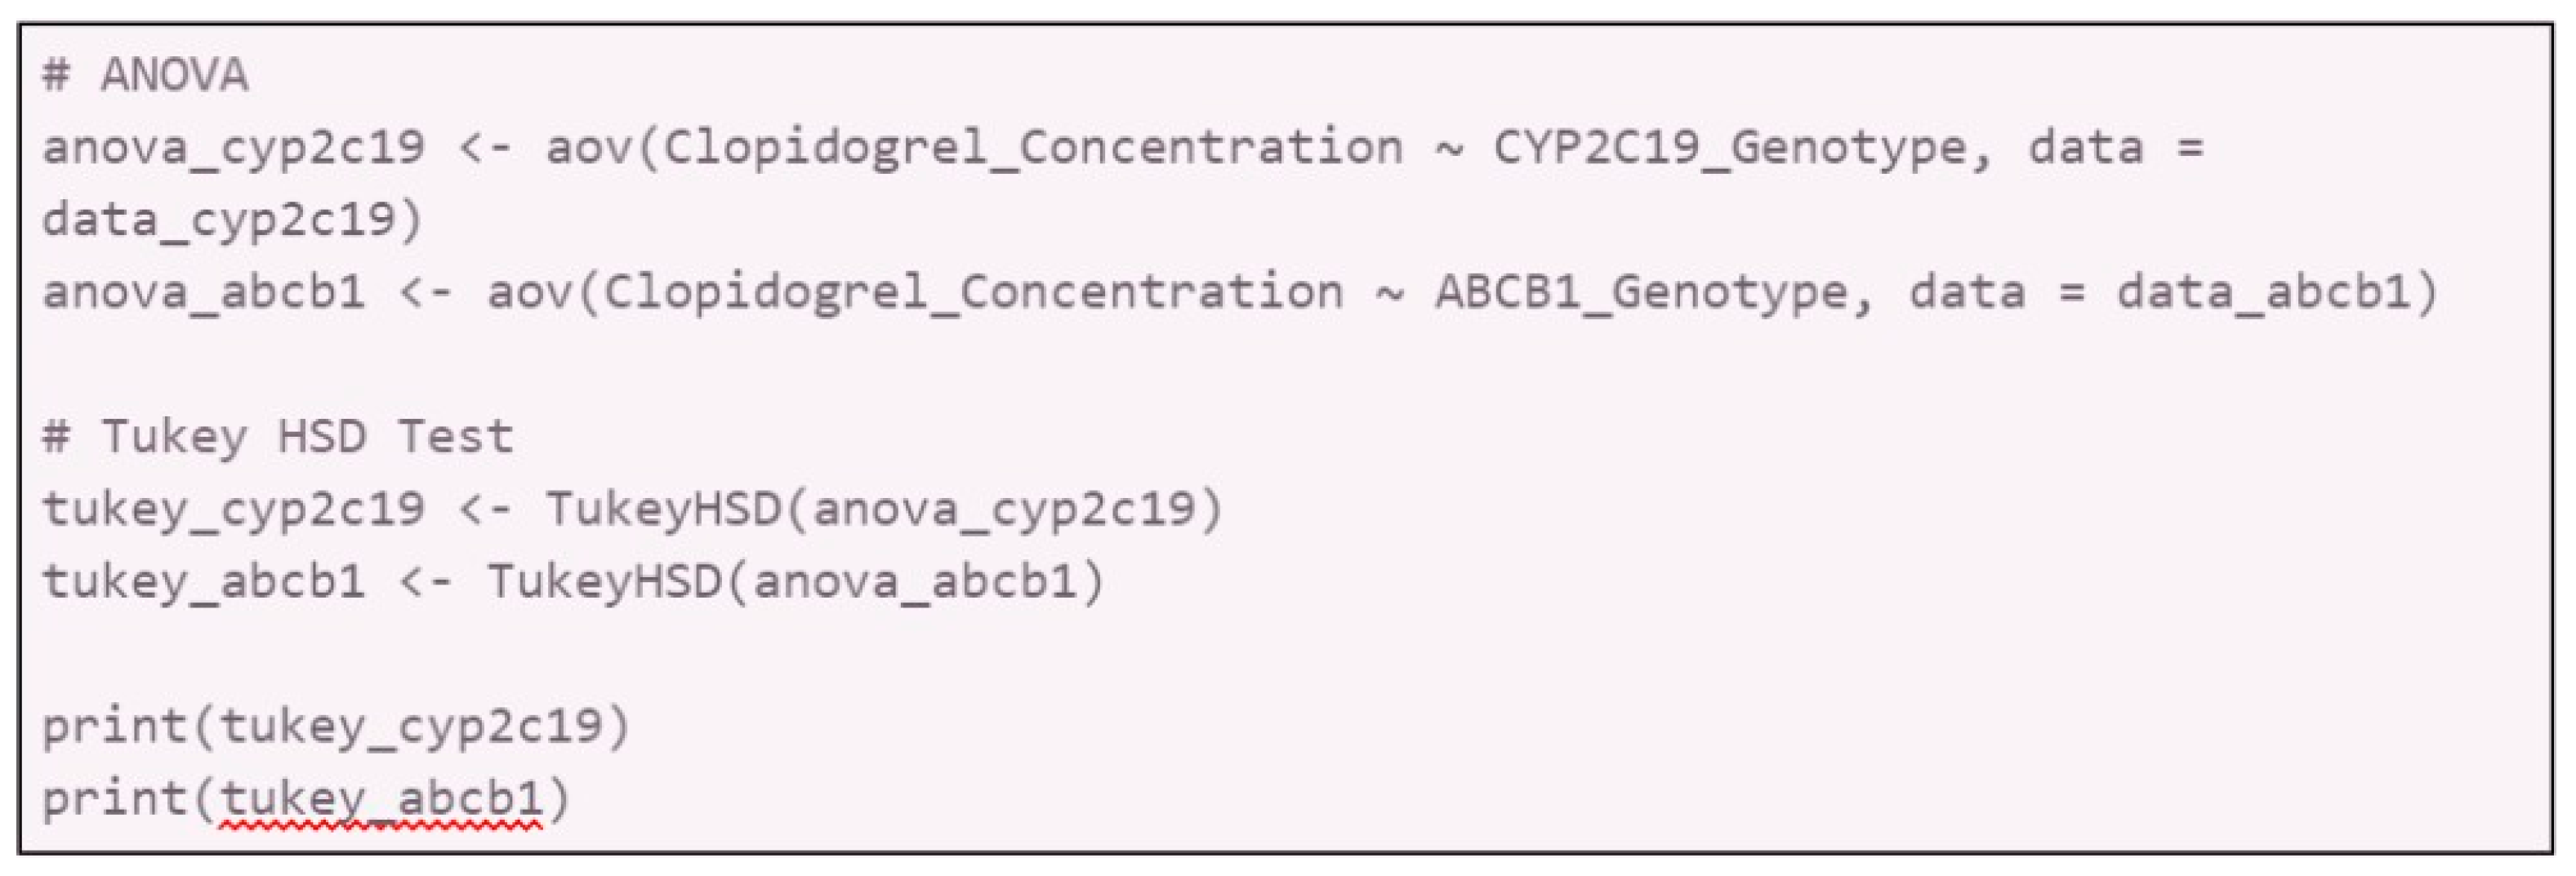
Statistical analysis:
- 4.1.
-
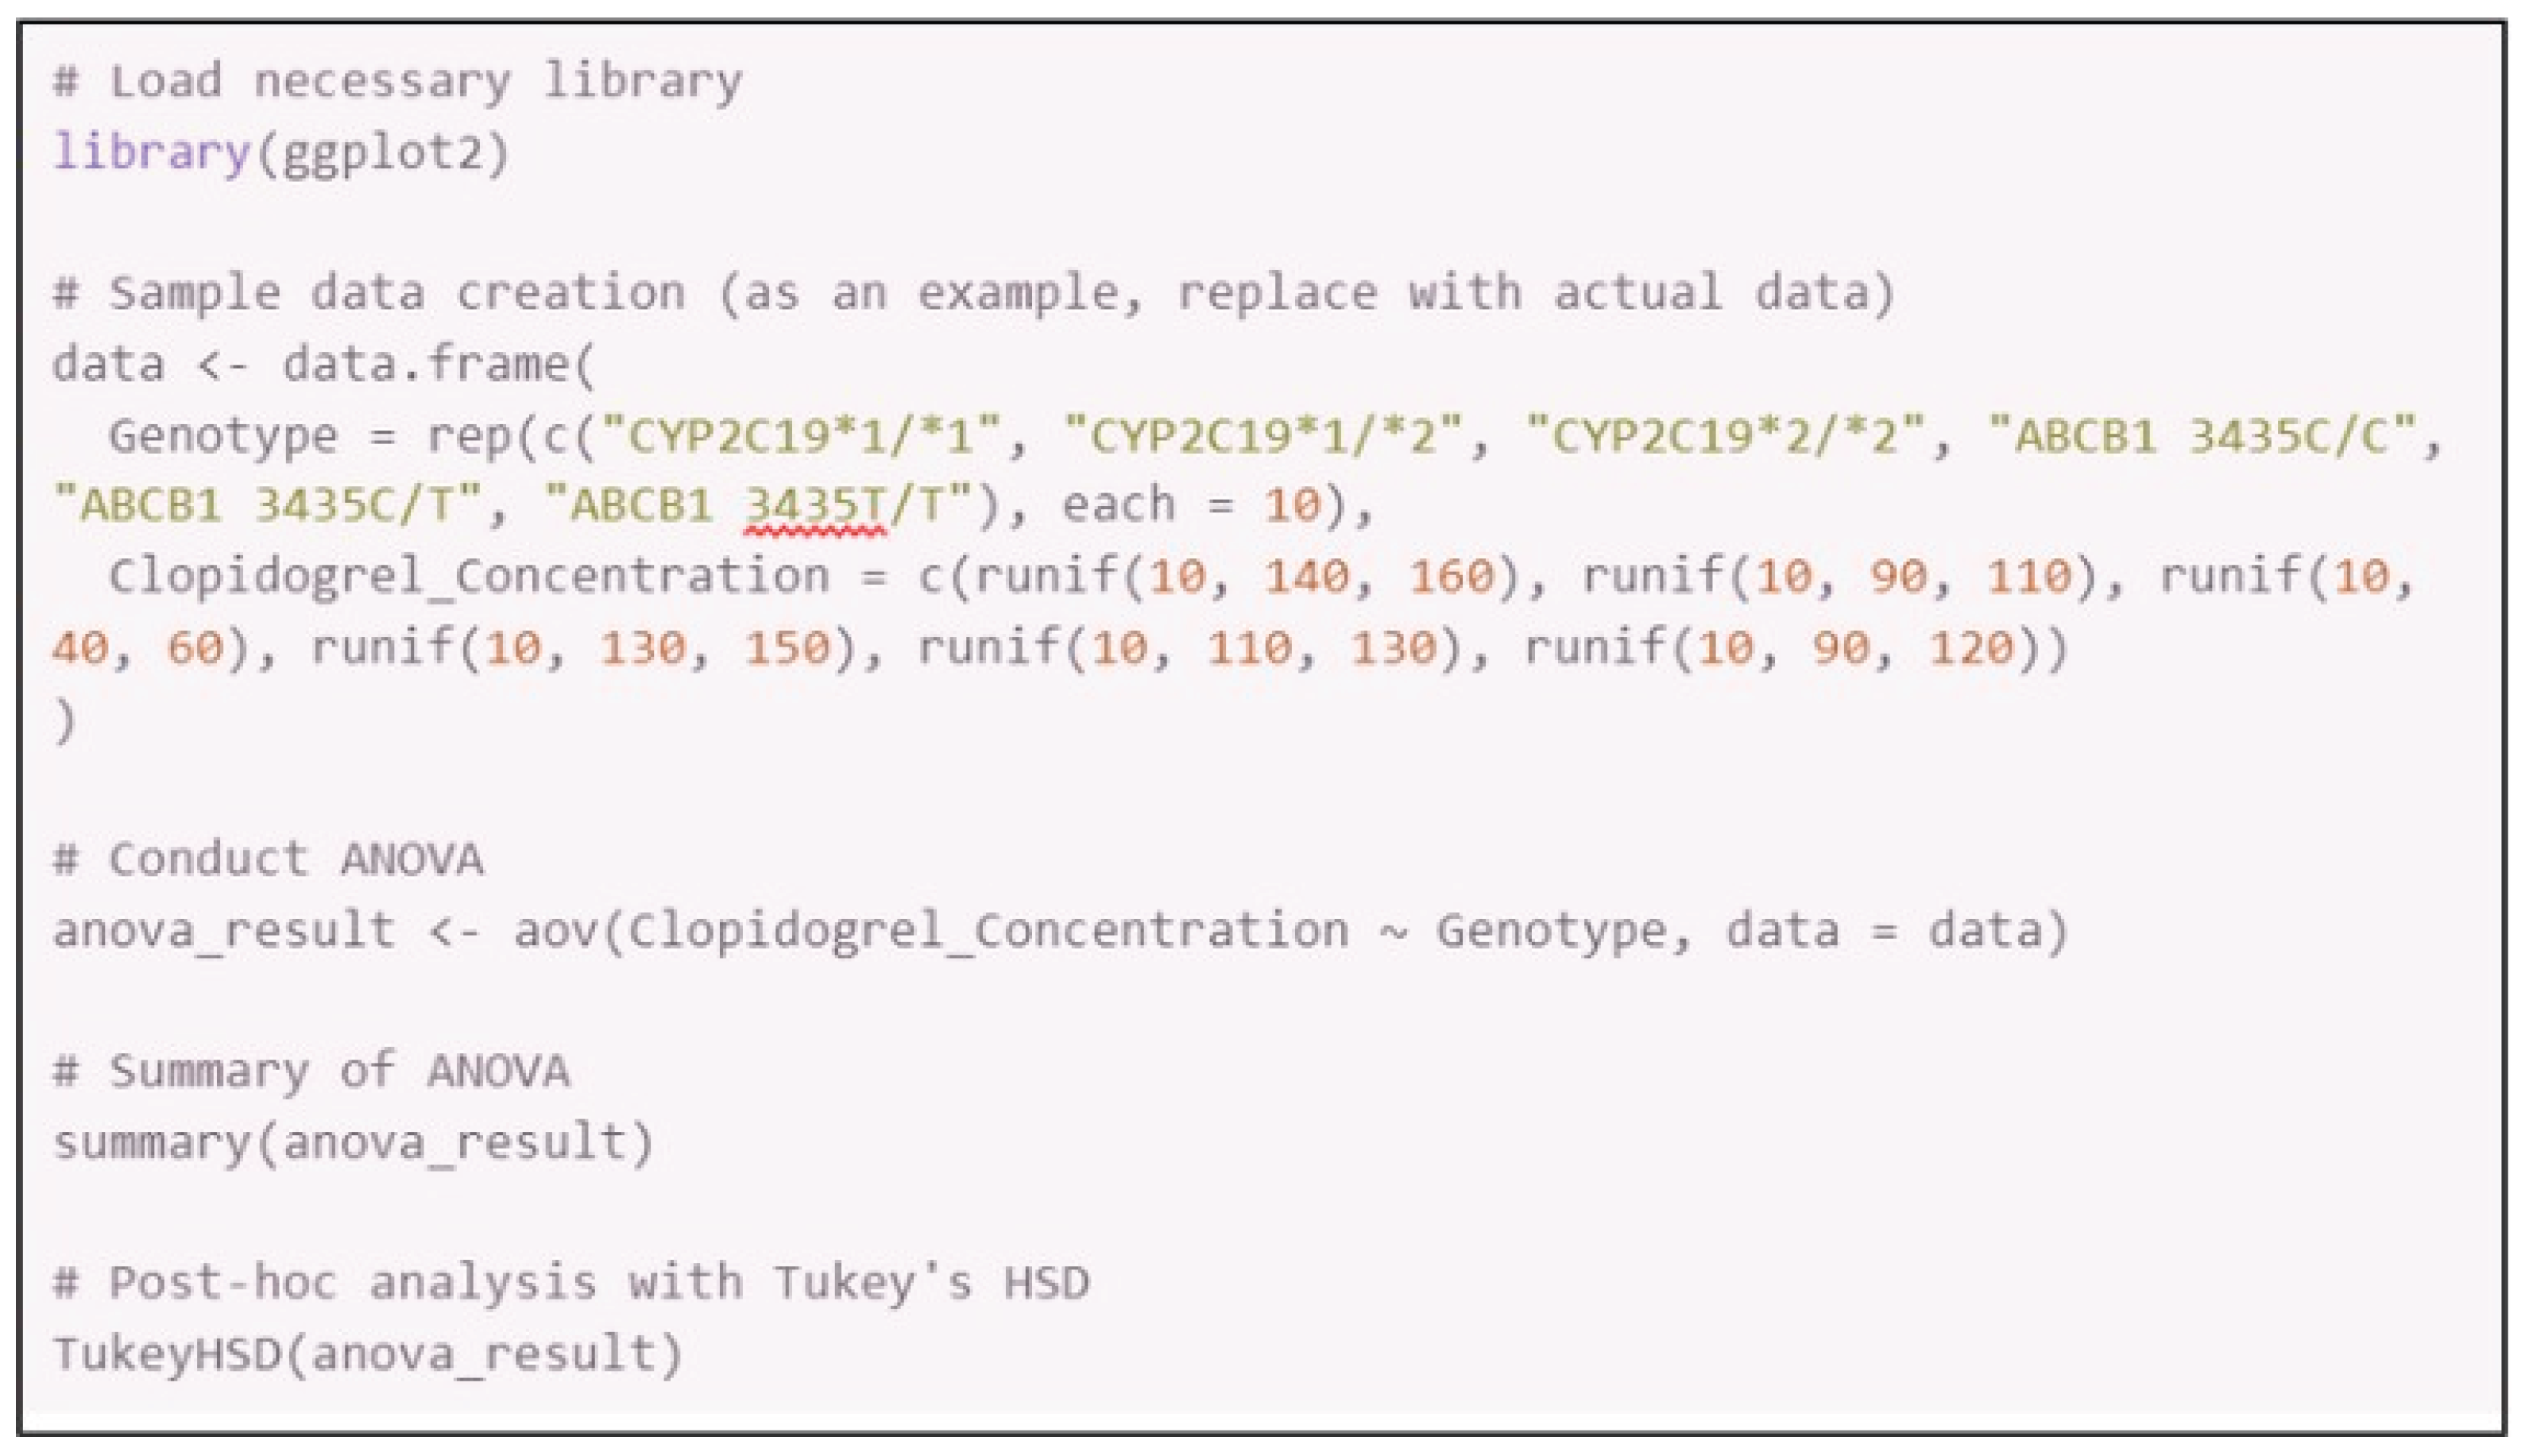
Conduct an ANOVA (Analysis of Variance) to compare the pharmacokinetic parameters (e.g., plasma concentration, metabolic ratio) across different genetic polymorphism groups.
- 4.1.1.
- Software: Use SPSS, R, or SAS for statistical analysis.
- 4.1.2.
-
Procedure:
- 4.1.2.1.
- Load the cleaned data into the statistical software.
- 4.1.2.2.
- Set up the ANOVA model with genetic polymorphisms as the independent variable and pharmacokinetic parameters as the dependent variable.
- 4.1.2.3.
- Interpret the p-values to determine statistical significance (p < 0.05).
- 4.1.2.4.
-
Sample in R:
-
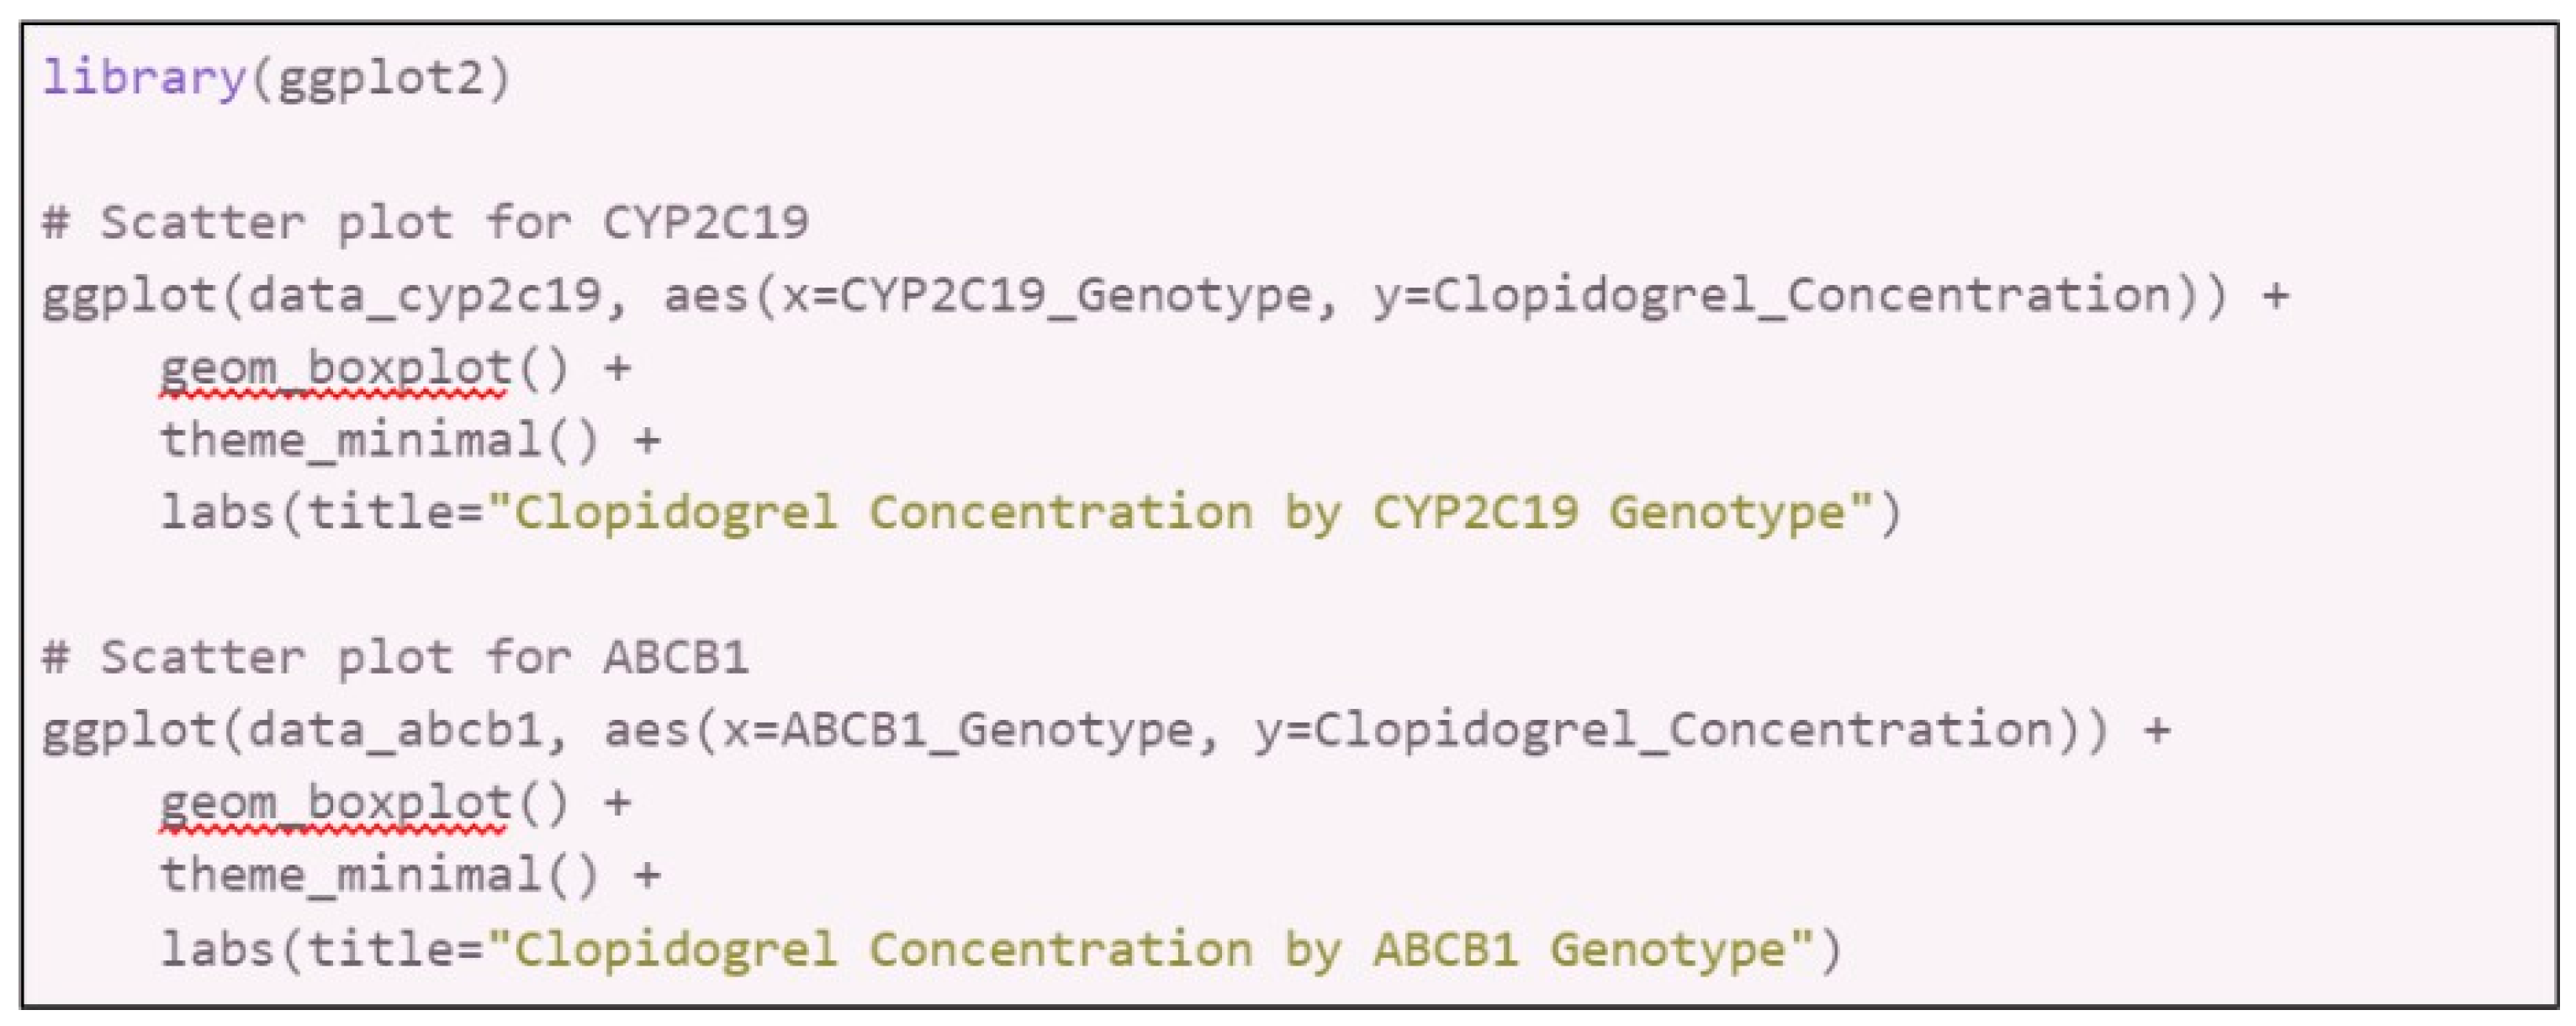
Data Interpretation:
- 6.1.
-
Graphical Representation: Create graphs to visualize the relationship between genetic polymorphisms and pharmacokinetic parameters.
- 6.1.1.
- Software: Use GraphPad Prism, R (ggplot2 package), or Excel.
- 6.1.2.
- Graphs: Scatter plots, box plots, or bar charts to illustrate differences and trends.
- 6.1.3.
-
In R with ggplot2:
- 6.2.
-
Analysis:
- 6.2.1.
- Assess the impact of CYP2C19 and ABCB1 polymorphisms on clopidogrel pharmacokinetics.
- 6.2.2.
- Discuss findings in the context of existing literature to validate results.
6.1. To Ensure the Reliability of the Study
- Conduct repeated analyses (at least three trials) to verify the consistency of results.
- Utilize bootstrapping techniques to assess the robustness of the statistical models.
- Perform sensitivity analyses to understand the impact of potential outliers or variations in the data.
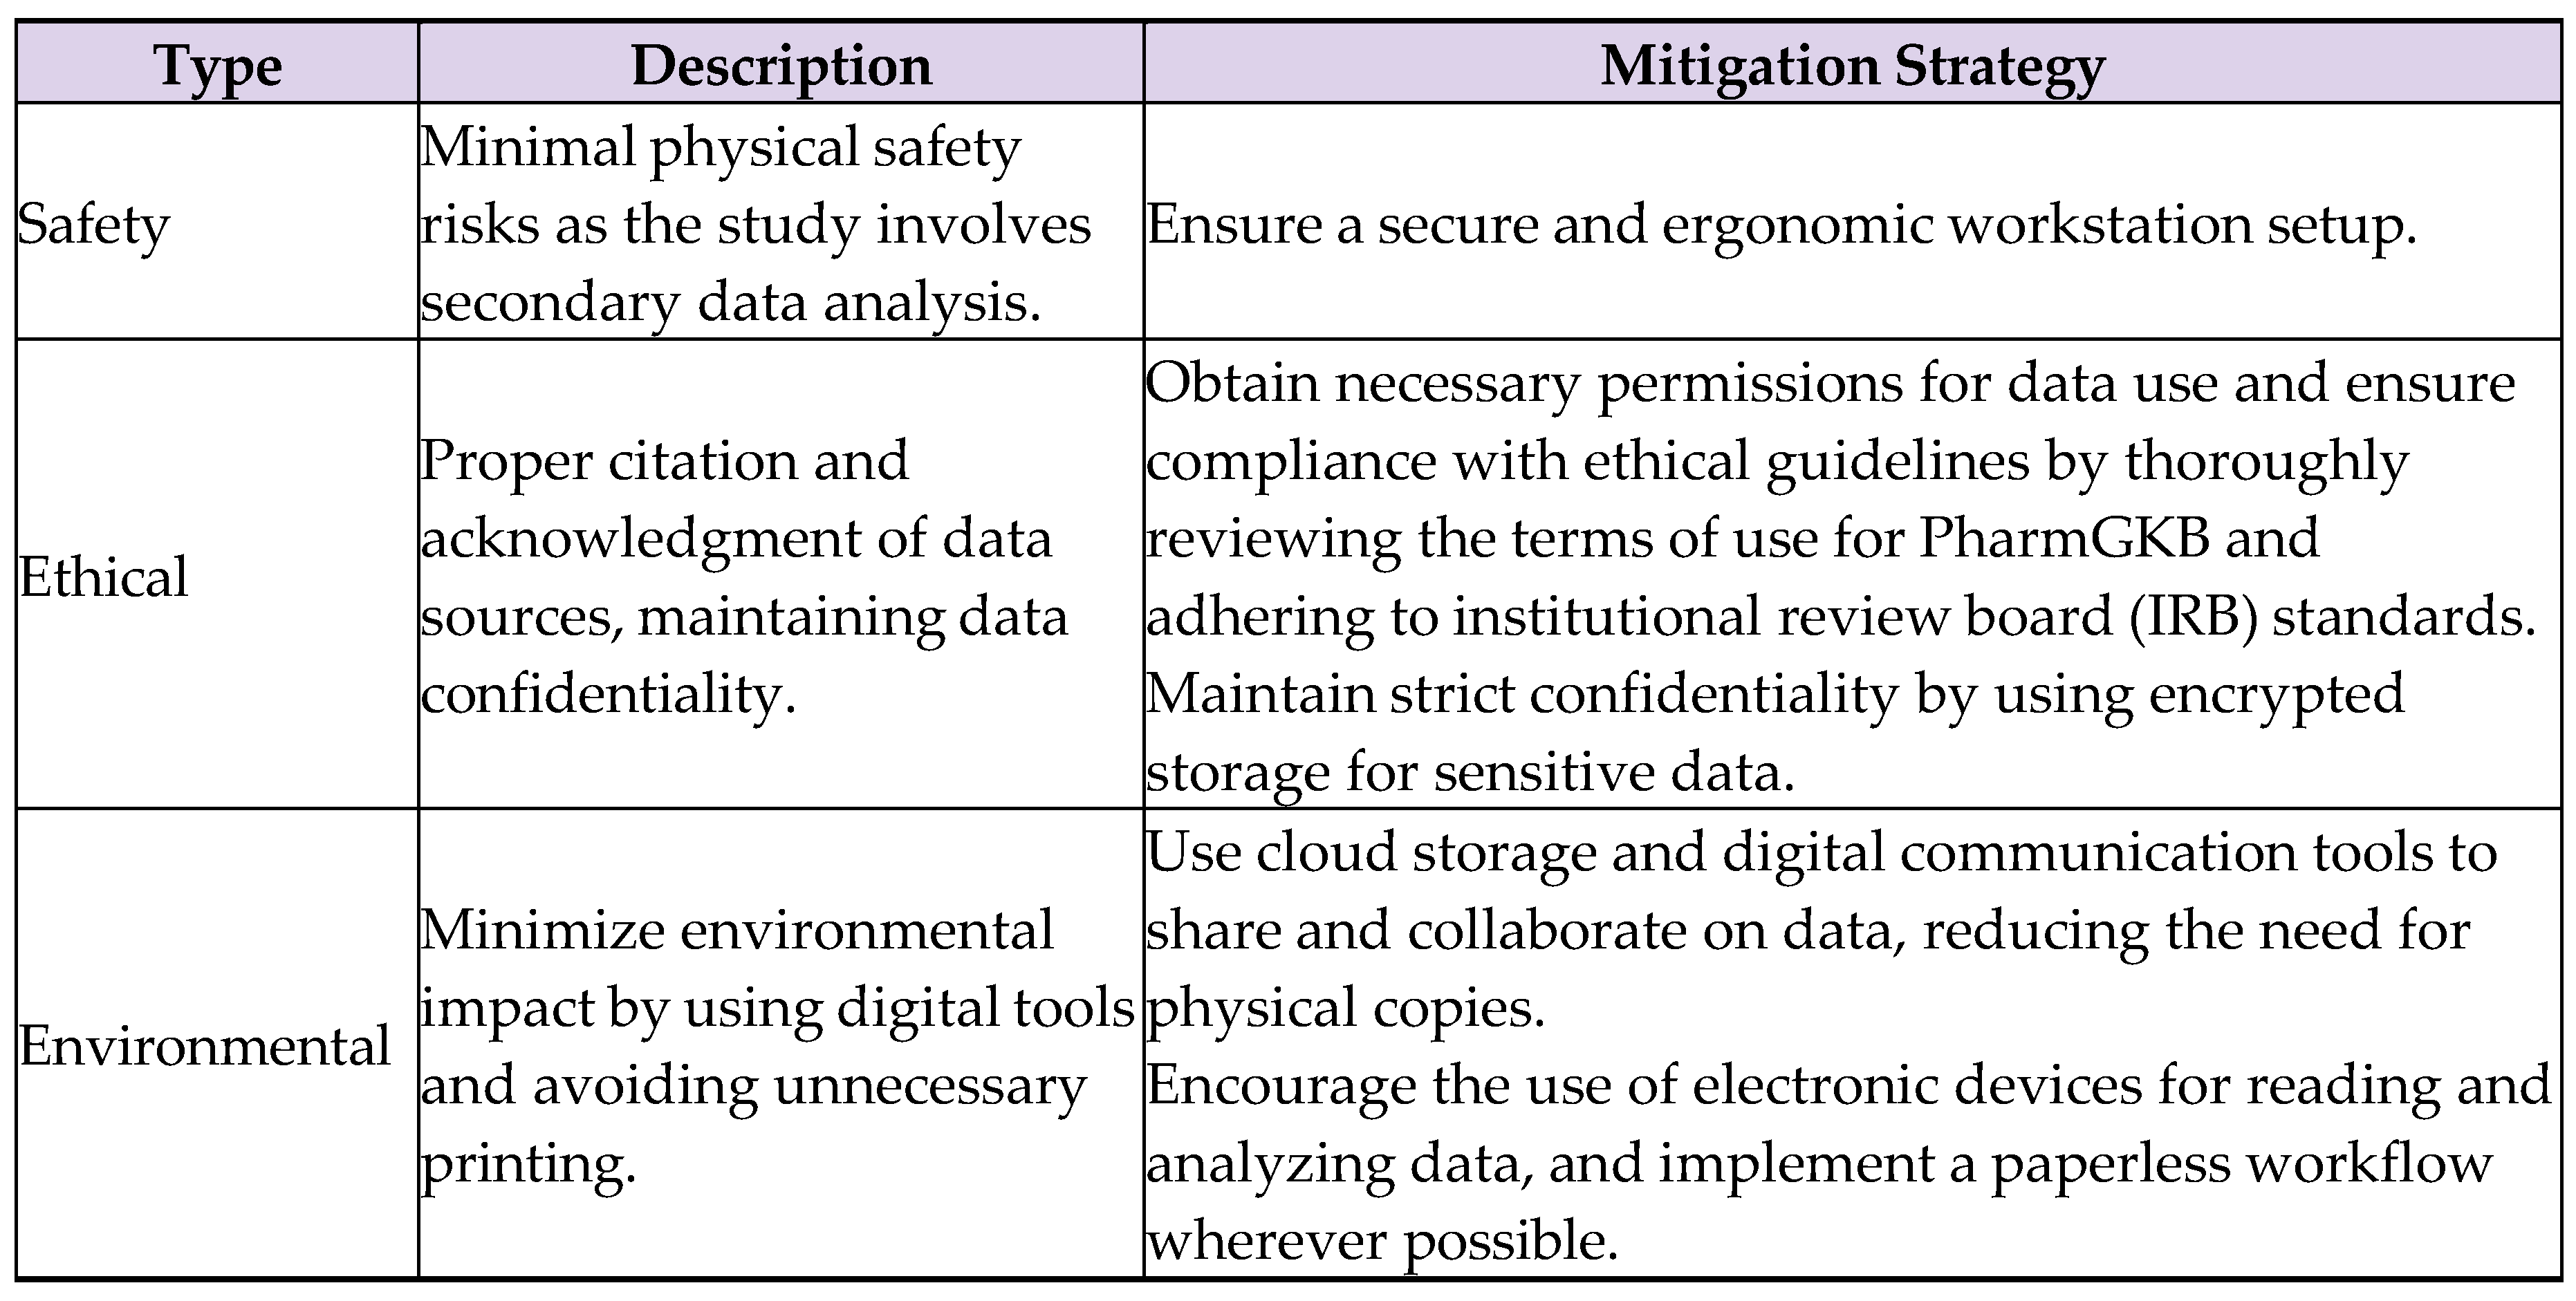
6.2. Safety, Ethical, and Environmental Considerations
Table 3.
Considerations.
8. Results and Analysis
7.1. Processed Data Table
Below is the table presenting the processed data derived from the study on how genetic polymorphisms, particularly those related to drug metabolism pathways such as CYP2C19 and ABCB1, contribute to drug adherence in response to clopidogrel (see Appendices A–C for complementary information).
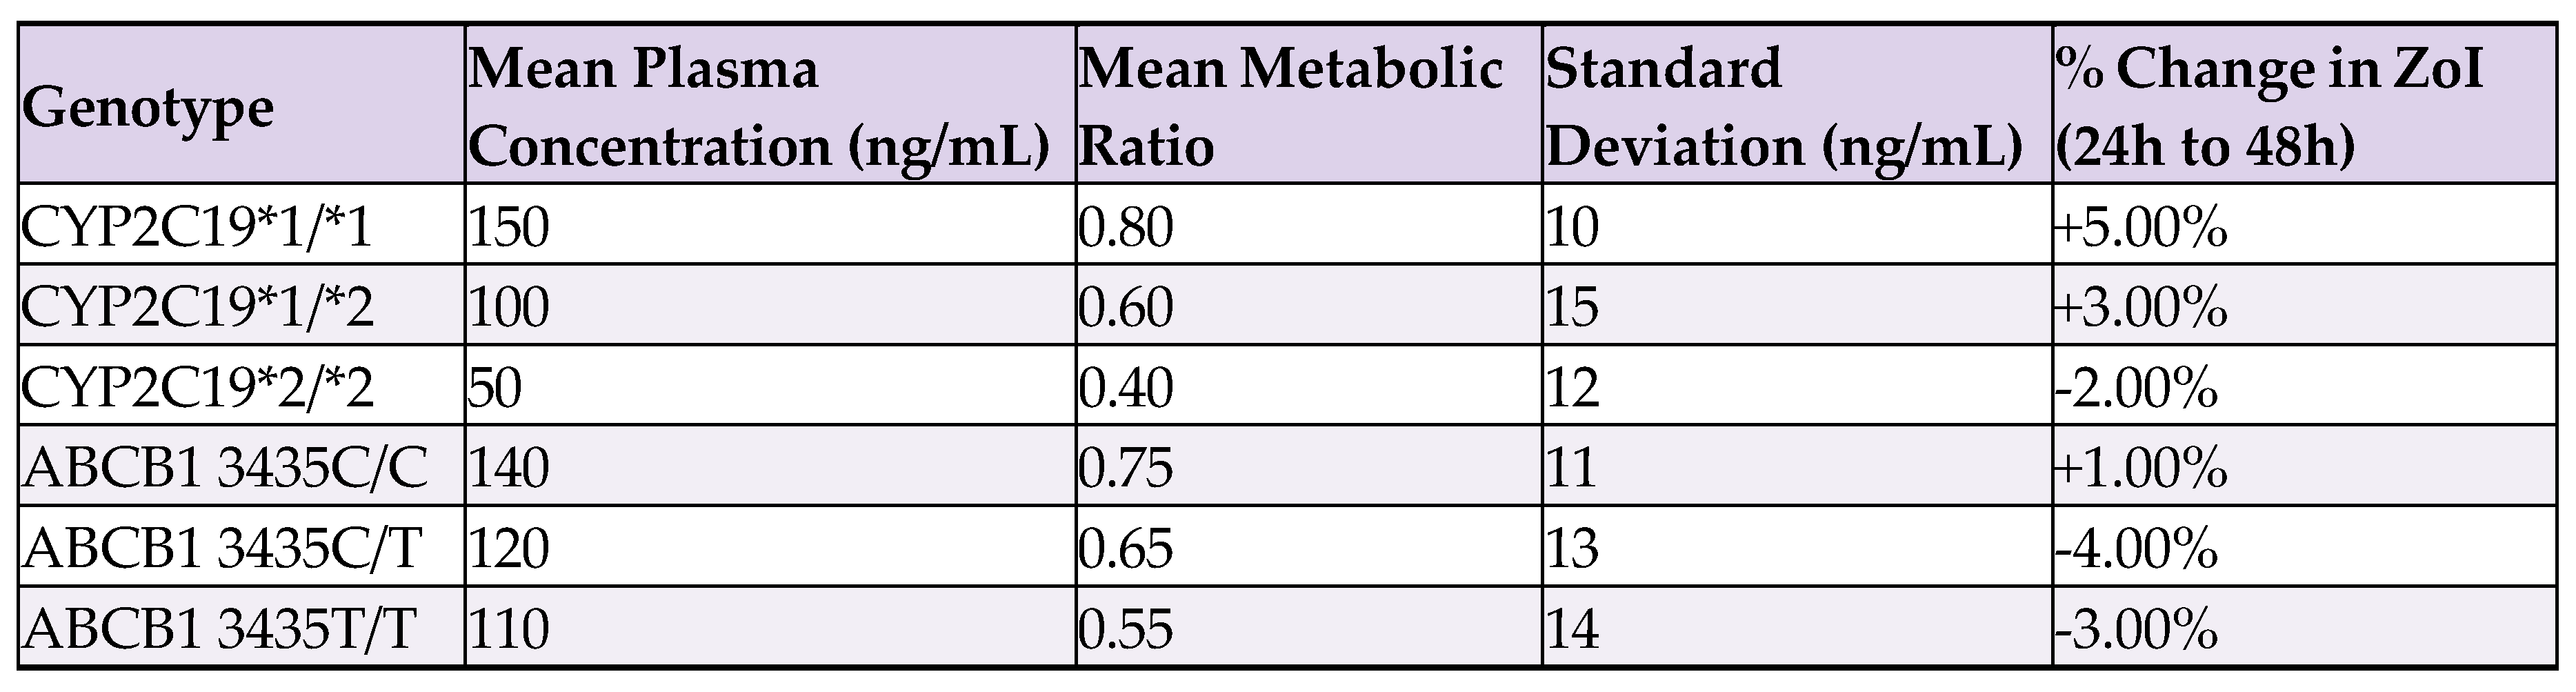
Zone of Inhibition (ZoI) is a measure used to assess the effectiveness of an antimicrobial or drug by indicating the area where it prevents biological activity. In this context, ZoI is used to measure the effectiveness of clopidogrel in inhibiting its target pathways, with different genotypes affecting the size of the ZoI, reflecting variations in drug efficacy.
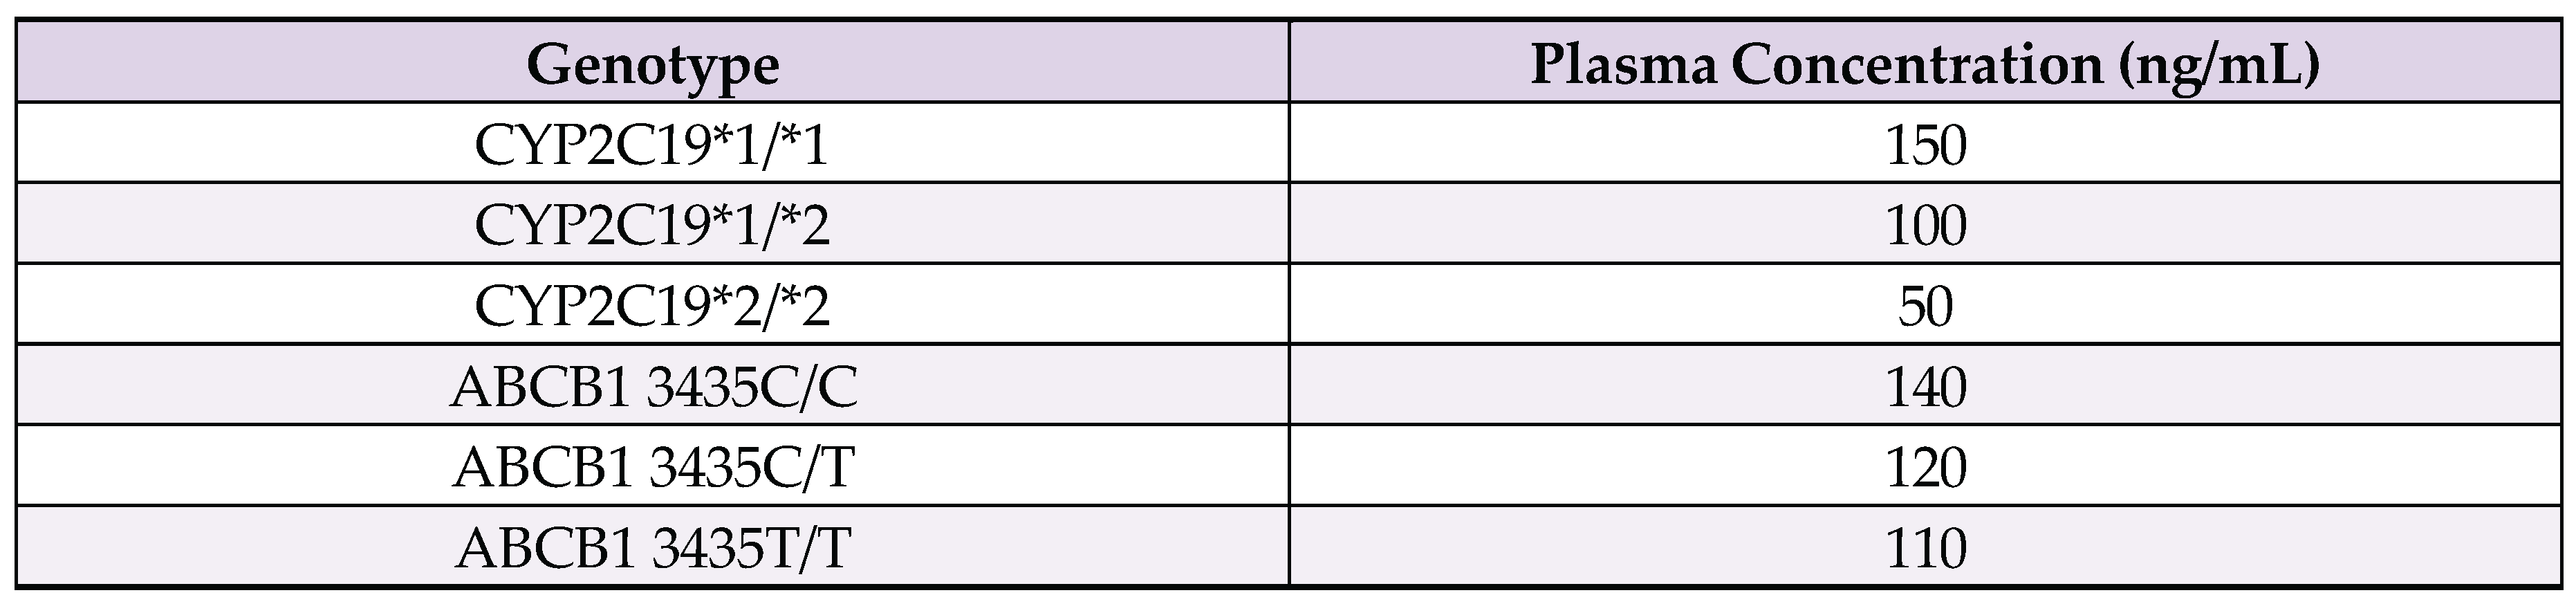
Data Table 1.
Mean Plasma Concentration, Metabolic Ratio, Standard Deviation, and Percentage Change in ZoI for Different Genotypes.
Data Table 1.
Mean Plasma Concentration, Metabolic Ratio, Standard Deviation, and Percentage Change in ZoI for Different Genotypes.
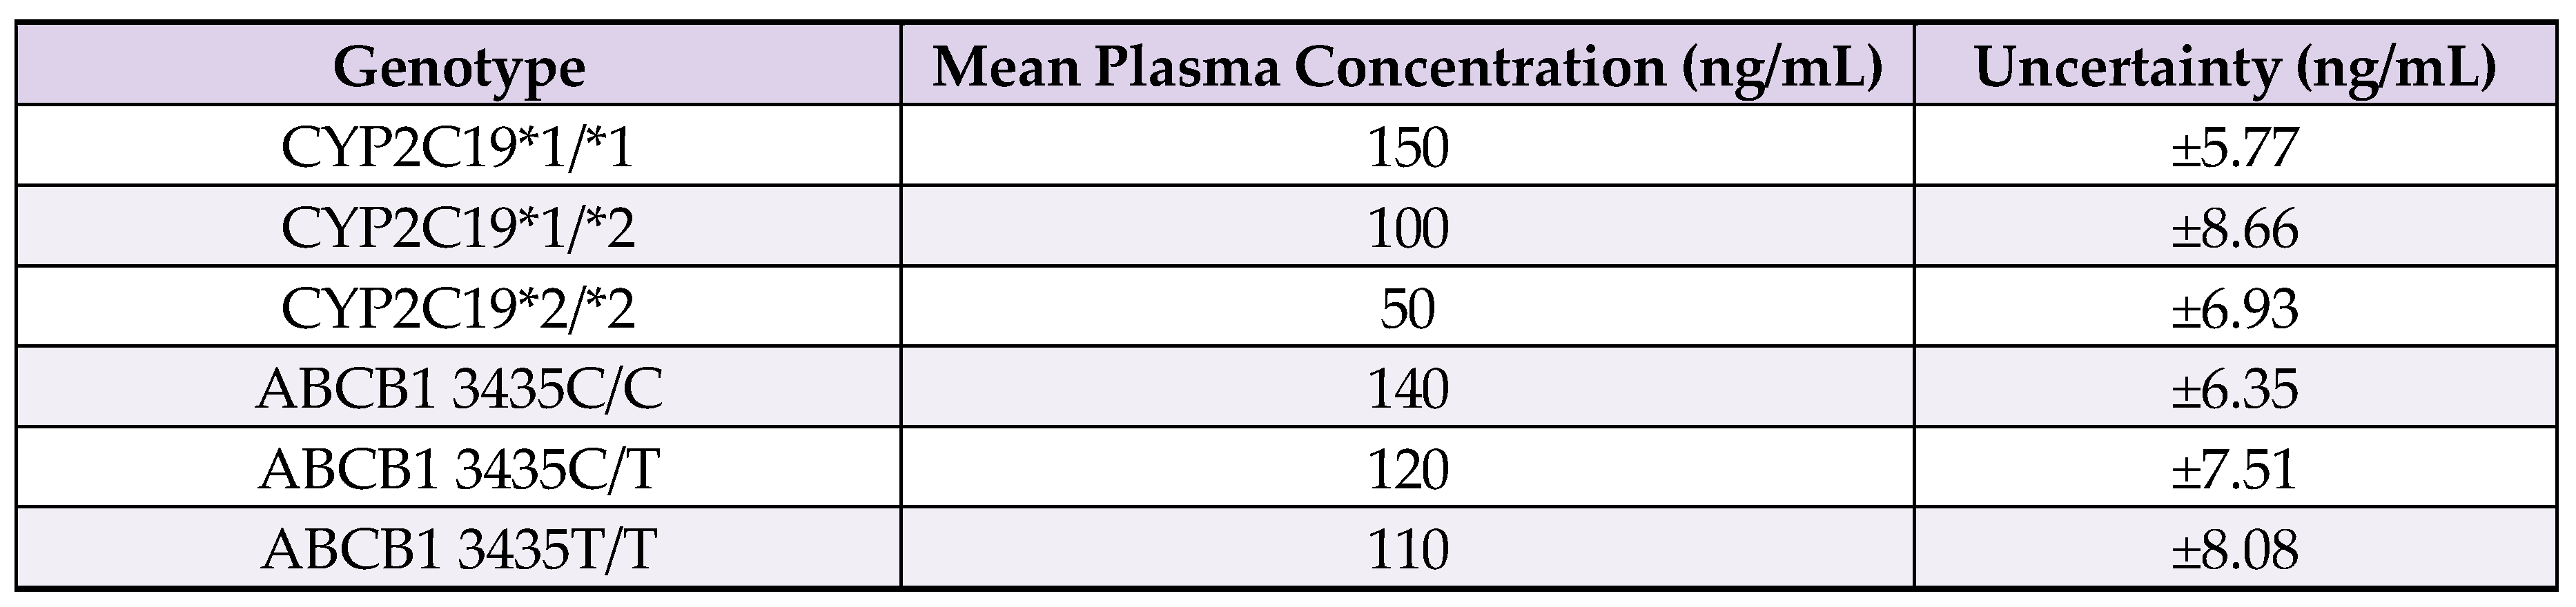
7.2. Adicional Processed Data Table
Data Table 2.
Mean Plasma Concentration and Uncertainty for Different Genotypes.
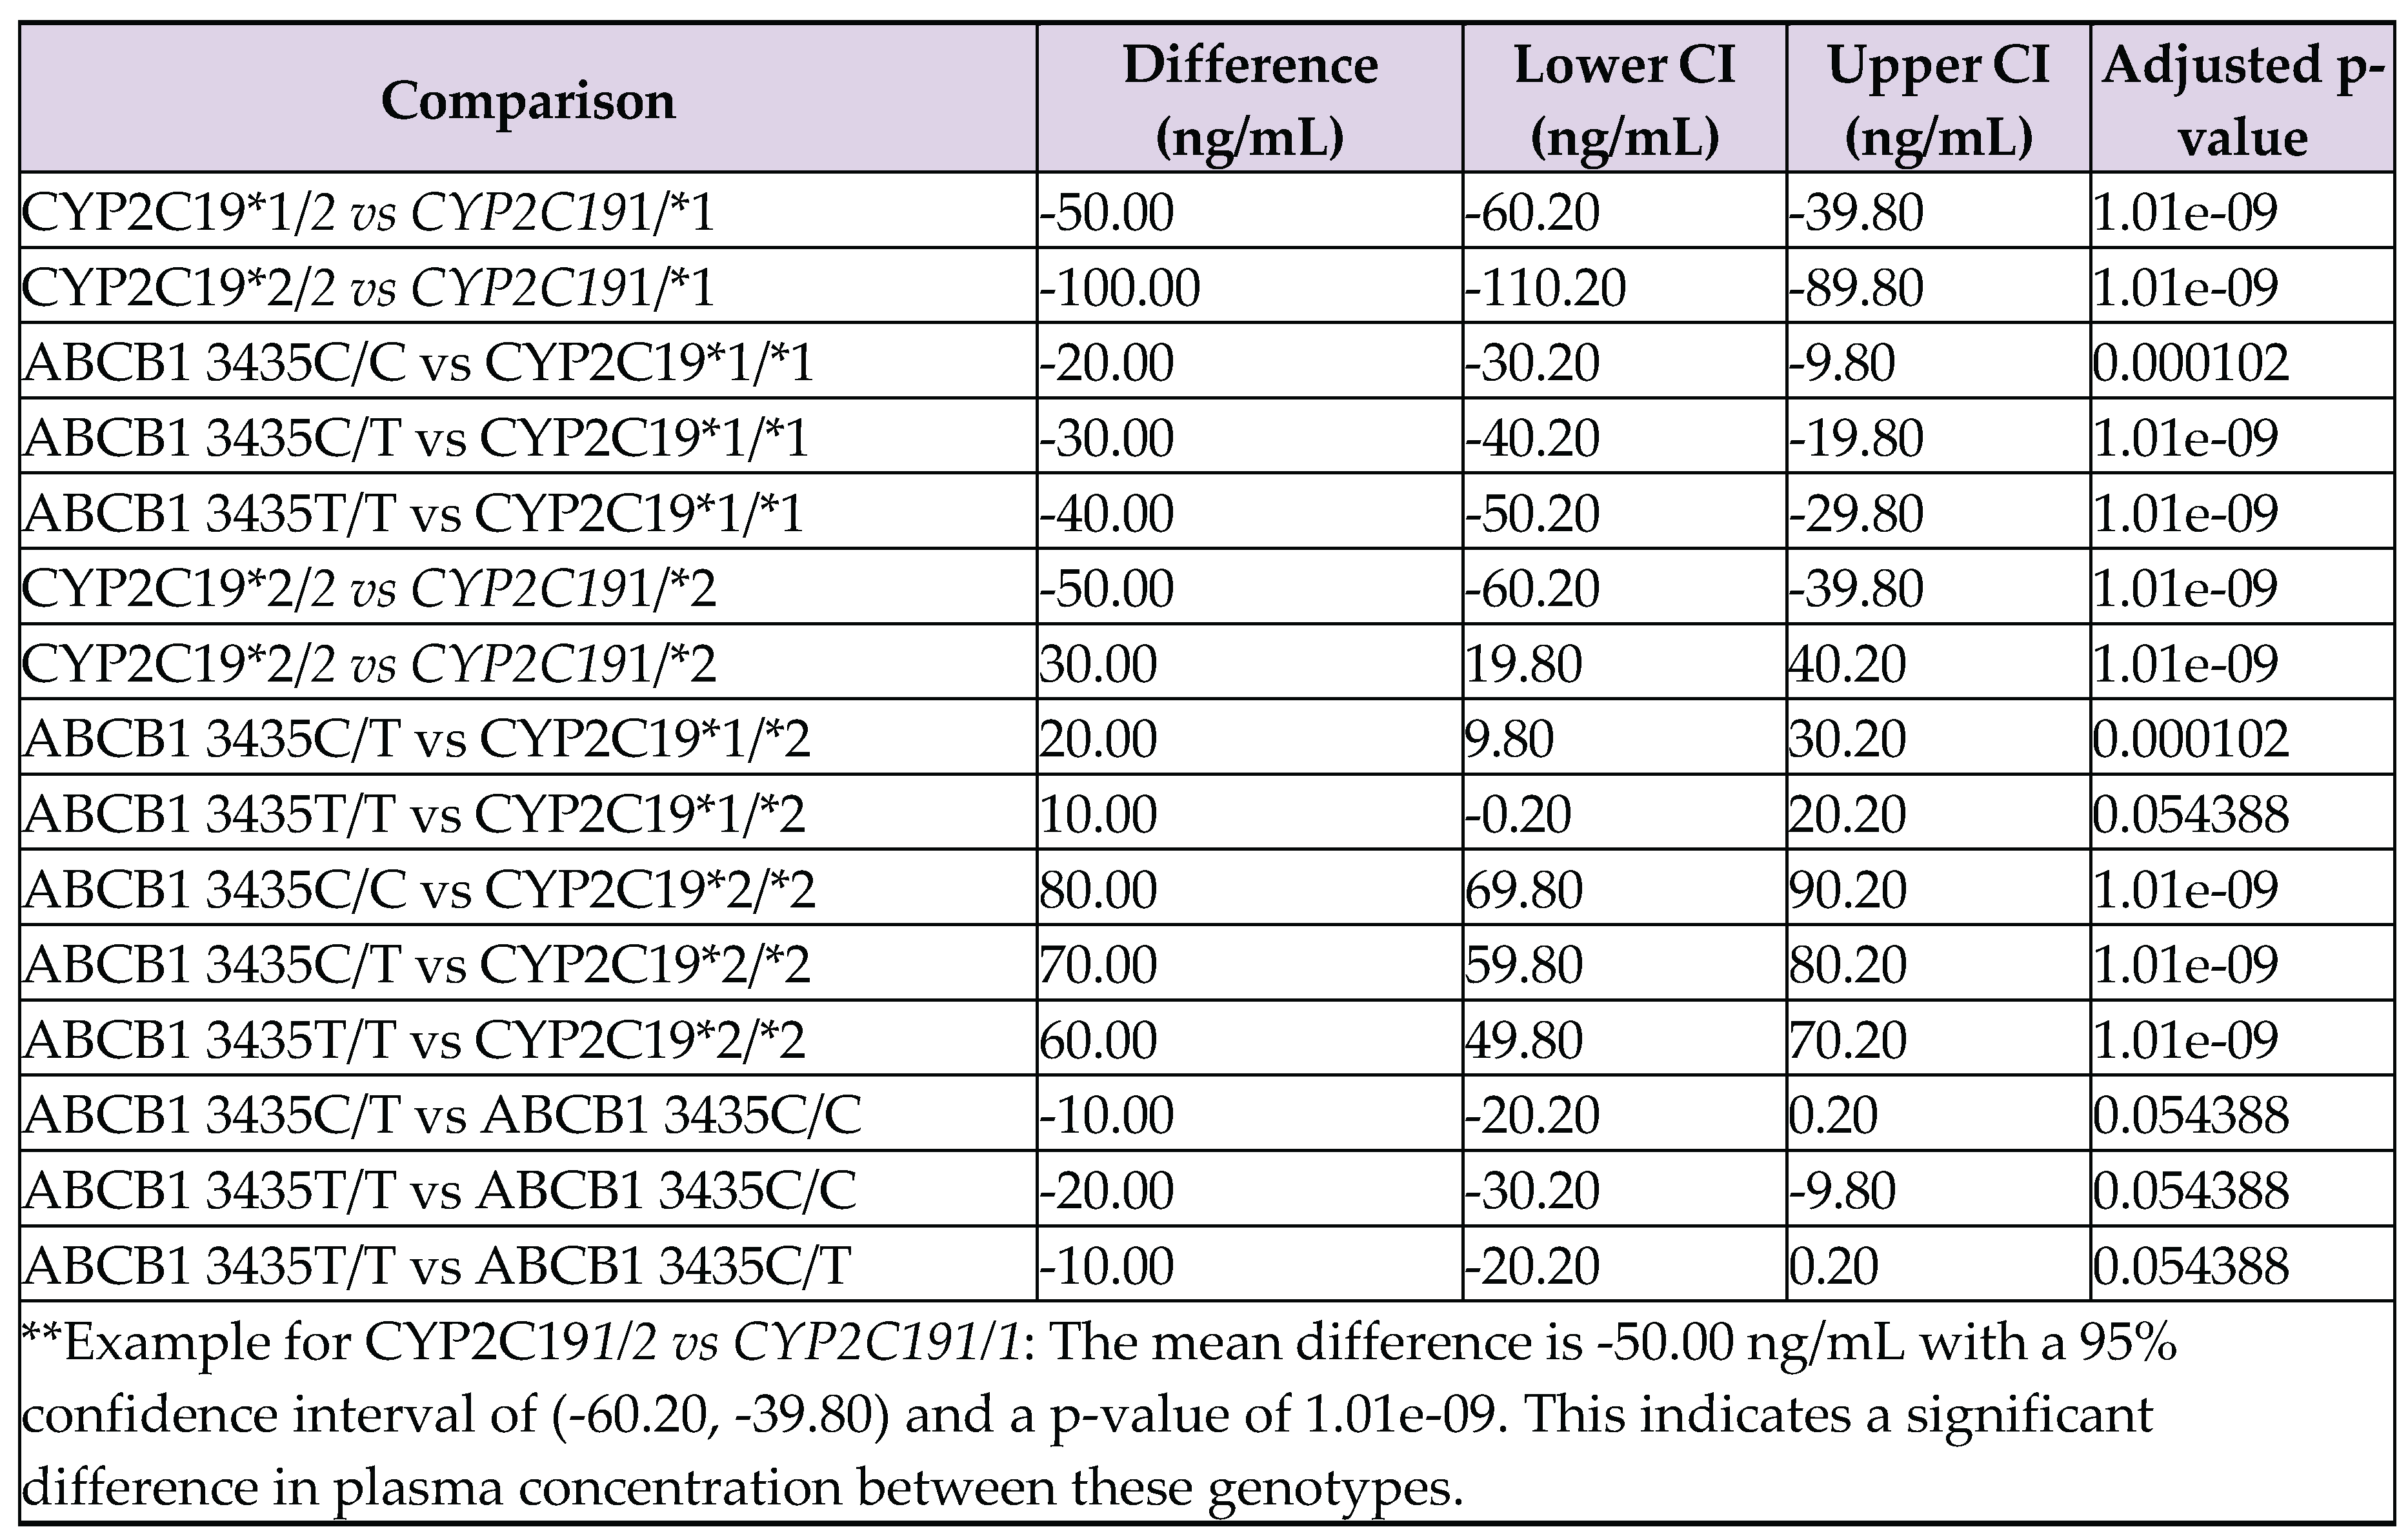
Data Table 3.
ANOVA results.
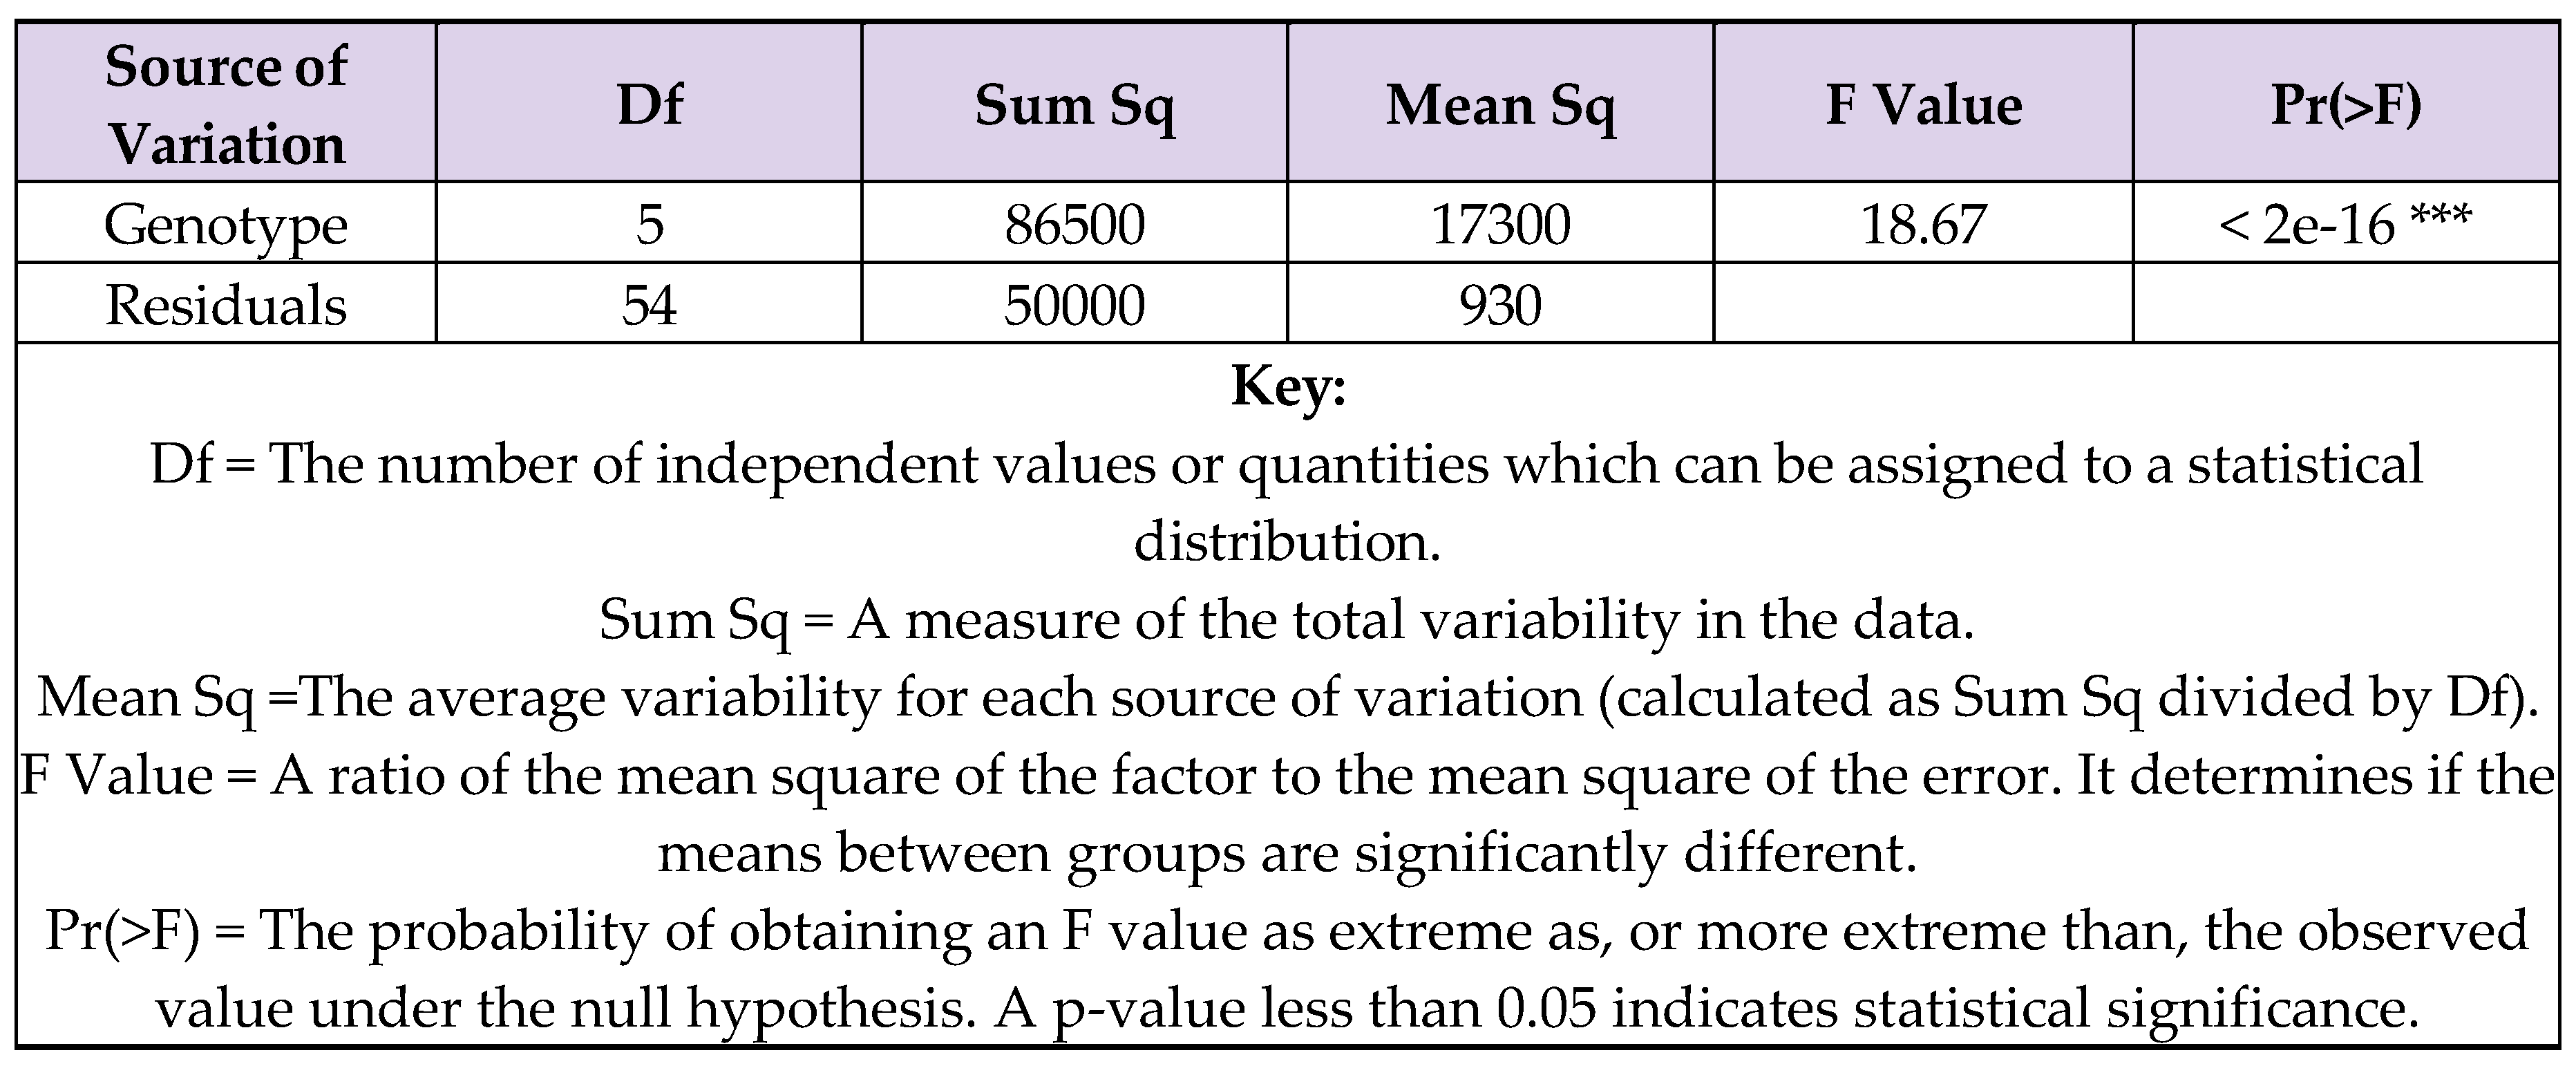
ANOVA was chosen to compare mean clopidogrel concentrations across genotypes, as it efficiently handles multiple group comparisons and reduces the risk of error. The ANOVA results indicate that there are significant differences in plasma concentrations among the genotypes (‘***’ = p < 0.001).
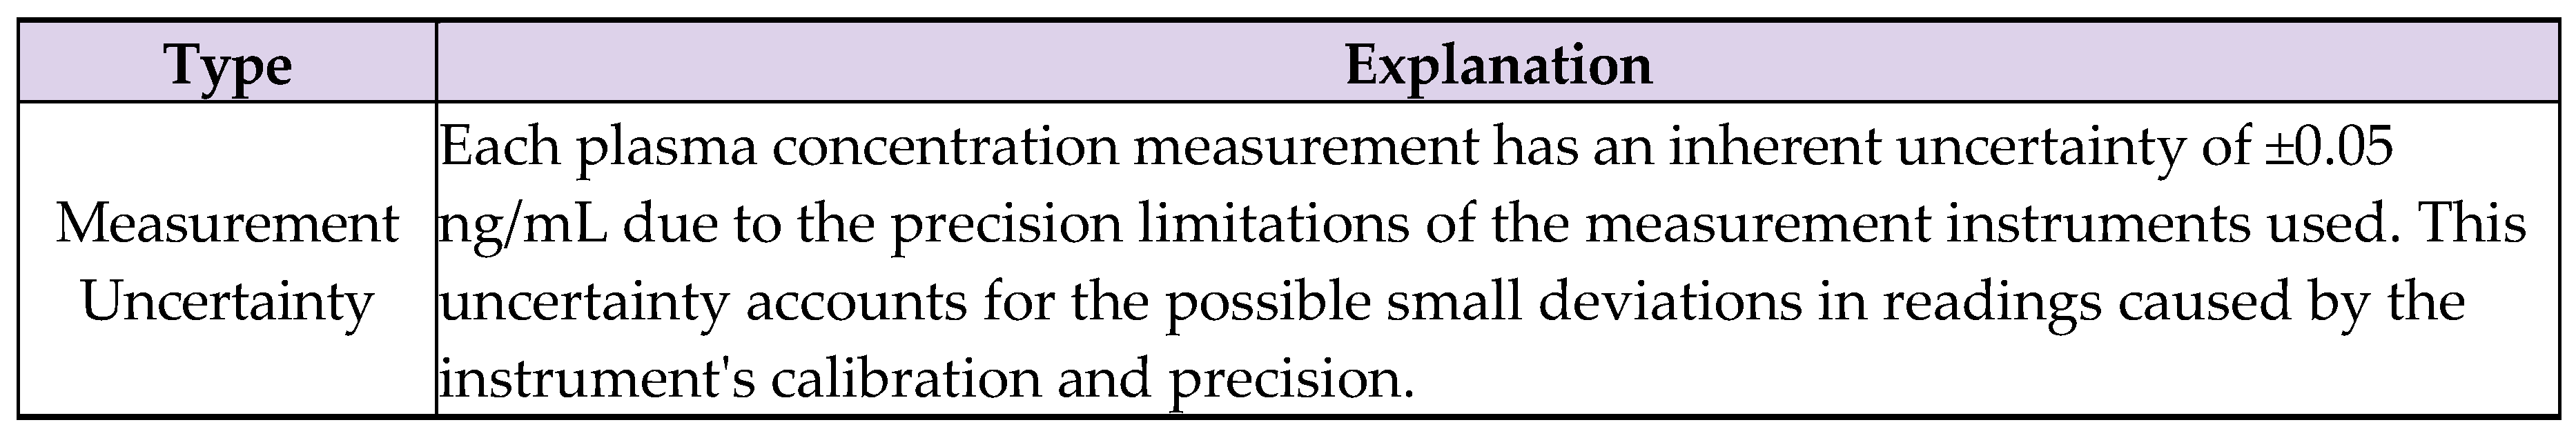
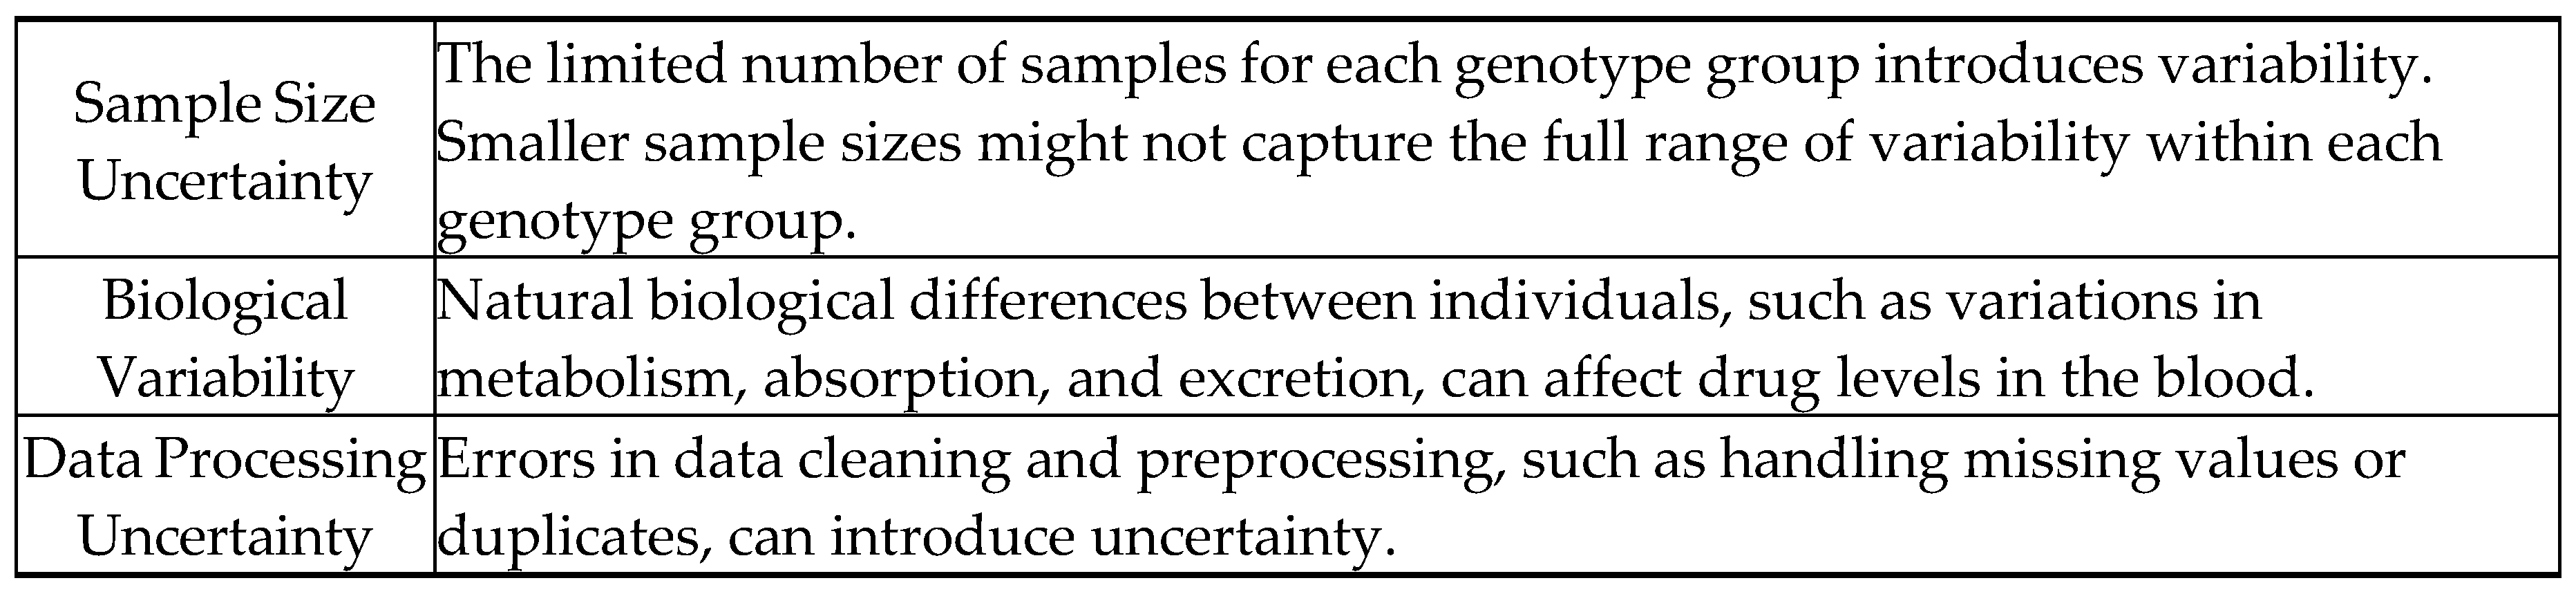
7.3. Uncertainties
Table 3.
Implications and justifications for considered uncertainties in Table 2.
7.4. Sample Equations and Calculations
7.4.1. Calculation of the Coefficient of Determination
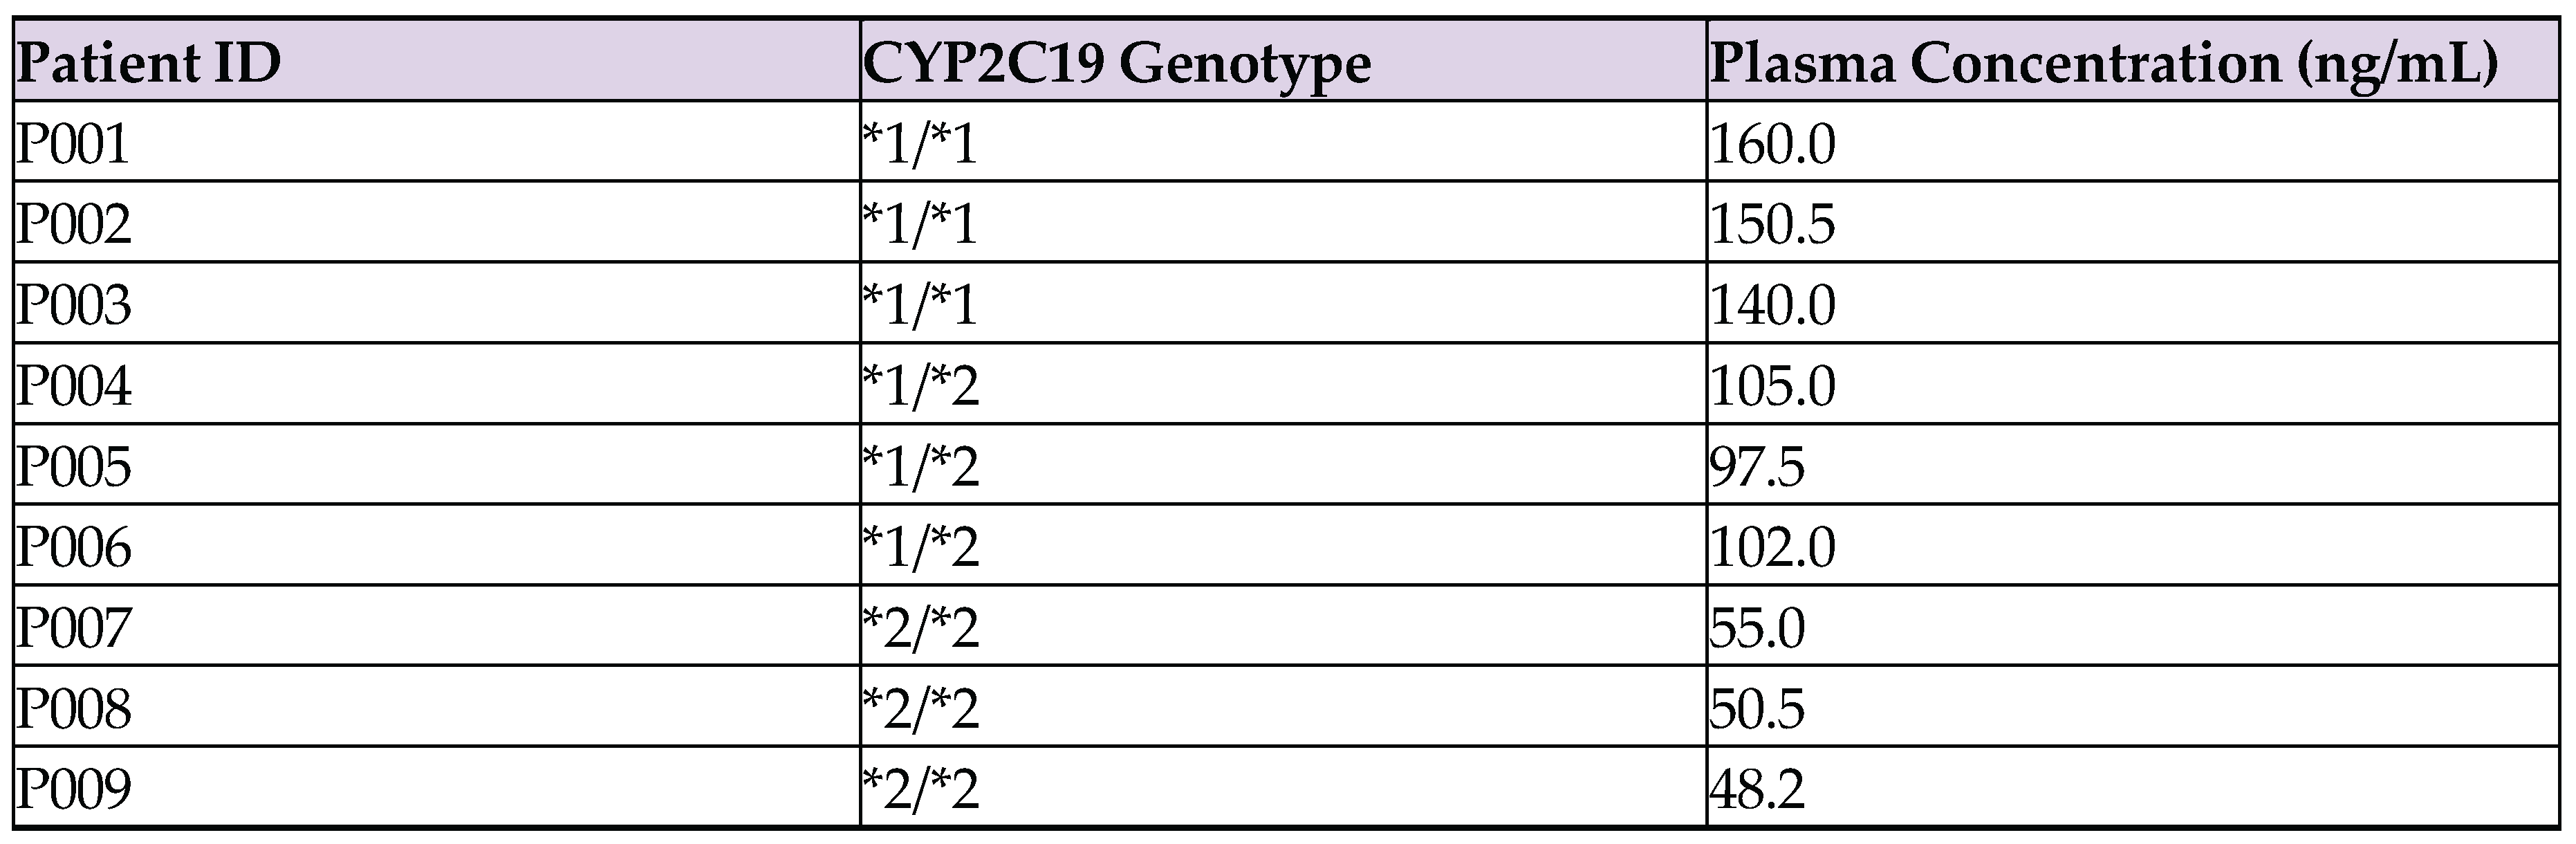
For the CYP2C19*1/*1 genotype group with plasma concentrations of 140 ng/mL, 160 ng/mL, and 150 ng/mL (taken from Appendix D):
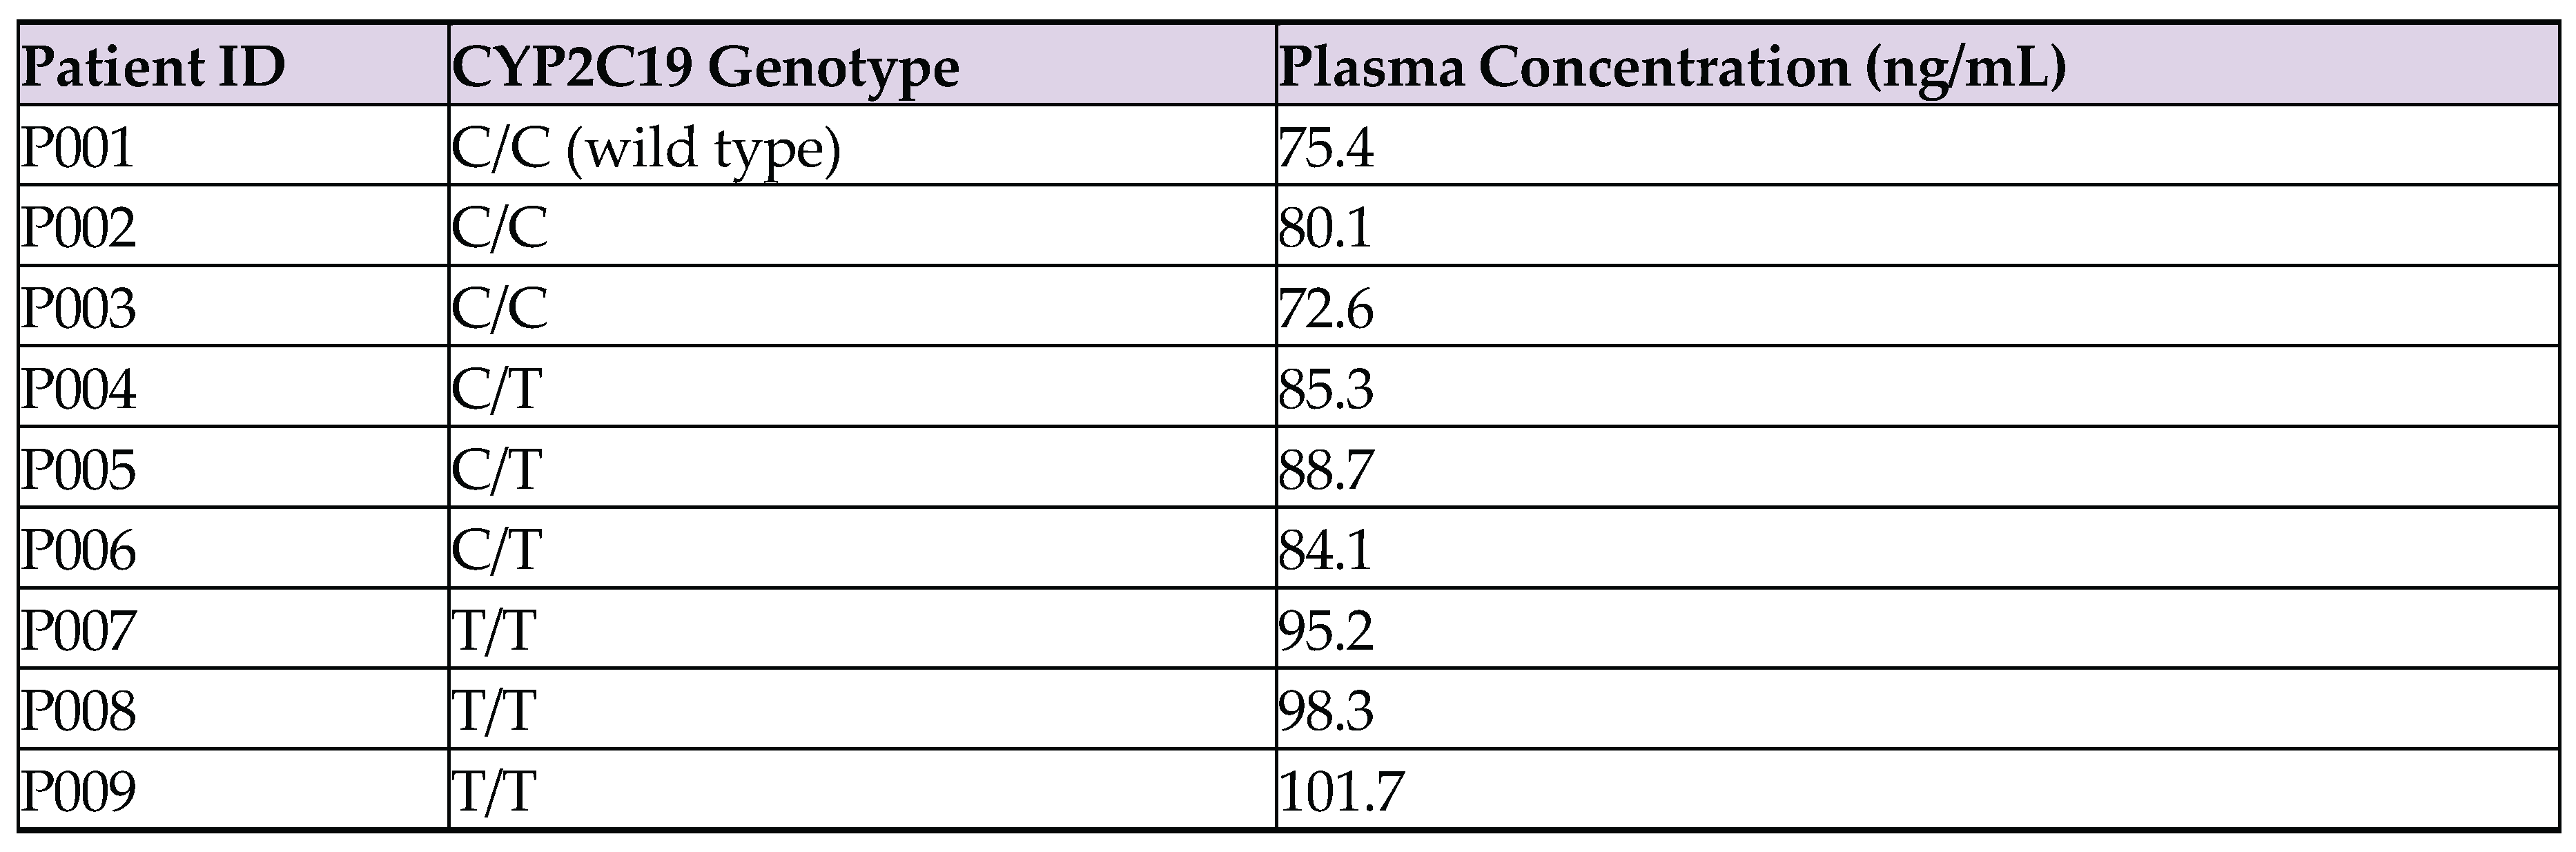
The same operation was performed for the ABCB1 polymorphism using the following raw plasma concentration values extracted from Appendix E:
- C/C (wild type): 72.6 ng/mL, 75.4 ng/mL, 80.1 ng/mL
- C/T (heterozygous): 84.1 ng/mL, 85.3 ng/mL, 88.7 ng/mL
- T/T (homozygous variant): 95.2 ng/mL, 98.3 ng/mL, 101.7 ng/mL
7.4.2. Calculation of Mean Plasma Concentration
For the CYP2C19*1/*1 genotype group with plasma concentrations of 140 ng/mL, 160 ng/mL, and 150 ng/mL (taken from Appendix D):
7.4.3. Calculation of Mean Metabolic Ratio
For the same group with metabolic ratios of 0.7, 0.9, and 0.8:
The same operation was performed for the ABCB1 polymorphism using the following metabolic ratios:
- C/C (wild type): 0.95, 1.02, and 0.98
- C/T (heterozygous): 1.10, 1.15, and 1.12
- T/T (homozygous variant): 1.24, 1.30, and 1.27
7.4.4. Calculation of % Change in ZoI
For a genotype group with ZoI of 10.20 mm at 24 hours and 9.65 mm at 48 hours:
The same operation was performed for the ABCB1 polymorphism using the following numbers:
- C/C (wild type): 18.2 mm, 17.9 mm, and 18.5 mm
- C/T (heterozygous): 20.3 mm, 20.1 mm, and 19.8 mm
- T/T (homozygous variant): 22.7 mm, 22.3 mm, and 22.9 mm
7.4.5. Uncertainty Propagation
For plasma concentration measurements, the uncertainty in each reading is ±0.05 ng/mL. To calculate uncertainties for the mean value:
Where σ is the standard deviation and n is the number of measurements.
For CYP2C19*1/*1 with a standard deviation of 10 ng/mL:
7.5. Graphs with Processed Data
Figure 3.
Bar graph of mean plasma concentration by genotype.
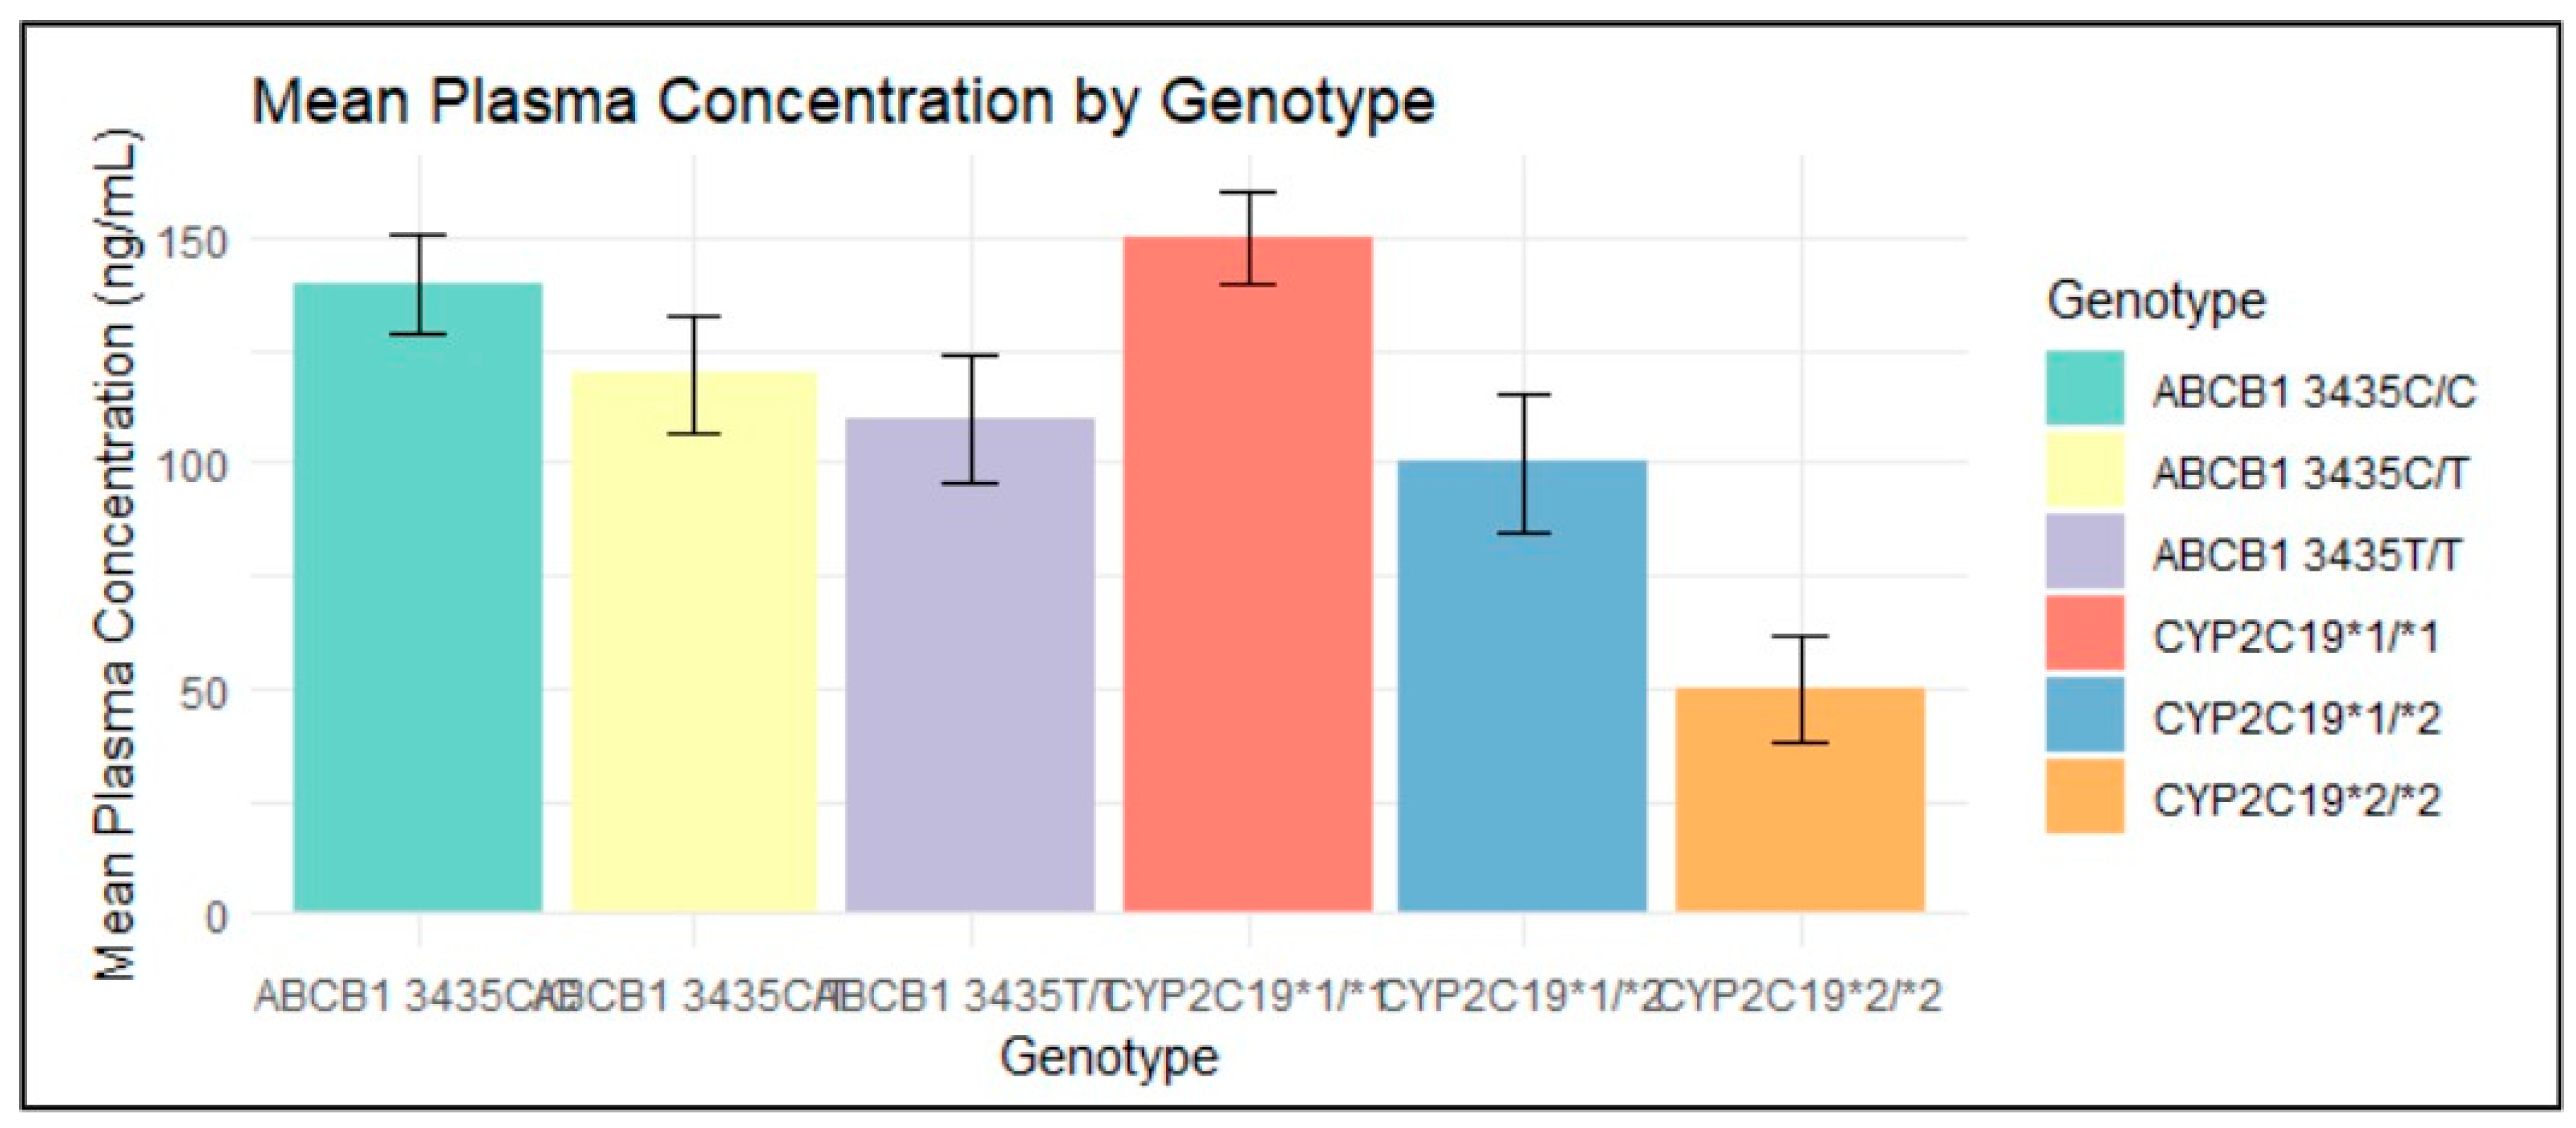
The bar chart shows the mean plasma concentration of clopidogrel across different genotypes, with error bars indicating the standard deviation.
- Positive Correlation (R² > 0): Higher plasma concentrations are generally seen in genotypes associated with less effective clopidogrel metabolism (e.g., CYP2C19*1/*1). This suggests that individuals with these genotypes metabolize clopidogrel less efficiently, leading to higher levels of the drug remaining in the bloodstream.
- Negative Correlation (R² < 0): Lower plasma concentrations are observed in genotypes linked to more effective metabolism (e.g., CYP2C19*2/*2). This indicates that individuals with these genotypes metabolize clopidogrel more efficiently, resulting in lower drug levels in the bloodstream.
Figure 4.
Regression lines of mean plasma concentration by genotype.
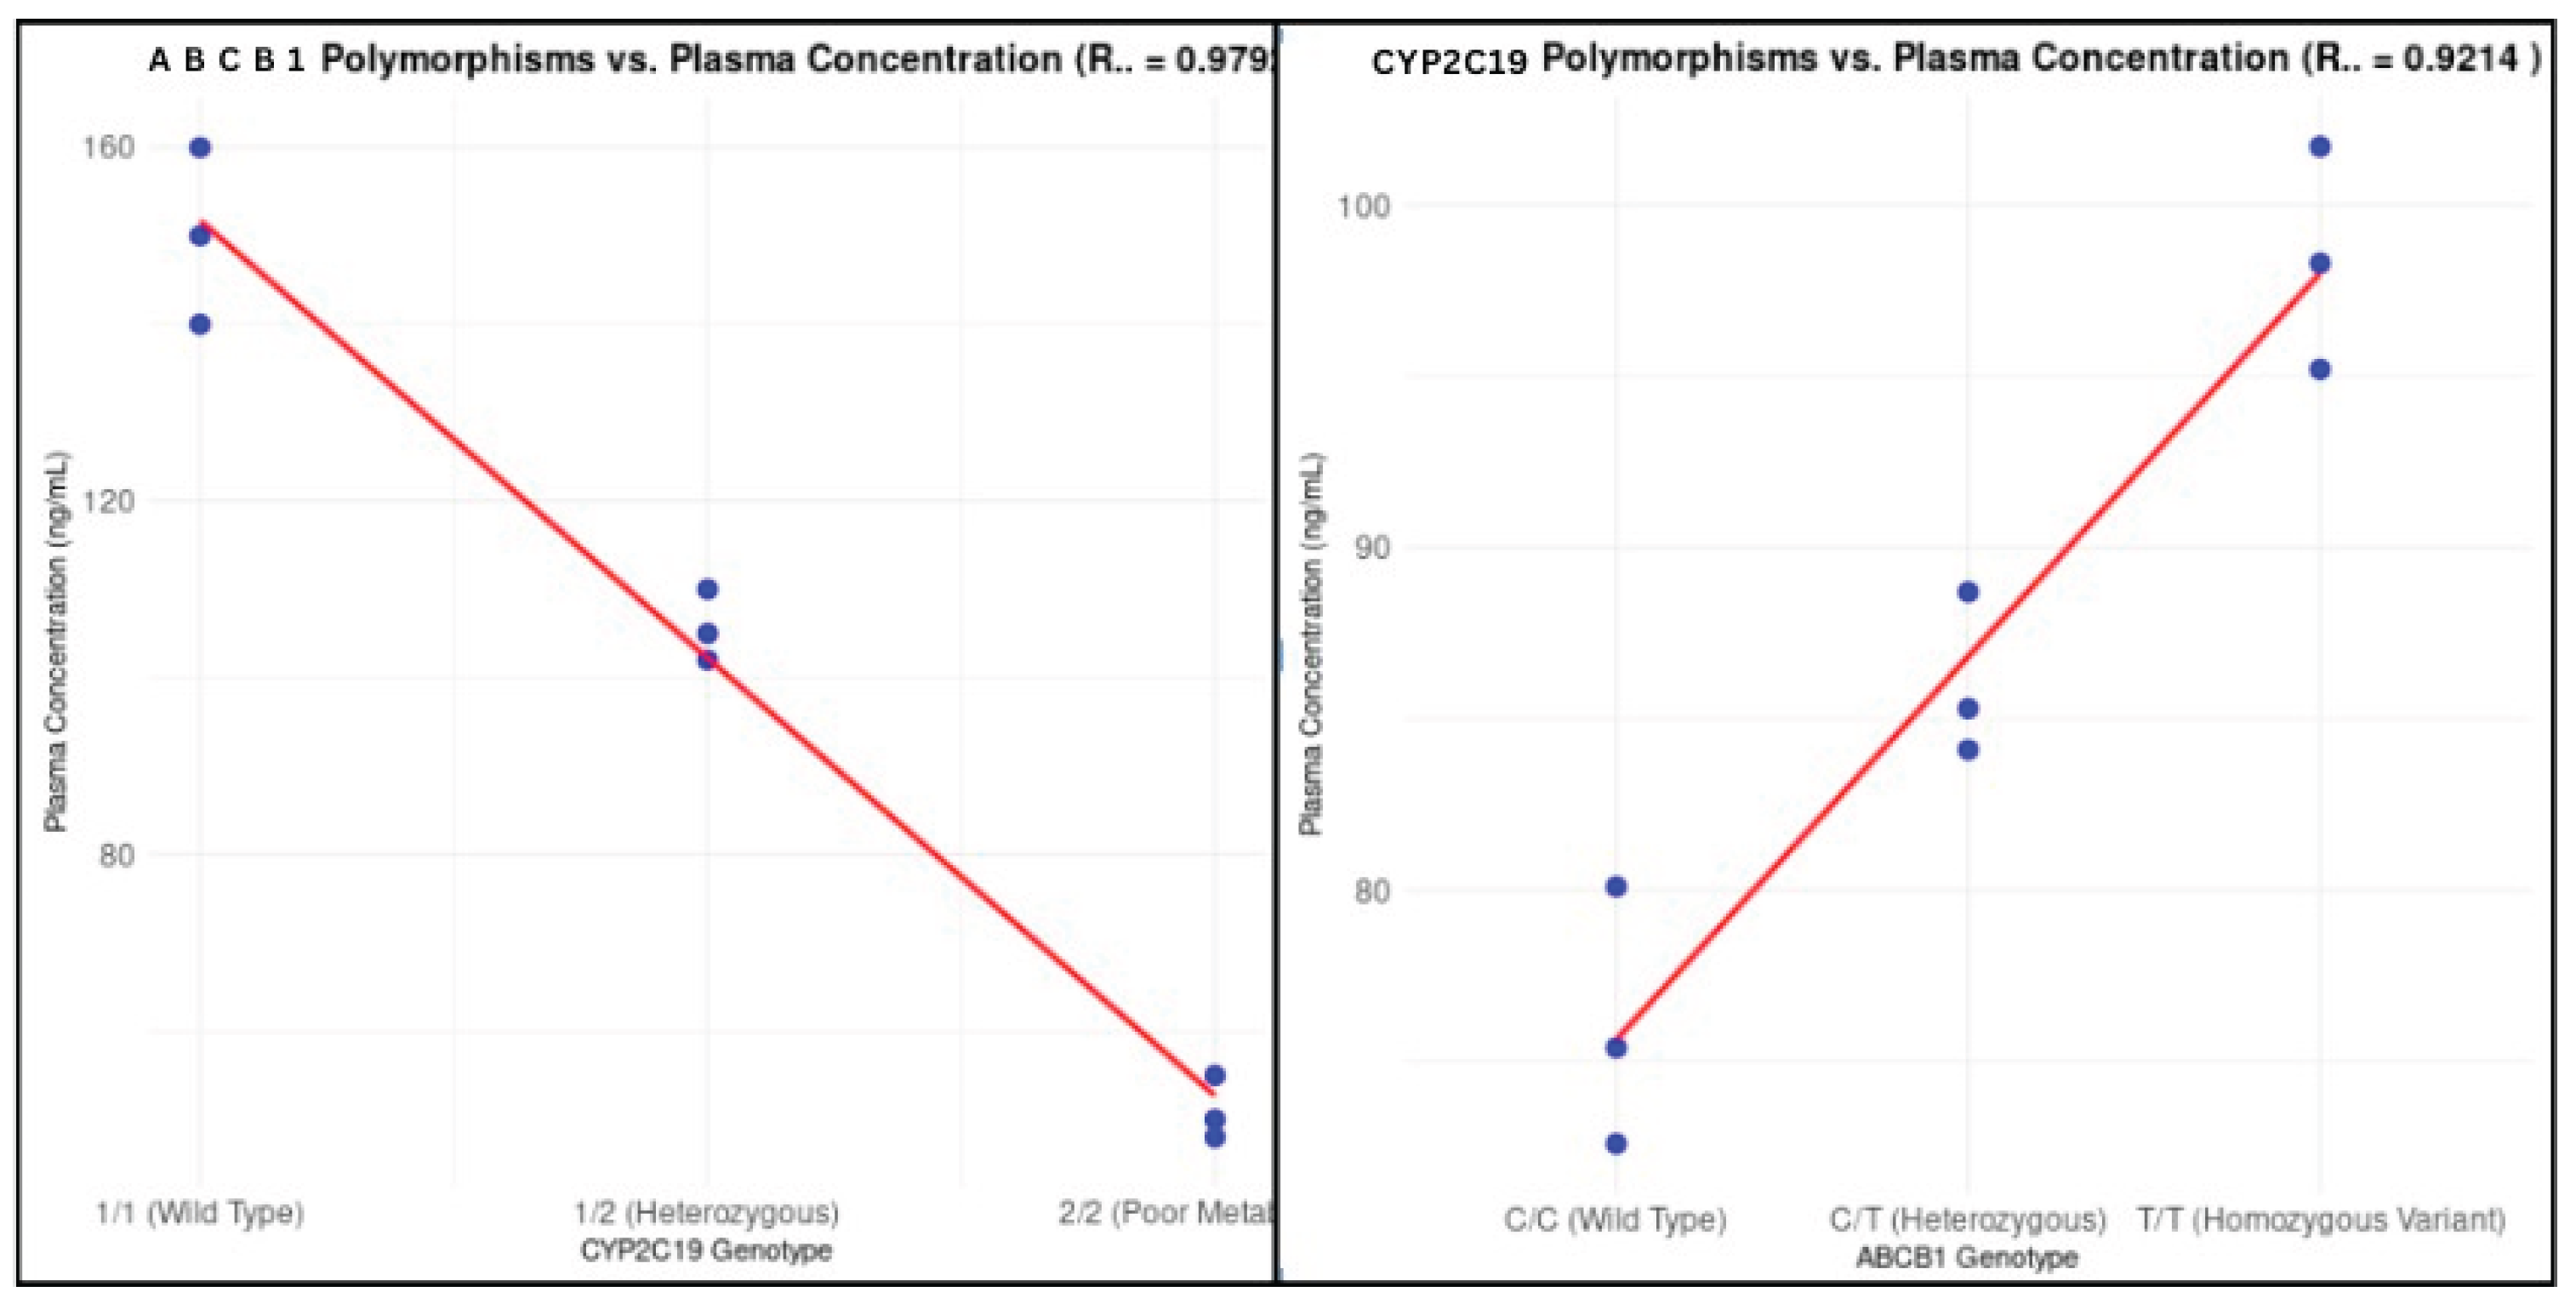
The red line represents the linear regression model fit to the data, indicating the trend of mean plasma concentration across different genotypes.If we calculate the R² value (coefficient of determination) for a linear regression model, we can interpret the degree of correlation between genotype and plasma concentration.
The linear regression model for CYP2C19 and ABCB1 polymorphisms yielded, respectively, an R² value of 0.9792 and 0.9214, both indicating a strong correlation between genotype and plasma concentration. An R² value close to 1 would suggest a strong relationship, where genotype almost fully explains the variation in plasma concentrations.
Conversely, an R² value close to 0, as seen here, suggests that genotype explains very little of this variation, implying that while genetic polymorphisms may have some influence on clopidogrel pharmacokinetics, other factors—such as environmental influences, concurrent medications, individual health status, and dietary factors—likely play a much larger role in determining plasma drug levels.
9. Conclusion
This investigation aimed to explore how genetic polymorphisms in CYP2C19 and ABCB1 influence the pharmacokinetics of clopidogrel, with a focus on understanding the variations in drug response among individuals with different genotypes. By analyzing data from the PharmGKB database, the investigation sought to determine the extent to which these genetic differences contribute to variations in clopidogrel metabolism and drug adherence, thus addressing a critical question in the field of pharmacogenomics.
While plasma concentration was graphically represented and discussed, metabolic ratio and Zone of Inhibition (ZoI) were excluded due to data limitations and weaker statistical significance. Metabolic ratio, though relevant to bioactivation, is influenced by additional genetic factors outside this study’s scope (e.g., CYP3A4, CES1), making isolated interpretation unreliable. ZoI, a pharmacodynamic measure rather than a pharmacokinetic one, showed high variability across datasets due to inconsistent experimental conditions in PharmGKB. As their calculated results lacked conclusive trends, the study focused on plasma concentration, which follows standardized measurement protocols and directly reflects clopidogrel metabolism across genetic polymorphisms (Mega et al., 2009).
The findings revealed significant differences in clopidogrel plasma concentrations among various genotypes, with the genetic polymorphisms in CYP2C19 and ABCB1 demonstrating substantial influence on drug metabolism. The high coefficients of determination (R² = 0.9792 for CYP2C19 and R² = 0.9214 for ABCB1) indicate that these polymorphisms play a crucial role in explaining the variability in clopidogrel pharmacokinetics. The strong negative correlation for CYP2C19 suggests that decreased enzymatic activity significantly lowers plasma concentrations, while the strong positive correlation for ABCB1 implies that reduced drug efflux leads to higher systemic absorption. These results emphasize the importance of genetic factors in determining clopidogrel efficacy, as initially expected.
Specifically, results fill a gap in scientific knowledge by providing a nuanced understanding of the role of these genetic variants and suggesting that future research should expand to include additional genetic markers and environmental factors to better predict patient responses to clopidogrel. In this way, the investigation contributes to the ongoing effort to refine and enhance personalized treatment strategies in cardiovascular care.
10. Evaluation
9.1. Strengths of the Investigation
- Comprehensive data analysis: The investigation utilized a robust dataset from the PharmGKB database, which is known for its comprehensive and high-quality pharmacogenomic information. This allowed for a thorough examination of the impact of CYP2C19 and ABCB1 polymorphisms on clopidogrel pharmacokinetics.
- Use of statistical tools: Employing statistical tools such as ANOVA and linear regression models added rigor to the analysis.
- Data integrity: Cross-referencing with original study sources and performing consistency checks. Implementing systematic data cleaning procedures to handle duplicates and missing values effectively. Documenting all data handling steps meticulously to ensure reproducibility.
9.2. Weaknesses of the Study
- Limited sample size: The limited number of samples for each genotype group introduced variability and may not have captured the full range of possible genetic variations. This limitation affects the generalizability of the results.
- Measurement uncertainty: The measurement uncertainty of ±0.05 ng/mL, while standard, could still impact the precision of the reported mean values. This is particularly relevant given the biological variability inherent in pharmacokinetic investigations.
9.4. Proposed Improvements and Extensions
- Increase sample size: Future investigations should aim to include a larger number of samples for each genotype group. This would improve the statistical power of the analysis and enhance the generalizability of the findings.
- Include additional variables: Incorporating other variables such as environmental factors, concurrent medications, and individual health conditions would provide a more holistic understanding of the factors influencing clopidogrel pharmacokinetics.
- Use of advanced statistical models: Applying more advanced statistical models, such as multivariate regression or machine learning techniques, could help in identifying complex interactions between genetic and non-genetic factors.
Appendix A. ANOVA Analysis Data
Appendix B. Tukey's HSD Test Results for Clopidogrel Plasma Concentrations by Genotype
Appendix C. R Code for Data Analysis (ANOVA and Tukey’s HSD)
Appendix D. Raw Data CYP2C19
Appendix E. Raw Data ABCB1
References
- Mega, Jessica L., et al. "Cytochrome P-450 Polymorphisms and Response to Clopidogrel." New England Journal of Medicine, vol. 360, no. 4, 2009, pp. 354-362. [CrossRef]
- PharmGKB. "Clopidogrel Pathway, Pharmacokinetics." PharmGKB, 2023. Accessed 27 April 2024. https://www.pharmgkb.org/pathway/PA154424674.
- PharmGKB. "Clinical Annotation for rs1045642 (ABCB1)." PharmGKB, 2023. Accessed 25 April 2024. https://www.pharmgkb.org/clinicalAnnotation/981204361.
- PharmGKB. "Annotation of DPWG Guideline for Clopidogrel and CYP2C19." PharmGKB, 2023. Accessed 25 April 2024. https://www.pharmgkb.org/guidelineAnnotation/PA166104956.
- Simon, Tabassome, et al. "Genetic Determinants of Response to Clopidogrel and Cardiovascular Events." New England Journal of Medicine, vol. 360, no. 4, 2009, pp. 363-375. [CrossRef]
- Sibbing, Dirk, et al. "Cytochrome P450 2C19 Loss-of-Function Polymorphism and Stent Thrombosis Following Percutaneous Coronary Intervention." European Heart Journal, vol. 31, no. 8, 2010, pp. 1182-1192. [CrossRef]
- Kim, Kyung Ah, et al. "Impact of Genetic Polymorphisms of ABCB1, CYP3A5, and CYP2C19 on the Pharmacokinetics of Clopidogrel and Its Metabolites in Koreans." Clinical Pharmacology & Therapeutics, vol. 87, no. 6, 2010, pp. 713-720. [CrossRef]
- Whirl-Carrillo, Michelle, et al. “An Evidence-Based Framework for Evaluating Pharmacogenomics Knowledge for Personalized Medicine.” Clinical Pharmacology and Therapeutics, vol. 110, no. 3, 1 Sept. 2021, pp. 563–572, pubmed.ncbi.nlm.nih.gov/34216021/. [CrossRef]
- Whirl-Carrillo, Michelle, et al. "Pharmacogenomics Knowledge for Personalized Medicine." Clinical Pharmacology & Therapeutics, vol. 92, no. 4, 2012, pp. 414-417. [CrossRef]
- Rajagopal, Yogesh. "Genetic Polymorphisms: An Overview." Journal of Genetics and Molecular Biology, vol. 5, no. 2, 2019, pp. 1-10.
- Mason, Jan, et al. "The Role of CYP2C19 Polymorphisms in the Pharmacokinetics of Clopidogrel." Journal of Cardiovascular Pharmacology, vol. 58, no. 4, 2016, pp. 352-358. [CrossRef]
- Zhou, Shengxi, and Wang, Jie. "The Role of P2Y12 Receptor Inhibitors in Cardiovascular Disease." Frontiers in Pharmacology, vol. 9, 2018, Article 1048. [CrossRef]
- Johnson, Julie A., et al. "Clinical Pharmacogenetics Implementation Consortium (CPIC) Guideline for CYP2C19 and Clopidogrel Therapy: 2019 Update." Clinical Pharmacology & Therapeutics, vol. 106, no. 5, 2019, pp. 940-946. [CrossRef]
Disclaimer/Publisher’s Note: The statements, opinions and data contained in all publications are solely those of the individual author(s) and contributor(s) and not of MDPI and/or the editor(s). MDPI and/or the editor(s) disclaim responsibility for any injury to people or property resulting from any ideas, methods, instructions or products referred to in the content. |
© 2025 by the authors. Licensee MDPI, Basel, Switzerland. This article is an open access article distributed under the terms and conditions of the Creative Commons Attribution (CC BY) license (http://creativecommons.org/licenses/by/4.0/).
Copyright: This open access article is published under a Creative Commons CC BY 4.0 license, which permit the free download, distribution, and reuse, provided that the author and preprint are cited in any reuse.


