
Submitted:
04 July 2025
Posted:
07 July 2025
You are already at the latest version
Abstract
Background: Substantial variation in antibiotic prescribing rates between general practices persists; however, it remains unexplained at a national level. Objectives: To investigate a possible association between antibiotic prescribing and area-level socioeconomic deprivation. Methods: Antibiotic prescribing data were obtained from NHS Business Service Authority for the year 2022-2023. These data were linked to data on practice list size, age, and sex obtained from NHS Digital, and Index of Multiple Deprivation (IMD) 2019 scores. A multivariable Poisson regression was conducted to control for potential confounders, including practice list size, proportion of older age patients (>55 years), and proportion of females. Results: Approximately 5.2 million dispensed prescription items were analyzed. Antibiotic prescribing rate was associated with IMD quintile, with the most deprived quintile receiving 20% more antibacterial prescriptions than the least deprived. [IRR 1.20; (95% CI 1.08-1.34)]. Proportion of older age patients was the strongest predictor of prescribing [IRR 1.63; (95% CI 1.52- 1.74)], followed by proportion of females [IRR 1.09; (95% CI 0.99-1.21)]. GP practice list size was inversely related to prescribing [IRR 0.89; (95% CI 0.83-0.95)]. Conclusions: Primary care practices in socioeconomically deprived areas are associated with increased antibiotic prescribing, and this is not entirely explained by area-level characteristics nor by practice population structure. Considerable variation in prescribing remains unexplained, supporting the need for continuous antimicrobial campaigns.
Keywords:
antibiotics
; prescribing
; socioeconomic deprivation
; primary health care
1. Introduction
Since their development in the 1940s, antibiotics have become the cornerstone of modern medical practice. They are used routinely in the treatment of, and the prophylaxis against, bacterial infection, enhancing health outcomes and quality of life for millions of patients. However, their injudicious use has led to the emergence of resistant strains of bacteria that are unresponsive to antibiotics in current use [1]. The number of new classes of antimicrobials has been in gradual decline since 1987, signaling the end of the ‘golden era’ of antibiotic production [2]. This has prompted the World Health Organization (WHO) in 2015 to recognize antimicrobial resistance (AMR) as a global health concern and develop an action plan for the implementation of antimicrobial stewardship (AMS) programmes among Member States to reduce the burden [3]. The terms antimicrobial, antibiotic, and anti-infective agent encircle an array of pharmaceuticals (i.e. antibacterials, antifungals, antivirals, and anti-parasitic drugs) [4]. The most commonly used antimicrobial agents are antibacterials [4], and thus, will be the focus of our study. The aim of this study was, therefore, to investigate a possible association between antibacterial prescribing and area-level socio-economic deprivation in general practice (GP) surgeries, within a primary care setting in England. The findings will be used to identify areas for further research as well as implications for clinical and prescribing practice.
According to the WHO, 5 million deaths were attributed to AMR in 2019 globally, and a cost of US$100 trillion from health care expenditure and loss of productivity is projected by 2050 [5]. Furthermore, the World Bank Group (WBG) estimates that, if left unchecked, AMR could wipe 3.8% of the gross domestic product (GDP) globally, and drive 28 million people into poverty, particularly in low-and middle-income countries [6]. In 2019, the United Kingdom (UK) government developed a twenty-year vision and a five-year national action plan (NAP) to tackle AMR with an ambitious goal of a 15% reduction in human antimicrobial use by 2024 (GOV.UK, 2019). In 2024, another five-year NAP was proposed for confronting AMR with emphasis on increasing collaboration across the UK, taking on a One Health approach, maintaining global cooperation, and reducing inequalities in AMR [7]. Despite these efforts, a recent UK Health Security Agency (UKHSA) report highlighted only a 1.6% reduction in the total number of AMR infections between 2018 and 2022 in England, compared to the UK NAP target of 10% [8].
In the UK, primary care settings accounted for 80.2% of all antibacterial prescriptions in 2022 with a reported overall decline of 1.7% between 2018 and 2022, despite the consumption [7] between 2021 and 2022 being greater than pre-pandemic levels [8]. There is thus an emphasis on the need for sustained attempts to control improper antibacterial prescribing and dispensing in primary care [8].
According to the English Surveillance Programme for Antimicrobial Utilization and Resistance (ESPAUR) report, England’s most deprived areas showed the highest burden of AMR infections at 33.0 per 100,000 population, compared to the least deprived at 23.4 per 100,000 population (UKHSA, 2023). Additionally, in a rapid systematic review investigating a correlation between sepsis and inequalities in health, Bladon et al. found that unemployment, low socioeconomic status, and poor educational attainment were associated with an increase in the incidence of community-acquired sepsis [9]. Nevertheless, these findings were inconsistent in the 50 studies included in the review; moreover, 31 studies were conducted in the US and only four were from the UK emphasizing the need for more studies in similar high-income settings. Similarly, two observational studies conducted in the UK [10,11] and one observational study conducted in New Zealand [12], showed that antibacterial prescribing in more deprived areas seemed to be higher than in the less deprived; however, this may be attributable to a higher prevalence of comorbidities in these areas [10,13].
A recent scoping review by Harvey and others identified three studies that examined the effect of patient-level factors on physicians’ prescribing decisions [14,15,16] and found that in a community setting, lower-income people used antibacterials more frequently than higher-income people did. Conversely, two other studies [17,18] showed that in a hospital setting high-income earners were more likely to use antibacterials than low-income earners [19]. Thomson et al. identified the low number of GPs serving a particular geographic location as a factor that may lead to increased rate of antibacterial prescribing in deprived areas which limits the access to health services by adding pressure on patient-allotted times, thereby increasing the likelihood of inappropriate prescribing [11]. Perhaps consequently, life expectancies in highly deprived areas in England were seven and nine years less than the less deprived areas in men and women respectively [20].
While earlier studies have explored the impact of patient-level factors and the prevalence of comorbidities on the rate of antibacterial prescribing, the effect of area-level factors and their influence on antibacterial prescribing were not addressed. The aim of this study was, therefore, to investigate a possible association between antibacterial prescribing and area-level socio-economic deprivation in general practice (GP) surgeries, within a primary care setting in England. The findings will be used to identify areas for further research as well as implications for clinical and prescribing practice.
2. Results
2.1. Study Dataset
In total, 19 oral antibacterials (13 drugs and 6 drug classes) were included in the analysis, with 5,127,930 prescribed items from 6,259 unique practices. A total of 2,641 practices (30%) were excluded before conducting the analysis as 1,333 (14%) practices had fewer than 50 items prescribed from April 2022 to March 2023, 1,219 (14%) additional practices had no Index of Multiple Deprivation (IMD) 2019 score, 78 additional practices had no list size data (1%), and 11 additional practices had fewer than 100 patients (0.1%). The final dataset consisted of 6,259 unique practices covering 99.7% of all registered patients in England between 1 April 2022 and 31 March 2023.
2.2. Variation in Antibacterial Prescribing
2.2.1. All Antibacterials
The average prescribing rates of all antibacterials by practice IMD 2019 score deciles 1 to 10 are displayed in Figure 1. Without adjusting for other factors, there is no clear relationship between deprivation and prescribing rates.
The results of the univariate and multivariate analyses for all antibacterials are summarized in Table 1. Only the multivariate regression results will be discussed and the results presented are for quintile 5 versus quintile 1. There was a significant and independent positive association between the proportion of older population and the prescribing rate [IRR 1.63; (95% CI 1.52-1.74)], followed by IMD 2019 scores [IRR 1.20; (95% CI 1.08-1.34)]. No statistically significant association was observed between the prescribing rate and proportion of females in GP practice. GP practice list size was shown to be negatively associated with the prescribing rate [IRR 0.89; (95% CI 0.83-0.95)].
2.2.2. Individual Antibacterial Drugs and Subclasses
Table 2 shows the antibacterial drugs and drug classes in order from those most strongly associated with socioeconomic deprivation, after adjustment. Penicillins (54.1% of total) were by far the most prescribed antibacterial subclass, followed by tetracyclines (15.9%), UTI drugs (12.7%), macrolides (10.4%), and sulfonamides (5.3%). Where significant associations exist, most of these demonstrate higher rates of antibacterial prescribing in the most deprived practices, with only one drug (clindamycin) showing lower prescribing rates in the most deprived practices [IRR 0.21; (95% CI 0.09-0.51)].
3. Discussion
Similar to previous work, we found significant associations between total antibacterial prescribing rate and practice characteristics, particularly with higher practice list size [21], deprivation [10,11,17,19,21,22], higher proportion of older population [10,17,19,21], and higher proportion of females [10,23]. Importantly, we considered all three of these variables simultaneously, and can conclude they are independently associated with prescribing. Whereas past researchers have reported the characteristics of prescribing practices and their population to be strong predictors of high antibacterial prescribing [24], the present study has shown the proportion of older populations to be the greatest predictor of high prescribing. In a cross-sectional study that examined the degree of variation in antibiotic prescribing between GP practices in England, Wang and others have reported practice location in the north of England to be the strongest predictor of a high prescribing practice [24]. Other predictors of high prescribing include, a practice population with a higher prevalence of chronic diseases, a greater proportion of patients of a white ethnicity, shorter appointments, and practices with higher proportions of GPs who were trained overseas, >45 years of age, and males [24]. In addition, in a systematic review and meta-analysis that investigated gender differences in antibacterial prescribing in primary care, Schröder and colleagues found that the amount of antibacterials prescribed to women was 40% higher than that prescribed for men, in the 35 to 54 years age group [23]. The antibacterial classes that had the greatest gender differences were cephalosporin (44%) and macrolides (32%), which are commonly used for the treatment of respiratory tract infections (RTIs) [23]. Contrary to common belief, antibacterials that were commonly prescribed for UTIs were almost equally distributed between males and females [23]. Reasons for these variations may include that women had twice as many medical visits as men, inappropriate prescribing was more frequently associated with the female gender, and RTIs had a higher prevalence in females than males [23]. The variation in susceptibility to infectious diseases may be partially explained by genetics [25].
One interpretation to these findings is that antibacterial consumption is found to be significantly associated with population income, demographic structure, density of general practitioners and their remuneration method [17]. Another explanation is that 69% of all antibiotic prescribing in English primary care could be linked to a body system or condition and, of these prescriptions, 46% were linked to conditions of the respiratory tract including ear, nose and throat (ENT) [26]. Leading conditions within this group were cough symptoms (22.7%), lower RTIs (17.9%), sore throat (16.7%), and upper RTIs (14.5%) [26]. UTIs accounted for 22.7% of all prescriptions, whereas skin infections and wounds accounted for 16.4% [26].
Additionally, Smieszek and colleagues analyzed data from 2013-2015 recorded in the Health Improvement Network (THIN) database, while attempting to identify and quantify inappropriate systemic antibiotic prescribing in primary care in England [27]. Their results showed that 8.8% to 23.1% of all systemic antibiotic prescriptions were inappropriate [27]. 19 Prescriptions for sore throat accounted for 23% of inappropriate prescribing, followed by cough (22.2%), sinusitis (7.6%), and acute otitis media (5.7%) [27].
National campaigns for the reduction of inappropriate antibacterial prescribing, have been employed by many countries. Despite the limitations, our results suggest that area-level interventions, as well as national strategies, may be needed to address practice-specific health demands. Moreover, it may be useful to target practices in the most deprived areas in England, those with a higher proportion of older populations, and a higher proportion of females. If, as the present study suggests, antibacterial prescribing only varies by 20% between practices in the highest and the lowest deprivation deciles, then there is a need for research that explores antibacterial prescribing patterns in various GP practices, for future reductions of inappropriate prescribing. Judicious antibacterial prescribing can be supported by persistent practice-level policies, in primary care practices.
Although previous studies support that variations in comorbidities are insufficient in providing an explanation for most of the variations in antibacterial prescribing, their significance lies in raising a myriad of intriguing questions, for future study of practice-level factors. Hence, a more comprehensive understanding of the extent of factors, such as population characteristics and demographic structure, on antibacterial prescribing, underpins the need for more work to be done.
Further work, investigating patient-level drivers for prescribing, while controlling for underlying medical and demographic factors, may only be pertinent to healthcare settings in England. Where these exist, probing into the causes of prescribing inequalities is needed, to recognize where the amelioration of AMS interventions is essential for enhancing patient outcomes.
4. Materials and Methods
Data Sources
The English prescribing dataset (EPD) provides detailed records on prescriptions issued in England that have been dispensed across the UK. The dataset is publicly available from NHS Business Services Authority [website: https://www.nhsbsa.nhs.uk//] and serves as a comprehensive, consistent, and accessible source of prescribing information. Monthly primary care prescribing and dispensing data were obtained from the EPD [28]. The data were downloaded for English GP practices for the most recent financial year (April 2022 to March 2023 inclusive). The data include practice codes, names, and addresses and the British National Formulary (BNF) codes for antibacterial drugs [29]. Information on GP practice list size by sex and age, published quarterly, were retrieved from NHS digital [30]. The dataset is publicly available [website: https://digital.nhs.uk/data-andinformation/publications/statistical/patients-registered-at-a-gp-practice] Please note that the publication of your manuscript implicates that you must make all materials, data, computer code, and protocols associated with the publication available to readers. Please disclose at the submission stage any restrictions on the availability of materials or information. New methods and protocols should be described in detail while well-established methods can be briefly described and appropriately cited.
Practice-level socioeconomic deprivation was measured using Index of Multiple Deprivation (IMD) 2019 scores, in alignment with the NHS Core50PLUS5 approach [13]. IMD scores from the Office for Health Improvement and Disparities (OHID) Fingertips webpage [31] [website: https://fingertips.phe.org.uk/], were converted into quintiles, where quintile one represents the least deprived GP practices and quintile five the most deprived. The IMD 2019 integrates data from seven domains yielding a relative measure of deprivation, including income, employment, education and housing [32]. GP Practice IMD scores are a weighted average of the IMD scores of its constituent patients, based on their postcode of residence.
Data Processing
Every drug has a 15-character BNF code, that specifies drug class, dose, and route of administration. The first nine digits are unique for the drug, irrespective of dose or route of administration, whereas the first seven digits of the code, also known as a paragraph, define a drug class. Only antibacterial drugs and drug classes from chapter 5 from the BNF were analyzed, which includes all antimicrobial drugs. Monthly prescribing datasets were filtered to include only oral antibacterials (see Appendix 1 for a list of all included antibacterials and their BNF codes). Practice-level prescribing data for each month were aggregated across the year to create a single annual prescribing dataset. Each primary care practice has a unique identification number which was used to link the prescribing data to practice list size, proportion of females in the practice (calculated as the number of females divided by the total list size), proportion of over-55s (calculated as the number of patients aged 55 years and over divided by the total list size) and the IMD 2019 scores. The prescribing rate for each GP practice was calculated by dividing the number of antibacterials prescribed over the number of patients in that practice and multiplied by 1000. Practices that had fewer than 100 patients or that had prescribed fewer than 50 items per year, were excluded as they are likely to be out-of-hours (OOHs) or walk-in practices.
Research manuscripts reporting large datasets that are deposited in a publicly available database should specify where the data have been deposited and provide the relevant accession numbers. If the accession numbers have not yet been obtained at the time of submission, please state that they will be provided during review. They must be provided prior to publication.
Data Analysis
Multivariate Poisson regression was used to look for the association between prescribing rate, as the outcome, and GP practice IMD 2019 scores as the independent variable of interest, adjusting for practice list size, the proportion of females, and the proportion of over-55s in each practice. We considered adjusting for the prevalence of heart failure, chronic obstructive pulmonary disease (COPD and diabetes as additional covariates, as they are frequently associated with septicemia and a higher rate of antibacterial prescribing [9,33]; however, as these may increase antibacterial prescribing through mediating effects, adjusting for these conditions may inappropriately dilute the effect that deprivation has on the rate of antibacterial prescribing [34].
Poisson regression analyses are presented as incidence rate ratios (IRR), comparing the relative rate of prescribing in each IMD 2019 score quintile with practices in quintile one (the least deprived quintile). All effect measures were given with 95% confidence intervals (CI) to 11 determine their statistical significance. For all other variables, quintile 1 was used as the reference group (smallest list size, lowest proportion of females, and the lowest proportion of older people).
All data processing, analyses, and plots were generated using the software R (V.4.3.2) [35]. The R code written to perform the analyses and generate the plots, is available here on GitHub.
5. Conclusions
The present research, therefore, contributes to a growing body of evidence suggesting that antibacterial prescribing is influenced by area-level deprivation. However, our findings provide evidence that practice-level characteristics, such as the demographic structure, could offer a better explanation for the increased prescribing rate. In terms of future research, it would be useful to further examine patient-level factors and regional variations in antibacterial use, to avoid inequalities in implementing interventions.
Author Contributions
Conceptualization, S.D. and S.S.; methodology, S.S.; software, S.D.; validation, S.D., S.S. and I.G.; formal analysis, S.D.; investigation, S.D.; resources, S.D.; data curation, S.S.; writing—original draft preparation, S.D.; writing—review and editing, S.S., I.G; visualization, S.S.; supervision, S.S.; project administration, S.D. All authors have read and agreed to the published version of the manuscript.
Funding
This research received no external funding
Institutional Review Board Statement
Ethical review and approval were waived for this study as our analysis used data that has been previously anonymized and published, with no patient identifiable information.
Acknowledgments
The authors would like to thank the University of Warwick Information Technology (IT) services for providing access to RStudio and EndNote software. And to the University of Warwick Library open access to Medline and Embase databases, and computers. Additionally, this study was made possible by the availability of Open-source data through the NHS BSA, NHS Digital, and OHID Fingertips webpages.
Conflicts of Interest
The authors declare no conflicts of interest.
Abbreviations
The following abbreviations are used in this manuscript:
| NHS | National Health services |
| AMR | Antimicrobial Resistance |
| WHO | World Health Organization |
| AMS | Antimicrobial Stewardship |
| GP | General Practice |
| WBG | World Bank Group |
| GDP | Gross Domestic Product |
| UK | United Kingdom |
| NAP | National Action Plan |
| UKHSA | United Kingdom Health Security Agency |
| ESPAUR | English Surveillance Programme for Antimicrobial Utilization and Resistance |
| IMD | Index of Multiple Deprivation |
| IRR | Incidence Rate Ratio |
| UTI | Urinary Tract Infection |
| RTI | Respiratory Tract Infection |
| THIN | The Health Improvement Network |
| EPD | English Prescribing Dataset |
| NHS BSA | National Health Services Business Services Authority |
| BNF | British National Formulary |
| OHID | Office for Health Improvement and Disparities |
| OOH | Out-of-hour |
| COPD | Chronic Obstructive Pulmonary Disease |
| CI | Confidence Interval |
References
- Butler CC, Hillier S, Roberts Z, Dunstan F, Howard A, Palmer S. Antibiotic-resistant infections in primary care are symptomatic for longer and increase workload: outcomes for patients with E. coli UTIs. British Journal of General Practice 2006; 56(530): 686-92.
- WHO. WHO releases report on state of development of antibacterials. 2024. https://www.who.int/news/item/14-06-2024-who-releases-report-on-state-of-development-ofantibacterials (accessed 30/06/2024.
- WHO. Global Action Plan on Antimicrobial Resistance. 2015. https://iris.who.int/bitstream/handle/10665/193736/9789241509763_eng.pdf?sequence=1 (accessed 11/02/2024.
- Leekha S, Terrell CL, Edson RS. General principles of antimicrobial therapy. Mayo Clinic proceedings 2011; 86(2): 156-67. [CrossRef]
- WHO. WHO outlines 40 research priorities on antimicrobial resistance. 2023. https://www.who.int/news/item/22-06-2023-who-outlines-40-research-priorities-onantimicrobial-resistance (accessed 30/06/2024.
- WBG. Antimicrobial Resistance (AMR). 2024. Antimicrobial Resistance (AMR) (worldbank.org) (accessed 30/06/2024.
- GOV.UK. UK 5-year action plan for antimicrobial resistance 2024 to 2029. 2024.
- UKHSA. English surveillance programme for antimicrobial utilisation and resistance (ESPAUR) Report 2022 to 2023. 2023.
- Bladon S, Ashiru-Oredope D, Cunningham N, et al. Rapid systematic review on risks and outcomes of sepsis: the influence of risk factors associated with health inequalities. International Journal for Equity in Health 2024; 23(1): 34.
- Covvey JR, Johnson BF, Elliott V, Malcolm W, Mullen AB. An association between socioeconomic deprivation and primary care antibiotic prescribing in Scotland. Journal of Antimicrobial Chemotherapy 2013; 69(3): 835-41. [CrossRef]
- Thomson K, Berry R, Robinson T, Brown H, Bambra C, Todd A. An examination of trends in antibiotic prescribing in primary care and the association with area-level deprivation in England. BMC Public Health 2020; 20: 1-9.
- Whyler N, Tomlin A, Tilyard M, Thomas M. Ethnic disparities in community antibacterial dispensing in New Zealand, 2015. 2018.
- NHS. Core20PLUS5 – An approach to reducing health inequalities for children and young people. 2022. https://www.england.nhs.uk/about/equality/equality-hub/nationalhealthcare-inequalities-improvement-programme/core20plus5/core20plus5-cyp/ (accessed 27/05/2024.
- Chaplin, S. Health survey for England 2013: the use of prescribed medicines. Prescriber 2015; 26(4): 16-9.
- Li S, Laxminarayan R. Are Physicians’ Prescribing Decisions Sensitive to Drug Prices? Evidence from a Free-antibiotics Program. Health economics 2015; 24(2): 158-74.
- Volpi C, Shehadeh F, Mylonakis E. Correlation of antimicrobial prescription rate and county income in medicare part D. Medicine 2019; 98(22): e15914.
- Masiero G, Filippini M, Ferech M, Goossens H. Socioeconomic determinants of outpatient antibiotic use in Europe. International journal of public health 2010; 55: 469-78.
- Wemrell M, Lenander C, Hansson K, Perez RV, Hedin K, Merlo J. Socio-economic disparities in the dispensation of antibiotics in Sweden 2016–2017: An intersectional analysis of individual heterogeneity and discriminatory accuracy. Scandinavian Journal of Public Health 2022; 50(3): 347-54. [CrossRef]
- . Harvey EJ, De Brún C, Casale E, Finistrella V, Ashiru-Oredope D. Influence of factors commonly known to be associated with health inequalities on antibiotic use in high-income countries: a systematic scoping review. Journal of Antimicrobial Chemotherapy 2023; 78(4): 861-70.
- Bambra, C. Health divides: where you live can kill you: Policy Press; 2016.
- Curtis HJ, Walker AJ, Mahtani KR, Goldacre B. Time trends and geographical variation in prescribing of antibiotics in England 1998–2017. Journal of Antimicrobial Chemotherapy 2019; 74(1): 242-50.
- Adekanmbi V, Jones H, Farewell D, Francis NA. Antibiotic use and deprivation: an analysis of Welsh primary care antibiotic prescribing data by socioeconomic status. Journal of Antimicrobial Chemotherapy 2020; 75(8): 2363-71.
- Schröder W, Sommer H, Gladstone BP, et al. Gender differences in antibiotic prescribing in the community: a systematic review and meta-analysis. Journal of Antimicrobial Chemotherapy 2016; 71(7): 1800-6.
- Wang KY, Seed P, Schofield P, Ibrahim S, Ashworth M. Which practices are high antibiotic prescribers? A cross-sectional analysis. British Journal of General Practice 2009; 59(567): e315-e20.
- Van Lunzen J, Altfeld M. Sex differences in infectious diseases–common but neglected. The Journal of infectious diseases 2014; 209(suppl_3): S79-S80.
- Dolk FCK, Pouwels KB, Smith DR, Robotham JV, Smieszek T. Antibiotics in primary care in England: which antibiotics are prescribed and for which conditions? Journal of Antimicrobial Chemotherapy 2018; 73(suppl_2): ii2-ii10.
- Smieszek T, Pouwels KB, Dolk FCK, et al. Potential for reducing inappropriate antibiotic prescribing in English primary care. Journal of Antimicrobial Chemotherapy 2018; 73(suppl_2): ii36-ii43.
- NHSBSA. English Prescribing Dataset (EPD). 2024. https://opendata.nhsbsa.net/dataset/english-prescribing-data-epd (accessed 29/05/2024.
- BNF. 5: Infections. 2024. BNF 5: Infections OpenPrescribing (accessed 29/05/2024.
- NHSDIGITAL. Patients Registered at a GP Practice. 2024. Patients Registered at a GP Practice, May 2024 - NHS England Digital (accessed 29/05/2024.
- OHID, F. Public health profiles. 2024. https://fingertips.phe.org.uk/ (accessed 29/05/2024.
- GOV.UK. English indices of deprivation 2019. 2019. English indices of deprivation 2019 - GOV.UK (www.gov.uk) (accessed 29/05/2024.
- Rockenschaub P, Hayward A, Shallcross L. Antibiotic prescribing before and after the diagnosis of comorbidity: a cohort study using primary care electronic health records. Clinical Infectious Diseases 2020; 71(7): e50-e7. [CrossRef]
- Singer M, Bulled N, Ostrach B, Mendenhall E. Syndemics and the biosocial conception of health. The lancet 2017; 389(10072): 941-50.
- RCoreTeam. The R Project for Statistical Computing. 2023. https://www.r-project.org/ (accessed 11/02/2024.
Figure 1.
Average prescribing rates of all antibacterials, by practice IMD 2019 scores deciles.
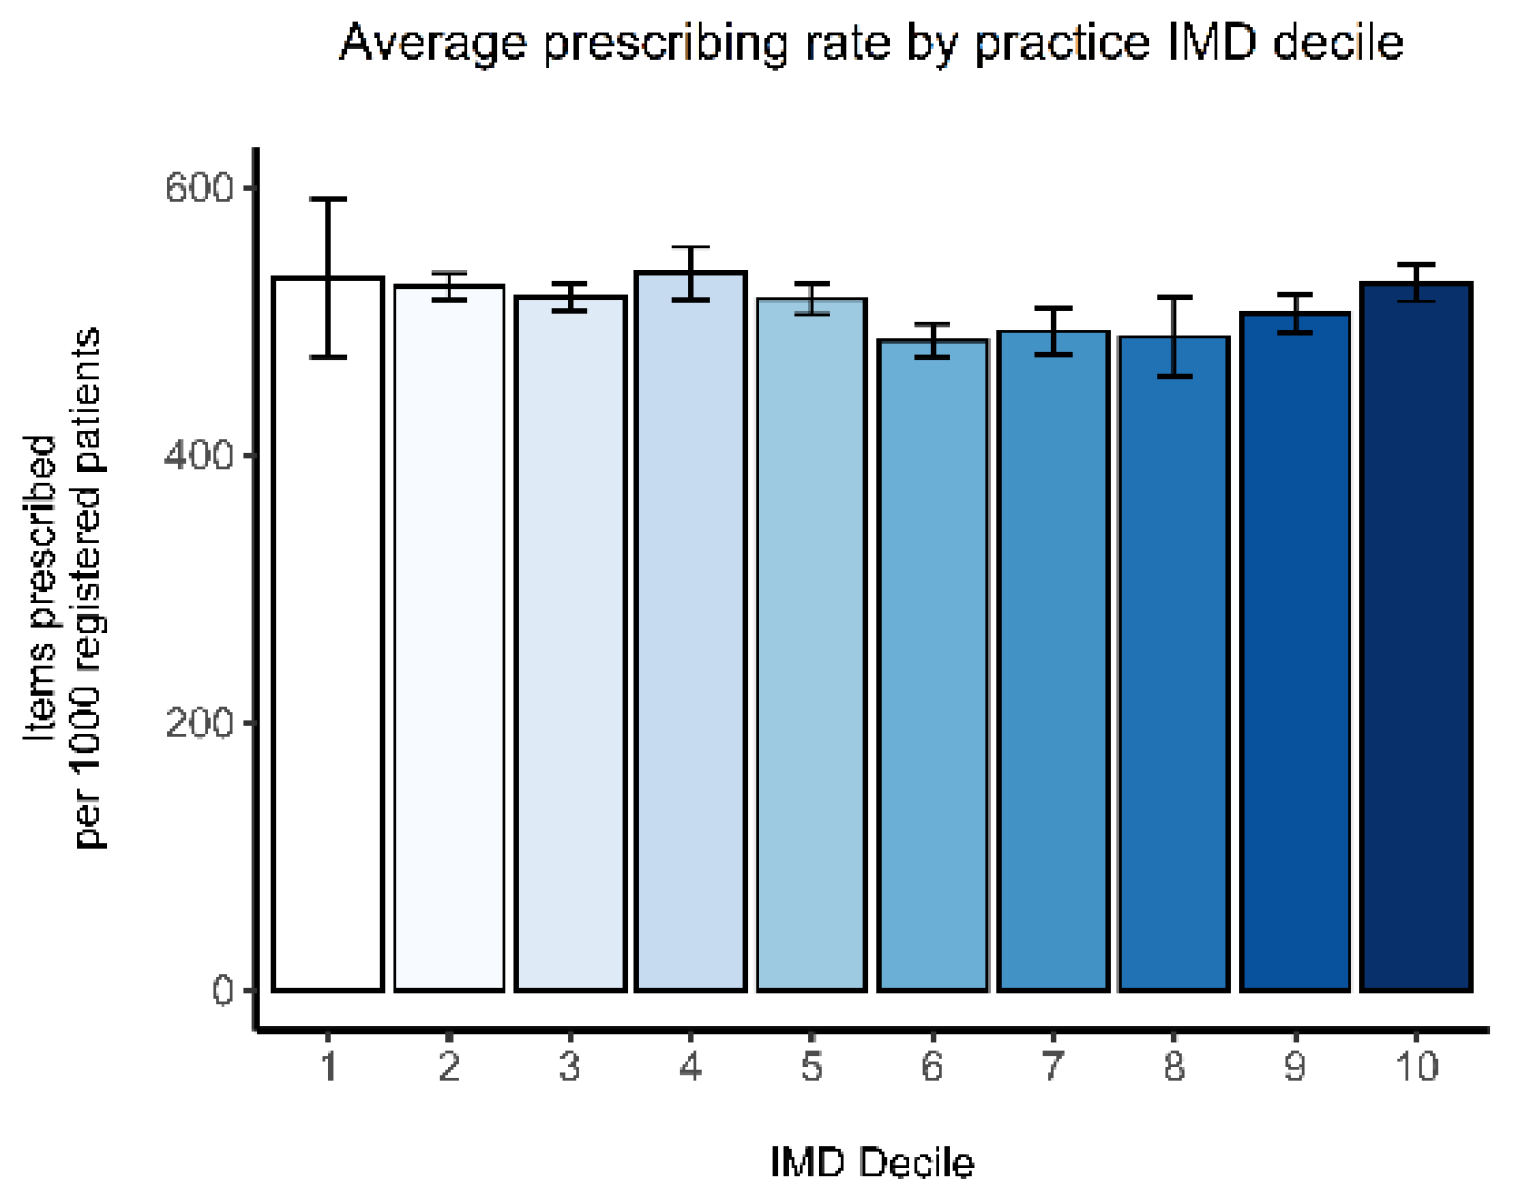

Table 1.
Association between prescribing rate and predictor variables for all antibacterials, from quintile 1 to 5.
Table 1.
Association between prescribing rate and predictor variables for all antibacterials, from quintile 1 to 5.
| Variable | Quintile | Unadjusted IRR 95% CI |
Adjusted IRR 95% CI |
|---|---|---|---|
| IMD 2019 | 1 2 3 4 5 |
Reference 1.0 (0.94-1.06) 0.95 (0.89-1.00) 0.93 (0.87-0.99) 0.98 (0.92-1.04) |
Reference 1.01 (0.95-1.08) 1.03 (0.96-1.11) 1.08 (0.99-1.19) 1.20 (1.08-1.34) |
| List size | 1 2 3 4 5 |
Reference 0.95 (0.89-1.01) 0.95 (0.89-1.02) 0.94 (0.89-1.00) 0.87 (0.81-0.93) |
Reference 0.95 (0.89-1.01) 0.94 (0.88-1.00) 0.03 (0.87-0.99) 0.89 (0.83-0.95) |
| Proportion of older population | 1 2 3 4 5 |
Reference 1.26 (1.16-1.36) 1.38 (1.32-1.46) 1.49 (1.42-1.57) 1.58 (1.50-1.66) |
Reference 1.25 (1.14-1.38) 1.39 (1.31-1.48) 1.53 (1.44-1.63) 1.63 (1.52-1.74) |
| Proportion of females | 1 2 3 4 5 |
Reference 1.15 (1.07-1.24) 1.23 (1.14-1.32) 1.25 (1.16-1.35) 1.27 (1.17-1.37) |
Reference 1.05 (0.97-1.14) 1.08 (0.99-1.17) 1.08 (0.99-1.18) 1.09 (0.99-1.21) |
Table 2.
List of all individual antibacterials analyzed, ranked from the highest to the lowest adjusted IRR.
Table 2.
List of all individual antibacterials analyzed, ranked from the highest to the lowest adjusted IRR.
| Drug | Items prescribed | Unadjusted IRR 95% CI |
Adjusted IRR 95% CI |
|---|---|---|---|
| Tetracyclines | 814,150 | 1.00 (0.94-1.06) | 1.46 (1.32-1.61) |
| Metronidazole | 85,110 | 1.34 (1.29-1.38) | 1.31 (1.25-1.37) |
| Macrolides | 535,340 | 1.01 (0.94-1.08) | 1.21 (1.08-1.35) |
| Phenoxymethylpenicillin | 438,790 | 1.08 (1.02-1.14) | 1.20 (1.10-1.32) |
| Flucloxacillin | 542,140 | 0.97 (0.91-1.04) | 1.20 (1.06-1.36) |
| Cephalosporins | 162,310 | 1.00 (0.93-1.08) | 1.19 (1.06-1.35) |
| Cefaclor | 162,310 | 1.00 (0.93-1.08) | 1.19 (1.06-1.35) |
| Penicillin | 2,534,790 | 1.06 (1.00-1.20) | 1.17 (1.06-1.30) |
| Amoxicillin | 1,514,830 | 1.11 (1.05-1.18) | 1.17 (1.05-1.29) |
| Sulfonamides | 273,120 | 0.83 (0.74-0.93) | 1.11 (0.88-1.40) |
| Some Other AB | 89,860 | 1.22 (0.97-1.53) | 1.09 (0.74-1.62) |
| Anti-Leprotic | 67,900 | 0.74 (0.43-1.27) | 1.06 (0.79-1.43) |
| Urinary Tract Infections | 650,350 | 0.78 (0.74-0.82) | 1.05 (0.96-1.16) |
| Pivmecillinam | 115,720 | 0.83 (0.76-0.91) | 1.00 (0.92-1.09) |
| Anti-Tuberculosis | 75,950 | 0.69 (0.39-1.23) | 0.96 (0.68-1.36) |
| Quinolones | 89,430 | 0.82 (0.74-0.91) | 0.88 (0.75-1.05) |
| Clindamycin | 75,030 | 0.48 (0.12-1.86) | 0.21 (0.09-0.51) |
Disclaimer/Publisher’s Note: The statements, opinions and data contained in all publications are solely those of the individual author(s) and contributor(s) and not of MDPI and/or the editor(s). MDPI and/or the editor(s) disclaim responsibility for any injury to people or property resulting from any ideas, methods, instructions or products referred to in the content. |
© 2025 by the authors. Licensee MDPI, Basel, Switzerland. This article is an open access article distributed under the terms and conditions of the Creative Commons Attribution (CC BY) license (http://creativecommons.org/licenses/by/4.0/).
Copyright: This open access article is published under a Creative Commons CC BY 4.0 license, which permit the free download, distribution, and reuse, provided that the author and preprint are cited in any reuse.


