
Submitted:
04 July 2025
Posted:
04 July 2025
You are already at the latest version
Abstract
With the increasing network security threats, Internet-wide scanning has become a key technique for identifying network vulnerabilities.However, traditional scanning methods tend to ignore the impact of geographic factors on scanning efficiency.In this study, we experimentally found that the geographic location of the scanner has a significant impact on scanning efficiency.Based on this finding, we propose a large-scale network scanning method based on geographic location awareness.The method divides scanners into multiple scanning clusters based on their geographic locations and designs a similarity matrix based on the average scanning time to quantify the scanning efficiency between two geographic locations.To avoid wasting scanning resources, we implement a load balancing mechanism between scanning clusters and between nodes within each cluster.Experimental validation in a real network environment shows that the proposed method can effectively improve the scanning efficiency while ensuring the coverage.
Keywords:
Internet-wide port scan
; location-aware
; task scheduling
; network security
0. Introduction
With the rapid development of the Internet, the number of active devices worldwide has exceeded billions, including servers, routers, personal computers, smartphones, and IoT devices. As a result, network security issues have also increased, such as hacker attacks, malware attacks, and data breaches, causing significant losses to businesses and individuals. In order to address these threats, internet-wide scanning technology came into being. This technology detects active hosts by sending network requests, helping researchers, security teams, and government agencies understand device distribution, identify security vulnerabilities, and take measures [1]. Researches on Internet-wide scan technology has received extensive attention both domestically and internationally. The research scope has evolved from improving the efficiency of scanning IP addresses[2]to exploring port scan [3,4], and further extended from the exploration of the IPv4 address space [2,3] to the successful exploration of the IPv6 address space [5,6]. Many researchers have begun focusing on the issue of scan coverage leveraging fast scanning tools like Zmap [7] and Nmap [8]. The goal is to ensure high scan rates while further improving the scan coverage. However, existing scanning tools and technologies still have several limitations, such as low efficiency. Traditional network address scanning tools typically use a sequential scanning method, resulting in slower speeds and an inability to complete large-scale network scans in a short period. Additionally, they lack accuracy. Current scanning tools may produce false positives and false negatives while identifying device types, operating systems, and services, leading to inaccurate scanning results.
Through extensive experiments, the study found that the geographic location of the scanning source significantly affects both the scanning speed and accuracy. Due to the existence of "geographic proximity", when scanning domestic IP addresses, the scan origin generally exhibits higher coverage and faster speed compared to scanning IP addresses from other countries. This phenomenon can be attributed to the local network topology and routing strategies, which make local scans more efficient in accessing and identifying local hosts. In contrast, cross-border scans may be hindered by international link latency, firewall restrictions, and network policies [7]. Therefore, relying on a single geographic location can’t cover the entire IP address space and may result in losing partial coverage. For instance, in Japan, around 1% of HTTP hosts are only accessible domestically, which means that scanning nodes deployed in other countries can’t reach these hosts [9]. To discover live hosts as many as possible and overcome "geographic proximity", it is necessary to adopt more accurate and comprehensive methods for further research.
The paper analyzes the impact of geographic location on scanning through experiments. We found that the reasonable distribution of tasks based on geographic location can improve scanning efficiency effectively. Therefore, we propose an efficient scanning method based on a location-aware detection approach. Below, we present the contributions of this paper:
- Through experiments, we introduced the concept of location-aware. Specifically, scanning nodes in a particular country are more efficient when scanning their own country’s IP addresses compared to scanning IP addresses from other countries. This phenomenon indicates that geographical proximity has a significant positive impact on network scanning efficiency.
- We propose a novel location-aware method that overcomes the limitations of geographical factors to achieve efficient network scanning. Using this method, we can more accurately identify live IP addresses across the entire network, significantly improving the detection scanning and accuracy of network resources.
- We conducted experimental analysis in real-world network environments. Compared to existing methods, our scanning efficiency is more effective, thus demonstrating the validity of the proposed method.
1. RELATED WORKS
As mentioned above, this paper focuses on the geographical location of scanning node deployment. Currently, there are multiple studies in various aspects of Internet-wide scanning aimed at improving scanning speed. Based on the research content, works related to our study can be categorized into two types:
The first category is customized algorithm research targeting specific challenges in network probing. For example, Shikhar Verma et al. [10] proposed a method using environmental recognition algorithms to classify WLAN environments into different states, thereby improving scanning performance. F. Tang et al. [11] proposed a NAT traversal system based on reverse proxies for scanning ports behind NAT. This addresses the port scanning issue for devices with private IP addresses behind NAT by adaptively adjusting scanning frequency to balance network performance and security. Gong et al. [12] introduced a dynamic weighting method based on centroid calculation to build a baseline model for Internet port scanning, aiming to detect abnormal behaviors in the network by analyzing changes in scanning traffic. L. Yanyan et al. [13] employed a Bayesian optimization method to improve port scanning techniques in router port testing. The Bayesian optimization-based port scanning technique constructs and updates a Bayesian optimization model to select the optimal scanning strategy, thus improving the efficiency and accuracy of router port testing.
The second category of research focuses on the influence of various factors during the scanning process on the scanning results. For example, Padmanabhan et al. [14] conducted a longitudinal study over nine years using ten PlanetLab nodes distributed in different geographical locations to explore the impact of weather conditions on host downtime. They used multiple vantage points for redundancy but did not analyze the differences between vantage points. However, they recognized that hosts might not respond to all origins and correlated the probability of these drop events with various factors. In [15], it was noted that, apart from Germany, Brazil, and Australia, a large portion of affected networks were in China. This work indicated that packet loss on the path to China was abnormally high and unstable. In [16], the study investigated how the network used for Internet-wide scanning affects the results. It was found that a single scanning node’s single-probe scan could detect around 96% of HTTP(S) and 84% of SSH hosts worldwide. This is more than double the loss initially estimated by Durumeric et al. Moreover, the issue was not just due to uniform random packet loss. Host inaccessibility was caused by both temporary and long-term network problems.
Overall, existing scanning methods have achieved good results from different perspectives. However, there is currently a lack of effective multi-node cooperative scanning methods for large-scale network scanning. In this paper, we propose a location-aware scanning method, which applies geographic location to Internet-wide scanning. It is a multi-node collaborative approach that can effectively address large-scale network scanning.
2. CONSIDERED SCENARIO AND MOTATIVATION
In the section, we will discuss the scenarios and motivations behind internet-wide scanning.
2.1. Considered Scenario
In this study, we focus on internet-wide scanning. In an internet environment, devices typically rely on the TCP/IP protocol for data transmission. The TCP/IP protocol is the foundation of modern network communication and is widely used for communication between various devices. As shown in Figure 1, network administrators often use specialized network scanning tools, such as Nmap, Zmap, and Masscan, to perform vulnerability scanning and security assessments in order to identify potential security risks and vulnerabilities in a timely manner.
Currently, there are various scanning methods available, one of which is TCP Connect Scan (full open scan). This paper primarily investigates the TCP Connect Scan method, which simulates a normal TCP connection process by sending a SYN packet to the target port. The status of the port is determined based on the received SYN-ACK or RST response. If a SYN-ACK response is received, the target port is open; if an RST response is received, the target port is closed. Additionally, there is a "filtered" status, which indicates that the state of the target port cannot be determined, as the probe packet may have been intercepted by a firewall, network device, or network congestion, preventing a response. In other words, the probe packet fails to receive the expected response (such as SYN-ACK or RST), leading to a timeout in the scanning tool’s waiting period. This situation directly affects the performance of the scan.
2.2. Motivation
Distributed scanning frameworks such as DNmap and Scantron usually adopt a random task assignment strategy when performing large-scale network scanning tasks.This means that the central server receives a task and randomly selects a scanner to perform the corresponding scanning task.Although this strategy is more common in distributed systems, it has significant drawbacks, especially in terms of scanning efficiency.Experimental data shows that scanners usually perform more efficiently when scanning IP addresses in their home countries, while they are significantly less efficient when scanning IP addresses in other countries.This conclusion is fully verified in the experiments of this study, and this finding provides a strong basis for improving the task scheduling mechanism.
The experimental results in Figure 2 clearly demonstrate the effectiveness of the location-aware model and further reveal the differences in scanning efficiency of scanning sources from different countries through visualisation charts.Different colours in the bar chart represent different countries (AU, GB, NL, JP, SG, US), while the horizontal coordinate is the target country and the vertical coordinate is the time required for scanning.As can be seen from the graph, the difference in scanning time between scanners from different sources when scanning the same target country is very significant.For example, in the task of scanning AU (Australia), scanners located in AU’s home country took significantly less time than scanners from other countries, while scanners from GB (UK) took the longest time to complete the task. The reason behind this phenomenon is not entirely determined by physical distance.Although geographically AU was farther away from GB than other scanning sources, this factor did not fully explain the scanning time differences.For example, even though SG (Singapore) is physically closer to AU than NL (Netherlands), US (United States) and JP (Japan), the scanning time of the SG scanner is longer than that of the scanners in these countries.This suggests that the scanning efficiency of a scanner is not only related to the physical distance, but also closely related to the ease of network access between different countries.Specifically, JP’s scanner is much smoother than SG’s scanner in scanning AU’s IP address, which may be related to factors such as the speed of cross-country data transfer.
Therefore, how to achieve efficient task allocation and ensure load balancing among scanners while taking advantage of geographical location has become a major challenge to be solved, and the next section will delve into the scanning node task scheduling mechanism. By the way, the geographical location we mentioned is not the physical distance, but the network connection distance, some countries although the physical distance is relatively close, but the physical connection will go through multiple routes and firewalls, thus the delay is relatively large, so the geographical location refers to the network routing location rather than the real physical location.
3. PROPOSED APPROACH
In this section, we first model the overall scan time based on the above-mentioned issues, and then analyze the factors affecting scan efficiency according to the model, in order to propose a task scheduling method.
3.1. Delay Model
We consider that the overall scanning rate can be affected by the scanning rate of the scanning nodes. When the scanning efficiency of the nodes is low, the number of remaining tasks for the scanning nodes will increase.Therefore, it is possible to predict the completion time of a scanning node based on its residual task volume and scanning rate. Since task scheduling is dynamic, when a scanning task needs to be matched with scanning nodes, we need to jointly predict the completion time of the scanning node by considering the task volume of the task, the residual task volume of the node, and the scanning rate. Since the completion times of each scanning node are different, the overall scanning time should be the scanning time taken by the last node to complete its task.To accurately quantify and analyze the impact of these factors, we introduce a mathematical model to establish a mathematical relationship that reveals the joint impact of these factors on the total time (T) used for scanning:
In the above equation, is the task load stored by the node i, is the task load that node i will receive, and is the execution speed of node i. Using the above delay model as the theoretical basis, we have developed a method for balancing the task load across nodes.
3.2. Overview of Proposed Approach
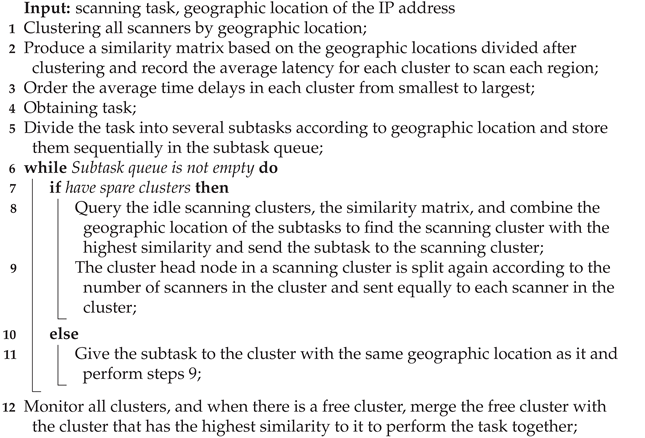
Our goal is to reduce scanning time (T). In Equation 1, we have already improved the scanning node’s execution speed () by reasonably distributing scanning tasks based on the geographic location of each scanning node. However, solely relying on geographic location to distribute tasks can lead to an imbalance in the residual task volume () and the upcoming task volume () for each scanning node, which in turn affects the overall scanning time.Therefore,in order to improve the efficiency of the original allocation method, a good task scheduling method is needed [17].To ensure that each scanner performs the tasks it is good at and to prevent wastage of scanner resources, we adopt a load balanced task scheduling method combined with a location-aware method to form a location-aware efficient scanning algorithm,see Algorithm 1 for details.
The method is divided into two main parts, the first part is from step 1 to step 5, which is the pre-scanning method, where step 1 to step 3 is to cluster the scanners according to their geographic locations and produce a similarity matrix in advance based on the history of scanning records for each geographic location, to provide a logical basis for the subsequent parts.Steps 4 to 5 are for cutting the tasks according to the geographic locations in order to facilitate the assignment of tasks to the scanner clusters.
Step 6 to step 12 is the second part which is the method of load balancing.Where steps 7, 8, 11 and 12 are intra-cluster balancing, the core idea of achieving load balancing within clusters is to allow idle scanning clusters to perform the tasks they are good at as much as possible during the task distribution phase.In the task distribution completion phase, there are no idle scanning clusters as much as possible[18].Step 9 is to achieve load balancing of scanners within the cluster, the idea is to equally distribute the number of IP addresses in each subtask to each scanner.When there is an idle scanner, let the idle scanner communicate with the busy scanner to help it perform the task.
| Algorithm 1: Efficient Scanning Algorithms for Location-Aware |
 |
3.3. Approach
The method has two main objectives. One is to allow each scanning node to perform tasks according to its expertise based on its geographical location. The second is to ensure load balancing among the scanning nodes. As mentioned above, to achieve these two goals, we divide the method into two parts: clustering and grouping of scanning clusters, and load balancing within and between clusters. In clustering and grouping of scanned nodes, the main factor is the geographical location of the nodes. However, due to the large number of countries around the world, we need to achieve global IP address scanning at a limited number of scanning origin locations.Therefore we introduce a similarity to measure the scanning efficiency between countries. And a similarity matrix with M rows and N columns is constructed based on the similarity between each location.Where M is the number of geographic locations of scanners and N is the number of global countries.The initial similarity matrix can be calculated based on historical scanning data. In order to reduce the time delay due to inaccurate similarity, the similarity matrix is periodically updated based on the average of the scan results.The specific process is shown in Figure 3. The similarity () between each country is calculated using the following formula:
In this, represents the total number of IP addresses scanned from country i to country j,and represents the total time taken by country i to scan country j. When the average scanning time is smaller, the similarity between the two countries increases.When a scanning task arrives, in order to allow each scanning cluster to scan IP addresses from the same country it is located in, the task is first divided into multiple sub-tasks based on the countries where the IP addresses are located. The most suitable scanning cluster is then selected by querying the similarity matrix for each sub-task’s corresponding country. However, task allocation solely based on geographic location can lead to load imbalance among scanning nodes. To address this issue, we adopt a three-layer load balancing mechanism.
The first layer is task matching with scanning clusters. When a scanning task arrives, the central server divides the task into several sub-tasks based on geographic location. When assigning tasks to scanning clusters, the priority is given to those clusters with high similarity and low load. Specifically, based on the similarity matrix, the server checks the workload of scanning clusters in descending order of similarity to the geographic location of the task. If the workload of a particular cluster is below a predefined threshold, the task is assigned to that cluster. By considering both similarity and workload when assigning scanning tasks, this mechanism avoids situations where some servers are idle while others are overloaded due to an excessive task volume from one country.
The second layer is collaborative scanning between scanning clusters. During task execution, some scanning clusters may have faster scanning speeds than others, leading to the possibility of idle clusters. When a scanning cluster is idle, it will check the workload status of other clusters in sequence according to the similarity matrix. If another cluster is busy, the scanning nodes of both clusters will merge to jointly execute the task. This process will be repeated whenever an idle cluster is found, until all clusters are in a busy state, thereby improving the scanning efficiency of the busy clusters.The third layer is load balancing among scanning nodes within a cluster. To achieve load balancing within a cluster, we construct a task queue that stores and distributes scanning tasks. If the task queue is not empty, scanning nodes within the cluster will sequentially fetch tasks from the queue. If the task queue is empty, the cluster will engage in the collaborative scanning process from the second layer. With this three-layer execution mechanism, each scanning node is assigned tasks with high similarity, while ensuring that both scanning clusters and individual scanning nodes within a cluster achieve load balancing, ultimately increasing the overall scanning efficiency.
4. EXPERIMENTS
In this section, we validate the previously proposed location-aware scanning approach in terms of scanning efficiency, load balancing aspects between scanning clusters and between scanners, and scanning coverage.In order to demonstrate the effectiveness of our approach more intuitively, we compare and analyse our proposed method with the current frequently used random scanning methods.
4.1. Experimental Setup
In our lab, we have more than 500 nodes, which are distributed in many countries around the world.In order to better simulate the real network environment and to take into account the variability of different geographic regions, we have selected several countries with significant geographic differences as the scanning origin of our experiments, namely Thailand (TH), Japan (JP), Germany (DE), the United States (US) and Australia (AU).These countries are not only geographically dispersed, but also have large differences in network infrastructure, bandwidth and latency, which allows their performance in the network environment to reflect diverse global network characteristics.In the above section it is mentioned that we mainly use Nmap as the main research tool and hence Nmap is used as the scanning tool. In the algorithm it is mentioned that we need the geolocation of IP addresses, therefore, in the scanning dataset we use IP2Location [19] as the IP geolocation database.In the execution part of our algorithm, it is divided into two parts in total, where the first part is the pre-scanning procedure, therefore, we need to cluster the scanners of five countries first, and then, select 30 network segments of each country from the IP2Location database as the initial task.Use these clusters to go through the scanning tasks separately to get the scanning results for each geographical location.In Figure 4(a), we present some of the scan data.The rows represent the target countries and the columns represent the starting countries. Each value represents the average scanning time. In Figure 4(b), we show the storage structure of the list.The lighter coloured ones are the target geographic locations and the darker ones are the geographic locations where the scanners are located.When there is a task to be assigned, the program looks for the lighter-coloured location first, and then the darker-coloured location in turn to find the scanners that can be assigned.
4.2. Experiments Analysis
1) Efficiency Evaluation: Efficiency evaluation is the central starting point of our study, and is evaluated by scanning the average usage time of network segments for individual IP addresses.Each network segment is 24 network bits and the selection of each network segment is randomised.This design is able to better simulate the uncertainty of a realistic network environment.During the experiment, to ensure the reliability of the data and the stability of the experimental results, we designed three independent experiments and selected a different IP address for scanning in each experiment.This not only helps to eliminate the chance factors in the experiments, but also enhances the universality and representativeness of the experimental results.Figure 5 shows the results of the scanning time evaluation based on the location-aware model with the random scanning method under different numbers of IP network segments.As can be seen from the figure, Figure 5(a) to Figure 5(d) represent the situation when different numbers of scanning clusters are used, respectively.In these figures, the horizontal axis represents the number of IP network segments scanned and the vertical axis represents the average scanning time.In order to clearly distinguish between the different scanning methods, different colours are used for the bar charts, where one type of colour indicates the location-aware scanning method and the other type represents the random scanning method.With this comparative data, we can draw several key conclusions.
Firstly, it is obvious from the data of each subgraph that the average scanning time of the location-aware scanning method is always lower than that of the random scanning method.Even in the case of a large number of network segments, the location-aware model still exhibits high scanning efficiency.This is because the location-aware model is able to perform reasonable task allocation based on the geographical location of network segments, which reduces the scanning delay and improves the scanning efficiency.Comparatively, the random scanning approach lacks such optimisation, resulting in the assignment of tasks showing disorder, causing the scanner to perform a large number of inept tasks, which in turn increases the average time of scanning.
However, it is worth noting that the average scanning time of the location-aware scanning method shows a gradual increase as the number of network segments increases.The reason for this phenomenon is that the number of scanning clusters is limited.As the number of IP network segments to be scanned increases, the location-aware model is faced with more tasks, and the amount of tasks that the cluster is not good at increases, which leads to an increase in scanning time.For the random scanning approach, the average usage time is significantly higher than the location-aware approach.This is mainly due to the unstructured nature of the random scanning approach.Random scanning does not have a clear task assignment rule, resulting in a large number of scanning clusters acquiring tasks that they are not good at, so that each task is executed until it times out.This makes the overall time consumption of the random scanning method much higher.In contrast, the location-aware approach reduces the time spent waiting for a timeout due to the inability to obtain a response from the target host for a long period of time by optimising the task allocation, and thus is able to show a superior performance in most cases.
Finally, as a whole, the average scanning time of the location-aware scanning method instead shows a gradual decrease as the number of scanning clusters increases.This result is intriguing and further validates our hypothesis that increasing the number of scanning clusters can effectively improve the efficiency of location-aware models.When the number of scanning clusters is increased, the burden of each cluster is shared and each cluster is allowed to perform the tasks it is good at with high probability, improving the overall scanning speed.The emergence of this phenomenon further proves the correctness of our view that the location-aware scanning method can effectively reduce the scanning time and thus improve the scanning efficiency with reasonable task allocation and optimised task scheduling.
In summary, by analysing these experimental data, we can conclude that the location-aware scanning approach excels in reducing the scanning time, especially when the number of network segments is large, and can significantly improve the efficiency and reduce the unnecessary waste of time.Therefore, the application of location-aware models in large-scale network scanning tasks has significant advantages.
2) Load balancing validation: In the above method, we introduced a load balancing scheme to address the differences in scanning efficiency among different clusters.In order to verify the effectiveness of the method, we have recorded the scanning time of each scanning cluster and scanning node in detail, and the specific data is shown in Figure 6.The criterion for verifying load balancing is that if the difference in scanning time between different scanning clusters is large, the load is considered to be unbalanced; conversely, if the time difference is small, the load is considered to be balanced.In Figure 6(a), the x-axis represents the number of target network segments being scanned, and the y-axis represents the time spent on scanning.We can observe that the difference in scanning time between each scanning cluster is small, which indicates that the load between clusters has reached a relatively balanced state through the load balancing method.Furthermore, to verify the load balancing among the scanning nodes, we deploy three scanners in the DE cluster and two scanners in the US cluster, as shown in Figure 6(b,c).We observe that there is no significant difference in the scanning time of each scanning node within the cluster, either in the DE cluster or the US cluster.To further demonstrate the advantages of load balancing, we show the time used by the shortest as well as the longest time-consuming scanners in the random scanning method, as detailed in Figure 6(d).The variability between the shortest elapsed time and the longest elapsed time of this random scanning method can be seen in Figure 6(d) to be particularly significant.The reason why this occurs is that randomness tends to assign tasks in a discrete manner, causing some scanners to receive tasks that are mostly inept and some scanners to receive tasks that are mostly inept.This would make a significant difference in the time it takes the scanners to complete.Therefore, this result in Figure 6(d) further confirms the effectiveness of the load balancing approach, showing that by reasonably allocating scanning tasks, we can effectively avoid node overloading and thus improve the overall scanning efficiency.
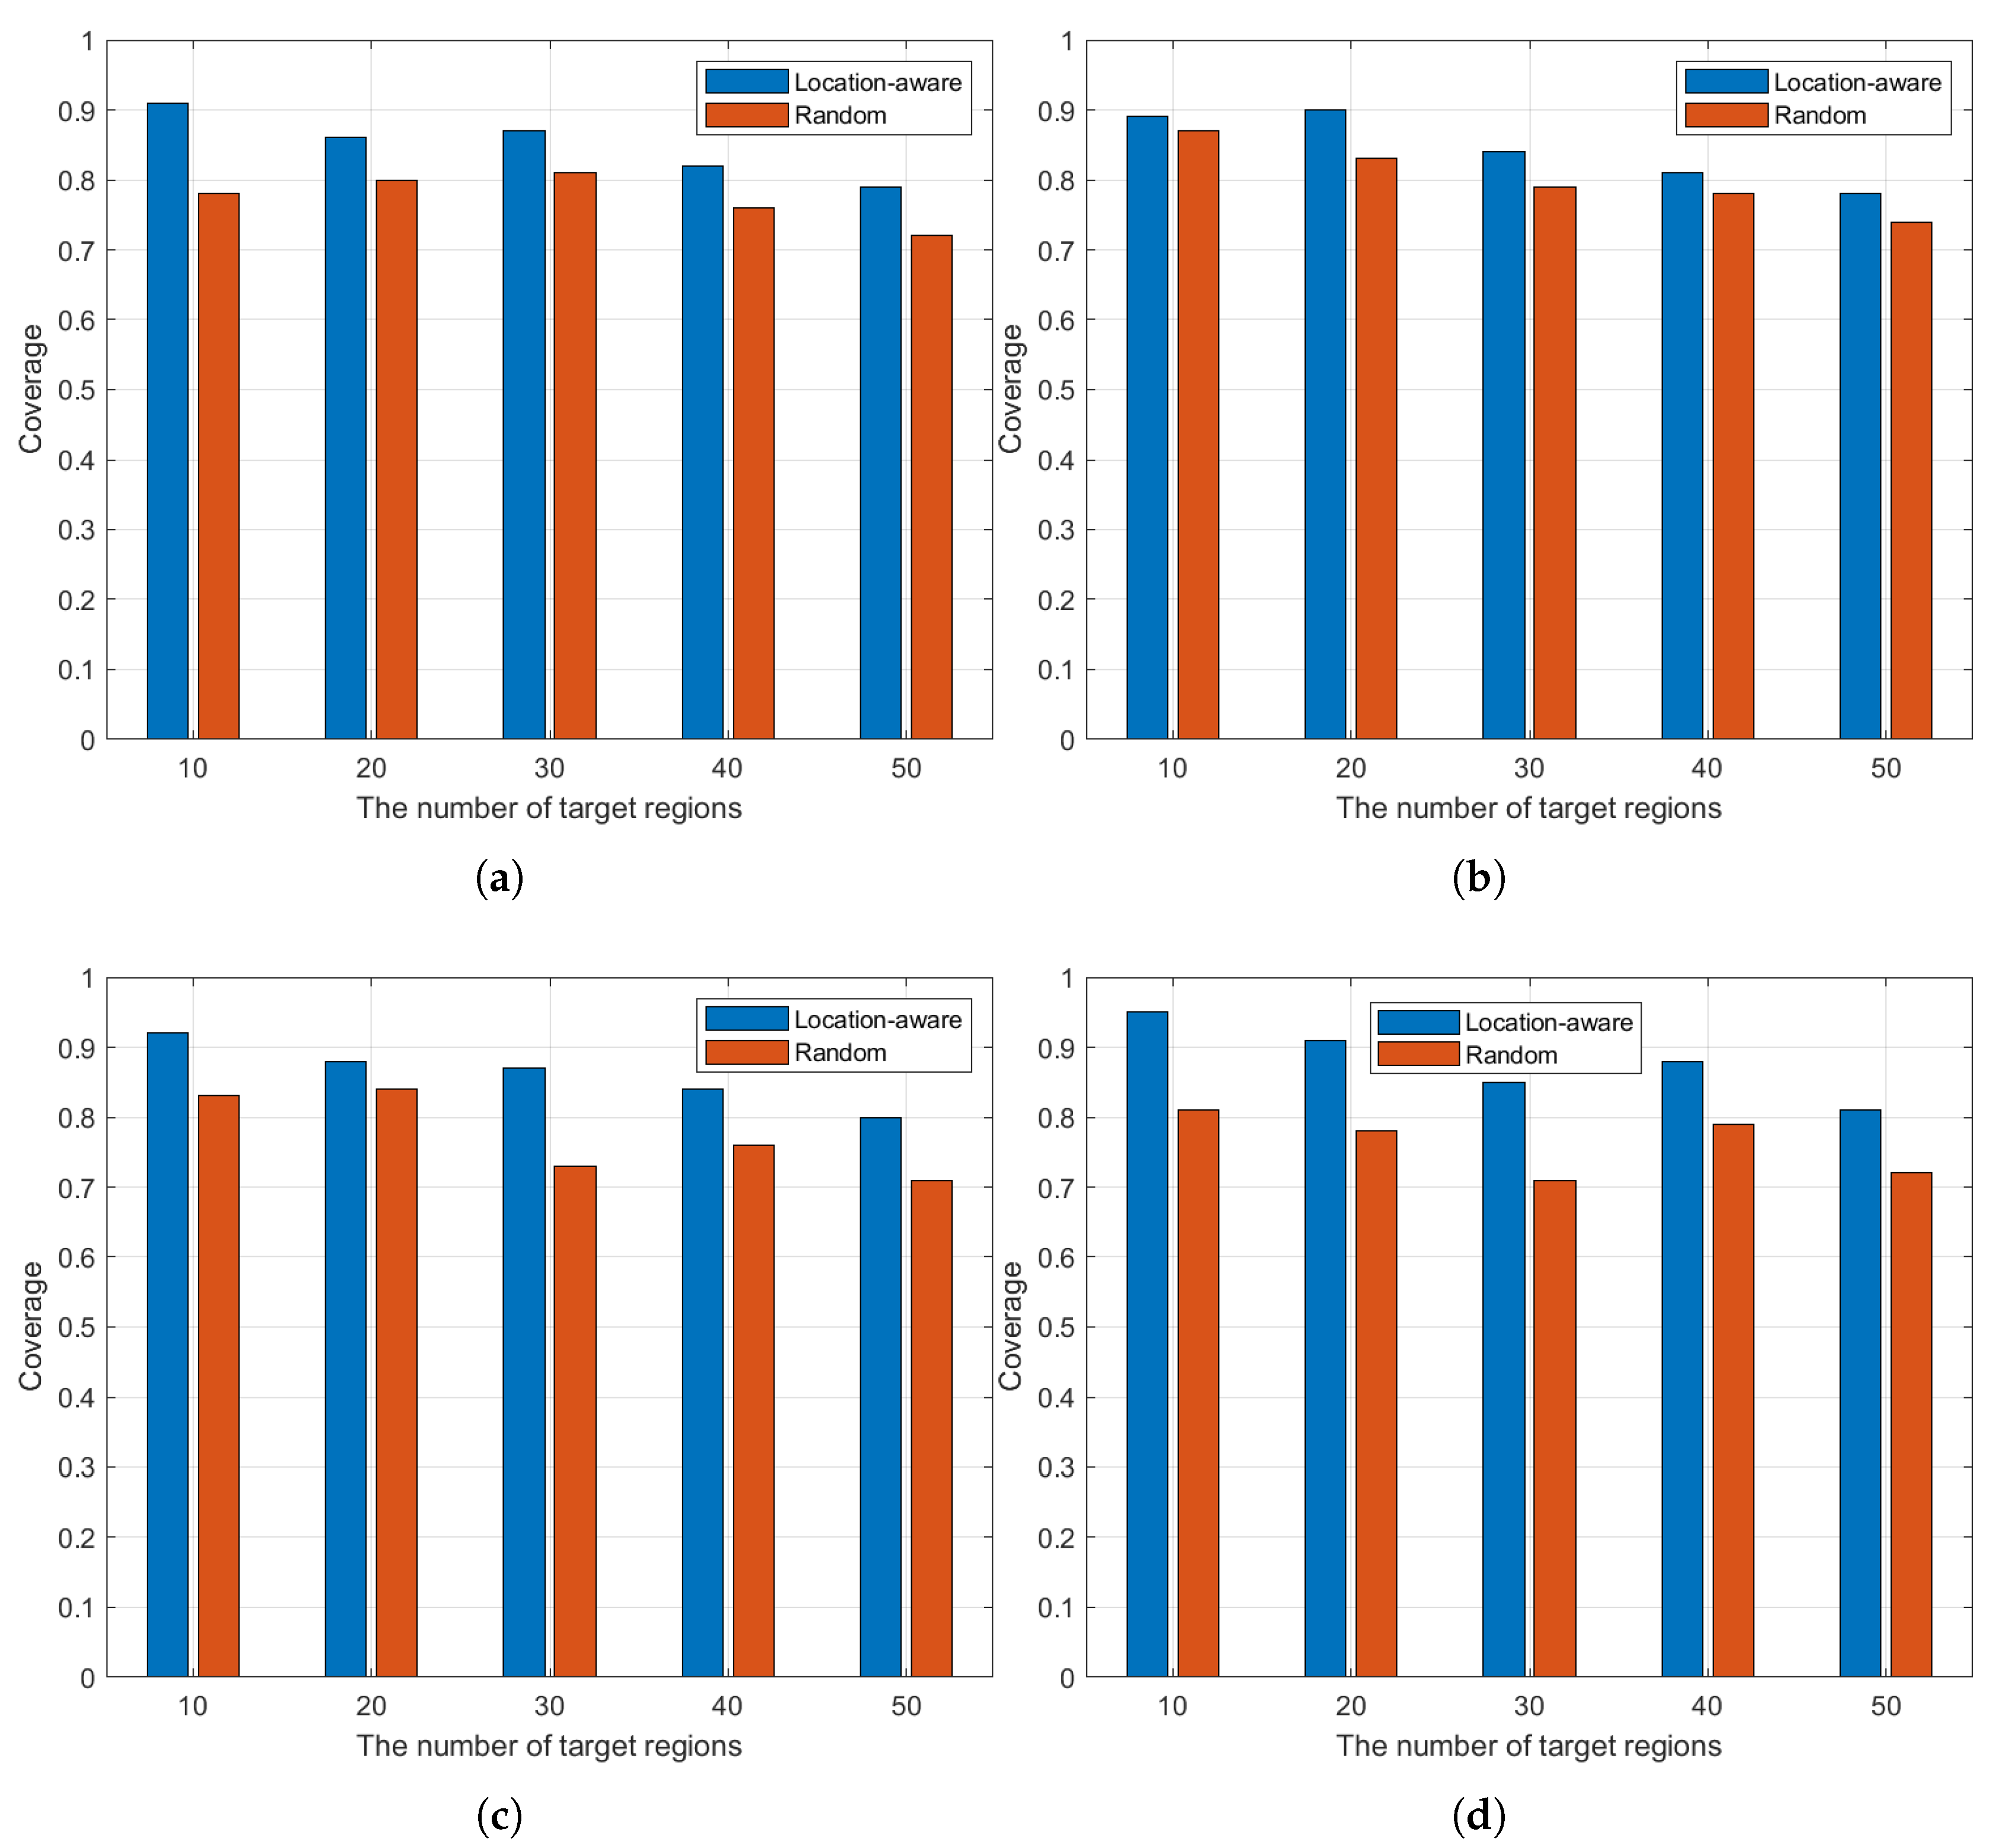
3) Coverage evaluation:In the field of Internet scope scanning, the core criteria for evaluating the strengths and weaknesses of a scanning method include scanning efficiency and coverage.We have already verified the effectiveness of our method in terms of scanning efficiency, so we focus on analysing its performance in terms of coverage rate.Coverage ratio is usually defined as the ratio of the number of target IP addresses successfully hit during the scanning process to all potential target addresses, which reflects the comprehensiveness and actual effectiveness of the scanning task in the target space.Figure 7(a–d) demonstrate the coverage ratio of our proposed method compared with the random scanning method under different configurations with the number of scanning clusters of 5, 10, 20, and 30, respectively.From each sub-figure, it can be seen that the coverage of our method shows an increasing and then decreasing trend as the number of scanned regions increases.This phenomenon is attributed to the fact that when the scanned regions become more numerous, the limited scanning clusters are more likely to be allocated to regions that are not good at scanning, resulting in the overall scanning effectiveness being affected.Taken together, with a fixed number of scanning regions, the coverage rate tends to increase as the number of scanning clusters increases, indicating that more scanning clusters can bring higher resource scheduling flexibility and better scanning coverage results.
5. CONCLUSION
In this study, we first experimentally analysed and found that when network scanning was performed using scanning sources from different countries, there was a significant difference in the time required for the scanning task, even though the target network was located in the same country.This phenomenon suggests that geographical location has a significant impact on scanning efficiency, especially in network scanning on a global scale.Differences in network environments in different countries can affect the accessibility of different countries, which in turn affects the efficiency of scanning.Therefore, we address this problem by proposing a geolocation-based scanning method that aims to improve scanning efficiency.Specifically, the method divides the scanning clusters using geographic locations and constructs a similarity matrix, and then schedules the scanning tasks in an ordered manner based on this similarity matrix, by which it can realise the fastest scanning method to scan all the regions of the globe within a limited scanning area.However, simply relying on geographic location to distribute tasks still cannot completely solve the scanning efficiency problem, especially in large-scale network environments.To further optimise the scanning efficiency, we propose a load balancing approach.This approach not only balances the load among different scanning clusters, but also optimises the workload distribution of scanning nodes within the same cluster.By dynamically adjusting the task volume of each scanning node, we are able to avoid the idle state of some scanners, which leads to the waste of scanning resources.This improves the overall scanning efficiency.In the experimental part, we demonstrate the effectiveness of the proposed model and algorithm in improving scanning efficiency by validating them in a real network environment.By comparing with traditional scanning methods, our location-aware scanning method improves the scanning efficiency while ensuring the scanning coverage.It especially performs well in multinational network environments.This result suggests that geographic location factors play an important role in improving network scanning efficiency.
References
- Mazurczyk, W.; Caviglione, L. Cyber reconnaissance techniques. Commun. ACM 2021,64, 86-95. [CrossRef]
- Hashida, H.; Kawamoto, Y.; Kato, N. Efficient delay-based internet-wide scanning method for IoT devices in wireless LAN. IEEE Internet Things J. 2020,7, 1364–1374. [CrossRef]
- Song, G.; et al. Which doors are open: Reinforcement learning-based internet-wide port scanning. In Proceedings of the 2023 IEEE/ACM 31st International Symposium on Quality of Service (IWQoS), Orlando, FL, USA, 2023; pp. 1–10. [CrossRef]
- Verma, S.; Kawamoto, Y.; Kato, N. A smart internet-wide port scan approach for improving IoT security under dynamic WLAN environments. IEEE Internet Things J. 2022, 9, 11951–11961. [CrossRef]
- Hou, B.; Cai, Z.; Wu, K.; Su, J.; Xiong, Y. 6Hit: A reinforcement learning-based approach to target generation for internet-wide IPv6 scanning. In Proceedings of the IEEE INFOCOM 2021 - IEEE Conference on Computer Communications, Vancouver, BC, Canada, 2021; pp. 1–10. [CrossRef]
- Hou, B.; Cai, Z.; Wu, K.; Yang, T.; Zhou, T. 6Scan: A high-efficiency dynamic internet-wide IPv6 scanner with regional encoding. IEEE/ACM Trans. Netw. 2023, 31, 1870–1885. [CrossRef]
- Durumeric, Z. ZMap: The Internet Scanner. Available online: https://github.com/zmap/zmap (accessed on 26 July 2019).
- NMAP.ORG. Available online: https://nmap.org/ (accessed on 26 July 2019).
- Wan, G.; Izhikevich, L.; Adrian, D.; Yoshioka, K.; Holz, R.; Rossow, C.; Durumeric, Z. On the origin of scanning: The impact of location on internet-wide scans. In Proceedings of the ACM Internet Measurement Conference (IMC ’20), New York, NY, USA, 2020; pp. 662–679. [CrossRef]
- Verma, S.; Kawamoto, Y.; Kato, N. A novel IoT-aware WLAN environment identification for efficient internet-wide port scan. In Proceedings of the 2020 IEEE Global Communications Conference (GLOBECOM), Taipei, Taiwan, 2020; pp. 1–6. [CrossRef]
- Tang, F.; Kawamoto, Y.; Kato, N.; Yano, K.; Suzuki, Y. Probe delay-based adaptive port scanning for IoT devices with private IP address behind NAT. IEEE Netw. 2020, 34, 195–201. [CrossRef]
- Gong, Q.; Gu, C. A baseline modeling algorithm for internet port scanning radiation flows. In Proceedings of the 2021 IEEE 6th International Conference on Signal and Image Processing (ICSIP), Nanjing, China, 2021; pp. 1255–1259. [CrossRef]
- Yanyan, L.; Shanhou, H. Application of Bayesian optimization in router port testing: An improved port scanning technique. In Proceedings of the 2023 IEEE 5th International Conference on Power, Intelligent Computing and Systems (ICPICS), Shenyang, China, 2023; pp. 98–103. [CrossRef]
- Padmanabhan, R.; Schulman, A.; Levin, D.; Spring, N. Residential links under the weather. In ACM SIGCOMM, 2019.
- Zhu, P.; Man, K.; Wang, Z.; Ensafi, R.; Halderman, J. A.; Duan, H. Characterizing transnational internet performance and the great bottleneck of China. In ACM Sigmetrics, 2020.
- Pearce, P.; Jones, B.; Li, F.; Ensafi, R.; Feamster, N.; Weaver, N.; Paxson, V. Global measurement of DNS manipulation. In USENIX Security Symposium, 2017.
- Hao, H.; Xu, C.; Zhang, W.; Yang, S.; Muntean, G.-M. Task-driven priority-aware computation offloading using deep reinforcement learning. IEEE Trans. Wirel. Commun. 2025, early access. [CrossRef]
- Hao, H.; Xu, C.; Zhang, W.; Yang, S.; Muntean, G.-M. Joint task offloading, resource allocation, and trajectory design for multi-UAV cooperative edge computing with task priority. IEEE Trans. Mob. Comput. 2024, 23, 8649–8663. [CrossRef]
- IP2Location. IP2Location API Open Platform. Available online: https://www.ip2location.com/ (accessed on 26 July 2019).
Figure 1.
Internet-wide scanning scenario.
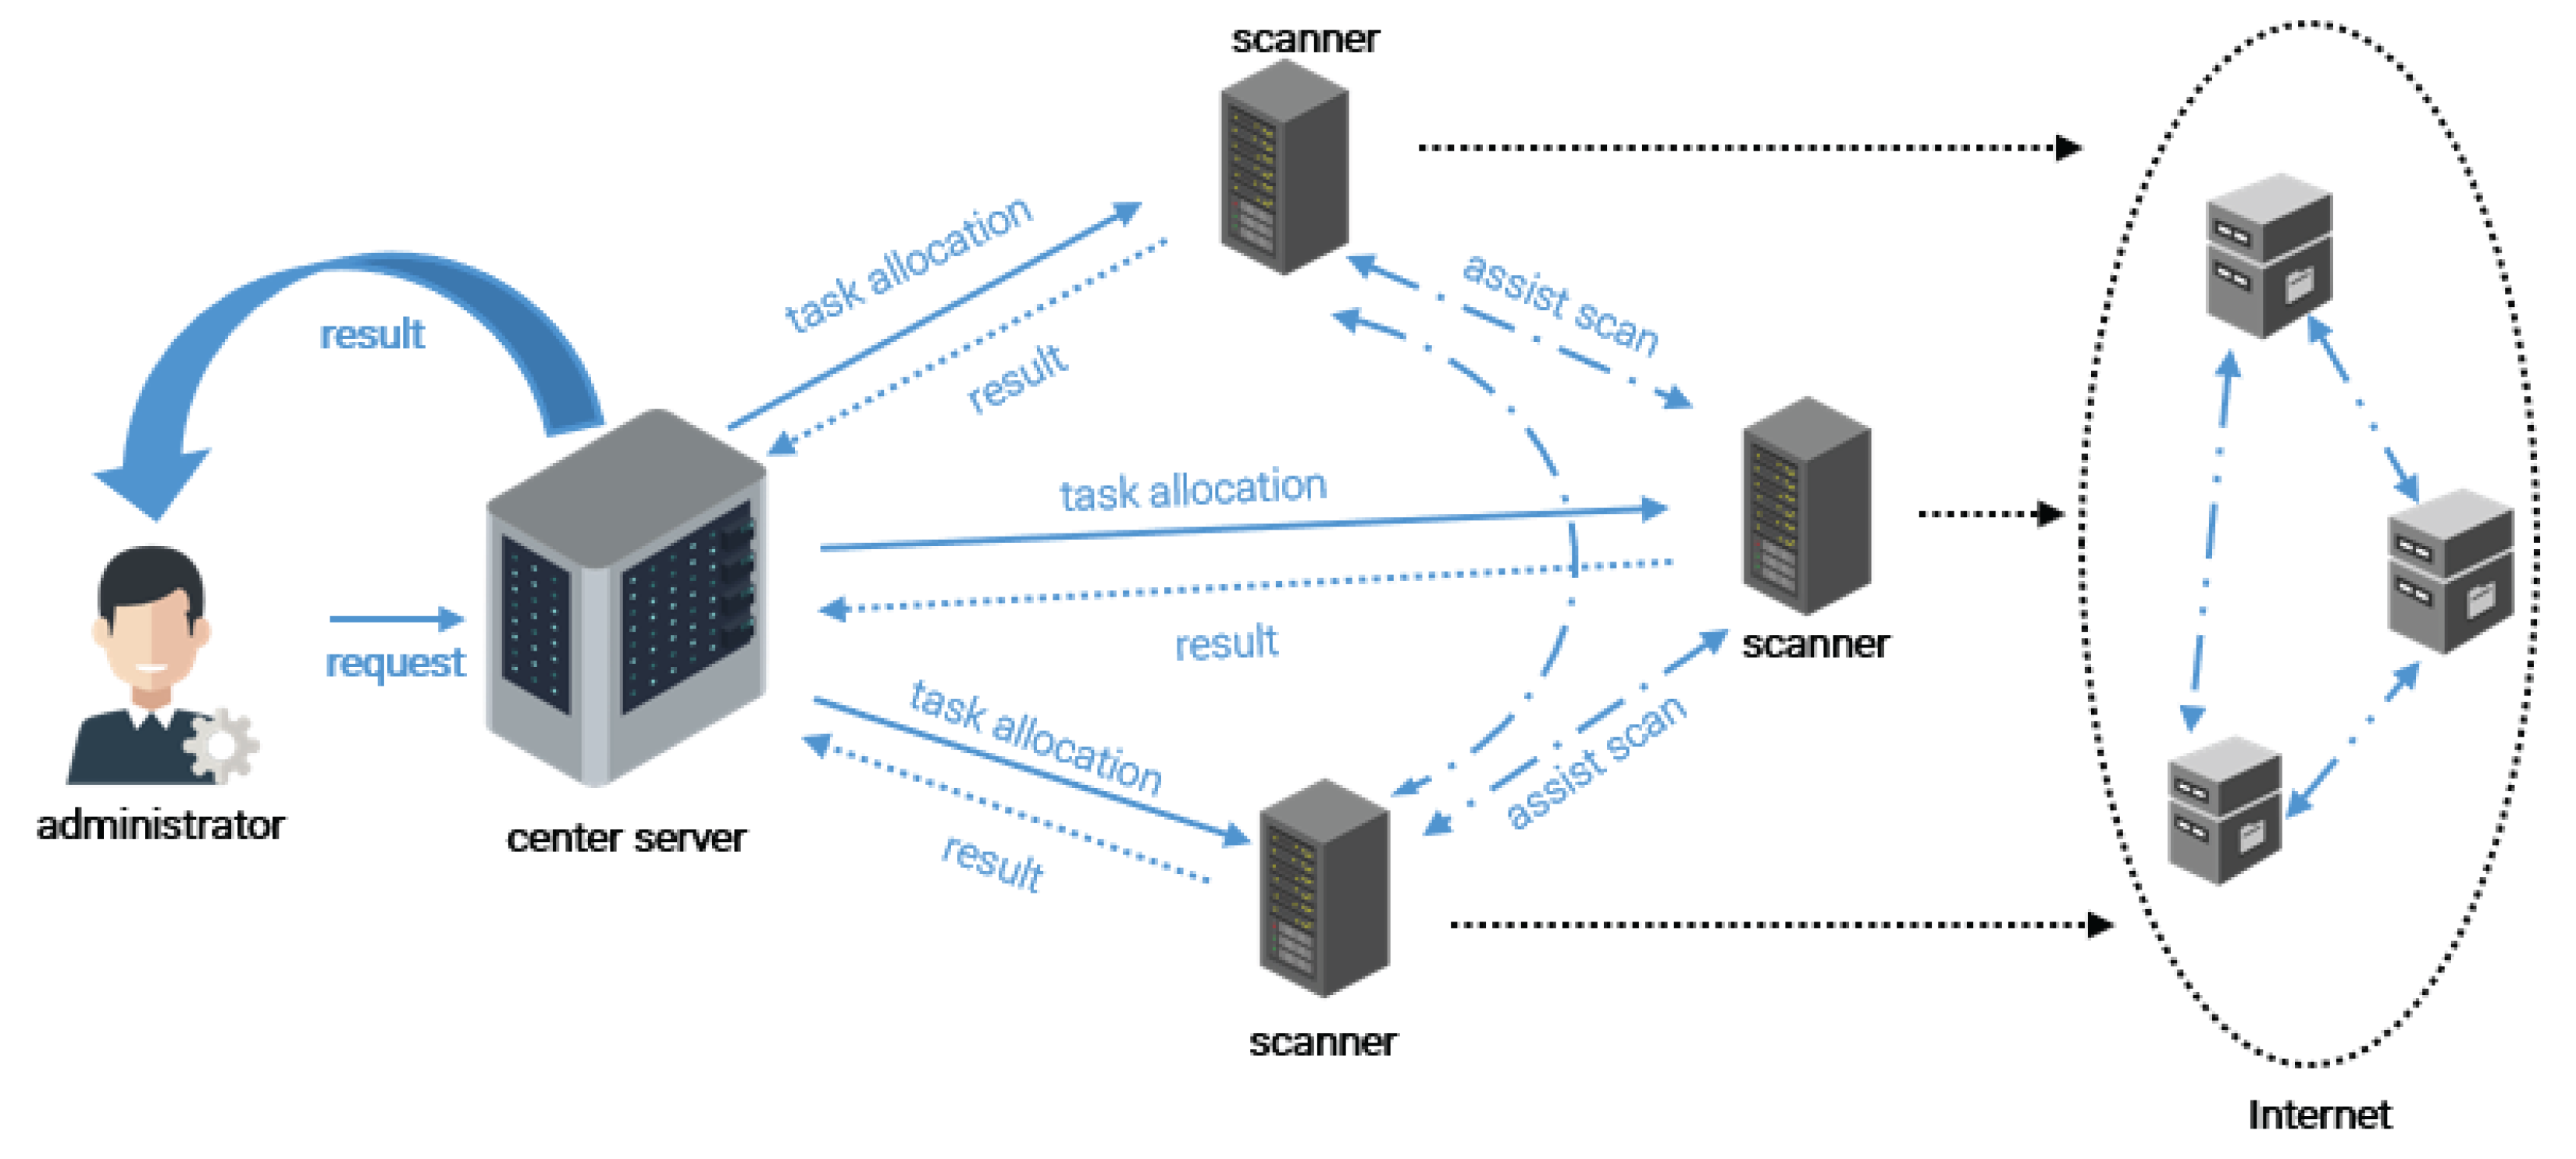
Figure 2.
Verification of location-aware experiments: (a)AU Time used for scanning target countries;(b)GB Time used for scanning target countries;(c)NL Time used for scanning target countries;(d)JP Time used for scanning target countries;(e)SG Time used for scanning target countries;(f)US Time used for scanning target countries.
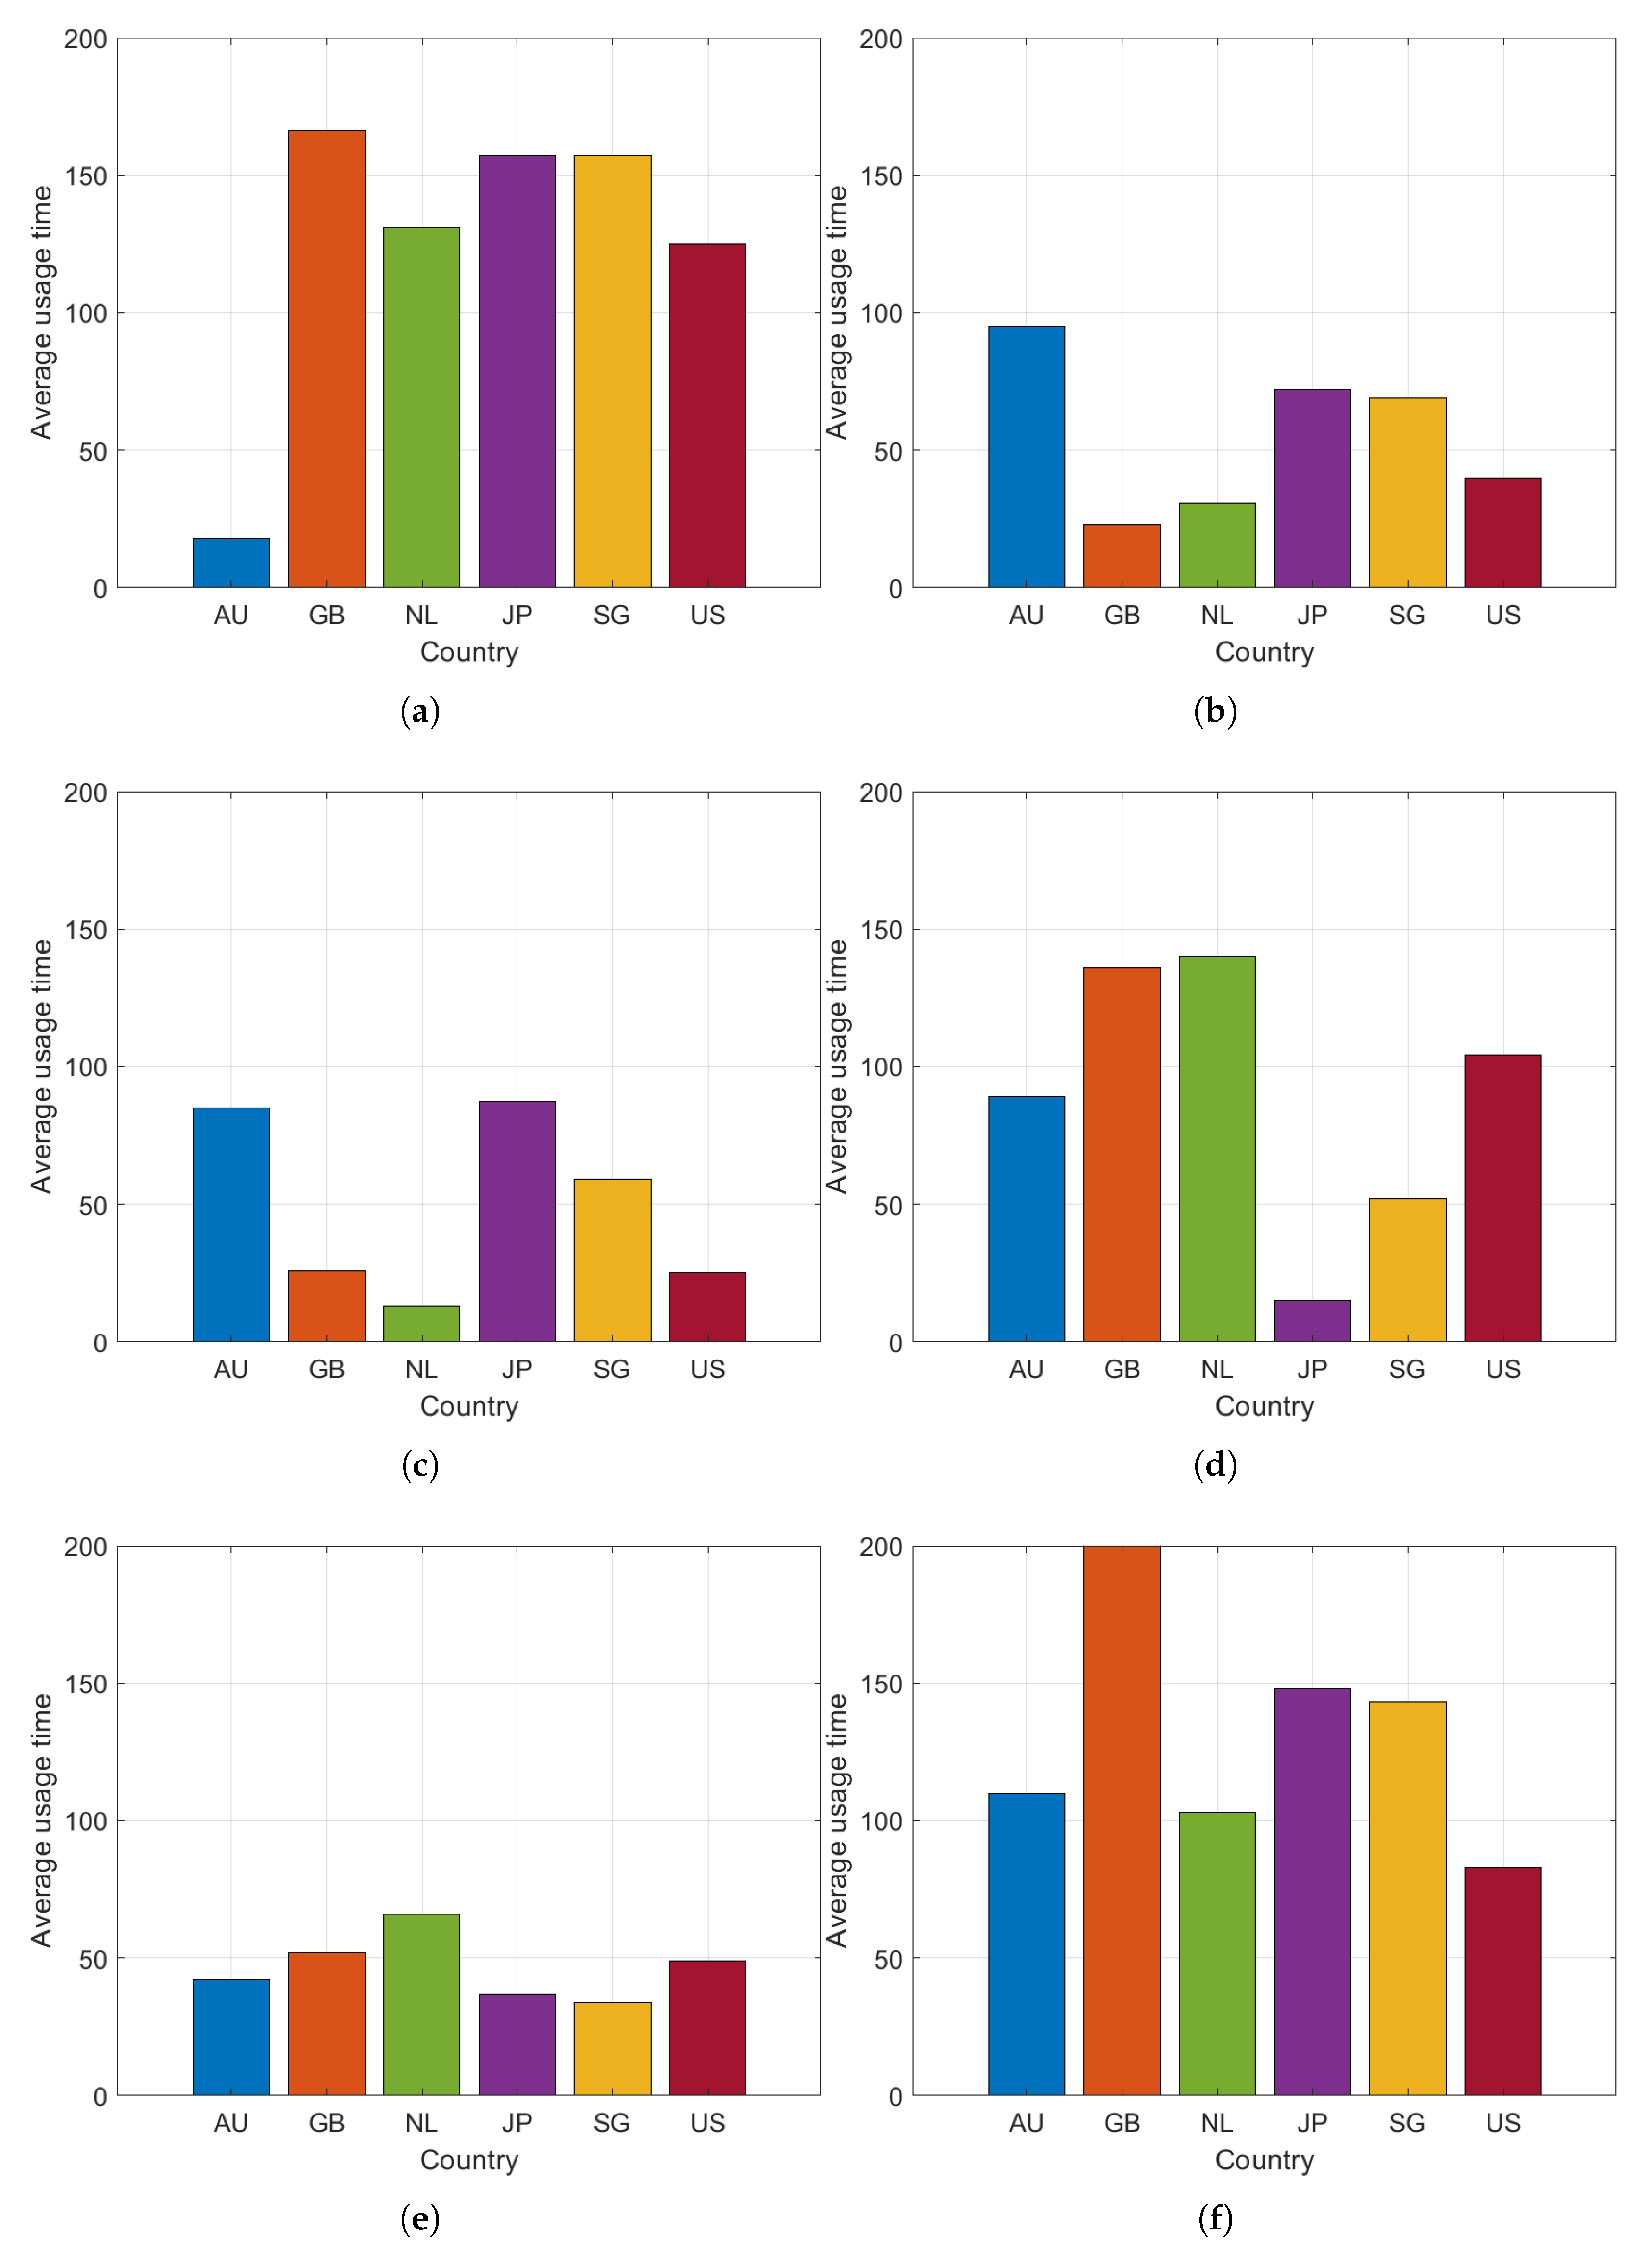
Figure 3.
Similarity Matrix Update Process.
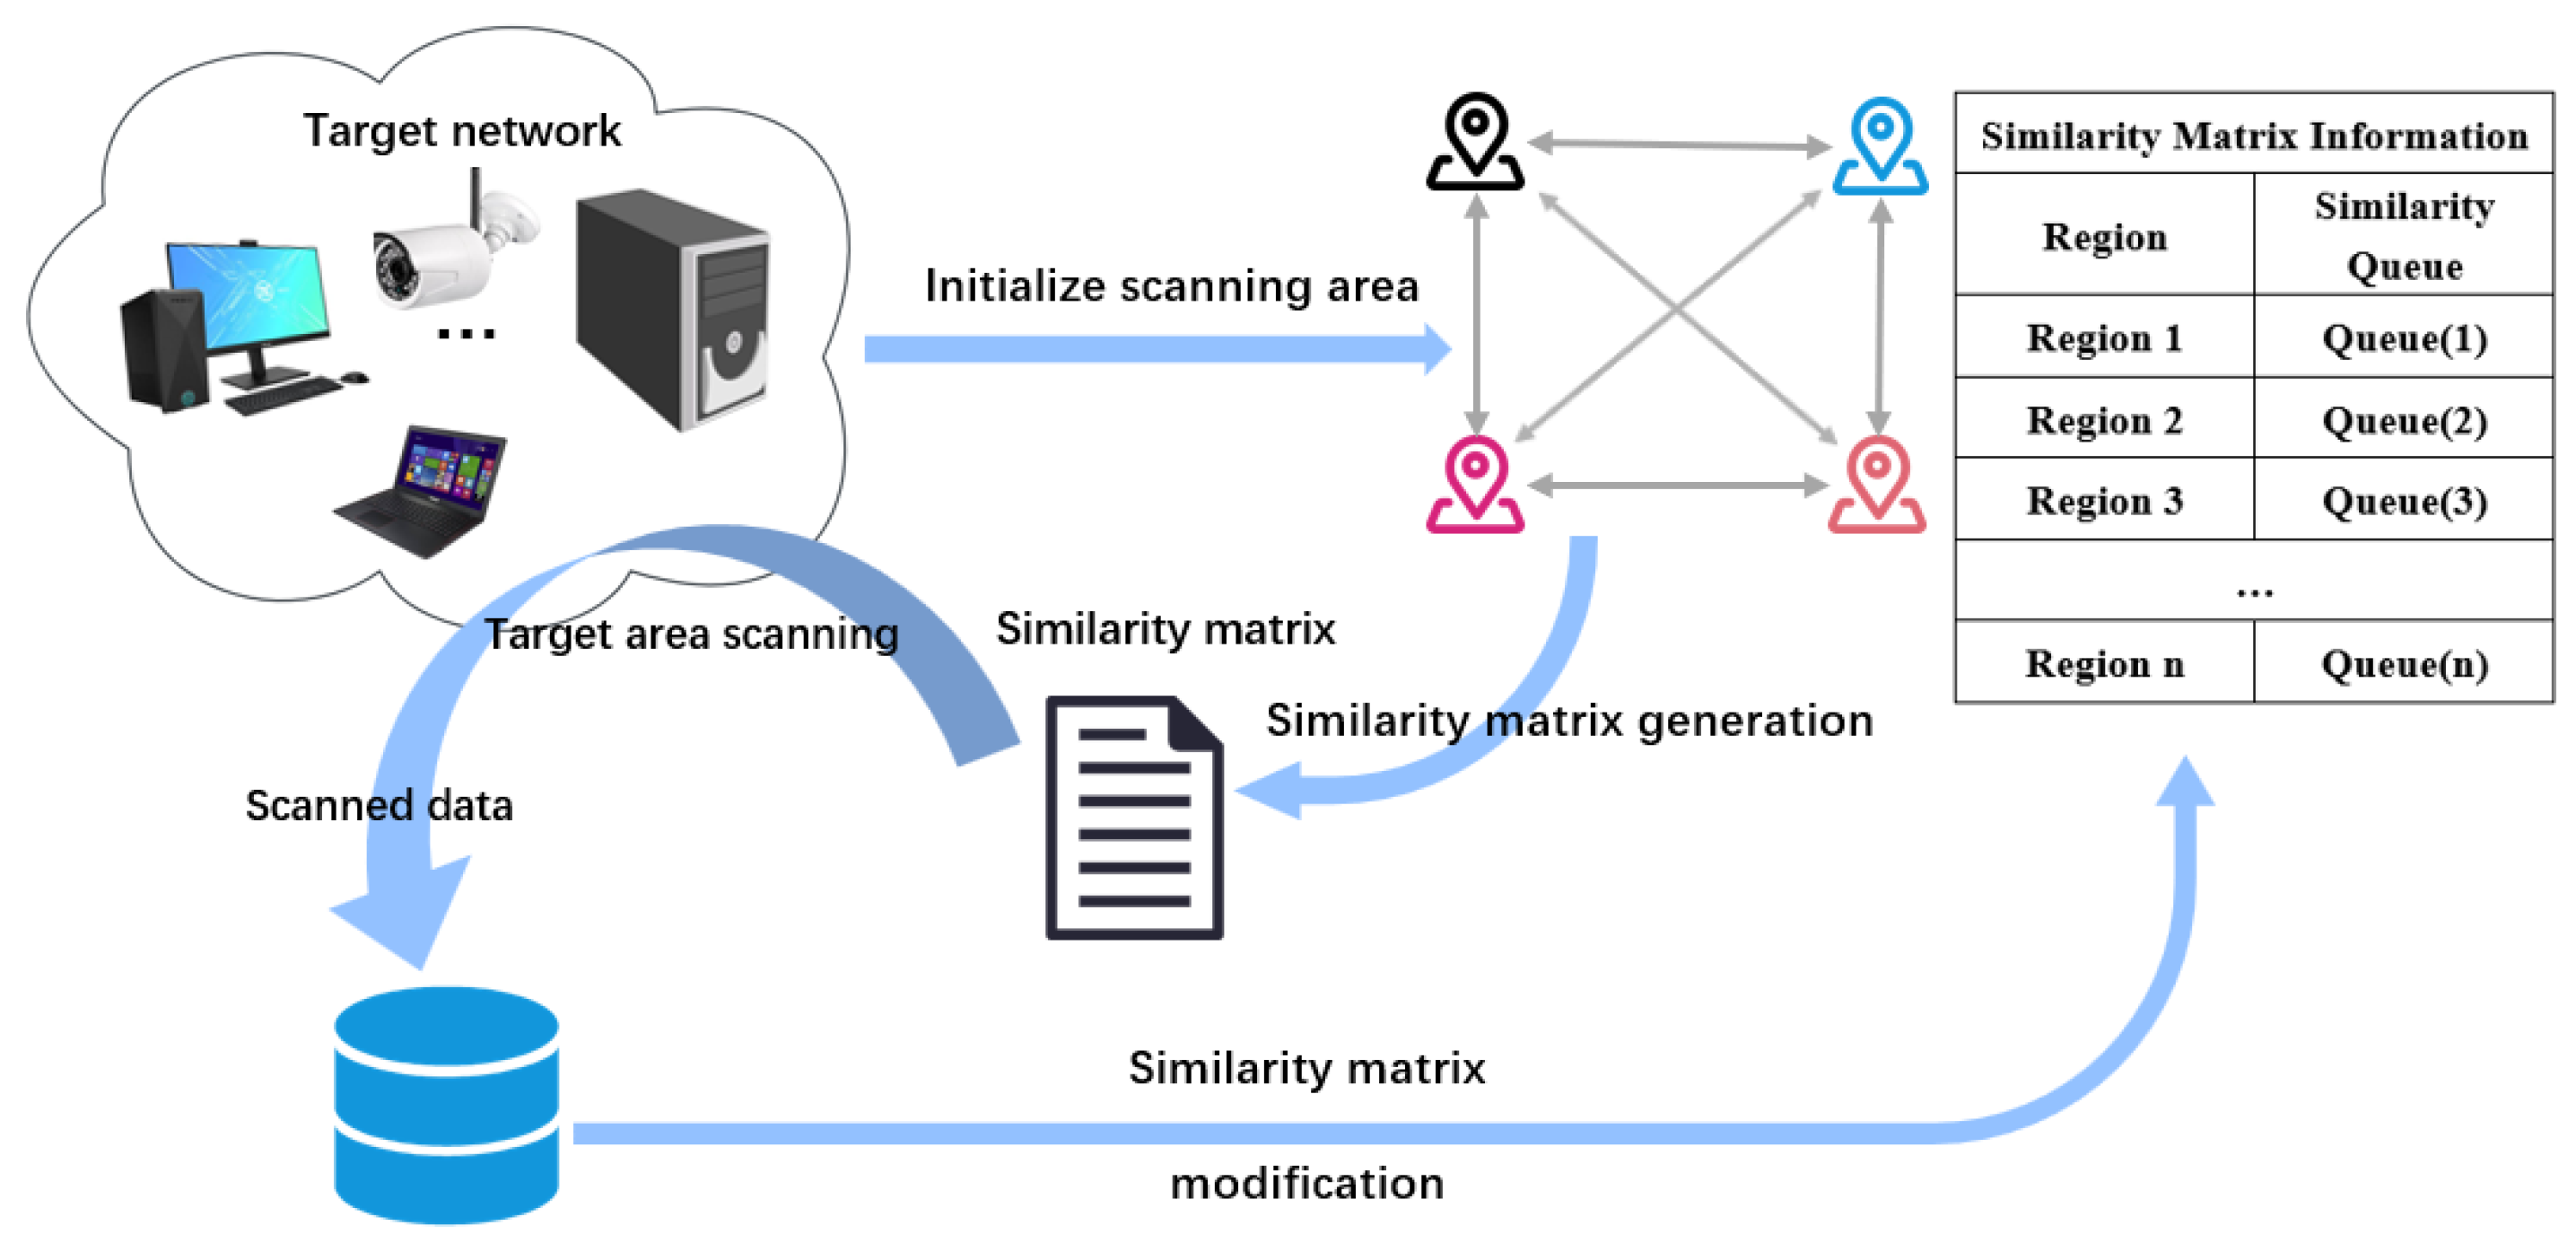
Figure 4.
Constructing the Similarity Matrix:(a)Average time for similarity matrix scanning;(b)Storage structure of the similarity matrix.
Figure 4.
Constructing the Similarity Matrix:(a)Average time for similarity matrix scanning;(b)Storage structure of the similarity matrix.
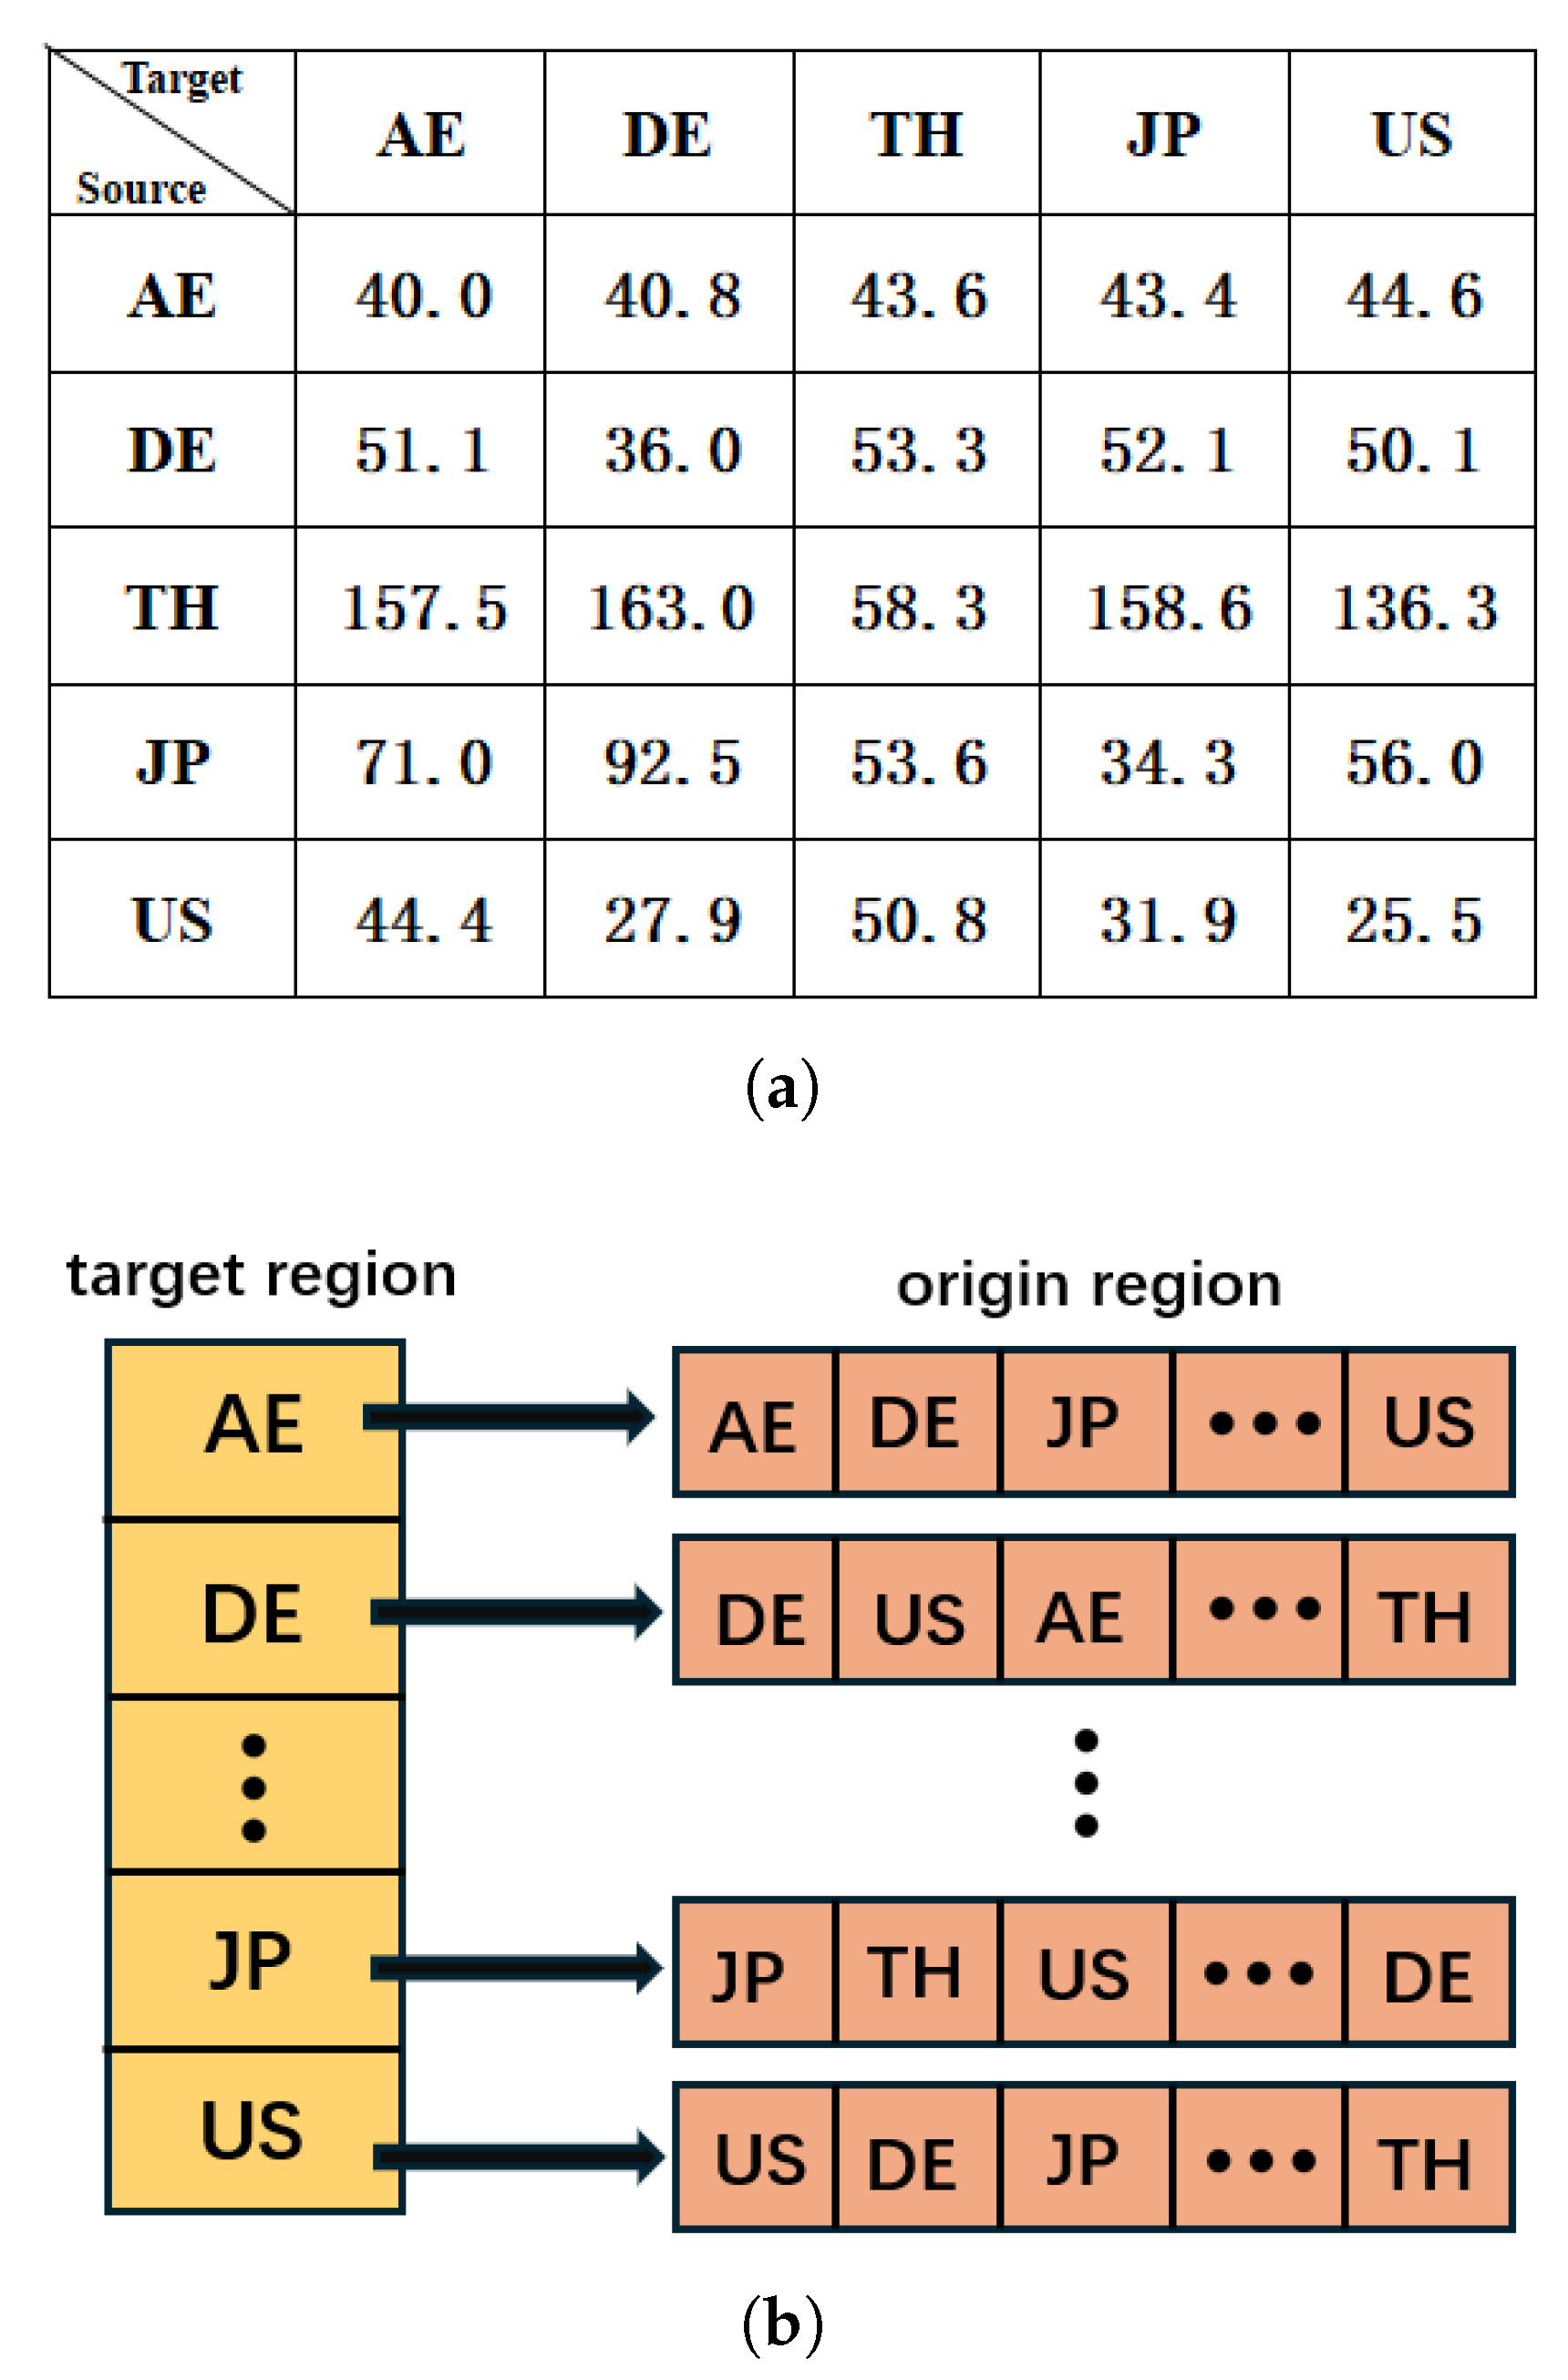
Figure 5.
The Average scanning time of different numbers of IP network segments using the location-aware model and random scanning approach:(a)Average scan time for five scan clusters;(b)Average scan time for ten scan clusters;(c)Average scan time for twenty scan clusters;(d)Average scan time for thirty scan clusters.
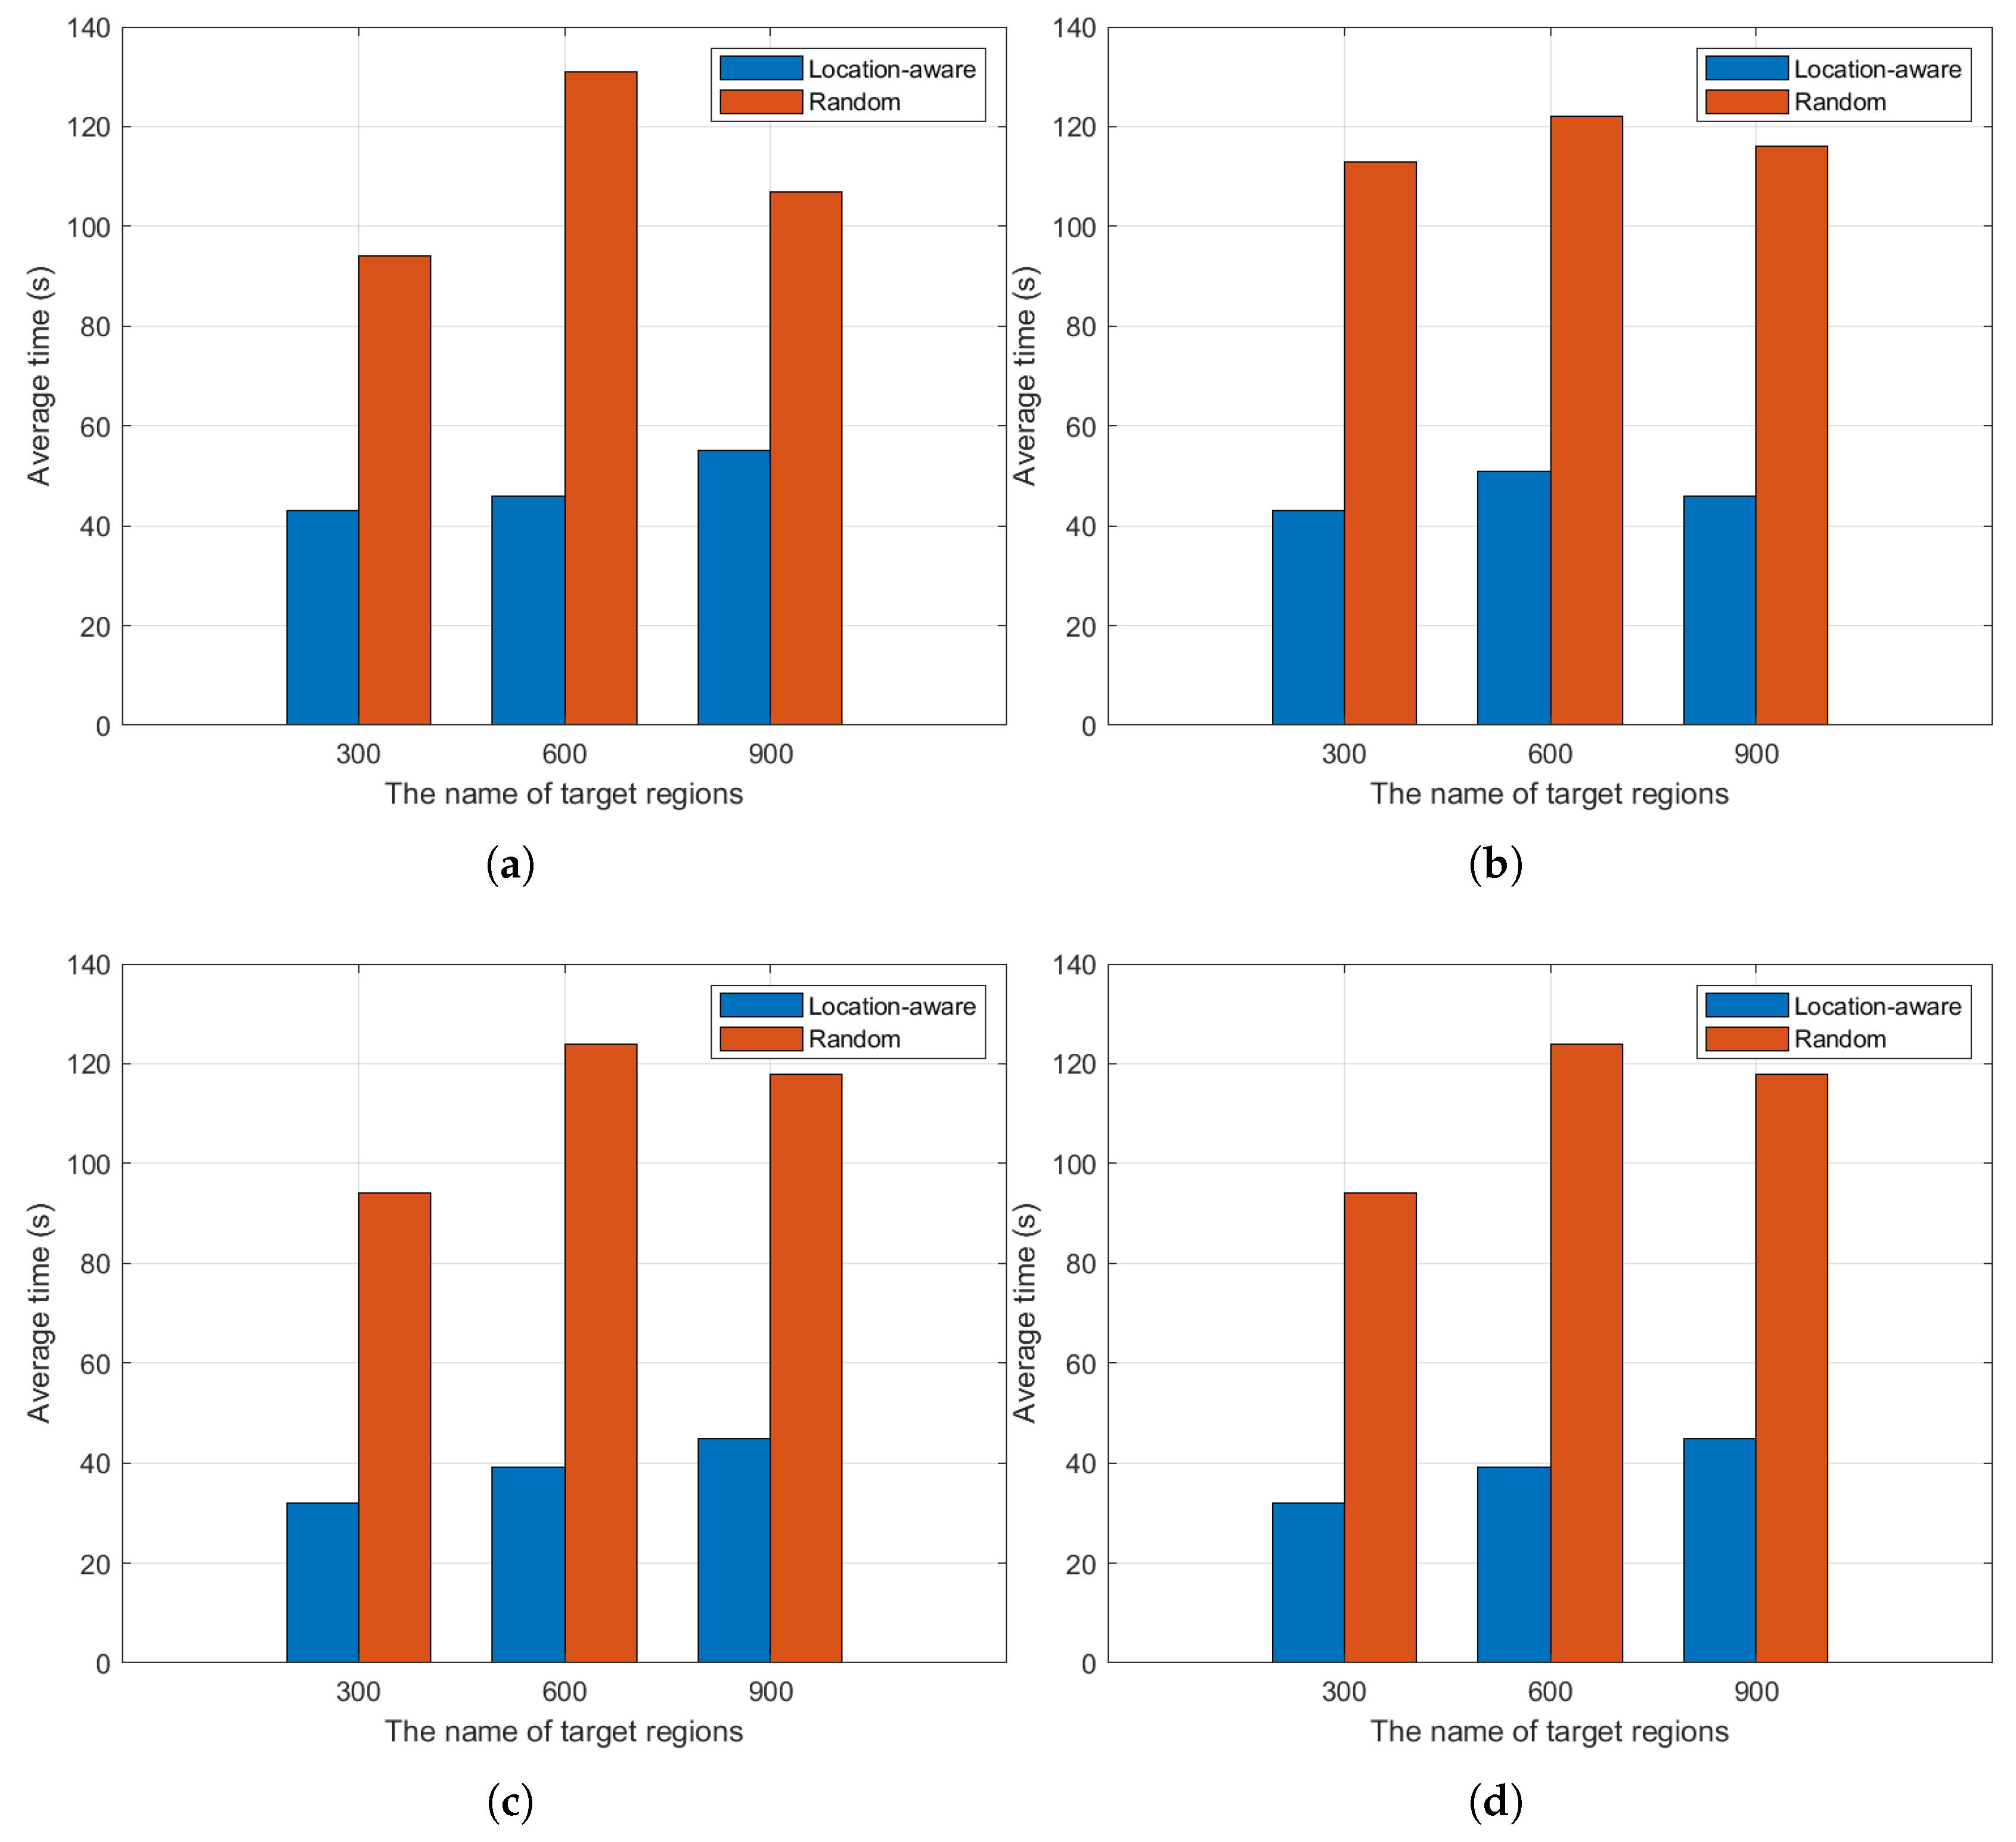
Figure 6.
Verification of load balancing:(a)Time used for cluster scanning;(b)Time used for scanning nodes in cluster DE;(c)Time used for scanning nodes in cluster DE;(d))Time used for some scanners in random scanning methods.
Figure 6.
Verification of load balancing:(a)Time used for cluster scanning;(b)Time used for scanning nodes in cluster DE;(c)Time used for scanning nodes in cluster DE;(d))Time used for some scanners in random scanning methods.
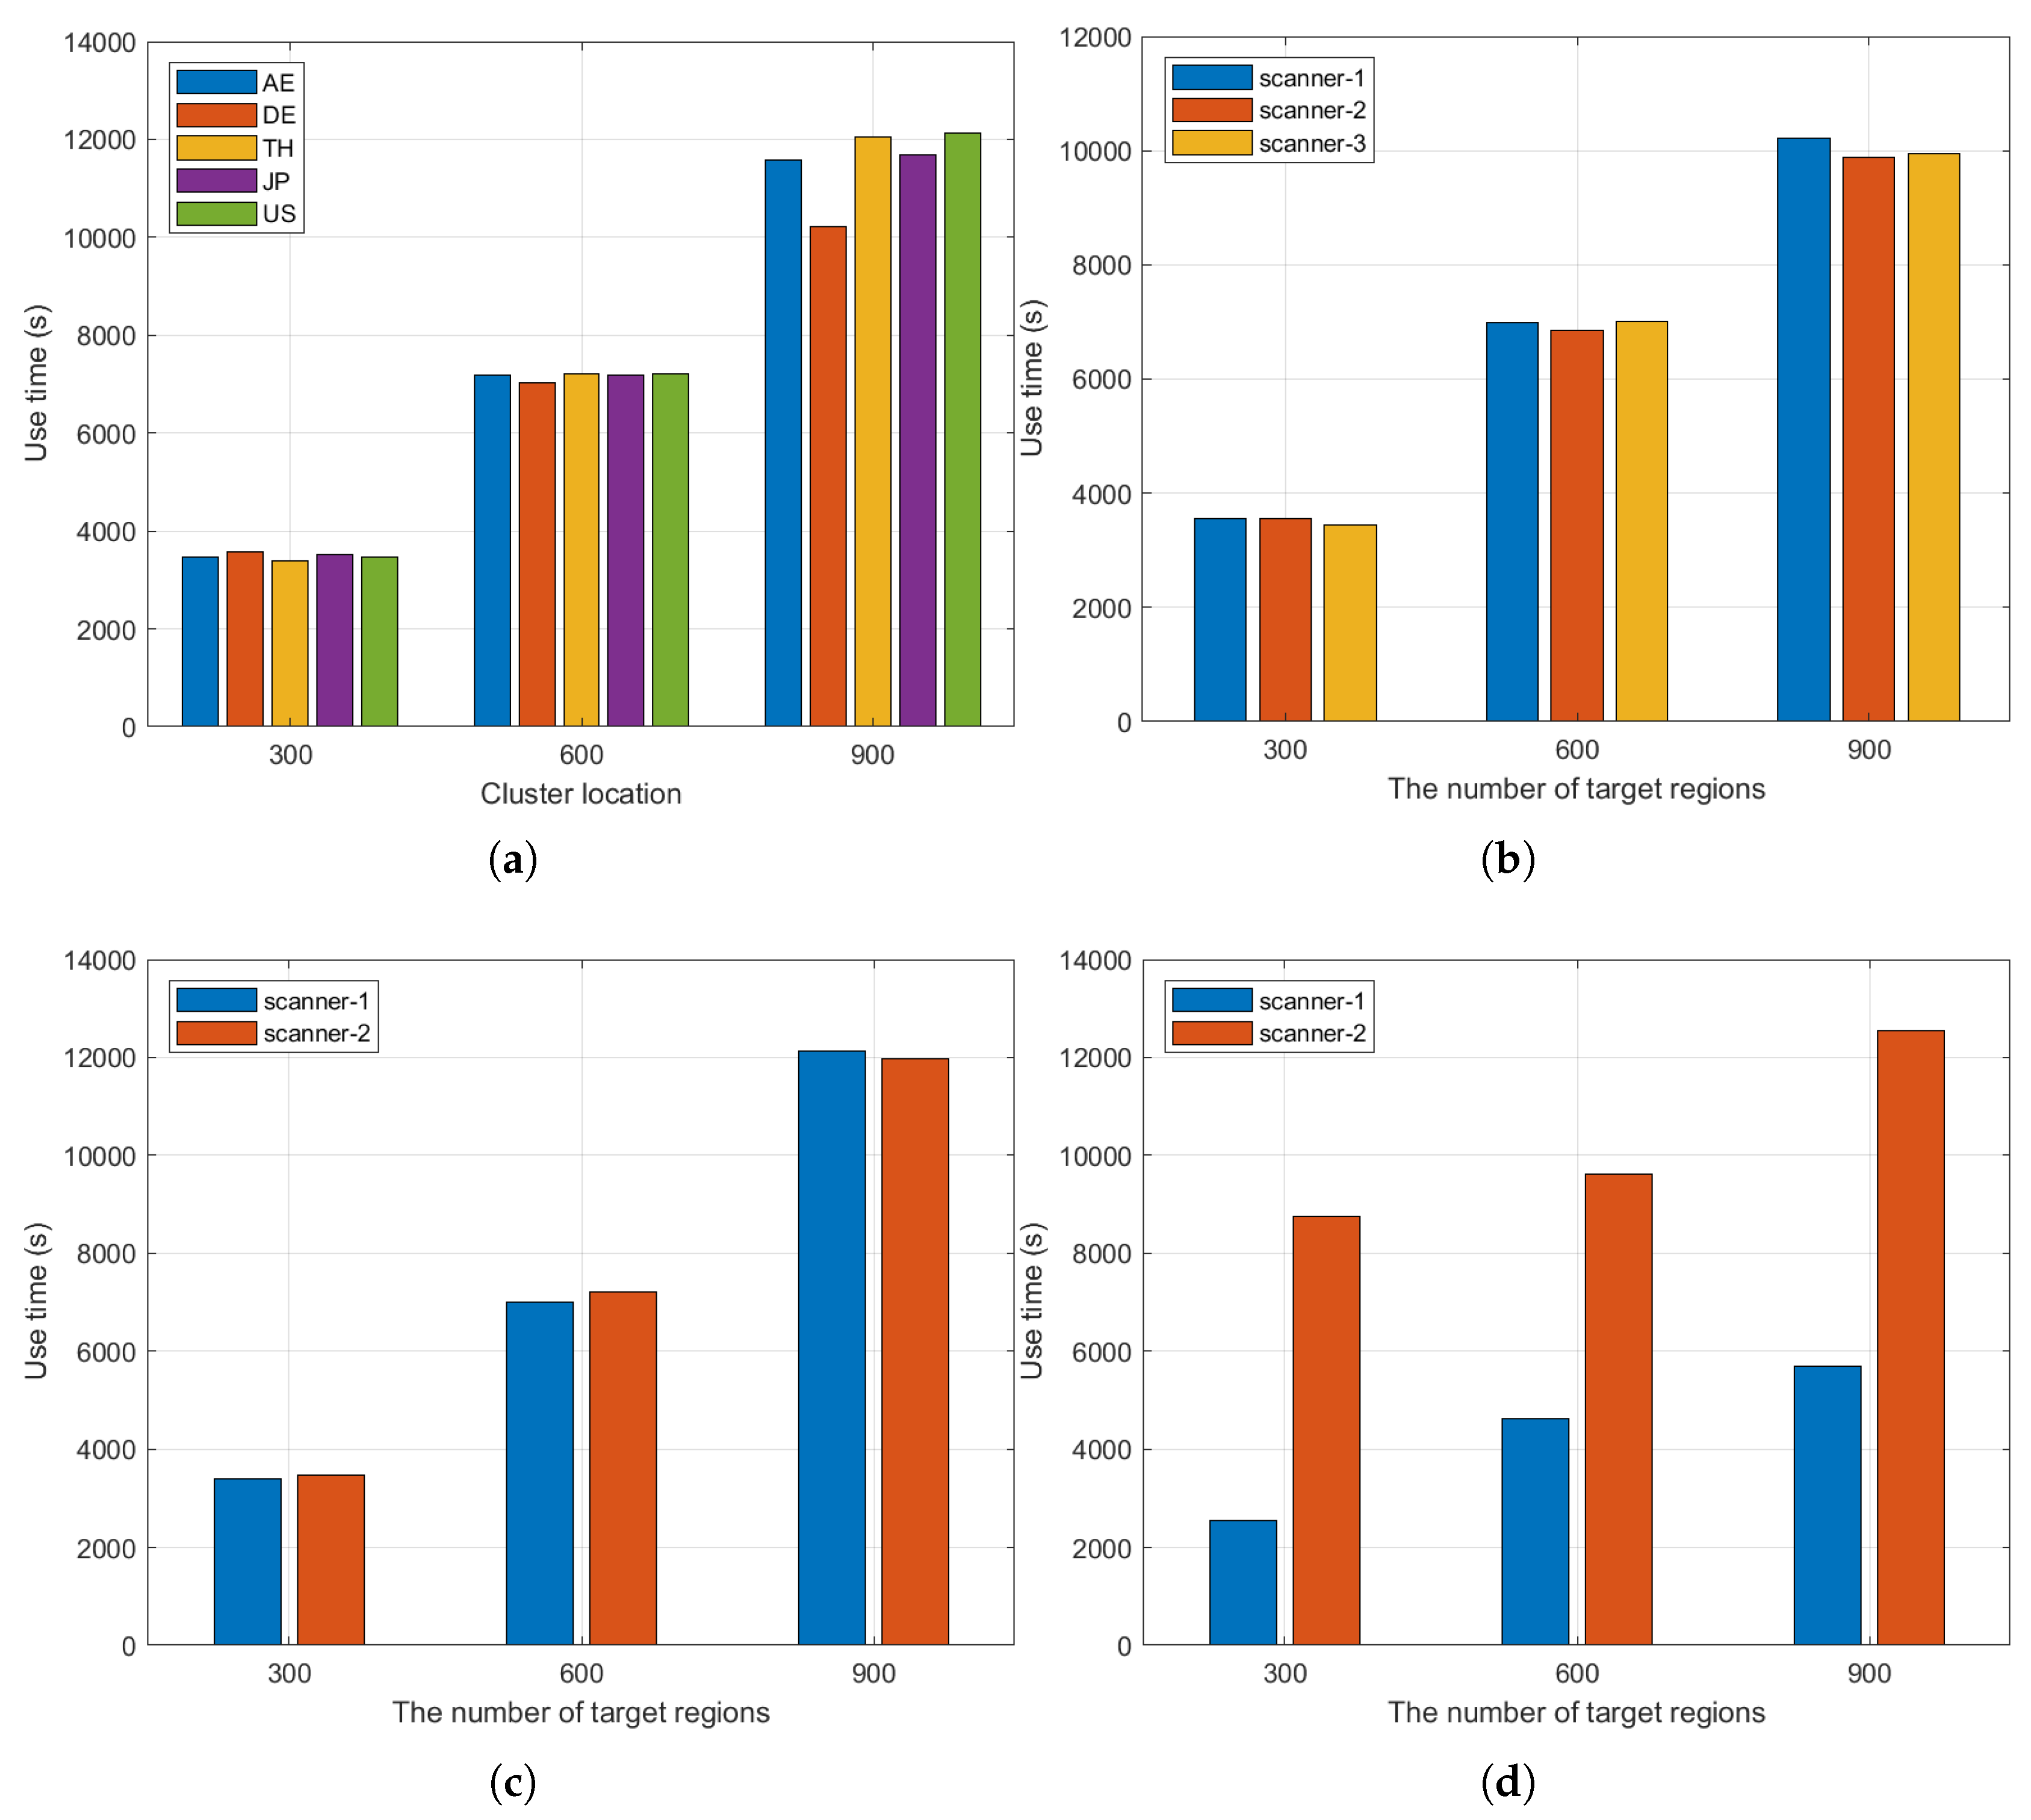
Figure 7.
Impact of scanner clusters and the number of target areas in coverage:(a)Scan coverage of five scan clusters;(b)Scan coverage of ten scan clusters;(c)Scan coverage of twenty scan clusters;(d)Scan coverage of thirty scan clusters.
Figure 7.
Impact of scanner clusters and the number of target areas in coverage:(a)Scan coverage of five scan clusters;(b)Scan coverage of ten scan clusters;(c)Scan coverage of twenty scan clusters;(d)Scan coverage of thirty scan clusters.
Disclaimer/Publisher’s Note: The statements, opinions and data contained in all publications are solely those of the individual author(s) and contributor(s) and not of MDPI and/or the editor(s). MDPI and/or the editor(s) disclaim responsibility for any injury to people or property resulting from any ideas, methods, instructions or products referred to in the content. |
© 2025 by the authors. Licensee MDPI, Basel, Switzerland. This article is an open access article distributed under the terms and conditions of the Creative Commons Attribution (CC BY) license (http://creativecommons.org/licenses/by/4.0/).
Copyright: This open access article is published under a Creative Commons CC BY 4.0 license, which permit the free download, distribution, and reuse, provided that the author and preprint are cited in any reuse.


