
Submitted:
03 July 2025
Posted:
04 July 2025
You are already at the latest version
Abstract
Rodent damage significantly affects agriculture around the world. Rodenticides sometimes can control pests but are costly, can cause secondary poisoning to nontarget wildlife, and may become less efficient over time due to bait shyness and resistance. Using wildlife as biological pest control agents, particularly barn owls (Tyto alba), has been suggested as an alternative. Barn owl nest boxes and hunting perches have been added to increase predator pressure, yet few studies have examined their effectiveness. We conducted a field study in forty-five 10x10 m² plots to compare three treatments (biological pest control by adding hunting perches, 1080 rodenticide, and control) on rodent (vole) activity and crop health (alfalfa, Medicago sativa) using unmanned aerial system (UAS) remote sensing and ground surveys. Additionally, we used 24/7 video cameras and a machine learning (YOLOv5) object detection algorithm to determine whether hunting perches increase the presence of diurnal and nocturnal raptors. Rodent activity increased during the study and did not vary among the treatments across all three treatment groups, indicating that the both the biological pest control and rodenticides did not prevent the rodent population from increasing. Moreover, the vegetation indices clearly show that the alfalfa has become increasingly damaged over time, due to rising damage caused by rodents. There were significantly more raptors in plots with hunting perches than control plots and those treated with rodenticides. Specifically, barn owls and diurnal raptors (mainly black-shouldered kites) spent 97.92% more time on hunting perch plots than rodenticide plots and 97.61% more time on hunting perch plots than control plots. The number of barn owls was positively related to vole activity, whereas the number of black-shouldered kites was unrelated to voles. Even though hunting perches effectively increased the presence and activity of diurnal and nocturnal raptors, rodent populations increased. Future research should investigate whether hunting perches can improve raptor populations and crop health in crops other than alfalfa, which is known as a particularly difficult crop to control voles in.
Keywords:
rodent control
; barn owl (Tyto alba)
; hunting perches
; biological pest management
; machine learning (YOLOv5)
; unmanned aerial systems (UAS)
; predatory pressure
1. Introduction
Meeting the rising demand for agricultural produce requires both agricultural expansion and intensified production, which pose severe threats to biodiversity. Forty percent of the world's land is used for agriculture, and pesticide use has serious effects on wildlife and nearby ecosystems [1,2,3,4]. Crop yield is influenced by a variety of factors, including weather, soil, topography, and agricultural practices such as fertilizers and irrigation [5,6,7]. Furthermore, crop yield is also affected by biotic factors, including pests (i.e., insects, snails, rodents) and diseases [8,9,10].
Controlling rodents is difficult because it is labor-intensive, expensive, and multiple treatments are needed to be effective. Rodenticides can be highly effective [11], but they sometimes lose their efficiency over time as rodents develop resistance and bait aversion [12]. Rodenticides can have detrimental effects through secondary poisoning of non-target wildlife species such as birds of prey, mammals, and amphibians [13,14,15].
The rise in recognition of ecosystem services [16], heightened concern over impacts of chemical pesticides [17], and the recognition of the importance of sustainable agriculture for both biological conservation and human well-being has renewed interest in the role of natural enemies as agents of biological control in agriculture in integrated pest control [18]. Specifically, barn owls (Tyto alba) are also widely used in biological control projects of rodents in Israel [19,20], the USA [21,22,23,24,25,26], along with some other countries such as Greece, Cyprus, and Jordan [27]. In addition to barn owls, diurnal raptor populations, such as common kestrel (Falco tinnunculus), can also be increased in specific fields by adding nest boxes [28,29,30,31,32]. The use of barn owl nest boxes in Israel was first introduced in the Israel Hula Valley in the 1960s and has since spread. Today, the use is widespread, with a positive outlook among most farmers [20]. The use of barn owl nesting boxes is considered cheaper than trapping at low rodent densities; however, the former is not as efficient as the latter at high rodent densities [33]. Additionally, it remains uncertain whether rodents are affected by the addition of barn owl nest boxes [34] and/ or the presence of the owls in specific fields.
Raptors such as barn owls, common kestrels, and black-shouldered kites (Elanus caeruleus)) use different techniques in search of prey, such as flight, hovering, and perching (also known as sitting and waiting). Predation success and hunting methods may be limited by the availability of hunting perches [28]. Even though raptors can hunt by flight or hovering over fields without perches, it is energetically more costly than from perches. Although artificial hunting has been added to increase raptor presence [35,36,37,38,39,40,41,42,43], its effectiveness remains uncertain because most studies lack control plots and use monitoring camera devices with limitations. One of the difficulties is the mythology used in monitoring hunting perches, mainly using human observation and camera traps. Determining the presence of raptors using human observations [32,35,38,39,40,44] is limited mainly to diurnal birds of prey because of limited visibility at night, and the presence of humans may affect or even reduce raptor activity [45].
Camera traps are used [36,41,43,46] as an alternative to human observation but were designed to monitor mainly large game mammals and rely on motion or heat triggers, which are often not sensitive enough to detect birds, which are smaller and faster than mammals. Even in cases where the motion/heat trigger detects birds, the birds may not be filmed because most cameras' triggers have a delay, so flying birds may be missed altogether and may no longer be near the camera. In addition to the limitations of the trigger mechanisms, most cameras either capture still images or videos of a specific length, making it impossible to determine the duration of perch use and overall raptor activity. Using 24/7 video surveillance cameras will provide continuous coverage both day and night.
The impact of adding hunting perches on rodent populations and crop yields remains unclear. A study in the Pacific Northwest, USA, found no significant effect of adding hunting perches on hunting pressure on the rodent population [35]. In another study, an experiment using an enclosure plot found that although raptors showed a clear preference for plots with perches, their presence did not affect the vole populations [39]. Kestrel visitation increased 11-fold in another study [40] in plots with artificial perches compared to control plots. Although the vole population size, growth rate, and adult survival were similar, juvenile recruitment was lower, and the proportion of reproductive females was reduced in plots with artificial perches compared to controls plots. In the Czech Republic, a study based on human observations found that diurnal raptor density was higher in fields with artificial perches but did not find any effect on rodent abundance [47]. Lastly, the question of whether the increased presence of raptors affects crop yield and health remains critical. Even though hunting perches were found to have reduced mouse population growth rate and density compared to control plots, crop damage was similar [38]. There is a need for studies that monitor artificial perch use in conjunction with 24/7 video cameras, rodent activity, and crop yield and health.
In addition to determining raptor presence and rodent activity, it is important to assess vegetation health to monitor rodent damage. Small unmanned aerial systems (UAS) have been used recently in precision agriculture and wildlife surveys [48]. UAS, has been used to determine crop biomass/ yield [49] and pest damage [50,51]. Using remote sensing from UAS data can also be used for rodent damage [52,53] and rodent burrow detection [54]. Using UAS, studies have found negative relationships between rodent populations and crop health and positive relationships between the number of burrows and rodent activity (Keshet et al., 2022; Plaza et al., 2022).
We studied whether adding biological rodent control by adding hunting perches affects rodent activity and vegetation health compared to rodenticides and control plots. We hypothesized that the plots with hunting perches and those with rodenticides would similarly negatively impact rodent activity while positively affecting vegetation compared to the control plots. The second goal was to determine if hunting perches could increase the presence of diurnal and nocturnal raptors. We hypothesized that hunting perches would significantly increase both the presence and duration of stay for diurnal and nocturnal raptors.
2. Materials and Methods
2.1. Study Area
The study occurred in four alfalfa (Medicago sativa) fields (mean= 29.34 ha, range = 17.4- 34.7 ha, Standard Error= 4.13 ha) in the Hula Valley area located in the northeast of Israel (33° 6'15.77"N, 35°36'26.11"E) during the late fall until the early spring (November, 2021-April, 2022). During this period, farmers do not harvest the alfalfa, allowing us to work freely without disturbing agricultural activities. The study area has a large barn owl population with many nest boxes monitored over the years. Between 2012 and 2022, the average number of barn owl pairs was 51 (standard error = 3.1, range = 36-68 pairs) [55].
Alfalfa is a perennial crop mainly used for animal feed, is highly nutrient-dense, and is, therefore, one of the most valuable forage crops [56,57]. In Israel, Günther's vole (Microtus guentheri) is a common rodent pest [52], causing significant damage in various agricultural areas. Alfalfa fields, which are typically expected to yield crops for about five years, are often abandoned prematurely, usually at 2-3 years, because of extensive damage caused by voles.
2.2. Experimental Design
Forty-five, 10 x 10 m plots were established for each of the three treatments (15 plots per treatment): biological pest control (Hunting perches), rodenticides (1080), and controls. After the plots were selected (see below), they were marked by four 0.75 m poles bordered with strings. Each field had an equal number of treatments, and the mean number of plots was 11.25 (standard error = 2.25). Each plot was further divided into five 10 x 2 m strips, delineated by ribbons at the plot's edges, used while counting rodent burrows.
The three treatments were:
- Hunting Perches plots had one T-shaped wooden perch (2.2 m tall, 0.4 m long crossbar) that was positioned at a distance of 5.65 m from the south side of the plot, allowing the raptors a place to stand (Figure 1). Each perch was situated at least 100 meters to the nearest neighboring plot, which is large enough to reduce visibility for both raptor [58] and vole home ranges [59]. There were also no natural or other manmade structures that raptors could use for perches within the areas.
- 1080 (Rodenticide) plots received a treatment of 30g of 0.05% Sodium fluoroacetate (mixed into a wheat bait) (known as Rosh80 or 1080). 1080 rodenticide was uniformly dispersed across the plots during two applications. The 1st application was made after data collection in session 1, and 2nd application was added ten days later. 1080 is the only rodenticide legally permitted for use in open agriculture in Israel and has been used with the same bait for 28 years [60]. It is highly toxic to wildlife and humans, and no known antidote exists. [60,61].
- Control plots had no treatment applied.
2.3. Treatments Plot Selection
2.3.1. Imaging of Fields
The goal was to determine that there were no differences in the vegetation index and rodent activity at the start of the study. The four fields were imaged using a DJI Phantom 4 Pro using Pix4Dcapture software at an altitude of 75 m (GSD of approximately 1.94 cm/px), 80% overlap, and a camera angle of 80º during November 2021. Five-eight ground control points (GCPs) were marked in each field, and coordinates were measured using a Zenith 15 & 25 Pro Series GNSS (~4 cm accuracy). White calibration panels were placed on the ground to normalize the pixel values. Spectral data was collected using an OceanOptics USB4000 350-1100nm spectrometer, with a spectral resolution of 0.5 nm, and OceanView 1.6.7 software was used to calibrate the UAS data. The spectrometer underwent calibration using a white calibration panel.
2.3.2. Pre-Processing
The images, including 5-8 GCPs, were processed using the structure from motion (SfM) method (Boon, Greenfield and Tesfamichael, 2016), in Pix4D Mapper Pro (v. 4.3.31), producing orthophoto, DSM, and 3D models.
2.3.3. Calculating Vegetation Indices
The orthophoto results were normalized using the white calibration boards' pixels' values and their spectral signature collected [52]. The orthophotos were masked to include only vegetation using a biomass index (green-blue/2-red/2 where each pixel in a normal RGB image receives a value for the biomass index ranging from 0 to 70 mg biomass per gram of dry matter) and a threshold to get the plant cover [62]. These results were then oversampled to 18 wavelengths and calibrated using the empirical line (EL) method and the spectral signature collected from the alfalfa crop. Lastly, three vegetation indices (NDVI, PRI, and SIPI) were calculated in addition to the vegetation cover percentage calculated using the aforementioned mask using ENVI Classic 5.1 software and later implemented with Python 3. PRI and SIPI are used as an index of vegetation health monitoring (NV5 Geospatial SolutionsExelis Visual Information Solutions, 20152025)
2.3.4. Rodent Burrow Count
2.3.5. Selection of Potential Plots and Statistical Analysis
Candidate plots were chosen so that there was a minimum distance of 75 m between each other and 100 m from potential perches, such as trees, tall fences, and sprinklers. Similarly, hunting-perch plots were chosen to ensure a minimum distance of 100 m from the nearest neighboring plot. No significant differences existed in the number of rodent burrows and NDVI among the 45 plots of the three treatment types (Table 1).
2.4. Data Collection
All 45 experimental plots (15 plots per treatment type) were measured using 1) an Unmanned Aerial System (UAS) for imaging to assess vegetation indices, 2) Rodent burrow surveys to quantify rodent activity, and 3) 24/7 video cameras to monitor both nocturnal and diurnal raptor presence and perch utilization during three sessions: (session 1) mid-January to early February, (session 2) mid-February to early March, and (session 3) mid-March to early April.
2.4.1. Imaging of Plots
UAS imaging was conducted before burrow surveys to ensure that the disturbance on the alfalfa caused by a person did not affect the latter. Plots were imaged using a DJI Phantom 4 Pro using Pix4Dcapture software at an altitude of 30m (GSD of approximately 0.82 cm/px), as written above. The images, including 5 GCPs (Ground Control Points), were processed using the structure from motion (SfM) method [64], in Pix4D Mapper Pro (v. 4.3.31), producing orthophoto, DSM, and 3D models. Calculating Vegetation Indices: The orthophoto results were normalize using the white calibration board as described in the Vegetation Indices part of the “Treatments Plot Selection” section.

Table 2.
Description of the three vegetation indices used in this study.
| Vegetation Index | Equation | Description | Source |
| NDVI (Normalized Difference Vegetation Index) | Measures the presence and health of vegetation in an area. | [65] | |
| PRI (Photochemical Reflectance Index) | Measures sensitive to changes in carotenoid pigments in live foliage, which are indicative of photosynthetic efficiency. Drops indicate increased canopy stress. | [66] | |
| SIPI (Structure Insensitive Pigment Index) | Measures leaf pigment concentrations normalized for variations in overall canopy structure and foliage content. Increases in SIPI indicate increased canopy stress. | [67] |
2.4.2. Rodent Burrow Count and Alfalfa cover Estimation
The renewal rate of rodent burrows was determined. In each plot, all rodent burrows were counted, covered gently with soil, and then recounted two days later. The percentage of alfalfa cover (alfalfa/(alfalfa+weeds)) during the rodent burrow during the first 2 sessions but not the 3rd session.
2.4.3. Video Cameras
We added a surveillance solar camera system consists of two 12V 22AH/20HR batteries housed in a plastic box with a stand, a 1m metal pole, a 1.2 m wooden pole, a solar charge controller (rated voltage: 12V/24V), a 30W solar panel (35 x 65 cm), an Exir Mini Bullet surveillance camera (Model: DS-2CD2021G1 4mm B, Hikvision), a 128 GB Sandisk Ultra memory card, and a flexible multicore cable (3182Y, H05VV-F, unscreened, 2 core, 1.5 mm²) [68]. The camera setup was added at an 8 m distance from the plots’ south side and set to view the edge of the fields in 8 control plots, 13 hunting perch plots, and 11 rodenticide plots. Pigeon spikes and solar panels were added to the camera to prevent birds from using the camera as a perch. RGB footage was captured during the day, and infrared (IR) imaging was recorded at night for 48 hours.
2.5. Processing Video Camera Footage
Video footage from field cameras was analyzed to determine the presence and time spent by diurnal and nocturnal raptors. The raptors' behavior was categorized as flying (the act of moving through the air using wings), hovering (remaining stationary in the air by flapping wings quickly), or perching (hunting, resting, or sitting on an elevated surface). Manual assessment of videos (viewing the full videos) is very time-consuming, so we developed a “semi-automatic” method to analyze the videos. Object detection algorithms were first applied to detect birds in each frame of the video, and then the objects in consecutive frames were re-identified to become a track/event, which was automatically then manually filtered, with the behavior and species determined (Figure 2).
2.5.1. Step 1: Detection of Birds per Frame
Analysis of daytime videos (RGB) was conducted using machine learning with the YOLOV5 network, which was pre-trained on the MS-COCO dataset (Redmon, Divvala, Girshick, & Farhadi, 2016; Redmon & Farhadi, 2017) and trained with 850 bird-labeled images from videos of randomly selected plots and dates, and validated with 500 images. The resulting model had a recall of 0.7 and a precision of 0.5 and was used to detect birds in videos, displaying a bounding box with its confidence level. Nighttime videos were captured using IR sensors for which we had no available pre-trained network. Since there was less noise at night, bird objects were detected using change detection and morphological image processing tools
2.5.2. Step 2: Object Tracking
After each frame, bird object predictions were estimated, and object tracking was done based on the distance between bounding boxes in consecutive frames, size differences, and trajectory. Several blank frames in the tracks were tolerated to prevent false negatives from the previous step from splitting the tracks due to the low recall. The resulting object tracks were then filtered based on mean bounding box size, average confidence level, track duration, and number of frames with the object.
For each of the filtered tracks, the system generated a table with event attributes (plot information, start and end times) and two other output files: 1. Composite Frame Analysis File (Figure 1): Contains nine images arranged as follows: First three frames of the detected event, middle three frames of the detected event, and last three frames of the detected event. This includes two rows of extra screenshots showing the start and finish of the detected event. 2. Trajectory Visualization File (Figure 3) demonstrates objects' complete trajectory by overlapping their bounding boxes' positions in each event frame, using the first frame as the background.
2.5.3. Step 3: Manual Review
The two output files were reviewed to detect false positives and non-raptor speciefor removal (see examples in Figure 4), identify raptor species, and classify the raptors' behavior.
2.5.4. Step 4 Validation
This semi-automatic method was validated on 20 hours of day videos and 22.5 hours of night videos, sampled from randomly chosen plots from alfalfa fields and dates with a total of 88 events (Table 3).
2.6. Statistical Analysis
All test were done using IBM SPSS Statistics 23 software. We used Kruskal-Wallis Chi- Square test to determine whether there was a difference in the number of burrows and NDVI in between different treatments. We used a Generalized Linear Mixed Model (GLMM) with Poison and Gamma distributions and log-linked function to determine whether the number of burrows counted and VIs measured varied across sections and in the treatment types with field as a random variable in order to avoid pseudoreplication. We used pairwise contrasts with the least significant difference (LSD) to test for differences between treatment types. We used a similar model to determine whether the number of events caught on the cameras varied in the treatment types and whether it was related to the number of rodent burrows. Model diagnostics were performed, including checks for overdispersion and visual inspection of residuals to assess model fit. These steps revealed no significant violations of model assumptions.
3. Results
3.1. Treatments' Effect on Vole Activity and Alfalfa Health
We used a Generalized Linear Mixed Model (GLMM) with a Poisson distribution and a log link function, including field as a random effect, for the following analyses. In a GLMM (F4,130= 64.41, P< 0.001) to compare the three treatments (hunting perch, rodenticide, and control plots) and the three sessions, there was significant variability in the number of burrows between the sessions (F2,130= 126.82, P< 0.001) (Figure 5a), with an increase in rodent burrows over the season. In contrast, there was no significant difference in the number of rodent burrows between the treatments (F2,130= 2.0, P = 0.14).
The percentage of alfalfa plant cover varied between the first and second sessions and treatments (F₃,₈₃ = 4.56, P = 0.005). Specifically, the percentage of alfalfa plant cover showed significant differences between the sessions (F₂,₈₃ = 4.14, P < 0.05), indicating a decrease over the season (Figure 5b). Likewise, there was a difference between the treatments (F₁,₈₃ = 5.28, P < 0.05), with marginally more alfalfa plant cover found in the perch plots compared to the control (P = 0.058) and rodenticide plots (P = 0.075).
The PRI index was analyzed during the three sessions and treatments (F4,115= 10.39, P< 0.001). Specifically, the PRI showed significant differences between the sessions (F2,115= 19.70, P< 0.001), indicating a decrease over the season (Figure 5c). However, there was no significant difference in the PRI between the treatments (F2,115= 1.01, P = 0.34).
The SIPI index was analyzed in the three sessions and treatments (F4,115= 10.34, P< 0.001). Specifically, the SIPI showed significant differences between the sessions (F2,115= 20.60, P< 0.001), indicating an increase over the season (Figure 5d), meaning a decrease in vegetation health. However, there was no significant difference in the SIPI between the treatments (F2,115= 0.08, P = 0.92).
The NDVI index was analyzed during the three sessions and treatments (F4,115= 10.37, P< 0.001). Specifically, the NDVI showed significant differences between the sessions (F2,115= 20.07, P< 0.001), indicating a decrease over the season (Figure 5e). However, there was no significant difference in the NDVI between the treatments (F2,115= 0.07, P = 0.55).
3.2. Perch Use
The 13 cameras in hunting perch plots recorded 318 events involving raptors using the perches over 624 hours (mean = 24.5 events, SE = 4.6 events, 0.51 events per hour), with raptors using the perches for 25.3 hours of the video (mean = 1.9 hours, SE = 0.4 hours).
3.3. Comparison of the Number of Perching Events Between the Treatments
Using a GLMM with Poison distribution and log-linked function and field as a random variable (F2,28= 32.55, P < 0.001), the number of times raptors were present varied across the treatments (F2,28= 33.34, P < 0.001) and was positively related to the number of rodent burrows (F1,28= 13.24, P = 0.001). Specifically, using a pairwise contrast with the least significant difference (LSD) adjusted significance level, the number of raptors that used plots with hunting perches was greater than the number in the rodenticide plots (P < 0.001) and the control plots (P < 0.001). The number of raptor events for hunting perch plots was 54.5% of the total number of events, the rodenticide plots were 27.7%, and the control was 17.8%.
Using a similar GLMM (F3,28= 46.82, P < 0.001), we found that the number of barn owls varied between treatments (F2,28= 47.43, P < 0.001) (Figure 11) and was positively related to the number of rodent burrows (F1,28= 18.49, P < 0.001) (Figure 15). Specifically, using a pairwise contrasts with the least significant difference (LSD) adjusted significance level, the number barn owls that used plots with hunting perches (mean= 16.5 events, SE= 4.7) more than the rodenticide (mean= 3.8 events, SE= 1.6) (P < 0.001) and control plots (mean= 3.3 events, SE= 0.1) (P < 0.001) (Figure 6).
In comparison, using a similar GLMM (F3,28= 13.54, P < 0.001), the number of black-shoulder kite varied between the treatments (F2,28= 19.99, P < 0.001) (Figure 11) but was not related to the number of rodent burrows (F1,28= 2.43, P= 0.13) (Figure 15). Using pairwise contrasts with the least significant difference (LSD) adjusted significance level, the number of black-shouldered kites only marginally significantly differed among the hunting perch, rodenticides, and control plot types (P > 0.05 < 0.10) (Figure 6).
3.4. Comparison of the Time Spent Between the Treatments
Overall, Raptors spend 97.92% more time on hunting perch plots than on rodenticide plots and 97.61% more time on hunting perch plots than on control plots. Specifically, barn owls spent 99.93% more time on hunting perch plots than on rodenticide plots, and they spent 98.81% more time on hunting perch plots than on control plots. Black-shouldered kites spend 97.61% more time on hunting perch plots than on rodenticide plots, and 98.29% more time on hunting perch plots than control plots (Figure 7.).
Using a GLMM with Gamma distribution and log-linked function and field as a random variable (F3,27= 68.42, P < 0.001), the duration of raptors during treatments varied (F2,28= 98.57, P < 0.001, Table 1) but was not related to the number of rodent burrows (F1,28= 2.05, P = 0.16). Using a pairwise contrasts with the LSD adjusted significance level, the number of barn owls used plots with hunting perches (mean= 121.1 minutes, SE= 26.1) more than the rodenticide (mean= 2.6 minutes, SE= 0.5) (P < 0.001) and control plots (mean= 3.0 minutes, SE= 1.2) (P < 0.001).
In a similar GLMM (F3,24= 54.8, P < 0.001), the duration of barn owls varied between treatments (F2,24= 78.6, P < 0.001, Figure 7) but was only marginally related to the number of rodent burrows (F1,24= 3.8, P = 0.06). Lastly, using a (F3,19= 13.2, P < 0.001), the duration of black shouldered kite varied during treatments (F2,24= 19.6, P < 0.001, Figure 7) but was not related to the number of rodent burrows (F1,19= 1.6, P = 0.22).
3.5. Comparison Between Hunting Strategies in the Treatment Plots
Using a GLMM with field as a random variable, the number of raptors perching varied across the three treatments (F2,29= 22.5, P < 0.001) (Table 4). Specifically, using pairwise contrast with the LSD, the number of raptors perching in the plots with hunting perch was higher than in the rodenticide (P < 0.001) and control plots (P < 0.001). In another GLMM (F2,29= 0.37, P = 0.70), the number of raptors hovering did not vary between treatments. Similarly, the number of raptors flying did not vary between treatments (F2,29= 1.11, P = 0.34).
Using GLMM the duration of raptors perching also varied during treatments (F2,29= 16.4, P < 0.001). Specifically, using pairwise contrasts with the LSD significance level, the number of raptors perching in the hunting perch plots was higher than in the rodenticide (P < 0.001) and control plots (P < 0.001). In another GLMM, with field as a random variable (F2,29= 0.60, P = 0.57), the duration of raptors hovering did not vary between treatments, and similarly, the duration of raptors flying also did not vary between treatments (F2,29= 0.40, P = 0.68).
3.6. The Relationship Between Rodent Burrows and the Duration Raptors Spent
Using GLMM with a Gamma distribution and a log-linked function, and treating the field as a random variable, we examined whether the presence of barn owls and black-shouldered kites was related to rodent activity in the three treatments separately. The duration spent by barn owls increased with the number of rodent burrows in the hunting perch plots (F1,11= 21.72, P = 0.001, Figure 8), but was not in the rodenticide (F1,7= 0.36, P = 0.57) and control plots (F1,4= 218.0, P < 0.001). The duration spent by black-shouldered kites was not related to the number of rodent burrows in the hunting perch (F1,11= 0.08, P = 0.78, Figure 8), rodenticide plots (F1,5= 1.87, P = 0.23) or control plots (F1,11= 2.89, P = 0.34).
4. Discussion
4.1. Treatment Effects on Raptor Activity and Vole Activity in Alfalfa Fields
This study aimed to investigate whether natural predators (biological control agents) can have a similar effect on rodents as rodenticides in alfalfa fields. Surprisingly, the number of burrows was similar across the treatments, but also increased throughout the study period in all three groups. The rise in vole numbers shows that both natural predators and rodenticides failed to control the vole population. In addition to the increase in rodent burrows, the vegetation indices (PRI, SIPI, and NDVI) all indicate that the alfalfa has become more damaged over time. Vegetation indices have been inversely related to both rodent numbers and burrows [52,69]. The increased damage indicates that the treatments were ineffective and are closely linked to rising rodent activity.
One reason we may not have observed any changes in rodent numbers is that we selected alfalfa fields, which are known to be problematic for rodent control, and voles are recognized for causing significant damage to these fields [52,69]. Alfalfa is high in protein, rich in minerals, and easily digestible [70] and may be preferred over bait such as the wheat bait with 1080 used in this study. Furthermore, the rodenticide 1080 has been used in Israel for 29 years with the same bait (wheat) [60,71,72], and there is a possibility that voles have developed bait-shyness. If the voles do not eat the bait, then rodenticides are useless. Furthermore, alfalfa is a perennial plant that is harvested multiple times a year by trimming; it is not plowed, thereby preserving vole burrows [20]. In-depth and extensive research efforts to test different rodenticides and baits are necessary to determine which are more effective and efficient, just like has been done in the USA [73,74,75,76].
Predators may be unable to control the vole population because voles do not need to forage far from their burrows in alfalfa fields. Barn owls are known as small mammal specialists, preying not only on voles [77,78,79] but also reproducing more when the vole population is high [80]. The chances that barn owls did not prey on voles are slim. Vole populations are characterized by high fecundity rates, where individuals can produce multiple litters within a single breeding season [81,82]. There is a high likelihood that the voles could reproduce rapidly, which may allow them to breed more quickly, and the population is larger than the predators that prey on them in crops such as alfalfa.
There is also the possibility that the hunting perches not only affected their plots but also the plots next to them. Ideally, we would have spaced the plots further apart, but this was not possible due to the small size of the fields in Israel compared to those in other countries. We do not believe this is the case because the perches were 2 m high and at least 100 meters from the nearest neighboring plot, which is large enough to reduce visibility for the raptor [58]. While the raptors most likely did not hunt far from the perches, there is the possibility that the raptors would use the perches to rest and hunt by flight in the other plots. Regardless, neither treatment decreased rodent activity nor reduced damage observed in the vegetation indexes.
It is possible that without the treatments, the vole population may have increased more; however, this is unlikely given that both rodent burrow and vegetation indices were similar between the two treatment plots and the control plots. There is a need to determine whether including hunting perches and 1080 rodenticides may be effective in crops other than alfalfa.
4.2. The Use of Hunting Perches
Hunting perches significantly increased the number of visits and the presence of both diurnal and nocturnal raptors compared to the rodenticide and control plots. Two main small mammal specialists utilized hunting perches: the barn owl at night and the black-shouldered kite during the day. We found that the duration that barn owls used the perches was related to vole burrow numbers and activity. In contrast, no such relationship was found in black-shouldered kites, which may be attributed to the voles' being primarily nocturnal [83]. Previous studies have shown artificial perches caused an increase in raptor abundance in the treated plot areas during the day only [35,38,39,40]. In these studies, data collection regarding perch utilization primarily relied on visual surveys, which are limited to the daytime, and the presence of observers during these surveys can potentially influence raptor behavior [45]. Other studies have utilized camera traps that primarily determine presence or absence. However, due to the sensitivity of the triggers, many birds may not be captured on film. [36,37,41,43]. Using 24/7 continuous video recordings allowed us to calculate not only presence and absence during both day and night but also to determine the duration of time perches were used.
An interesting aspect of our study was that we monitored not only perches but also plots without any perches (control and rodenticide plots). This setup allowed us to determine whether the perches increased the presence of diurnal and nocturnal raptors. The plots without perches helped us assess whether there was an increase in the raptors' presence and behaviors. Here, we found that the number and duration of raptors flying and hovering did not vary between the plots with perches and those without. This could be a side effect of the small fields, as the raptors may rest on the perches and then fly over 100 meters to hunt by flight or hover in other plots.
Future studies should aim to not only investigate whether birds of prey use hunting perches but also integrate tracking devices such as GPS [84,85] or reverse GPS [86,87] to determine how exactly the perches enhance hunting efficiency and practices. Hunting perches can potentially be used not only to increase predation but also to decrease prey population by the “ecology of fear” [88,89] in other crop types.
We found that all the perches were utilized, which was consistent with other studies that used camera traps: one conducted in Indiana reported that 82% were used [43], while another in California indicated that 83.3% were utilized [36]. In comparison, when examining perch events per total hours, we found 0.51 in this study compared to much lower figures in Indiana (0.003) [43], California (0.012) [36], and another study in California (0.02) [41]. Since each study collects and analyzes data, comparisons were not always possible. For example, some studies provide the number of photographs taken rather than unique events [37].
We found that perches were used for 4.1% of the total time, which is quite high. While attempts were made to calculate duration using camera traps [41], their efficiency is questionable because the camera trap trigger requires time to reset, which may result in missing events during the initial occurrence and after the trigger has been activated. This variance in perching activity was most likely due to the habitat, as the rodent population is likely higher in alfalfa fields used in this study compared to the habitats of the studies mentioned above. The height of the perch we selected was only 2.2 meters low to prevent raptors from hunting in nearby plots [58]. There is a chance that if we used higher perches, the birds of prey might have utilized them even more.
The higher number of events per hour and the longer use of the perches may be due to having more raptors in the alfalfa fields compared to the other studies, but it may also result from the 24/7 continuous recording cameras. In the other studies, some events may have been missed entirely by observers or trail cameras, as mentioned above, or the increased events found in this study may be due to the detection method. Using a 24/7 continuous recording cameras has many advantages compared to trail cameras for monitoring birds. Continuous video surveillance provides a more accurate representation of raptor presence, as the typical motion tracking triggers used in commercial trail cameras work poorly, especially for fast-flying small animals such as birds. Furthermore, it is impossible to accurately calculate the duration of perching and identify and analyze behaviors such as flying and hovering using trail cams. There are also disadvantages. Recording 24/7 necessitates a much larger system, including a camera, battery, and solar panel (the costs are roughly equivalent). This setup requires more time to install and dismantle, and frequent data card replacements since they fill up quickly and need ample storage. The primary drawback is that analyzing the camera data requires coding knowledge, which can vary across locations. We developed a custom algorithm that was more time-efficient than manually reviewing entire videos; however, it is complex and may not be accessible to individuals without coding knowledge. Also, even though the cost of a solar-powered system is similar to trail cams, it is labor-intensive. As a result, using too many cameras at once is impossible due to the difficulties in setting them up and switching storage cards.
4.3. Numerical and Functional Response
The functional response relates to the change in predation rate with changing prey density and the numerical response is defined as the change in number through immigration and reproductive rate with changing prey density [90,91,92]. In our study, although hunting perches significantly increased both diurnal and nocturnal raptor presence and activity, the vole population continued to grow. The short-term numerical response was not enough to offset the high reproductive rate of voles in the alfalfa fields.
Artificial perches may not only facilitate hunting [58] but also enhance breeding success by increasing the foraging efficiency of adult raptors. In barn owls, higher hunting success results in more prey being brought, which is positively linked to clutch size and brood size. [80,93]. Over time, this could result in more breeding pairs and a higher number of nestlings, especially in landscapes where nest boxes are already available and well-used, as is the case in our study area.
This potential for population-level growth in raptors could amplify predation pressure in subsequent seasons, creating a delayed but stronger numerical response. Such a response may be particularly important in perennial crops like alfalfa, where rodent populations persist year-round and require sustained control efforts. Moreover, the presence of hunting perches may encourage territorial settlement by additional raptor pairs, especially in areas where natural perching or nesting structures are limited.
However, this long-term benefit is contingent on several factors: the availability of suitable nesting sites [55], minimal disturbance during the breeding season, and sufficient prey availability to support larger broods. In our study region, where barn owl nest boxes are abundant and monitored, the addition of perches could synergistically support both adult survival and reproductive output, potentially leading to a cumulative increase in predator density over time.
5. Conclusions
This study demonstrates that while artificial hunting perches significantly increased the presence and activity of both diurnal and nocturnal raptors (mainly barn owls and black-shouldered kites), the raptors and rodenticides were insufficient to reduce vole activity or crop damage in alfalfa fields effectively. Rodent populations increased across all treatments, including those with rodenticides and perches, indicating that neither method alone was sufficient to suppress vole growth in this crop system.
The findings highlight the limitations of biological control in problematic perennial crops, such as alfalfa, where dense vegetation and high rodent reproduction may reduce predator efficiency. The high usage of perches by raptors may enhance predator foraging opportunities and may contribute to long-term increases in raptor populations through improved hunting success and reproductive output. The integration of 24/7 video surveillance and machine learning (YOLOv5) provided a novel and effective approach for quantifying raptor behavior and perch use, offering a valuable tool for future ecological monitoring.
We recommend that future research explore the effectiveness of biological pest control using hunting perches in other crop types. Additionally, studies should assess whether combining perches with other pest management strategies, such as alternative rodenticides, can yield more effective and sustainable outcomes. Long-term monitoring of different crop types for crop damages and perch uses across seasons will be essential to fully evaluate the potential of hunting perches as a scalable tool in integrated pest management.
Author Contributions
Conceptualization, M.C.; software, N.R. and A.B.; validation, N.R. and A,B.; formal analysis, N.R. and M.C.; data curation, N.R.; writing—original draft preparation, N.R. and M.C.; writing—review and editing, N.R., A.B, M.C.; funding acquisition, M.C. All authors have read and agreed to the published version of the manuscript.
Funding
This research was funded by Israel Ministry of Agriculture and Food Security, grant number 60-02-0003.
Institutional Review Board Statement
The study was conducted in accordance with and approved by the Israel Nature and Parks Authority and was provided permits (numbers 2020/42599 and 43091-2022.
Acknowledgments
We would like to thank Amir Ezer for his assistance in the field, On Rabinovitz for his advice, the Hula Research Center for the facilities, and the amazing farmers for their willingness and for allowing us to work in their fields.
Conflicts of Interest
The authors declare no conflicts of interest.
References
- McLaughlin, D.W. Land, Food, and Biodiversity: Land, Food, and Biodiversity. Conserv. Biol. 2011, 25, 1117–1120. [Google Scholar] [CrossRef]
- Mendenhall, C.D.; Karp, D.S.; Meyer, C.F.J.; Hadly, E.A.; Daily, G.C. Predicting biodiversity change and averting collapse in agricultural landscapes. Nature 2014, 509, 213–217. [Google Scholar] [CrossRef]
- Newbold, T.; Hudson, L.N.; Hill, S.L.L.; Contu, S.; Lysenko, I.; Senior, R.A.; Börger, L.; Bennett, D.J.; Choimes, A.; Collen, B.; et al. Global effects of land use on local terrestrial biodiversity. Nature 2015, 520, 45. [Google Scholar] [CrossRef] [PubMed]
- Raven, P.H.; Wagner, D.L. Agricultural intensification and climate change are rapidly decreasing insect biodiversity. Proc. Natl. Acad. Sci. 2021, 118. [Google Scholar] [CrossRef] [PubMed]
- Buick, R. Precision agriculture: an integration of information technologies with farming. Proc. New Zealand Plant Prot. Conf. 1997, 50, 176–184. [Google Scholar] [CrossRef]
- Jiao, J.; Wang, Y.; Han, L.; Su, D. Comparison of Water Distribution Characteristics for Two Kinds of Sprinklers Used for Center Pivot Irrigation Systems. Appl. Sci. 2017, 7, 421. [Google Scholar] [CrossRef]
- Li, Y.; Su, D. Alfalfa Water Use and Yield under Different Sprinkler Irrigation Regimes in North Arid Regions of China. Sustainability 2017, 9, 1380. [Google Scholar] [CrossRef]
- Heroldová, M.; Tkadlec, E. Harvesting behaviour of three central European rodents: Identifying the rodent pest in cereals. Crop. Prot. 2011, 30, 82–84. [Google Scholar] [CrossRef]
- Makundi, R.H.; Oguge, O.; Mwanjabe, P.S. Rodent Pest Management in East Africa - An Ecological Approach. In Proceedings of the Ecologically-based management of rodent pests; Singleton, G.R., Hinds, L.A., Leirs, H., Eds.; ACIAR: Canberra, Australia, 1999; pp. 460–476. [Google Scholar]
- Stenseth, N.C.; Leirs, H.; Skonhoft, A.; Davis, S.A.; Pech, R.P.; Andreassen, H.P.; Singleton, G.R.; Lima, M.; Machang'U, R.S.; Makundi, R.H.; et al. Mice, Rats, and People: The Bio-Economics of Agricultural Rodent Pests. Front. Ecol. Environ. 2003, 1, 367–375. [Google Scholar] [CrossRef]
- Baldwin, R.A.; Salmon, T.P.; Schmidt, R.H.; Timm, R.M. Perceived damage and areas of needed research for wildlife pests of California agriculture. Integr. Zoöl. 2013, 9, 265–279. [Google Scholar] [CrossRef] [PubMed]
- Salmon, T.P.; Lawrence, S.J. Anticoagulant Resistance in Meadow Voles (Microtus Californicus). In Proceedings of the 22nd Vertebrate Pest Conference; University of California: Davis, 2006. [Google Scholar]
- Erickson, W.A.; Urban, D.J. Potential Risks of Nine Rodenticides to Birds and Nontarget Mammals: A Comparative Approach; US Environmental Protection Agency, Office of Prevention, Pesticides and Toxic Substances: Washington, DC, 2004. [Google Scholar]
- Rattner, B.A.; Lazarus, R.S.; Elliott, J.E.; Shore, R.F.; Brink, N.v.D. Adverse Outcome Pathway and Risks of Anticoagulant Rodenticides to Predatory Wildlife. Environ. Sci. Technol. 2014, 48, 8433–8445. [Google Scholar] [CrossRef]
- López-Perea, J.J.; Mateo, R. Secondary Exposure to Anticoagulant Rodenticides and Effects on Predators. In Emerging Topics in Ecotoxicology; van den Brink, N., Elliott, J., Shore, R., Eds.; Springer International Publishing AG, 2018; Vol. 5, pp. 159–193. [Google Scholar]
- Gómez-Baggethun, E.; de Groot, R.; Lomas, P.L.; Montes, C. The history of ecosystem services in economic theory and practice: From early notions to markets and payment schemes. Ecol. Econ. 2010, 69, 1209–1218. [Google Scholar] [CrossRef]
- Saba, A.; Messina, F. Attitudes towards organic foods and risk/benefit perception associated with pesticides. Food Qual. Prefer. 2003, 14, 637–645. [Google Scholar] [CrossRef]
- Sekercioglu, Ç.H.; Wenny, D.G.; Whelan, C.J. Why Birds Matter: Avian Ecological Function and Ecosystem Services; University of Chicago Press, 2016; ISBN 978-0-226-38277-7. [Google Scholar]
- Meyrom, K.; Motro, Y.; Leshem, Y.; Aviel, S.; Izhaki, I.; Argyle, F.; Charter, M. Nest-Box use by the Barn OwlTyto albain a Biological Pest Control Program in the Beit She'an Valley, Israel. Ardea 2009, 97, 463–467. [Google Scholar] [CrossRef]
- Peleg, O.; Nir, S.; Leshem, Y.; Meyrom, K.; Aviel, S.; Charter, M.; Roulin, A.; Izhak, I. Three Decades of Satisfied Israeli Farmers: Barn Owls (Tyto alba) as Biological Pest Control of Rodents. Proc. Vertebr. Pest Conf. 2018, 28. [Google Scholar] [CrossRef]
- Moore, T.; Van Vuren, D.; Ingels, C. Are barn owls a biological control for gophers? Evaluating effectiveness in vineyards and orchards. Proc. Vertebr. Pest Conf. 1998, 18. [Google Scholar] [CrossRef]
- Martin, J. Are Barn Owls (Tyto Alba) Biological Controllers of Rodents in the Everglades Agricultural Area? MSc thesis, University of Florida, Gainesville, 2009. [Google Scholar]
- Kross, S.M.; Bourbour, R.P.; Martinico, B.L. Agricultural land use, barn owl diet, and vertebrate pest control implications. Agric. Ecosyst. Environ. 2016, 223, 167–174. [Google Scholar] [CrossRef]
- Raid, R. Use of Barn Owls for Sustainable Rodent Control in Agricultural Areas. Proc. Fla. State Hort. Soc. 2012, 366–369. [Google Scholar]
- Wendt, C.A.; Johnson, M.D. Multi-scale analysis of barn owl nest box selection on Napa Valley vineyards. Agric. Ecosyst. Environ. 2017, 247, 75–83. [Google Scholar] [CrossRef]
- Johnson, M.D.; Carlino, J.E.; Chavez, S.D.; Wang, R.; Cortez, C.; Montenegro, L.M.E.; Duncan, D.; Ralph, B. Balancing model specificity and transferability: Barn owl nest box selection. J. Wildl. Manag. 2024, 89. [Google Scholar] [CrossRef]
- Bontzorlos, V.; Cain, S.; Leshem, Y.; Spiegel, O.; Motro, Y.; Bloch, I.; Cherkaoui, S.I.; Aviel, S.; Apostolidou, M.; Christou, A.; et al. Barn Owls as a Nature-Based Solution for Pest Control: A Multinational Initiative Around the Mediterranean and Other Regions. Conservation 2024, 4, 627–656. [Google Scholar] [CrossRef]
- Paz, A.; Jareño, D.; Arroyo, L.; Viñuela, J.; Arroyo, B.; Mougeot, F.; Luque-Larena, J.J.; Fargallo, J.A. Avian predators as a biological control system of common vole (Microtus arvalis) populations in north-western Spain: experimental set-up and preliminary results. Pest Manag. Sci. 2012, 69, 444–450. [Google Scholar] [CrossRef]
- Charter, M.; Izhaki, I.; Bouskila, A.; Leshem, Y.; Penteriani, V. The Effect of Different Nest Types on the Breeding Success of Eurasian Kestrels (Falco tinnunculus) in a Rural Ecosystem. J. Raptor Res. 2007, 41, 143–149. [Google Scholar] [CrossRef]
- Charter, M.; Izhaki, I.; Leshem, Y. Predation or facilitation? An experimental assessment of whether generalist predators affect the breeding success of passerines. J. Ornithol. 2010, 152, 533–539. [Google Scholar] [CrossRef]
- Charter, M.; Izhaki, I.; Leshem, Y. Does Nest Basket Size Affect Breeding Performance of Long-eared Owls and Eurasian Kestrels? J. Raptor Res. 2010, 44, 314–317. [Google Scholar] [CrossRef]
- Shave, M.E.; Shwiff, S.A.; Elser, J.L.; Lindell, C.A.; Siriwardena, G. Falcons using orchard nest boxes reduce fruit-eating bird abundances and provide economic benefits for a fruit-growing region. J. Appl. Ecol. 2018, 55, 2451–2460. [Google Scholar] [CrossRef]
- Larson, K.C.; Baldwin, R.A.; Johnson, M.D. Are Barn Owls a Cost-Effective Alternative to Lethal Trapping? Implications for Rodent Pest Management. In Proceedings of the Proceedings of the Vertebrate Pest Conference; 2024; p. 31. [Google Scholar]
- Hansen, A.; Johnson, M. Evaluating the Use of Barn Owl Nest Boxes for Rodent Pest Control in Winegrape Vineyards in Napa Valley. Proc. Vertebr. Pest Conf. 2022, 30, 9. [Google Scholar]
- Askham, L.R. Effect of Artificial Perches and Nests in Attracting Raptors to Orchards. In Proceedings of the Proceedings of the Fourteenth Vertebrate Pest Conference 1990.
- Clucas, B.; Smith, T.N.; Carlino, J.; Daniel, S.; Davis, A.; Douglas, L.; Gulak, M.M.; Livingstone, S.L.K.; Lopez, S.; Kerr, K.J.; et al. A novel method using camera traps to record effectiveness of artificial perches for raptors. Calif. Fish Wildl. J. 2020, 106. [Google Scholar] [CrossRef]
- Hong, S.-Y.; Lin, H.-S.; Huang, Z.-L.; Choi, W.-S.; Wang, W.-I.; Sun, Y.-H. Perch-Mounted Camera Traps Record Predatory Birds in Farmland. J. Raptor Res. 2022, 56, 116–124. [Google Scholar] [CrossRef]
- Kay, B.; Twigg, L.; Korn, T.; Nicol, H. The use of artifical perches to increase predation on house mice (mus domesticus) by raptors. Wildl. Res. 1994, 21, 95–105. [Google Scholar] [CrossRef]
- Sheffield, L.M.; Crait, J.R.; Edge, W.D.; Wang, G. Response of American kestrels and gray-tailed voles to vegetation height and supplemental perches. Can. J. Zoöl. 2001, 79, 380–385. [Google Scholar] [CrossRef]
- O Wolff, J.; Fox, T.; Skillen, R.R.; Wang, G. The effects of supplemental perch sites on avian predation and demography of vole populations. Can. J. Zoöl. 1999, 77, 535–541. [Google Scholar] [CrossRef]
- Wong, E.L.; Kross, S.M. Effects of Perch Location on Wintering Raptor Use of Artificial Perches in a California Vineyard. J. Raptor Res. 2018, 52, 250–256. [Google Scholar] [CrossRef]
- Olenec, Z.D.D.; Ovak, D.A.K.I.N. Winter Prey of the Long-Eared Owl (Asio Otus ) in Northern Croatia. Nat. Croat. Period. Musei Hist. Nat. Croat. 2010, 19, 1998–2001. [Google Scholar]
- Zagorski, M.E.; Swihart, R.K. Killing time in cover crops? Artificial perches promote field use by raptors. Ann. Appl. Biol. 2020, 177, 358–366. [Google Scholar] [CrossRef]
- Monteagudo, N.; Benayas, J.M.R.; Meltzer, J.; Rebollo, S. Assessing the influence of raptors on grape-eating birds in a Mediterranean vineyard. Crop. Prot. 2023, 174. [Google Scholar] [CrossRef]
- Blumstein, D.T. Flight-Initiation Distance in Birds Is Dependent on Intruder Starting Distance. J. Wildl. Manag. 2003, 67, 852. [Google Scholar] [CrossRef]
- Teel, T.L.; Manfredo, M.J. Understanding the Diversity of Public Interests in Wildlife Conservation. Conserv. Biol. 2010, 24, 128–139. [Google Scholar] [CrossRef]
- Machar, I.; Harmacek, J.; Vrublova, K.; Filippovova, J.; Brus, J. Biocontrol of Common Vole Populations by Avian Predators Versus Rodenticide Application. Pol. J. Ecol. 2017, 65, 434–444. [Google Scholar] [CrossRef]
- Christie, K.S.; Gilbert, S.L.; Brown, C.L.; Hatfield, M.; Hanson, L. Unmanned aircraft systems in wildlife research: current and future applications of a transformative technology. Front. Ecol. Environ. 2016, 14, 241–251. [Google Scholar] [CrossRef]
- Sishodia, R.P.; Ray, R.L.; Singh, S.K. Applications of Remote Sensing in Precision Agriculture: A Review. Remote. Sens. 2020, 12, 3136. [Google Scholar] [CrossRef]
- Duarte, A.; Borralho, N.; Cabral, P.; Caetano, M. Recent Advances in Forest Insect Pests and Diseases Monitoring Using UAV-Based Data: A Systematic Review. Forests 2022, 13, 911. [Google Scholar] [CrossRef]
- Aszkowski, P.; Kraft, M.; Drapikowski, P.; Pieczyński, D. Estimation of corn crop damage caused by wildlife in UAV images. Precis. Agric. 2024, 25, 2505–2530. [Google Scholar] [CrossRef]
- Keshet, D.; Brook, A.; Malkinson, D.; Izhaki, I.; Charter, M. The Use of Drones to Determine Rodent Location and Damage in Agricultural Crops. Drones 2022, 6, 396. [Google Scholar] [CrossRef]
- Zhang, T.; Du, J.; Zhu, X.; Gao, X. Research on Grassland Rodent Infestation Monitoring Methods Based on Dense Residual Networks and Unmanned Aerial Vehicle Remote Sensing. J. Appl. Spectrosc. 2023, 89, 1220–1231. [Google Scholar] [CrossRef]
- Ezzy, H.; Charter, M.; Bonfante, A.; Brook, A. How the Small Object Detection via Machine Learning and UAS-Based Remote-Sensing Imagery Can Support the Achievement of SDG2: A Case Study of Vole Burrows. Remote. Sens. 2021, 13, 3191. [Google Scholar] [CrossRef]
- Charter, M.; Rozman, G. The Importance of Nest Box Placement for Barn Owls (Tyto alba). Animals 2022, 12, 2815. [Google Scholar] [CrossRef]
- El-Ramady, H.; Abdalla, N.; Kovacs, S.; Domokos-Szabolcsy, É.; Bákonyi, N.; Fari, M.; Geilfus, C.-M. Alfalfa Growth under Changing Environments: An Overview. Environ. Biodivers. Soil Secur. 2020. [Google Scholar] [CrossRef]
- Radovic, J.; Sokolovic, D.; Markovic, J. Alfalfa-most important perennial forage legume in animal husbandry. 2009, 25, 465–475. [Google Scholar] [CrossRef]
- Andersson, M.; Wallander, J.; Isaksson, D. Predator perches: a visual search perspective. Funct. Ecol. 2009, 23, 373–379. [Google Scholar] [CrossRef]
- Briner, T.; Nentwig, W.; Airoldi, J.-P. Habitat quality of wildflower strips for common voles (Microtus arvalis) and its relevance for agriculture. Agric. Ecosyst. Environ. 2005, 105, 173–179. [Google Scholar] [CrossRef]
- Moran, S. Reducing sodium fluoroacetate and fluoroacetamide concentrations in field rodent baits. Phytoparasitica 1995, 23, 195–203. [Google Scholar] [CrossRef]
- Moran, S.; Keidar, H. Checklist of vertebrate damage to agriculture in Israel. Crop. Prot. 1993, 12, 173–182. [Google Scholar] [CrossRef]
- Polinova, M.; Jarmer, T.; Brook, A. Spectral data source effect on crop state estimation by vegetation indices. Environ. Earth Sci. 2018, 77, 752. [Google Scholar] [CrossRef]
- Liro, A. Renewal of burrows by the common vole as the indicator of its numbers. Mammal Res. 1974, 19, 259–272. [Google Scholar] [CrossRef]
- Boon, M.A.; Greenfield, R.; Tesfamichael, S. Wetland Assessment Using Unmanned Aerial Vehicle (UAV) Photogrammetry. In Proceedings of the International Archives of the Photogrammetry, Remote Sensing and Spatial Information Sciences - ISPRS Archives; 2016. [Google Scholar]
- Sellers, P.J. Canopy reflectance, photosynthesis and transpiration. Int. J. Remote. Sens. 1985, 6, 1335–1372. [Google Scholar] [CrossRef]
- Gamon, J.A.; Serrano, L.; Surfus, J.S. The photochemical reflectance index: an optical indicator of photosynthetic radiation use efficiency across species, functional types, and nutrient levels. Oecologia 1997, 112, 492–501. [Google Scholar] [CrossRef]
- Penuelas, J.; Baret, F.; Filella, I. Semi-Empirical Indices to Assess Carotenoids/Chlorophyll a Ratio from Leaf Spectral Reflectance. Photosynthetica 1995, 31. [Google Scholar]
- Nagari, M.; Charter, M. Comparing Insect Predation by Birds and Insects in an Apple Orchard and Neighboring Unmanaged Habitat: Implications for Ecosystem Services. Animals 2023, 13, 1785. [Google Scholar] [CrossRef]
- Plaza, J.; Sánchez, N.; García-Ariza, C.; Pérez-Sánchez, R.; Charfolé, F.; Caminero-Saldaña, C. Classification of airborne multispectral imagery to quantify common vole impacts on an agricultural field. Pest Manag. Sci. 2022, 78, 2316–2323. [Google Scholar] [CrossRef] [PubMed]
- Zhu, X.; Chen, W.; Li, M.; Liu, B.; Zhao, S.; Hu, M.; Li, J.; Li, D.; Shi, Y.; Sun, H.; et al. Comprehensive evaluation of the nutritional value and contaminants of alfalfa (Medicago sativa L.) in China. Front. Nutr. 2025, 12, 1539462. [Google Scholar] [CrossRef]
- Moran, S.; Keidar, H. Assessment of Toxic Bait Efficacy in Field Trials by Counts of Burrow Openings. Proc. Vertebr. Pest Conf. 1994, 16, 168–174. [Google Scholar]
- Moran, S. Toxicity of sodium fluoroacetate and zinc phosphide wheat grain baits to Microtus guentheri and Meriones tristrami. EPPO Bull. 1991, 21, 73–80. [Google Scholar] [CrossRef]
- Baldwin, R.A.; Abbo, B.G.; Goldade, D.A. Comparison of mixing methods and associated residual levels of zinc phosphide on cabbage bait for rodent management. Crop. Prot. 2018, 105, 59–61. [Google Scholar] [CrossRef]
- A Baldwin, R.; Halbritter, H.; Meinerz, R.; Snell, L.K.; Orloff, S.B. Efficacy and nontarget impact of zinc phosphide-coated cabbage as a ground squirrel management tool. Pest Manag. Sci. 2019, 75, 1847–1854. [Google Scholar] [CrossRef]
- Baldwin, R.; Meinerz, R.; Shiels, A. Efficacy of Goodnature A24 self-resetting traps and diphacinone bait for controlling black rats (Rattus rattus) in citrus orchards. Manag. Biol. Invasions 2022, 13, 577–592. [Google Scholar] [CrossRef]
- Witmer, G.W.; Moulton, R.S.; Baldwin, R.A. An efficacy test of cholecalciferol plus diphacinone rodenticide baits for California voles (Microtus californicusPeale) to replace ineffective chlorophacinone baits. Int. J. Pest Manag. 2014, 60, 275–278. [Google Scholar] [CrossRef]
- Charter, M.; Izhaki, I.; Meyrom, K.; Motro, Y.; Leshem, Y. Diets of Barn Owls Differ in the Same Agricultural Region. Wilson J. Ornithol. 2009, 121, 378–383. [Google Scholar] [CrossRef]
- Corl, A.; Charter, M.; Rozman, G.; Toledo, S.; Turjeman, S.; Kamath, P.L.; Getz, W.M.; Nathan, R.; Bowie, R.C. Movement ecology and sex are linked to barn owl microbial community composition. Mol. Ecol. 2020, 29, 1358–1371. [Google Scholar] [CrossRef]
- Charter, M.; Izhaki, I.; Leshem, Y.; Meyrom, K.; Roulin, A. Relationship between diet and reproductive success in the Israeli barn owl. J. Arid. Environ. 2015, 122, 59–63. [Google Scholar] [CrossRef]
- Charter, M.; Izhaki, I.; Roulin, A. The relationship between intra–guild diet overlap and breeding in owls in Israel. Popul. Ecol. 2018, 60, 397–403. [Google Scholar] [CrossRef]
- Cohen-Shlagman, L.; Hellwing, S.; Yom-Tov, Y. The Biology of the Levant Vole, Microtus Guentheri in Israel II. The Reproduction and Growth in Captivity. Zeit. Zaugeteirkd. 1984, 49, 149–156. [Google Scholar]
- Cohen-Shlagman, L.; Yom-Tov, Y.; Hellwing, S. The Biology of the Levant Vole Microtus Guentheri in Israel. I. Population Dynamics in the Field. Zeit. Zaugetierkd. 1984, 49, 135–147. [Google Scholar]
- Benjamini, L. Diel Activity Rhythms in the Levant Vole, Microtus Guentheri. Isr. J. Zool. 1988, 35, 215–228. [Google Scholar] [CrossRef]
- Rozman, G.; Izhaki, I.; Roulin, A.; Charter, M. Movement ecology, breeding, diet, and roosting behavior of barn owls (Tyto alba) in a transboundary conflict region. Reg. Environ. Chang. 2021, 21, 1–13. [Google Scholar] [CrossRef]
- A Castañeda, X.; E Huysman, A.; Johnson, M.D. Barn Owls select uncultivated habitats for hunting in a winegrape growing region of California. Condor 2021, 123. [Google Scholar] [CrossRef]
- Vilk, O.; Orchan, Y.; Charter, M.; Ganot, N.; Toledo, S.; Nathan, R.; Assaf, M. Ergodicity Breaking in Area-Restricted Search of Avian Predators. Phys. Rev. X 2022, 12, 031005. [Google Scholar] [CrossRef]
- Toledo, S.; Orchan, Y.; Shohami, D.; Charter, M.; Nathan, R. Physical-Layer Protocols for Lightweight Wildlife Tags with Internet-of-Things Transceivers. In Proceedings of the 2018 IEEE 19th International Symposium on “A World of Wireless, Mobile and Multimedia Networks” (WoWMoM), Chania, Greece, 12–15 June 2018. [Google Scholar]
- Brown, J.S.; Laundré, J.W.; Gurung, M. The Ecology of Fear: Optimal Foraging, Game Theory, and Trophic Interactions. J. Mammal. 1999, 80, 385–399. [Google Scholar] [CrossRef]
- Gaynor, K.M.; Cherry, M.J.; Gilbert, S.L.; Kohl, M.T.; Larson, C.L.; Newsome, T.M.; Prugh, L.R.; Suraci, J.P.; Young, J.K.; Smith, J.A. An applied ecology of fear framework: linking theory to conservation practice. Anim. Conserv. 2020, 24, 308–321. [Google Scholar] [CrossRef]
- Solomon, M.E. The Natural Control of Animal Populations. J. Anim. Ecol. 1949, 18, 1–35. [Google Scholar] [CrossRef]
- Holling, C.S. Some Characteristics of Simple Types of Predation and Parasitism. Can. Èntomol. 1959, 91, 385–398. [Google Scholar] [CrossRef]
- Andersson, M.; Erlinge, S. Influence of Predation on Rodent Populations. Oikos 1977, 29, 591. [Google Scholar] [CrossRef]
- Klok, C.; de Roos, A.M. Effects of vole fluctuations on the population dynamics of the barn owl Tyto alba. Acta Biotheor. 2007, 55, 227–241. [Google Scholar] [CrossRef] [PubMed]
Figure 1.
Examples of screenshot images from video of the object tracking (Section 2.5.2) of a perching black-shouldered kite during the day (left) and a barn owl flying with another owl in the background (right).
Figure 1.
Examples of screenshot images from video of the object tracking (Section 2.5.2) of a perching black-shouldered kite during the day (left) and a barn owl flying with another owl in the background (right).
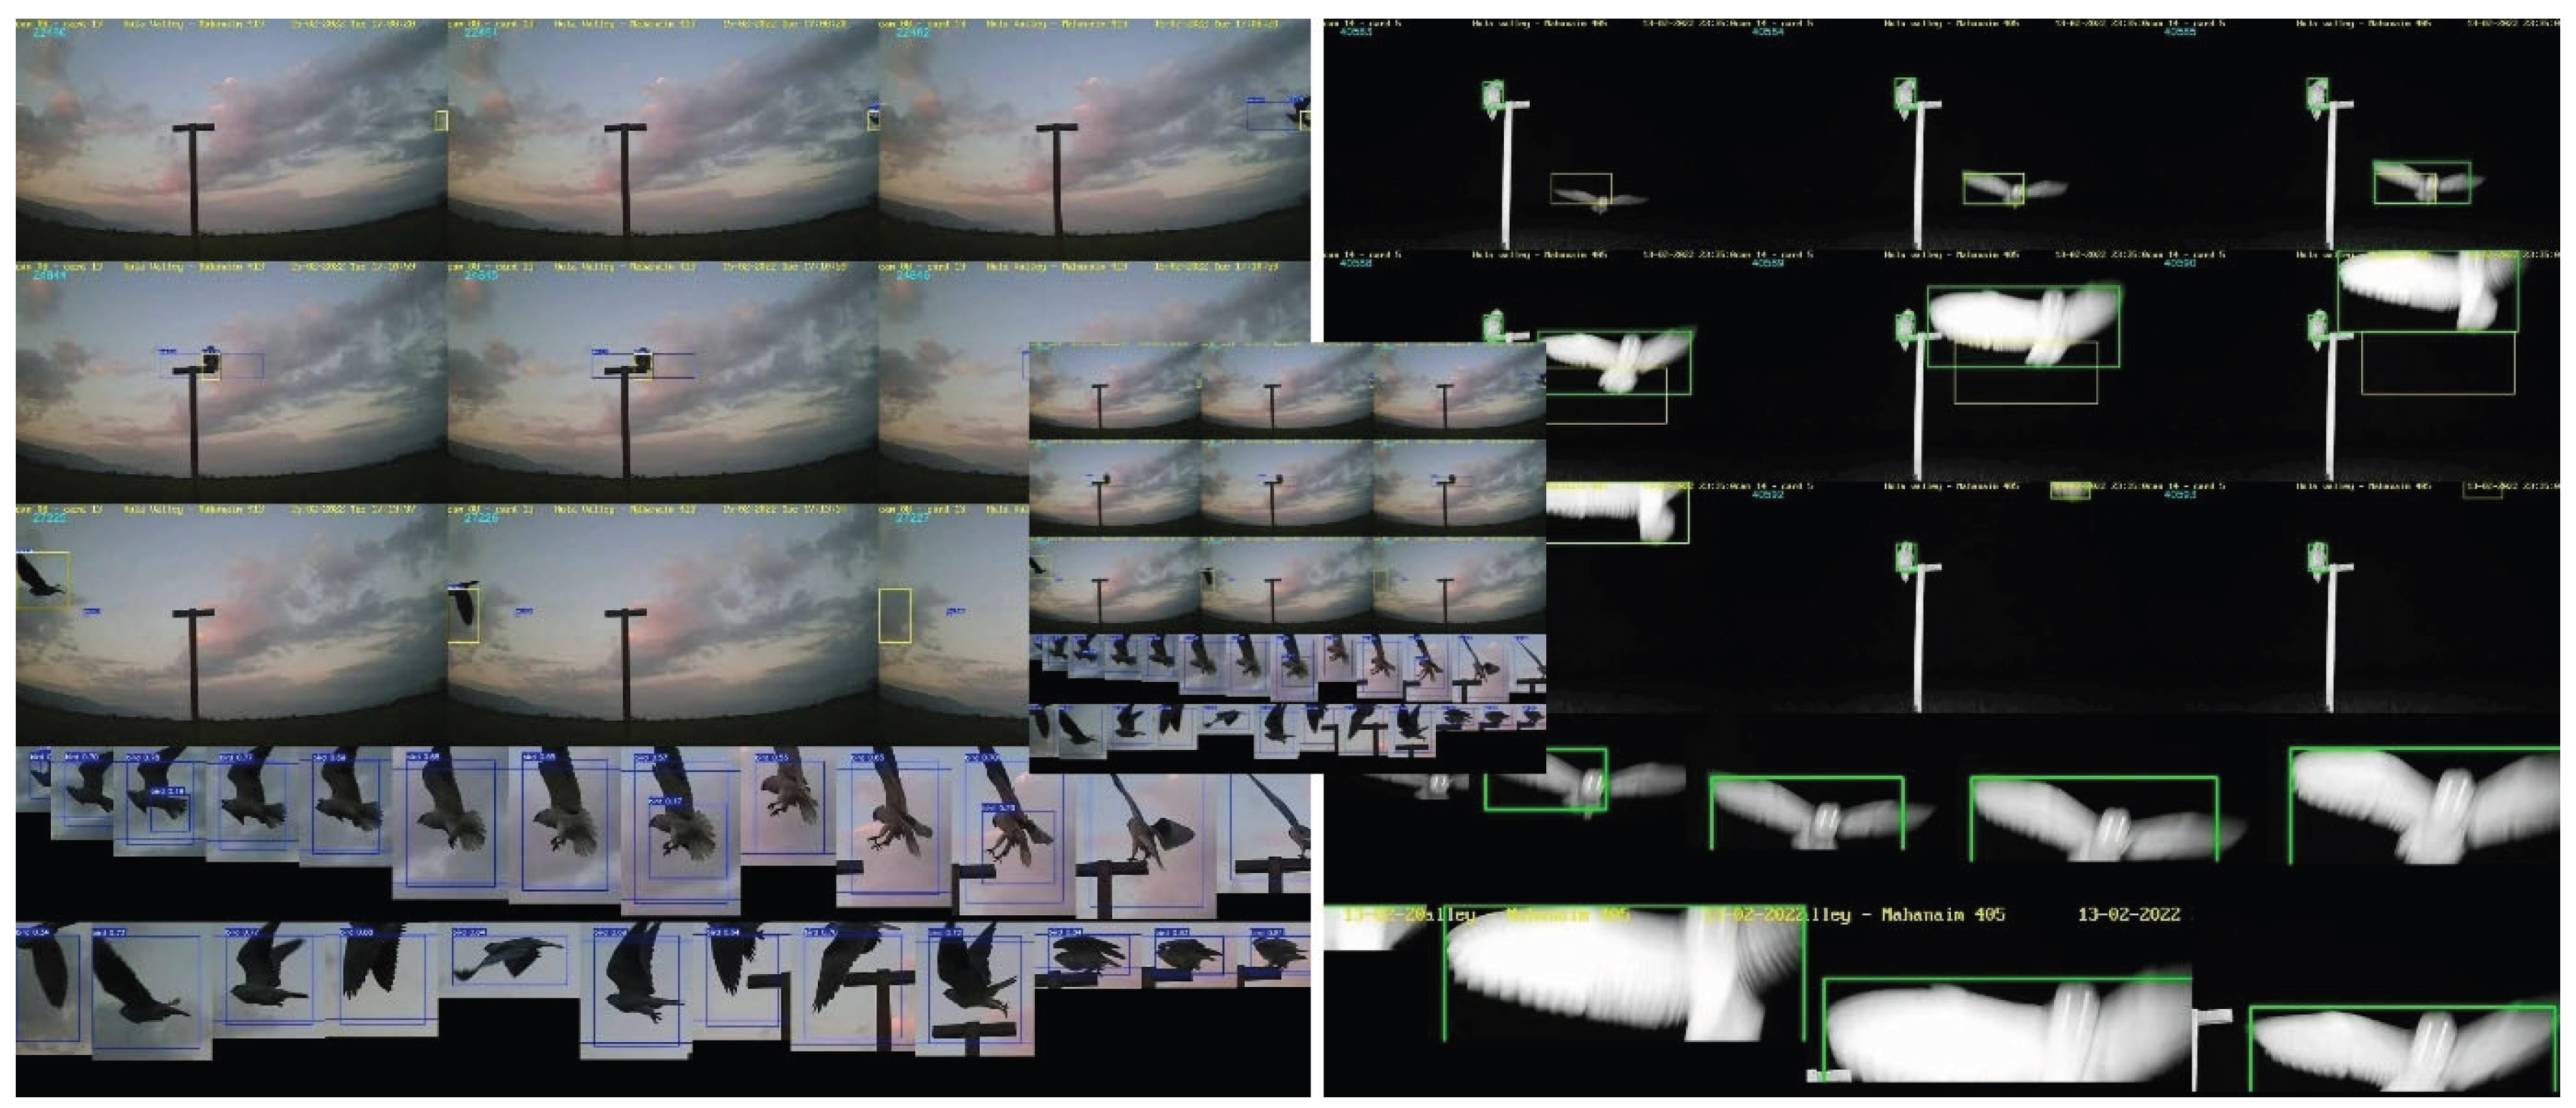
Figure 2.
Flowchart of Semi-Automatic Method for Raptor Track Extraction from Video.
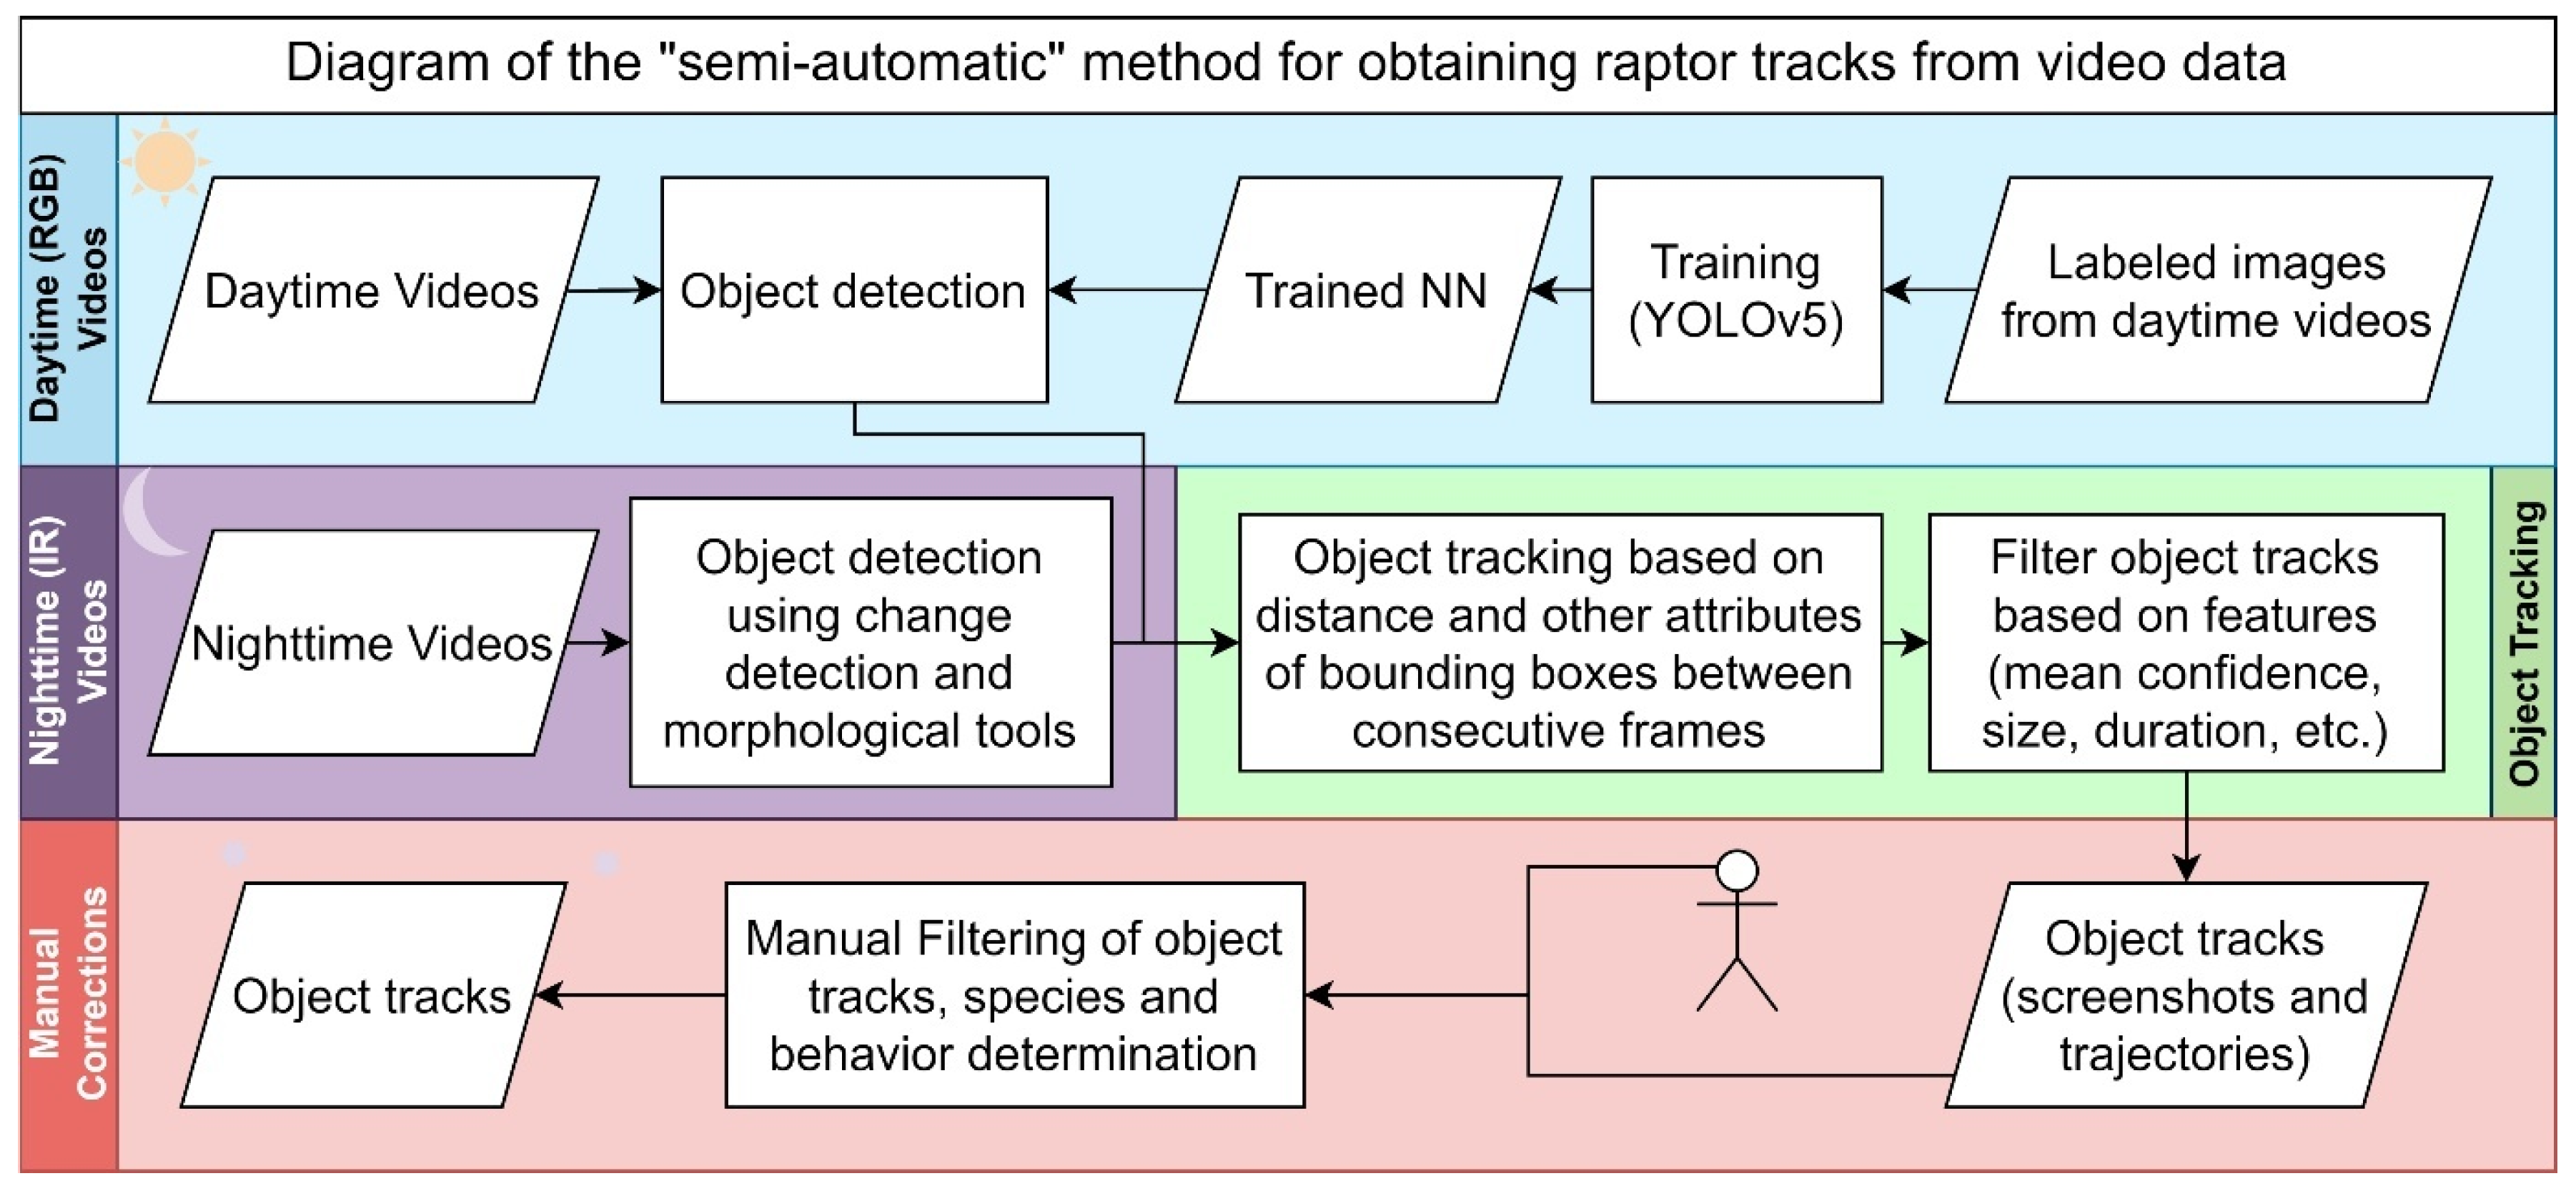
Figure 3.
Trajectory images showing raptors during the day (1) flying, (2) hovering and (3) perching.
Figure 3.
Trajectory images showing raptors during the day (1) flying, (2) hovering and (3) perching.
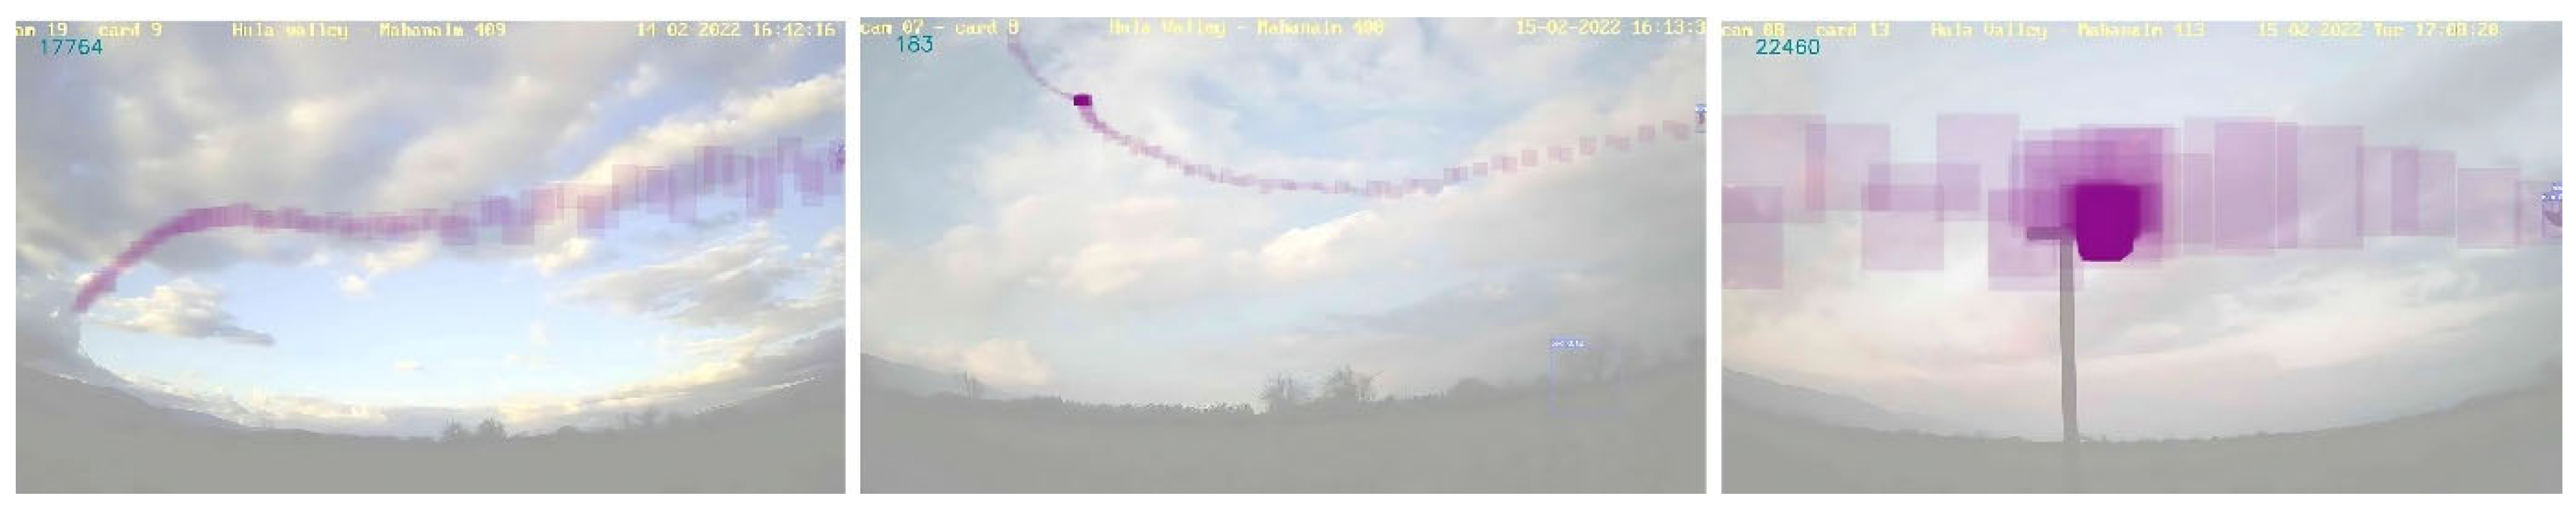
Figure 4.
False positive examples: (1) a flock of Eurasian cranes (Grus grus), (2) clouds, and (3, 4) insects falsely classified as birds.
Figure 4.
False positive examples: (1) a flock of Eurasian cranes (Grus grus), (2) clouds, and (3, 4) insects falsely classified as birds.
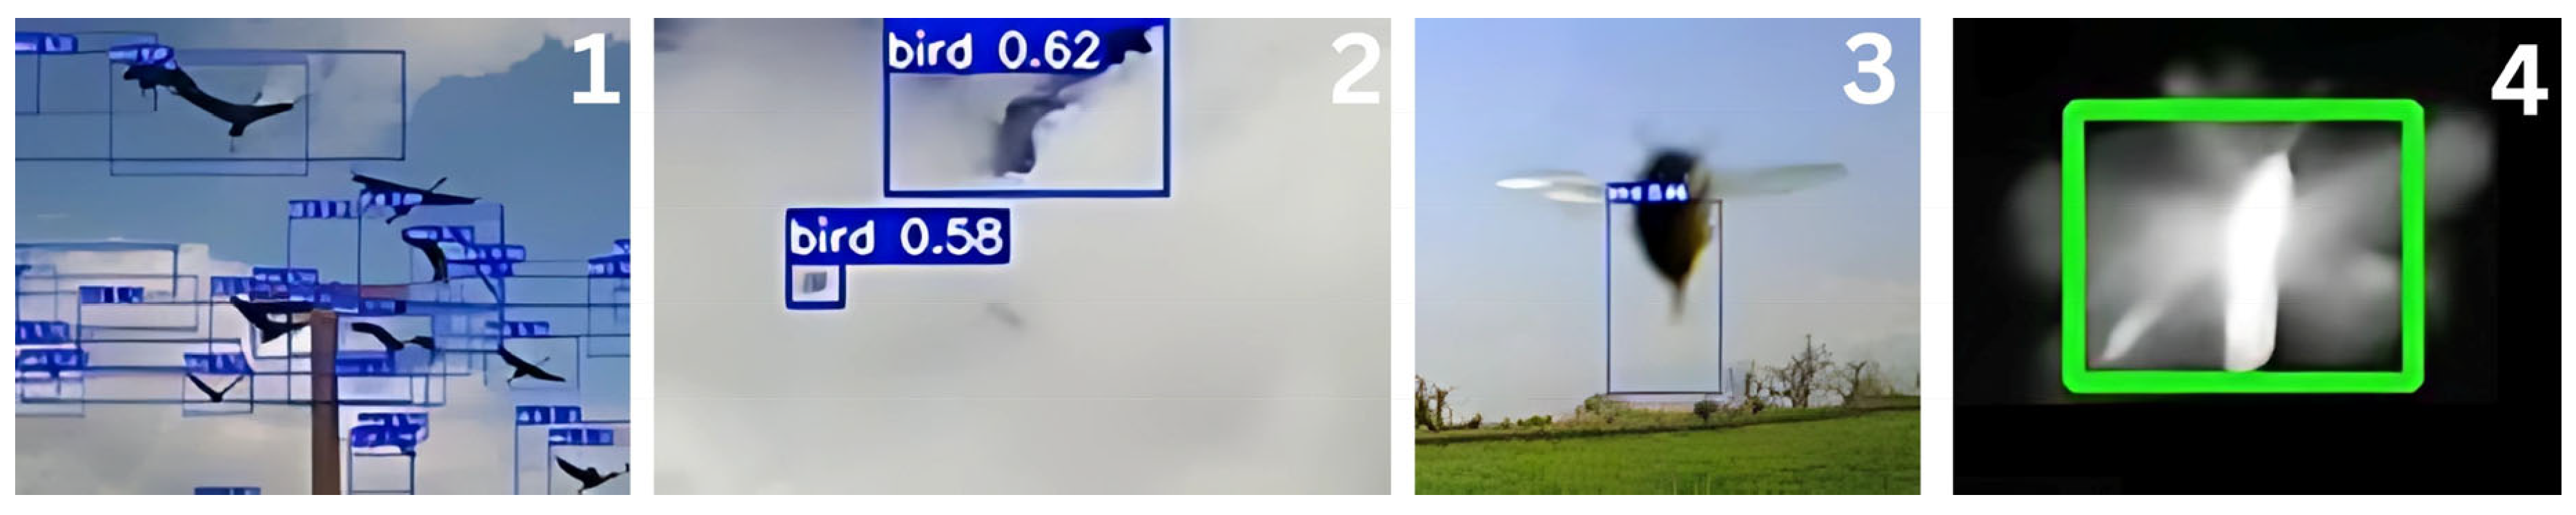
Figure 5.
The burrow numbers (a), percentage of alfalfa cover (b), PRI (c), SIPI (d), and NDVI (e) values in the three treatments (Hunting Perches, n=13), (Rodenticide, n=11), (Control, n=11) during the three data collecting sessions (1: mid-January until the start of February, 2: mid-February until the start of March, 3: mid-March until the start of April).
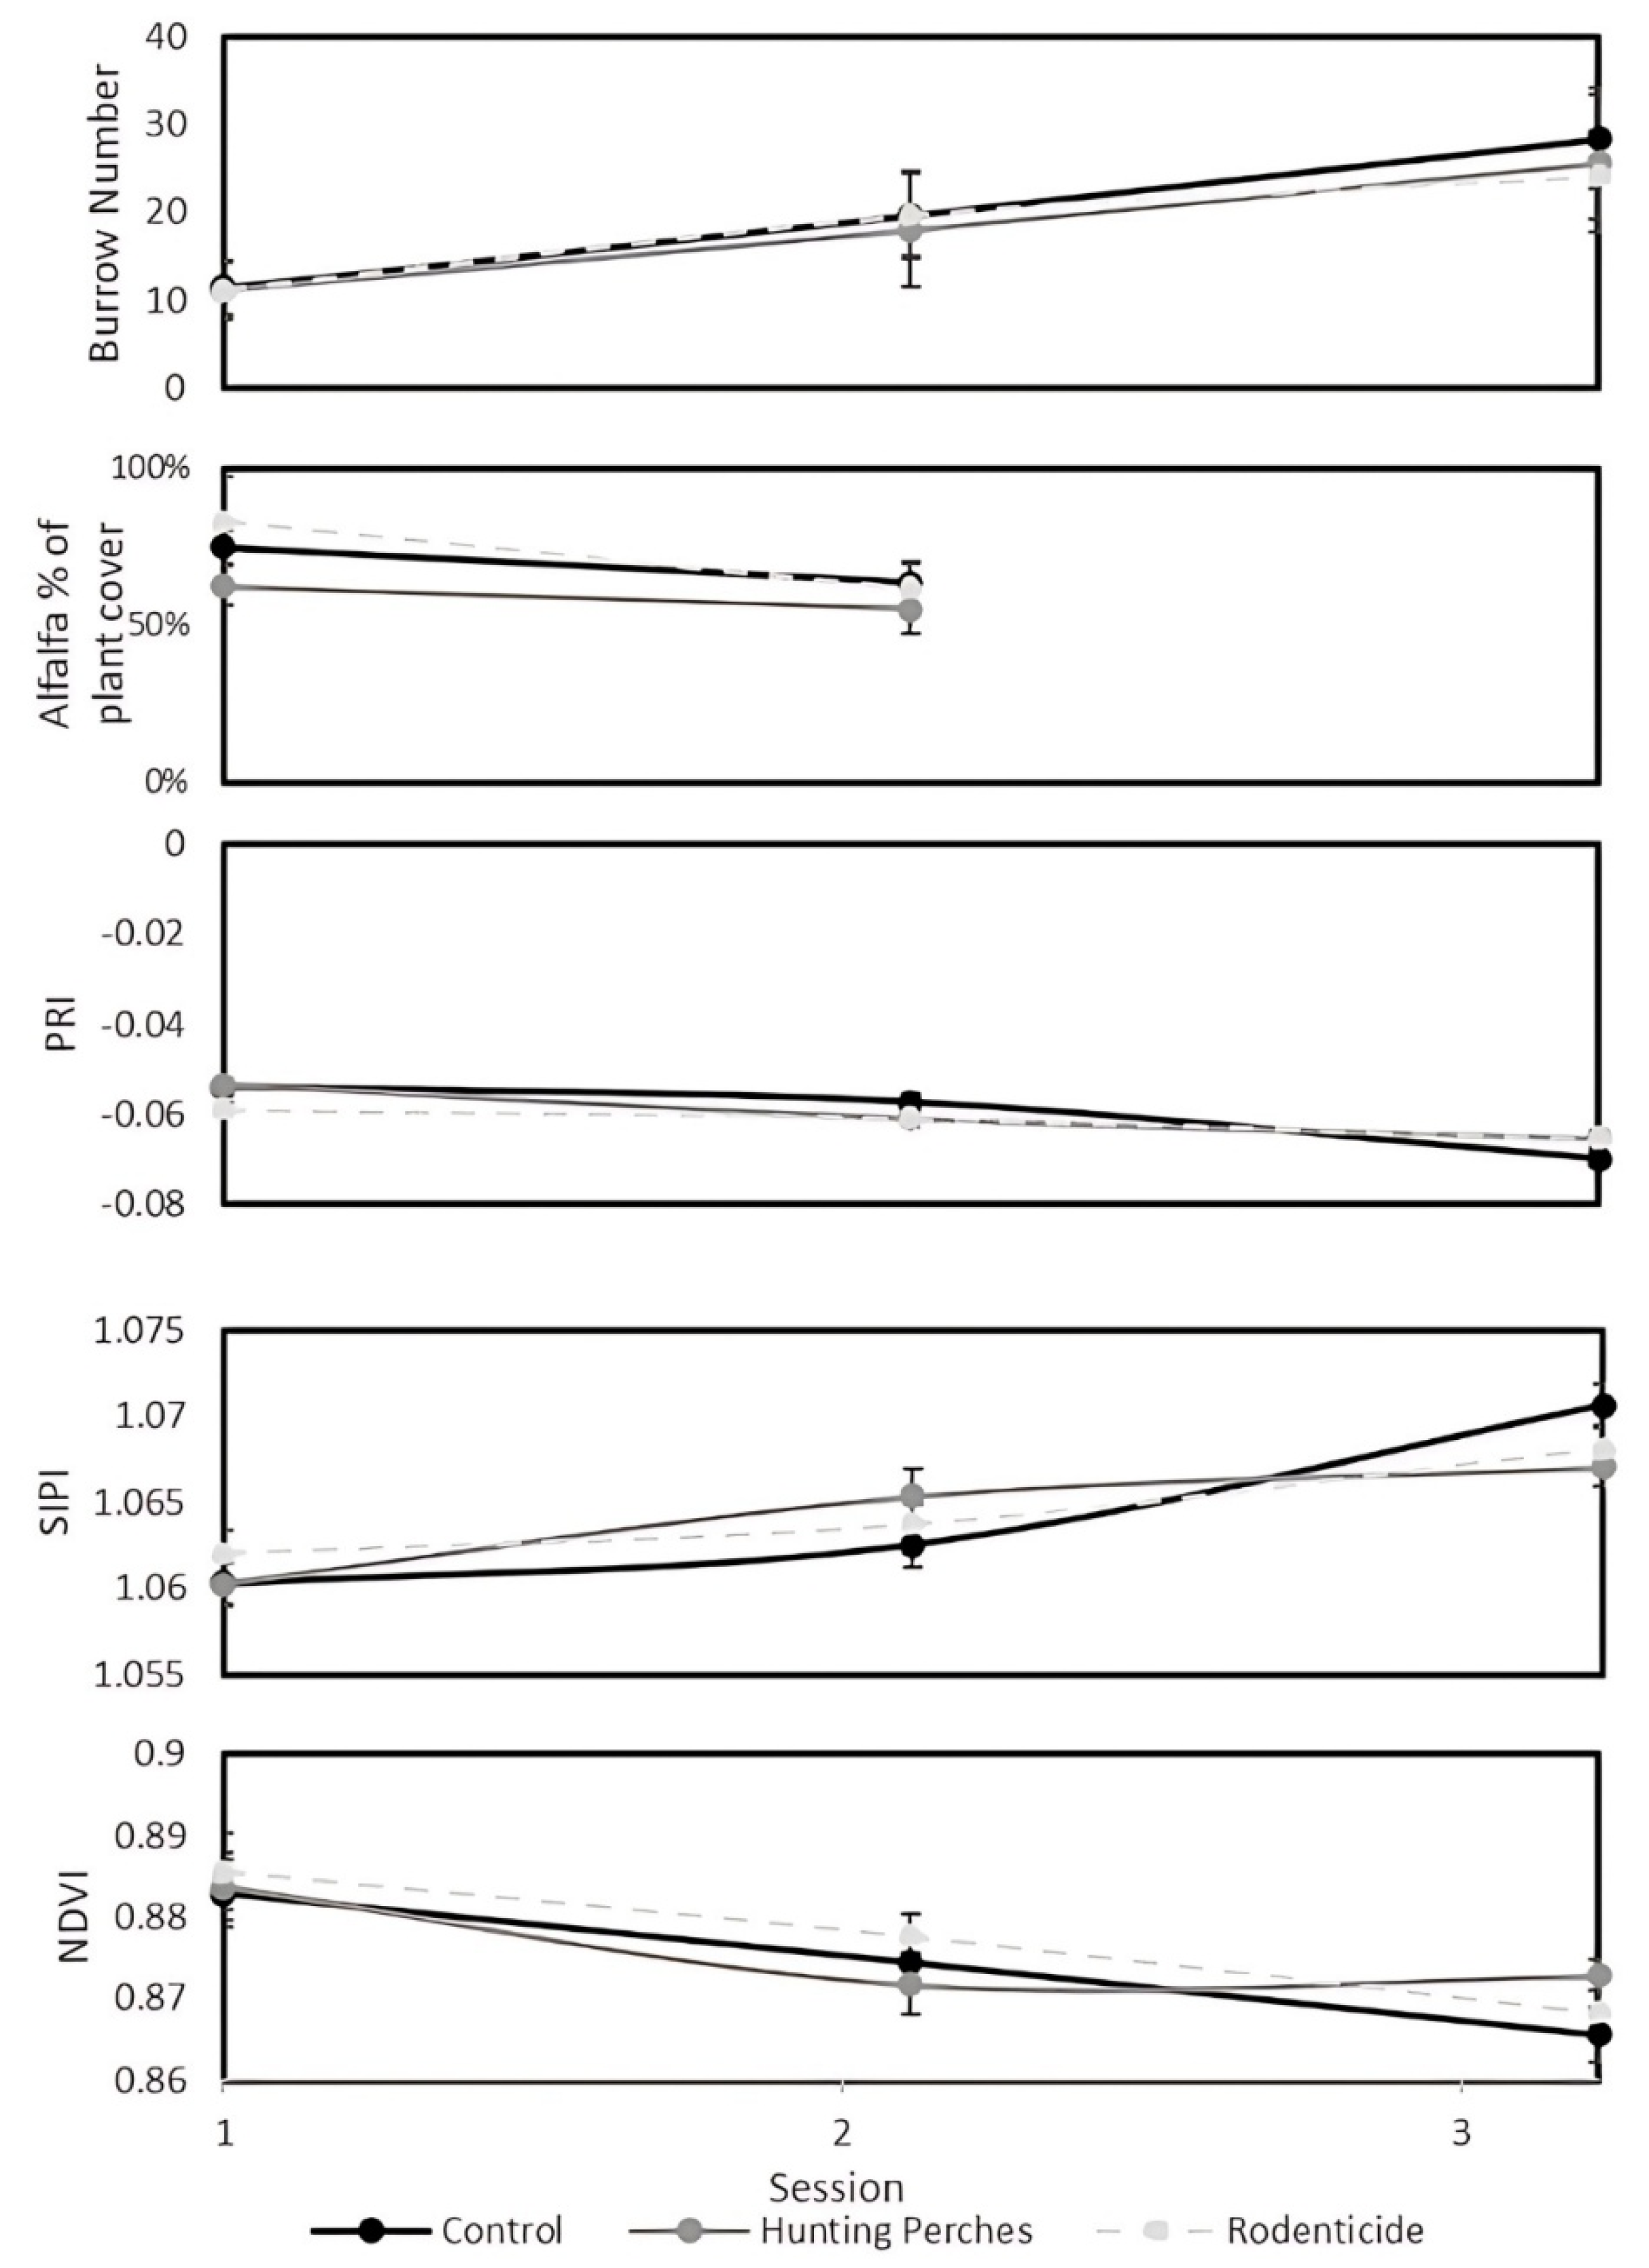
Figure 6.
The mean number of events by different raptor species appearing on cameras in the three treatments, Hunting Perches (black, n=13), Rodenticide (gray, n=11), Control (white, n=11) during 48 hours.
Figure 6.
The mean number of events by different raptor species appearing on cameras in the three treatments, Hunting Perches (black, n=13), Rodenticide (gray, n=11), Control (white, n=11) during 48 hours.
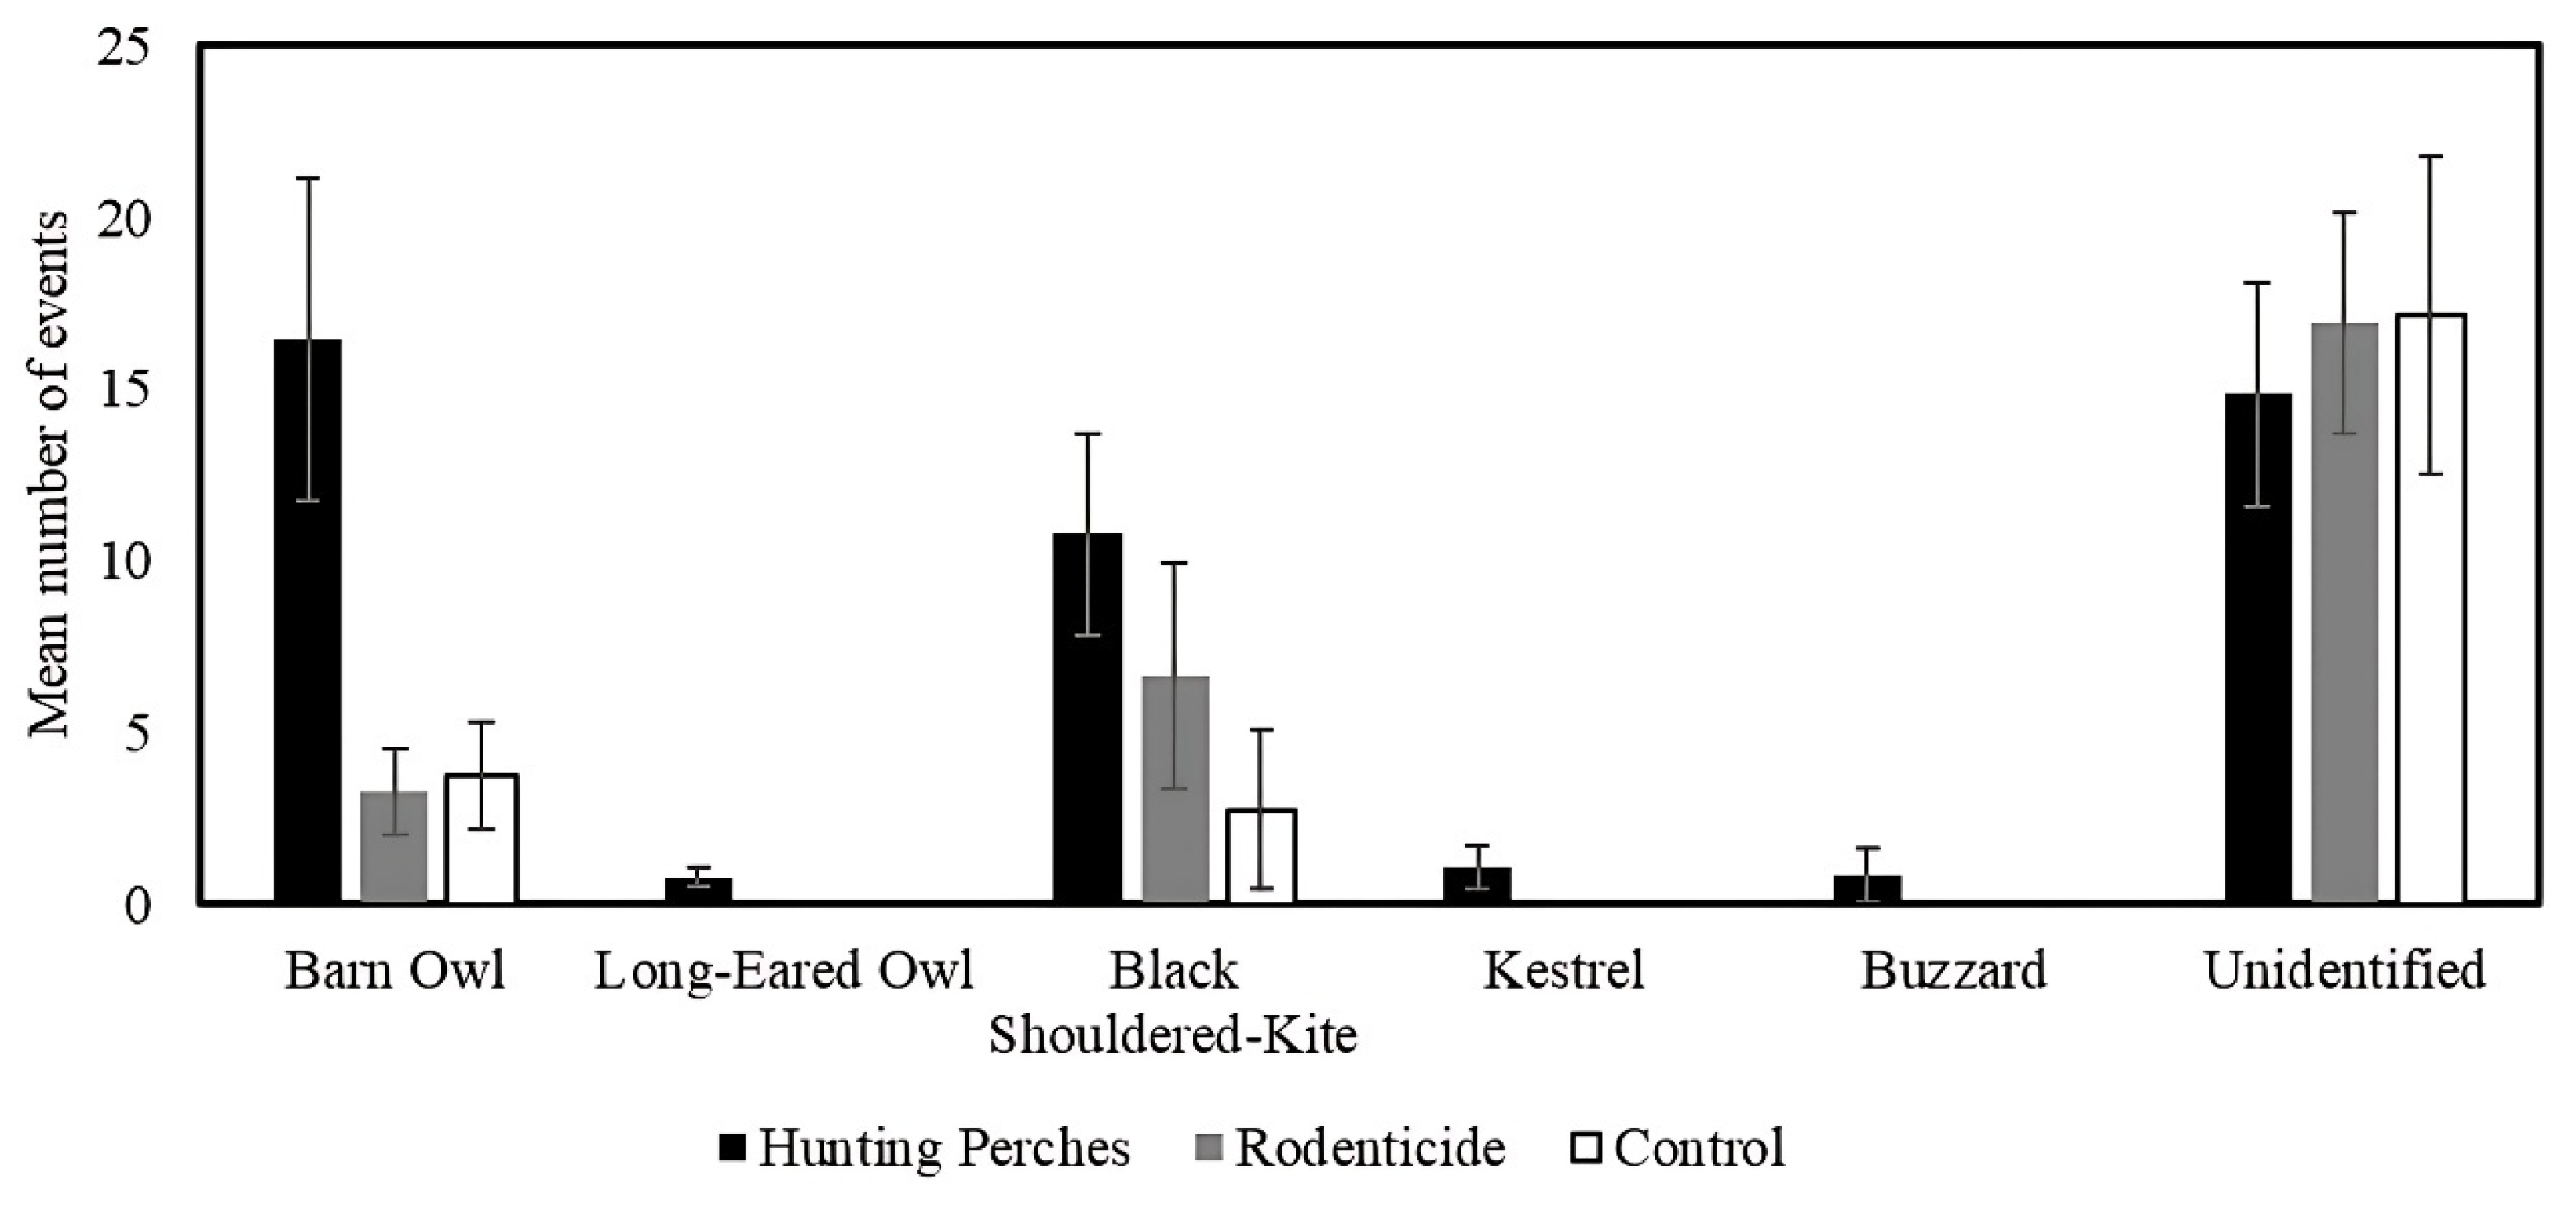
Figure 7.
The mean duration (minutes) of different raptor species in the three treatments, Hunting Perches (black, n=13), Rodenticide (gray, n=11), Control (white, n=11) in 48 hours.
Figure 7.
The mean duration (minutes) of different raptor species in the three treatments, Hunting Perches (black, n=13), Rodenticide (gray, n=11), Control (white, n=11) in 48 hours.
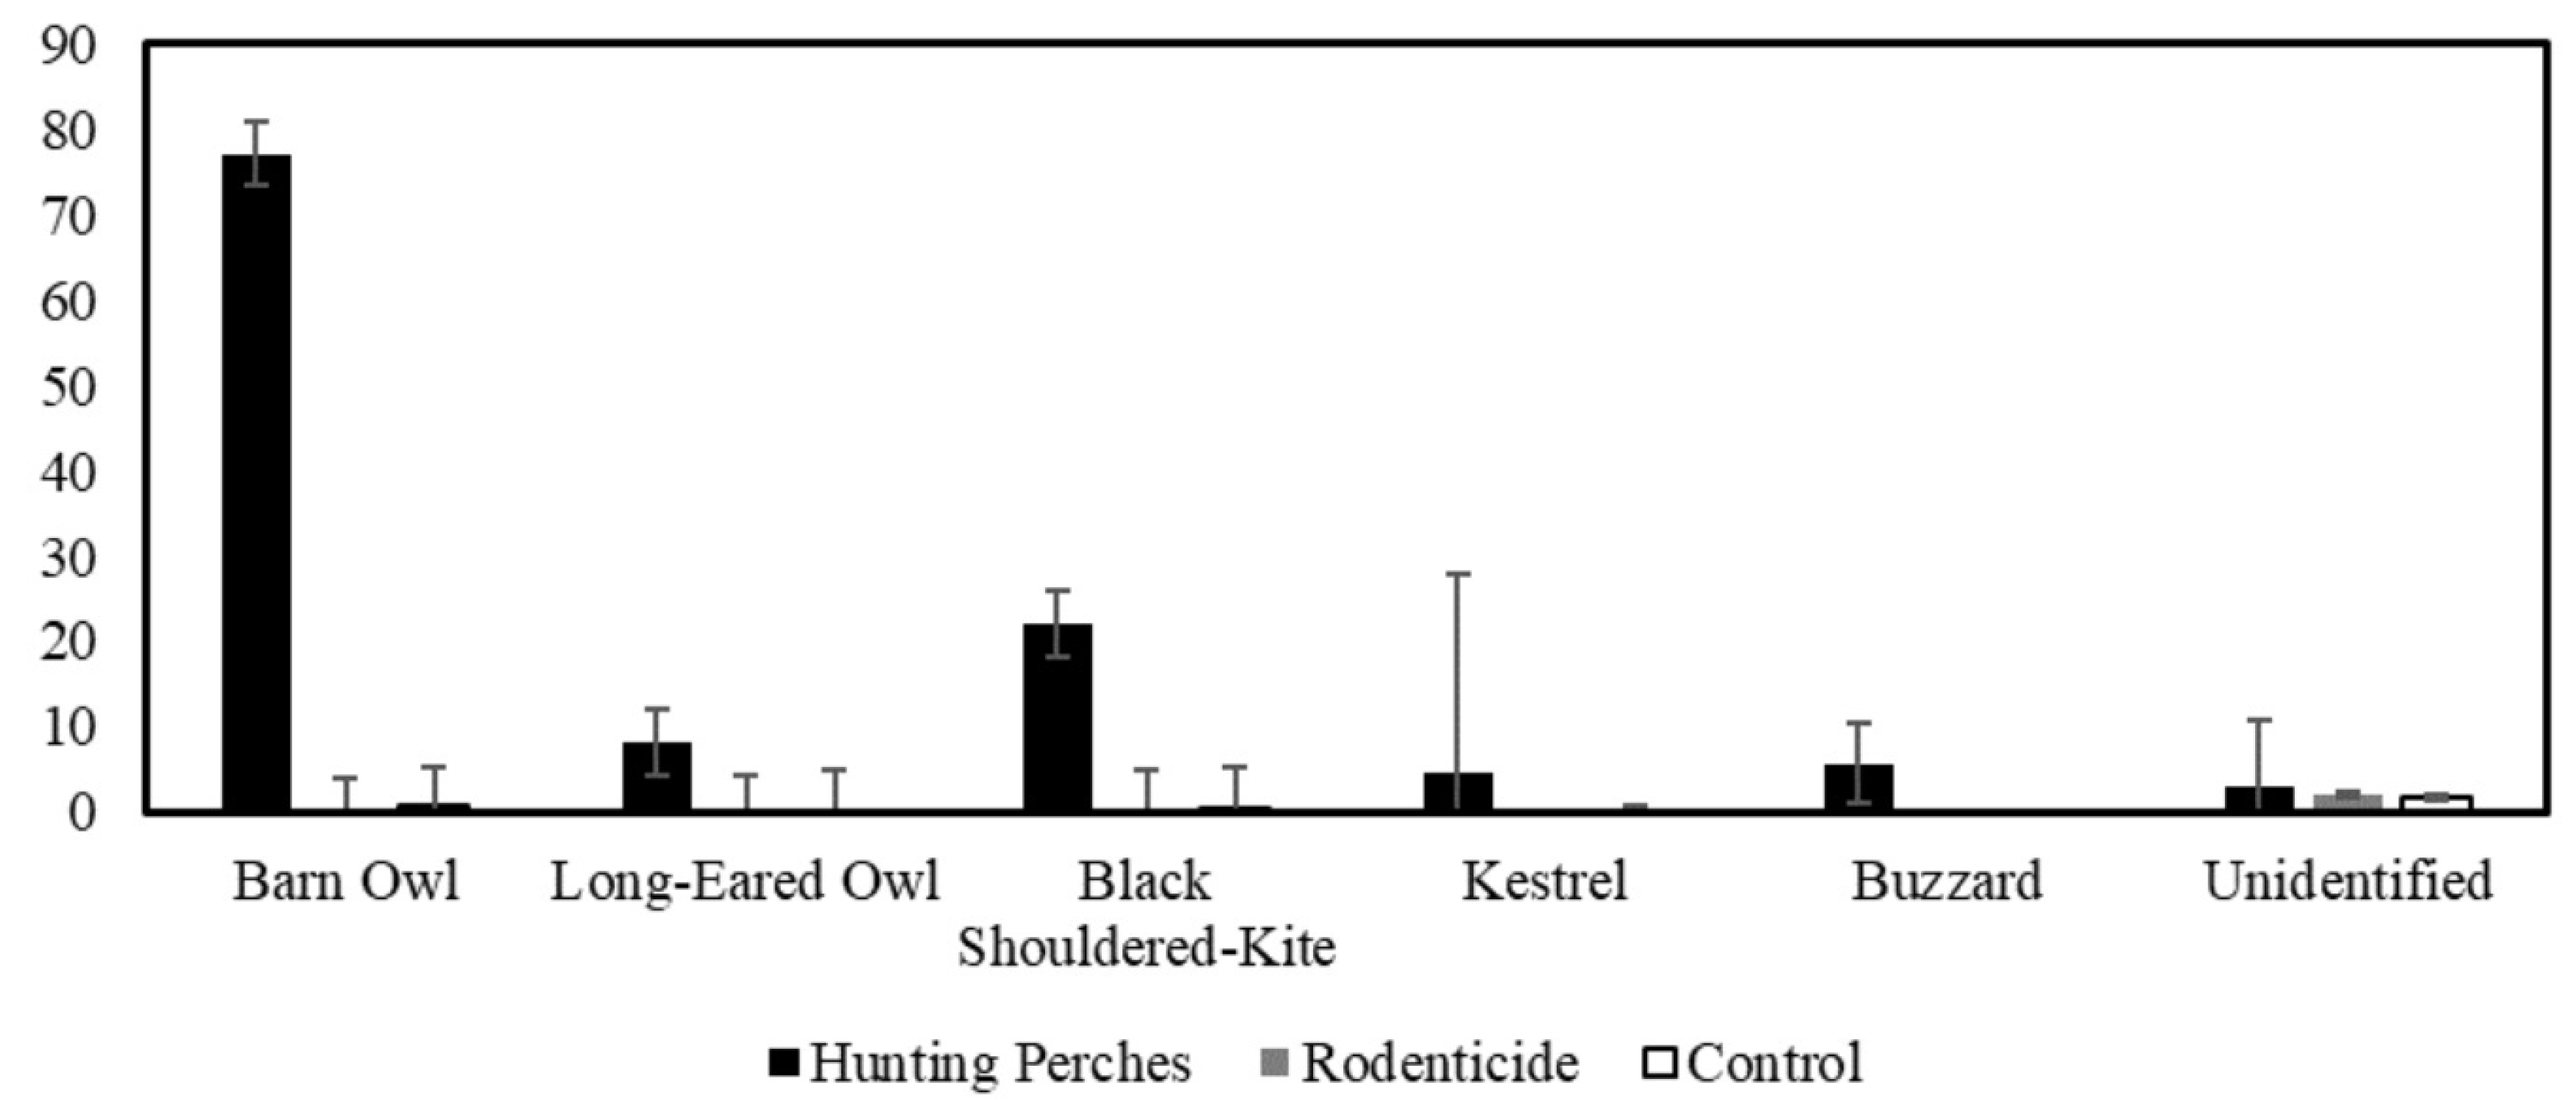
Figure 8.
The relationship between the number of burrows counted and the number of appearances of barn owls (open circle trendline, n = 13) and Black-Shouldered Kite (dashed black line, n = 13) in Hunting Perches- treated plots.
Figure 8.
The relationship between the number of burrows counted and the number of appearances of barn owls (open circle trendline, n = 13) and Black-Shouldered Kite (dashed black line, n = 13) in Hunting Perches- treated plots.

Table 1.
The 15 plots we selected for the three treatments did not differ in terms of the number of rodent activity (burrows) or vegetation index (NDVI) at the start of the study.
Table 1.
The 15 plots we selected for the three treatments did not differ in terms of the number of rodent activity (burrows) or vegetation index (NDVI) at the start of the study.
| Treatment | Burrows | NDVI | ||
|---|---|---|---|---|
| Mean | Std Dev | Mean | Std Dev | |
| Hunting Perches (n=15) | 11.1 | 12.6 | 0.884 | 0.017 |
| Rodenticide (n=15) | 11.1 | 11.8 | 0.886 | 0.017 |
| Control (n=15) | 11.4 | 17.0 | 0.883 | 0.015 |
| Kruskal-Wallis | H = 0.54, df = 2, P = 0.76 | H = 0.15, df = 2, P = 0.93 | ||
Table 3.
Events and performance metrics for the semi-automatic analysis. Evaluation of camera identification was calculated as True Positives (TP, a raptor was correctly detected), False Positives (FP, a raptor was wrongfully detected), False Negatives (FN, a raptor was not detected), Recall (TP/(TP+FN)), and Precision (TP/(TP+FP).
| Time | Behavior | TP | FP | FN | Recall | Precision |
| Day | Flying | 11 | 4 | 2 | 0.85 | 0.73 |
| Hovering | 14 | 2 | 2 | 0.88 | 0.88 | |
| Perching | 8 | 0 | 0 | 1.00 | 1.00 | |
| Night | Flying | 3 | 1 | 0 | 1.00 | 0.75 |
| Perching | 41 | 0 | 0 | 1.00 | 1.00 |
Table 4.
Mean number of raptor visits and duration (minutes) in 48 hours ± SE by different behaviors.
Table 4.
Mean number of raptor visits and duration (minutes) in 48 hours ± SE by different behaviors.
| Number of visits | Perching | Hovering | Flying |
| Hunting Perches (n=13) | 24.46 ± 4.64 | 2.69 ± 1.74 | 17.54 ± 4.12 |
| Rodenticide (n=11) | 0.00 ± 0.17 | 1.64 ± 0.59 | 24.82 ± 4.92 |
| Control (n=8) | 0.00 ± 0.17 | 1.13 ± 0.72 | 21.75 ± 5.23 |
| Duration | |||
| Hunting Perches (n=13) | 116.96 ± 25.97 | 0.99 ± 0.67 | 2.93 ± 1.05 |
| Rodenticide (n=11) | 0.00 ± 0.17 | 0.44 ± 0.17 | 2.19 ± 0.41 |
| Control (n=8) | 0.00 ± 0.17 | 0.28 ± 0.21 | 2.67 ± 1.04 |
Disclaimer/Publisher’s Note: The statements, opinions and data contained in all publications are solely those of the individual author(s) and contributor(s) and not of MDPI and/or the editor(s). MDPI and/or the editor(s) disclaim responsibility for any injury to people or property resulting from any ideas, methods, instructions or products referred to in the content. |
© 2025 by the authors. Licensee MDPI, Basel, Switzerland. This article is an open access article distributed under the terms and conditions of the Creative Commons Attribution (CC BY) license (http://creativecommons.org/licenses/by/4.0/).
Copyright: This open access article is published under a Creative Commons CC BY 4.0 license, which permit the free download, distribution, and reuse, provided that the author and preprint are cited in any reuse.


