
Submitted:
04 July 2025
Posted:
07 July 2025
You are already at the latest version
Abstract
We aimed to evaluate whether, in the early phase of sepsis, the coherence between ab-normalities in parameters of macrocirculation — using the shock index (SI, HR/SBP) — and microcirculation (lactate levels, LAC) is maintained and yields prognostic value. We performed a retrospective analysis, including all patients with sepsis admitted to the Emergency Department High-Dependency Unit, between 2008 and 2024, June. The endpoints were day-7 and day-28 mortality. Upon admission to the Emergency De-partment (T0), the population was divided into 3 subgroups, based on the following criteria: G1, (235 patients, 17%) with SI < 0.7 and LAC < 2 mmol/L; G2 with SI > 0.7 or Lac > 2 mmol/L; G3 SI > 0.7 and Lac > 2 mmol/L. We included 1392 patients, mean age 75±14 years, 56% male. At the univariate analysis, we confirmed that G3 patients had a significantly higher day-7 mortality risk (OR 2,1, 95% CI 1.40-3.22) and day-28 mor-tality risk (OR 1,56, 95% CI 1.1 -2.1) than other subgroups. After adjustment for age and SOFA score, the higher day-7 mortality rate was confirmed (OR 1.63, 95%CI 1.05-2.55, p=0.032) for G3 patients. We concluded that only an associated abnormality of macro- or microhemodynamics was independently associated with an increased mortality.
Keywords:
sepsis
; shock index
; lactate
; emergency department
1. Introduction
Sepsis and septic shock are clinical conditions affecting millions of people worldwide every year, representing one of the leading causes of mortality and disability. Recent literature agrees in attributing a mortality rate of approximately 30–40% to septic shock [1], despite advancements in management strategies and targeted treatments such as early antimicrobial administration. The most recent Surviving Sepsis Campaign [2] guidelines emphasize the relevance of an early recognition of sepsis to prompt an appropriate treatment. The proposed endpoints to assess treatment efficacy focus on macrohemodynamic parameters, such as heart rate and blood pressure, as well as the reduction of lactate levels.
The shock index (SI) is calculated as the ratio of heart rate to systolic or diastolic blood pressure (respectively, SSI and DSI). Systolic and mean blood pressure (SAP and MAP) are early reduced in states of shock with a relevant component of hypovolemia, which is present during sepsis as a result of dehydration and altered endothelial permeability, with increased fluid shift into the extracellular space. Diastolic blood pressure (DAP) expresses the integrity of vascular tone, with vasoplegia representing a key characteristic of the hemodynamic derangement during sepsis. The two values reflect different features of the cardiovascular involvement during sepsis, but in actuality, SBP or MAP are the end-points during early resuscitation in septic patients. On the other side, normalization of macrohemodynamic parameters does not always correspond to an improvement in microcirculatory perfusion, and this discrepancy can be associated with an adverse outcome [3] .
In patients with sepsis, especially in the early stages, an increase in blood lactate levels is frequently observed. The increase in lactate levels in septic patients finds several pathophysiologic mechanisms: the activation of the anaerobic metabolism due to an imbalance in oxygen delivery, as well as the impairment of the enzymes involved in Krebs’ cycle, plays a key role, with the cytokine storm and the beta-adrenergic stimulation contributing to its increase [4]. A possible coexistent hepatic dysfunction may reduce its clearance, contributing to elevated LAC levels [5]. It is now established that lactate is also produced under aerobic conditions [6], and it gives a global picture of microcirculation, without allowing us to appreciate possible discrepancies in different districts. Experimental studies showed that cerebral microcirculation is preserved during septic shock, while splanchnic or muscular tissue may undergo prolonged hypoperfusion.
Anyway, in the earliest stages of sepsis, it can be considered a surrogate parameter of microcirculatory function and serves as an indirect indicator of tissue perfusion. It has been repeatedly demonstrated that the presence of increased levels is associated with an unfavorable prognosis in critically ill patients [5,6,7,8,9]
It remains unknown to what extent hemodynamic incoherence [10], meaning a mismatch between macro- and microcirculatory function, is present in the early stages of sepsis and how it correlates with prognosis. The present study aimed to determine the extent to which early alterations in systemic circulation parameters were associated with microcirculation abnormalities and to assess their respective prognostic value.
2. Results
During the study period, 1392 patients diagnosed with sepsis or septic shock were admitted to the ED-HDU, and they represented our study population. The mean age was 75±14 years, 56% male sex. In Table 1, we reported previous medical conditions, the most frequent sources of infection, and the SOFA (Sequential Organ Failure Assessment) score in the whole population.
Evaluation upon ED presentation
Upon ED admission, 1055 patients (76%) showed a SSI > 0.7 and a higher day-7 mortality than those with normal SI (21% vs 14%, p=0.010), in the absence of significant differences for day-28 mortality rate (27% vs 31%, p=0.118). In the same way, 585 patients (42,5%) had a DSI>1.7 and their day-7 and day-28 mortality rate was higher compared to those with normal DSI. Conversely, 682 patients (49%) had a lactate level > 2 mmol/L and a higher day-7 (24% vs 15%, p<0.001) and day-28 mortality rate (34% vs 27%, p=0.03) than those with normal lactate levels.
AS SSI cut-off are clearly recognized, we based on it the division in subgroups, to evaluate hemodynamic coherence. At T0, the 3 subgroups showed the following numerosity: 235 (17%) patients in G1, 574 (41%) patients in G2, and 582 (42%) in G3. We evaluated the possibility of splitting G2 into two subgroups, respectively patients with abnormal LAC (n=97, 6%) or with abnormal SI (n=477, 34%). The subgroup with isolated LAC alteration was too small compared to the others (T0: 97 patients, 7%; T24: 83 patients, 6%), precluding a meaningful statistical analysis, so we decided to maintain the association.
In Table 1, we reported the clinical characteristics of the 3 subgroups. Compared to the others, G3 patients had a significantly younger age, lower prevalence of CKD, and a higher prevalence of oncological disease. We did not observe significant differences in the infection source.
Vital signs showed worsening abnormalities in different subgroups, even for parameters not employed for classification, namely the respiratory rate and GCS. In the same way, the SOFA score showed a significant progressive increase across the three subgroups (Table 2).
Among blood tests, G3 patients exhibited higher white blood cell counts than G1, and higher procalcitonin levels than the other subgroups.
Day-7 (14% in G1, 16% in G2, and 25% in G3) and day-28 mortality rate (26% in G1, 27% in G2 and 35% in G3, p<0.05 G1 vs G3 and G2 vs G3 for both end-points) were significantly higher in G3 patients than in the other subgroups (Figure 1, left).
At the univariate analysis, we confirmed that G3 patients had a significantly higher day-7 mortality risk (OR 2,1, 95% CI 1.40-3.22, p<0.001) and day-28 mortality risk (OR 1,56, 95% CI 1.1 -2.1, p=0.009) than other subgroups. After adjustment for age and SOFA score, the higher risk of an adverse prognosis in the very short term was confirmed (OR 1.63, 95%CI 1.05-2.55, p=0.032) for G3 patients, alongside an age >65 years (OR 1.03, 95%CI 1.01-1.04, p<0.001) and a SOFA score>5 (OR 1.20, 95%CI 1.14-1.26). Day-28 mortality rate was not independently associated with the inclusion in one of the 3 subgroups, as defined at T0.
Evaluation after 24 hours
During the first 24 hours, 17 patients (1%) died and were not included in the T24 analysis). At this point 454 patients (33%) had a DSI>1.7 and 868 (63%) had SSI > 0,7 and their day-7 and day-28 mortality rate was higher compared to those with normal value of DSI and SSI.
At T24, J1 included 424 patients (30%), J2 683 patients (50%), and J3 268 patients (20%).
In Figure 2, we tracked patients’ movement from T0 to T24, and we showed that 33% of those in J3 came from G3, 11% from G2, and 6% from G1, confirming that a worse early hemodynamic derangement tends to persist at 24 hours. Among J3 patients, 16% were not on vasoactive medications.
Both day-7 and day-28 mortality rates were significantly higher in J3 compared to the other two groups: (Day-7: 12% in J1, 17% in J2 and 35% in J3; Day-28: 24% in J1, 29% in J2 and 46% in J3; p < 0.01 J3 vs J1 and J3 vs J2), without significant differences between J1 and J2 (Figure 1, right).
Again, the univariate analysis confirmed the association between being part of J2 or J3 subgroup and an increased day-7 mortality rate (respectively, OR 1.47, 95% CI 1.04-2.1, p=0.029 and OR 3.9, 95% 2.67-5.76, p<0.001) and day-28 mortality rate, only for J3 (J2: OR 1.3, 95%CI 0,98-1,72, p=0.060; J3: OR 2.74, 95%CI 1.97-3.81, p<0.001). After the adjustment for age and SOFA score, being part of J3 was independently associated with increased day-7 (OR 2,8, 95%CI 1.74-4,48, p<0.001) and day-28 mortality rate (OR, 95%CI 1.33-3, p<0.001), independent of an age>65 and a SOFA score >5.
We repeated the same analysis with DSI both at T0 and T24, which is reported in Supplementary material and was comparable with the present one.
SSI and DSI independent association with an increased mortality rate was assessed in a multivariate logistic regression, where each of them was adjusted for an age >65 yrs, A SOFA score >5 and LAC >2. Results were reported in Supplementary material. DSI evaluated upon admission was independently associated with an increased day-7 mortality rate, while SSI did not show an independent prognostic value. DSI and SSI evaluated after 24 hours were both independently associated with short- and medium-term mortality rate.
3. Discussion
In a large population of patients with sepsis, evaluated within 24 hours from admission to the ED, we showed that an isolated abnormality in the macro- or microcirculation upon presentation did not yield an unfavorable prognosis [7]. Only a combined derangement of macro- plus microcirculation was independently associated with an increased day-7 and day-28 mortality rate [11]. An early clinical assessment, based on simple bedside parameters, allowed a prognostic stratification for the very short-term mortality rate, especially when DSI was considered.
- Shock Index: prognostic value and molecular mechanisms
The Shock Index (SI) is a simple score used to assess the hemodynamic impact of a clinical condition, expressed as the ratio between heart rate and systolic blood pressure [12]. It is utilized in hemorrhagic, septic, and trauma situations, serving as a more precise indicator than individual vital parameters to identify shock states. Its utility in evaluating patients in emergency departments and acute care settings is well-documented in the literature. The value of SI lies in its ability to identify the cohort of patients with cryptic shock at an earlier stage in the disease process, before the exhaustion of compensatory mechanisms and the development of overt hypotension and circulatory shock [12]. Having the opportunity for meaningful intervention in that early stage could improve patients’ prognosis. SSI was proposed as a criterion for sepsis diagnosis, but it showed low sensitivity, despite a high specificity [13]. In this study, we chose it as an indicator of the macrohemodynamic status for prognostic stratification. The SI may be calculated even by including diastolic blood pressure instead of the systolic value, becoming a bedside parameter reflective of the degree of vasodilation resulting from the failure of vascular smooth muscle to contract While relative fluid depletion or impaired cardiac output are the main causes of reduced SAP or MAP, the activation of several biohumoral systems supports the profound vasodilation. One of the main actors is nitric oxide (NO), produced from arginine by different isoforms of NO synthase, which promotes vasodilation mediated by cyclic GMP-protein kinase G [14]. Inflammatory mediators, including cytokines and Pathogen-Associated Molecular Patterns, like lipopolysaccharide, foster the production of NO to two or three orders of magnitude above baseline, making it a major driver of acute vascular dysfunction during sepsis. The same inflammatory stressors promote the synthesis of Prostacyclin, a potent vasodilator, and subtypes of Endothelins, which, in conditions of inflammatory stress, potentiate inflammatory mediators, further promoting vasodilation by a vicious circle [15]. The inhibition of potassium channels in vascular smooth muscle cells contributes to the depressed vascular tone. It can be induced both by biohumoral stimuli, like endotoxin, and by circulating factors, as hypoxia, acidosis, and increased lactate levels. A reduced effectiveness of catecholamines, and probably corticosteroids, in inducing vasoconstriction, plays a relevant role in the pathophysiology of vasoplegia during sepsis. Presently, this complex framework cannot be assessed in the clinical scenario but may have a role as potential therapeutic target in patients with sepsis, and a reduced diastolic pressure may serve as a surrogate parameter of profound vasoplegia. It was identified as the only value to rely on for the decision of the early initiation of vasoactive medications.
- Lactate levels: prognostic value and molecular mechanisms
In the Big Picture of sepsis, lactate is also a product of altered metabolism and a stimulus that further promotes the vicious circle of inflammation and its deleterious effects, such as vasoplegia [16,17]
Lactate is produced and utilized by nearly all cells during glucose metabolism. The function of the enzyme complex pyruvate dehydrogenase and oxygen availability both play crucial roles. Lack of oxygen and increased pyruvate production, especially through heightened glycolysis, lead to increased lactate production. During sepsis, several mechanisms can cause elevated lactate levels in the presence of normal oxygen supply, including decreased activity of the pyruvate dehydrogenase complex, increased glucose production, and increased activity of the Na+/K+-ATPase [18].
Initially seen as a byproduct of anaerobic metabolism, the presence of elevated lactate levels has been recognized by several experts as an important energy source and a signaling molecule with autocrine, paracrine, and endocrine effects. On the other side, in patients with sepsis, the presence of elevated lactate levels upon ED admission and its persistence over the following days has proven to be associated with an unfavorable prognosis. Whether this is due to persistent hemodynamic imbalance or inadequate oxygen supply, or even to its negative effect on immune function, remains to be clarified. In the context of sepsis, elevated lactate levels have been shown to suppress NF-κB pathway activation, reduce the release of pro-inflammatory mediators, and interfere with glycolysis and ATP synthesis in mast cells. This contributes to the transition from the inflammatory phase to the immunosuppressive phase. The NF-κB (Nuclear Factor kappa B) signaling pathway is essential for regulating gene expression, linked to immune function, inflammation, cell survival, and stress responses.
- Hemodynamic incoherence during sepsis: does it have a role in the ED?
It is well known that, during sepsis, a dissociation may occur between parameters reflecting macrocirculation function, such as blood pressure and heart rate, and those indicating microcirculation function, which can lead to inadequate tissue perfusion [8]. The timing and duration of this dissociation are not fully understood. Patients with sepsis and septic shock often present to the ED without showing the true onset of the septic process [19]. The disease can start subtly as an uncomplicated infection, leading to home-based therapeutic interventions. Therefore, the patient's arrival at the ED may not represent the actual beginning of sepsis [19]. Most studies that identified hemodynamic incoherence in sepsis patients were conducted in the ICU and relied on assessments of the sublingual microcirculation [3].
We do not know to what extent the dissociation could be present upon admission to the ED and whether it could be assessed by a surrogate parameter, like lactate. Previous studies showed that hemodynamic incoherence developed after early resuscitation, but studies were very heterogeneous in terms of clinical setting, treatment before and after the evaluation, and timing of the evaluation.
The microcirculation alterations are initially due to the inflammatory state and the cytokine storm and may even be worsened by the early treatment [20]. Its cornerstones, fluids, and vasoactive agents can improve macrohemodynamics, but have contrasting effects on the microcirculation. The administration of fluids may increase extravascular water, especially in the lungs, while vasoactive drugs cause vasoconstriction; both mechanisms can worsen tissue perfusion [21]. Therefore, they could play a role in the persistence of microcirculatory derangement despite normalization of heart rate and blood pressure. Current guidelines recommend monitoring lactate levels during resuscitation to ensure a corresponding improvement in peripheral perfusion, with adequate oxygenation and metabolic support [2].
Our results indicate that, upon admission to the ED, a relevant proportion of patients showed an impending shock, without signs of hypoperfusion, while those with isolated abnormalities in tissue perfusion represented a minority. The picture did not change significantly after 24 hours, indicating that the early treatment did not induce an isolated normalization of macro-hemodynamics, or at least it could not be captured by parameters available at the bedside. From a prognostic point of view, upon ED presentation, only a combined abnormality of macro- and micro-hemodynamics was associated with an increased short- and medium-term mortality rate. These results were confirmed both with systolic and diastolic Shock index, or, in other words, both considering the relative hypovolemia or the reduced vascular tone components of hemodynamic derangement. For the earliest evaluation, the independent association was confirmed only for the short-term mortality rate: a bedside assessment with limited parameters allowed the identification of a group at high risk of day-7 mortality, independent of age and the degree of organ function derangement. The day-28 outcome is strongly determined by ongoing organ failure, secondary infections, and possible immunodepression, and it is plausible that an early evaluation based on vitals does not maintain an independent value. To the best of our knowledge, with the limitation inherent to the study's retrospective design, this is one of the first demonstrations of the respective prognostic value of baseline SI and LAC upon ED admission and after the early treatment. Identifying high-risk patients at the very beginning of the disease, with simple bedside parameters, could help emergency physicians decide the most appropriate disposition for them.
When we evaluated the independent contribution of each component in a multivariate analysis, only the T0 Diastolic Shock Index was associated with an unfavorable prognosis. We can hypothesize that vasoplegia is linked to a complex inflammatory activation that can worsen organ damage and impair immune function.
Upon T24 evaluation, the disease had evolved, and hemodynamic status was determined by the response to early treatment, with possible overt circulatory shock. Most J3 patients derived from the group with baseline combined macro- and micro-circulatory derangement. Again, an isolated abnormality in SI or LAC did not demonstrate an association with increased mortality. On the other side, we observed that the early treatment did not determine a hemodynamic incoherence appreciable by SI and lactate levels assessment, with derangement in macro-hemodynamic parameters paralleling those in micro-hemodynamic parameters. We based our observation on parameters commonly employed in the clinical arena, as despite an imperfect representation of the hemodynamic picture, they allowed us to give clinicians a reference easily reproducible at the bedside. Sublingual microvascular assessment is not feasible in the ED, so an accurate assessment of microvascular perfusion is not available in the actuality. Prospective studies are needed to confirm these results and to evaluate peripheral perfusion by serial evaluations of multiple clinical parameters.
4. Materials and Methods
This retrospective study included all patients admitted for sepsis or septic shock to the Emergency Department High-Dependency Unit of the University Hospital Careggi, Florence, Italy, from June 2008 to June 2024.
The Local Ethics Committee (Toscana Area Vasta Centro) and the Institutional Review Board approved the study (n. OSS_28102)
Sepsis diagnosis was based on the 2001 SCCM/ESICM/ACCP/ATS/SIS criteria up to 2016 [8] and Sepsis-3 Criteria thereafter [9]. The only exclusion criterion was an age < 18 years.
Data were extracted from electronic medical records following a standardized template. We collected data about previous medical conditions, vital signs, arterial blood gas parameters, and blood tests, both upon admission to the Emergency Department (ED, T0) and after 24 hours (T24). The primary endpoints were day-7 and day-28 mortality rates.
Lactate levels were dichotomized as < or ≥ 2 mmol/L [10]. The systolic shock index was calculated as the ratio between heart rate and systolic blood pressure and was dichotomized as < or ≥ 0.7 [11].
The diastolic shock index was calculated as the ratio between heart rate and diastolic blood pressure and was dichotomized as < or ≥ 1.7. In the literature, no definitive cut-off values have been established as with the previously mentioned variables, so the mean value from our population was used.
Other dichotomized variables included age, using 65 years as the cutoff, and SOFA > 5, as indicated in the literature.
At T0, the study population was divided into 3 subgroups, based on the values of SI and lactate levels: G1: (patients with SI < 0.7 and Lac < 2 mmol/L); G2: (patients with SI > 0.7 or Lac > 2 mmol/L); G3: (patients with SI > 0.7 and Lac > 2 mmol/L).
At T24, the study population was divided into 3 subgroups, based on the values of SI and lactate levels (with the same cutoff as for the T0 groups) and the presence of vasopressor support: J1T24: (patients with SI < 0.7 and Lac < 2 mmol/l, without vasopressors); J2: (patients with SI > 0.7 or Lac > 2 mmol/L, without vasopressors); J3 : (patients with SI > 0.7 and Lac > 2 mmol/L or with ongoing vasopressor).
- Statistical Analysis
Dichotomous variables were reported as absolute numbers and percentages, while continuous variables were reported as mean ± standard deviation or median and interquartile range based on their distribution.
We analyzed continuous variables with normal distribution by Analysis of Variance, with Bonferroni as a post-hoc test. Dichotomous variables were analyzed by the Chi-square test and Bonferroni correction. A multivariate analysis is also performed using the binary logistic regression method.
Analyses were performed using Jamovi 2.6.44®
5. Conclusions
In patients with sepsis or septic shock, an early bedside assessment based on a few simple parameters allowed the identification of patients at increased risk of an adverse short-term outcome, independent of two known prognosticators in sepsis, namely an advanced age and a higher SOFA score. On the other side, during the early 24 hours, we did not observe a significant hemodynamic incoherence with an assessment based on bedside parameters, and only a combined derangement of parameters of macro- and micro-hemodynamics yielded an adverse prognosis. In the era of precision medicine, in the attempt to better characterize patients with sepsis, to tailor the treatment to the individual patient, a bedside early evaluation allowed identifying those at increased risk of unfavorable prognosis. Besides an always useful prognostic stratification, the next step will be to understand whether and how these findings may guide early treatment.
Author Contributions
F.I. and F.P. designed the study; M.D.C., E.P., B.L., and M.U. contributed to data collection and analysis; F.P., M.A.P., and F.I. made the final analysis; F.P. and M.A.P. wrote the manuscript; F.P. finalized figures and tables; F.I. performed the final revision of the manuscript.
Funding
This research received no external funding
Institutional Review Board Statement
The study was conducted in accordance with the Declaration of Helsinki and approved by the Ethics Committee of Toscana Area Vasta Centro (protocol code n. OSS_28102).
Informed Consent Statement
No need
Conflicts of Interest
The authors declare no conflicts of interest.
Abbreviations
The following abbreviations are used in this manuscript:
| SSI | Systolic Shock Index |
| DSI | Diastolic Shock Index |
| COPD | Chronic Obstructive Pulmonary Disease; |
| CKD | Chronic Kidney Disease; |
| WBC | white blood cell; |
| PLT | platelets; |
| PCT | procalcitonin |
| INR | International Normalized Ratio |
| MAP | Mean Arterial Pressure |
| SP | Systolic Blood Pressure |
| HR | heart rate |
| RR | respiratory rate |
| P/F | po2/fi02 |
| GCS | Glasgow coma scale; |
References
- Update on Sepsis and Septic Shock: Mortality and Clinical Management. Journal of Clinical Medicine, 12(8), 3188.
- Evans L, Rhodes A, Alhazzani W, Antonelli M, Coopersmith CM, French C, et al. Surviving sepsis campaign: international guidelines for management of sepsis and septic shock 2021. Intensive Care Med. 2021 Nov;47(11):1181–247.
- Vellinga NAR, Boerma EC, Koopmans M, Donati A, Dubin A, Shapiro NI, et al. International Study on Microcirculatory Shock Occurrence in Acutely Ill Patients*: Crit Care Med. 2015 Jan;43(1):48–56.
- Yang H, Du L, Zhang Z. Potential biomarkers in septic shock besides lactate. Exp Biol Med. 2020 Jun;245(12):1066–72. [CrossRef]
- Jeppesen JB, Mortensen C, Bendtsen F, Møller S. Lactate metabolism in chronic liver disease. Scand J Clin Lab Invest. 2013 Jun;73(4):293–9. [CrossRef]
- Kushimoto S, Akaishi S, Sato T, Nomura R, Fujita M, Kudo D, et al. Lactate, a useful marker for disease mortality and severity but an unreliable marker of tissue hypoxia/hypoperfusion in critically ill patients. Acute Med Surg. 2016 Oct;3(4):293–7. [CrossRef]
- Yajnik V, Maarouf R. Sepsis and the microcirculation: the impact on outcomes. Curr Opin Anaesthesiol. 2022 Apr;35(2):230–5. [CrossRef]
- De Backer D, Donadello K, Sakr Y, Ospina-Tascon G, Salgado D, Scolletta S, et al. Microcirculatory Alterations in Patients With Severe Sepsis: Impact of Time of Assessment and Relationship With Outcome*. Crit Care Med. 2013 Mar;41(3):791–9.
- Chertoff J, Chisum M, Garcia B, Lascano J. Lactate kinetics in sepsis and septic shock: a review of the literature and rationale for further research. J Intensive Care. 2015 Dec;3(1):39. [CrossRef]
- Diaztagle Fernández JJ, Castañeda-González JP, Trujillo Zambrano JI, Duarte Martínez FE, Saavedra Ortiz MÁ. Assessment of the shock index in septic shock: A systematic review. Med Intensiva Engl Ed. 2024 Nov;48(11):e10–9.
- De Backer D, Cecconi M, Chew MS, Hajjar L, Monnet X, Ospina-Tascón GA, et al. A plea for personalization of the hemodynamic management of septic shock. Crit Care. 2022 Dec 1;26(1):372. [CrossRef]
- Sahu N, Yee S, Das M, Trinh S, Amoruso R, Connolly M, et al. Shock Index as a Marker for Mortality Rates in Those Admitted to the Medical Intensive Care Unit from the Emergency Department. Cureus [Internet]. 2020 Apr 30 [cited 2025 May 2]; Available from: https://www.cureus.com/articles/26238-shock-index-as-a-marker-for-mortality-rates-in-those-admitted-to-the-medical-intensive-care-unit-from-the-emergency-department.
- Koch E, Lovett S, Nghiem T, Riggs R, Rech MA. Shock index in the emergency department: utility and limitations. Open Access Emerg Med. 2019 Aug;Volume 11:179–99. [CrossRef]
- Collin S, Sennoun N, Dron AG, De La Bourdonnaye M, Montemont C, Asfar P, et al. Vascular ATP-sensitive potassium channels are over-expressed and partially regulated by nitric oxide in experimental septic shock. Intensive Care Med. 2011 May;37(5):861–9. [CrossRef]
- Joffre J, Hellman J, Ince C, Ait-Oufella H. Endothelial Responses in Sepsis. Am J Respir Crit Care Med. 2020 Aug 1;202(3):361–70.
- Lambden S, Creagh-Brown BC, Hunt J, Summers C, Forni LG. Definitions and pathophysiology of vasoplegic shock. Crit Care. 2018 Dec;22(1):174. [CrossRef]
- Levy B, Fritz C, Tahon E, Jacquot A, Auchet T, Kimmoun A. Vasoplegia treatments: the past, the present, and the future. Crit Care. 2018 Dec;22(1):52. [CrossRef]
- Bakker J. Lactate levels and hemodynamic coherence in acute circulatory failure. Best Pract Res Clin Anaesthesiol. 2016 Dec;30(4):523–30. [CrossRef]
- Holmbom M, Andersson M, Berg S, Eklund D, Sobczynski P, Wilhelms D, et al. Prehospital delay is an important risk factor for mortality in community-acquired bloodstream infection (CA-BSI): a matched case–control study. BMJ Open. 2021 Nov;11(11):e052582. [CrossRef]
- Chousterman BG, Swirski FK, Weber GF. Cytokine storm and sepsis disease pathogenesis. Semin Immunopathol. 2017 Jul;39(5):517–28. [CrossRef]
- The ProCESS Investigators. A Randomized Trial of Protocol-Based Care for Early Septic Shock. N Engl J Med. 2014 May;370(18):1683–93.
Figure 1.
Day-7- and day-28 mortality rate in T0 (left) and T24 (right) subgroups.
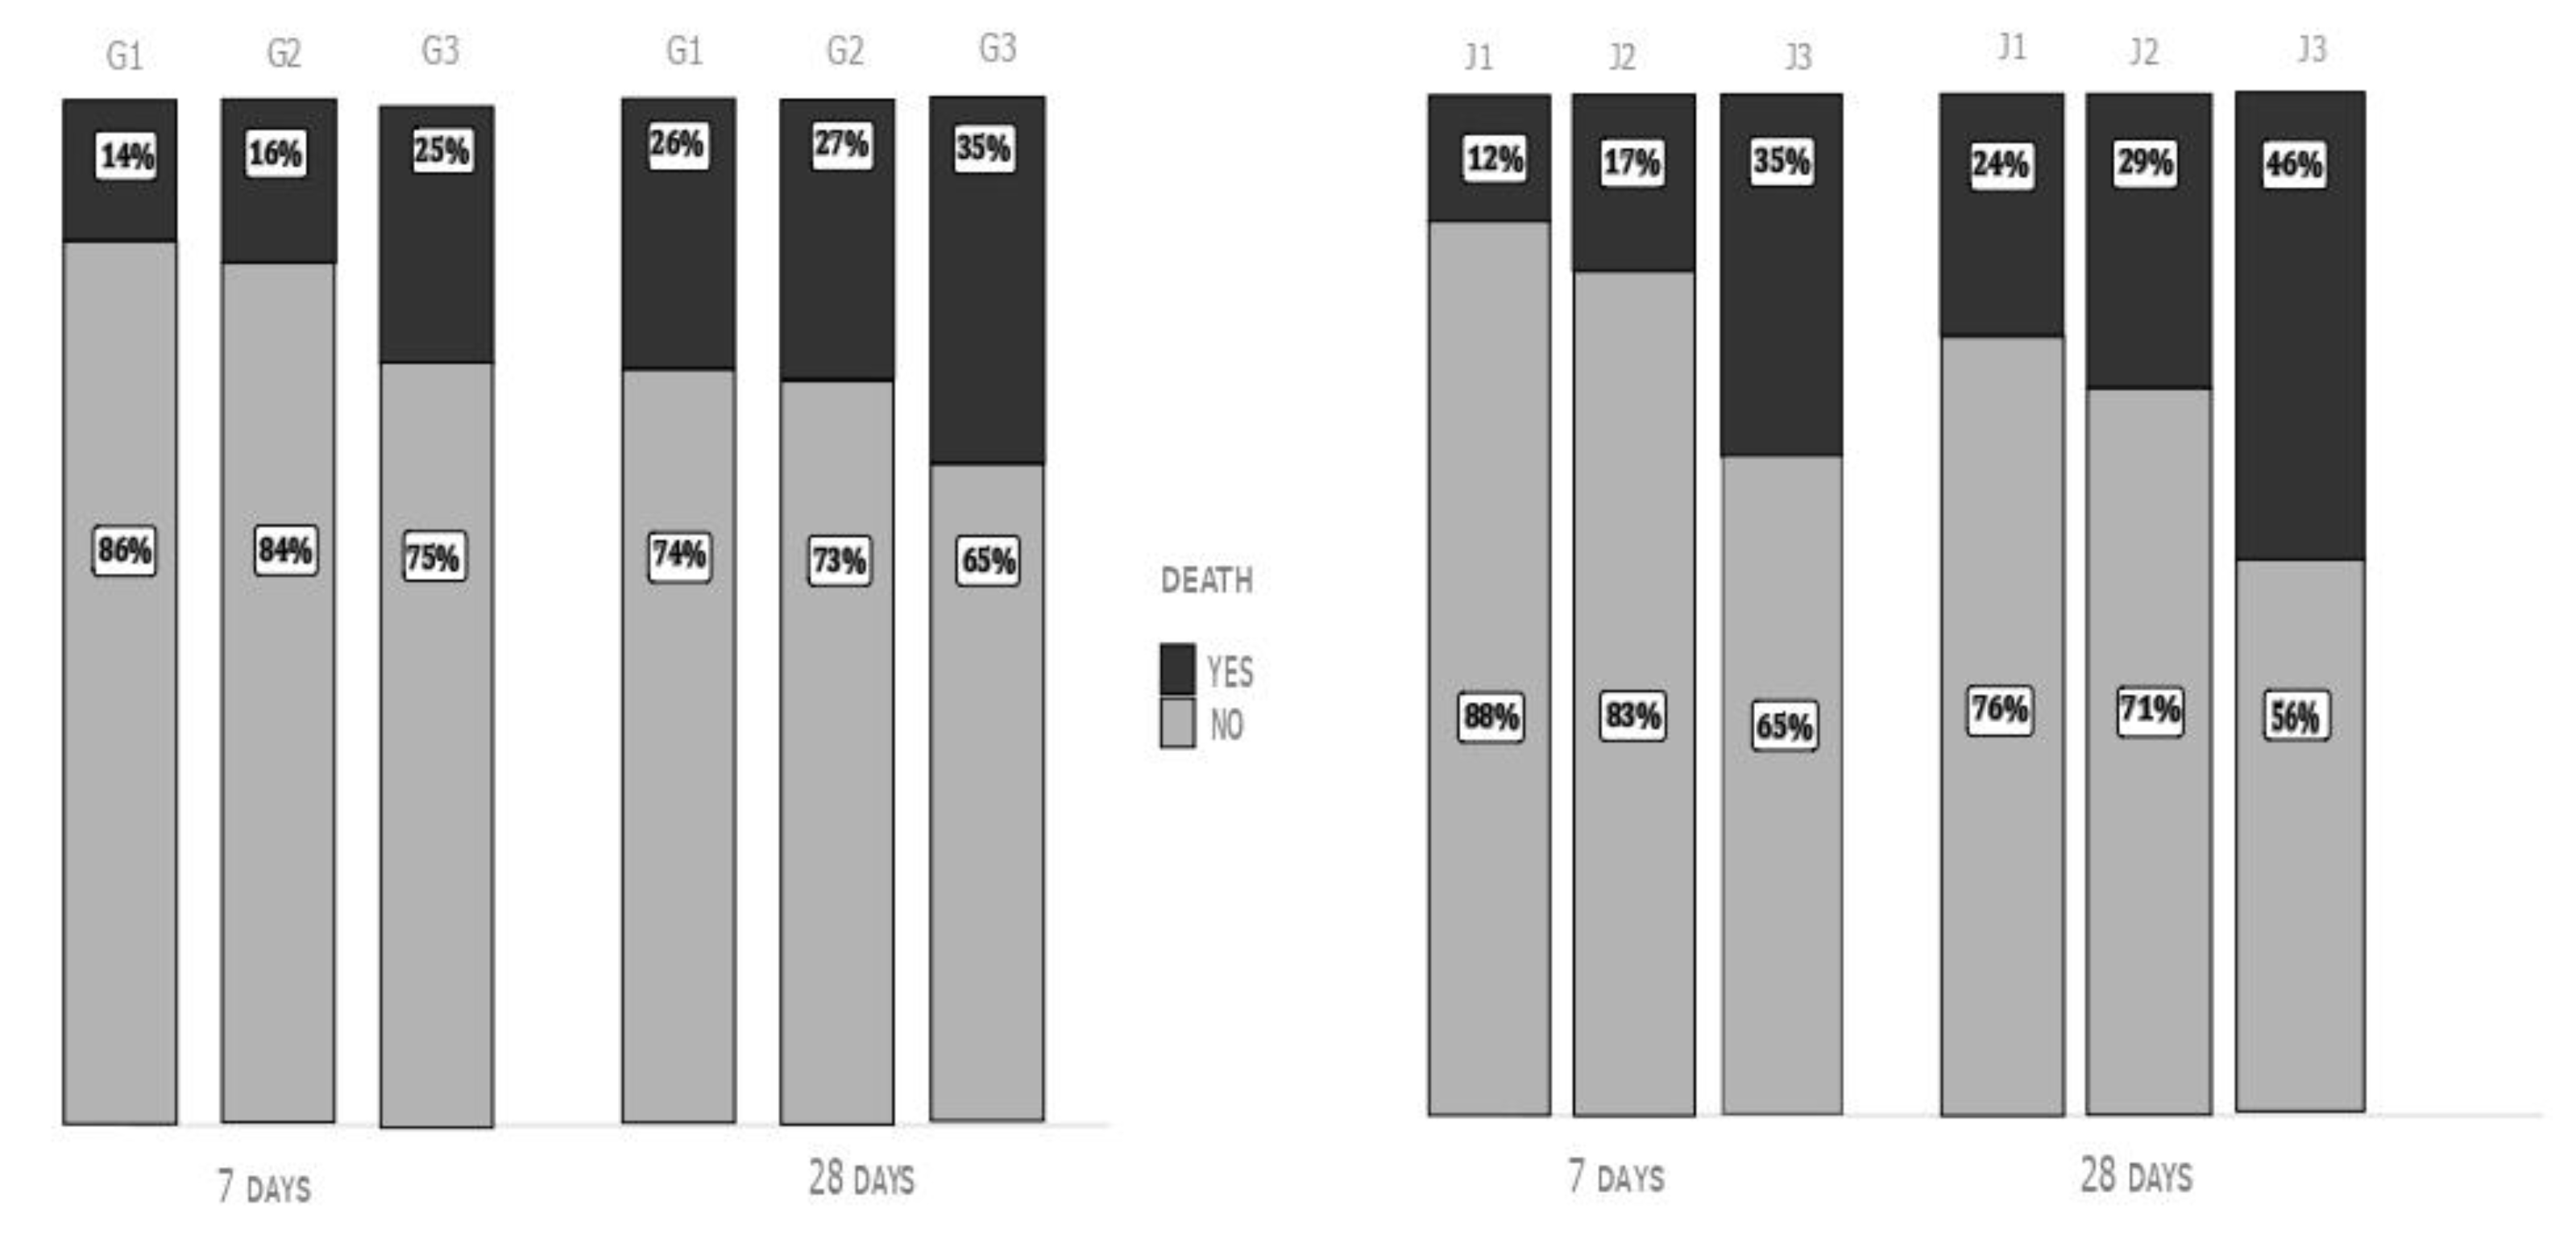
Figure 2.
Transition from subgroups at T0 and subgroups at T24.
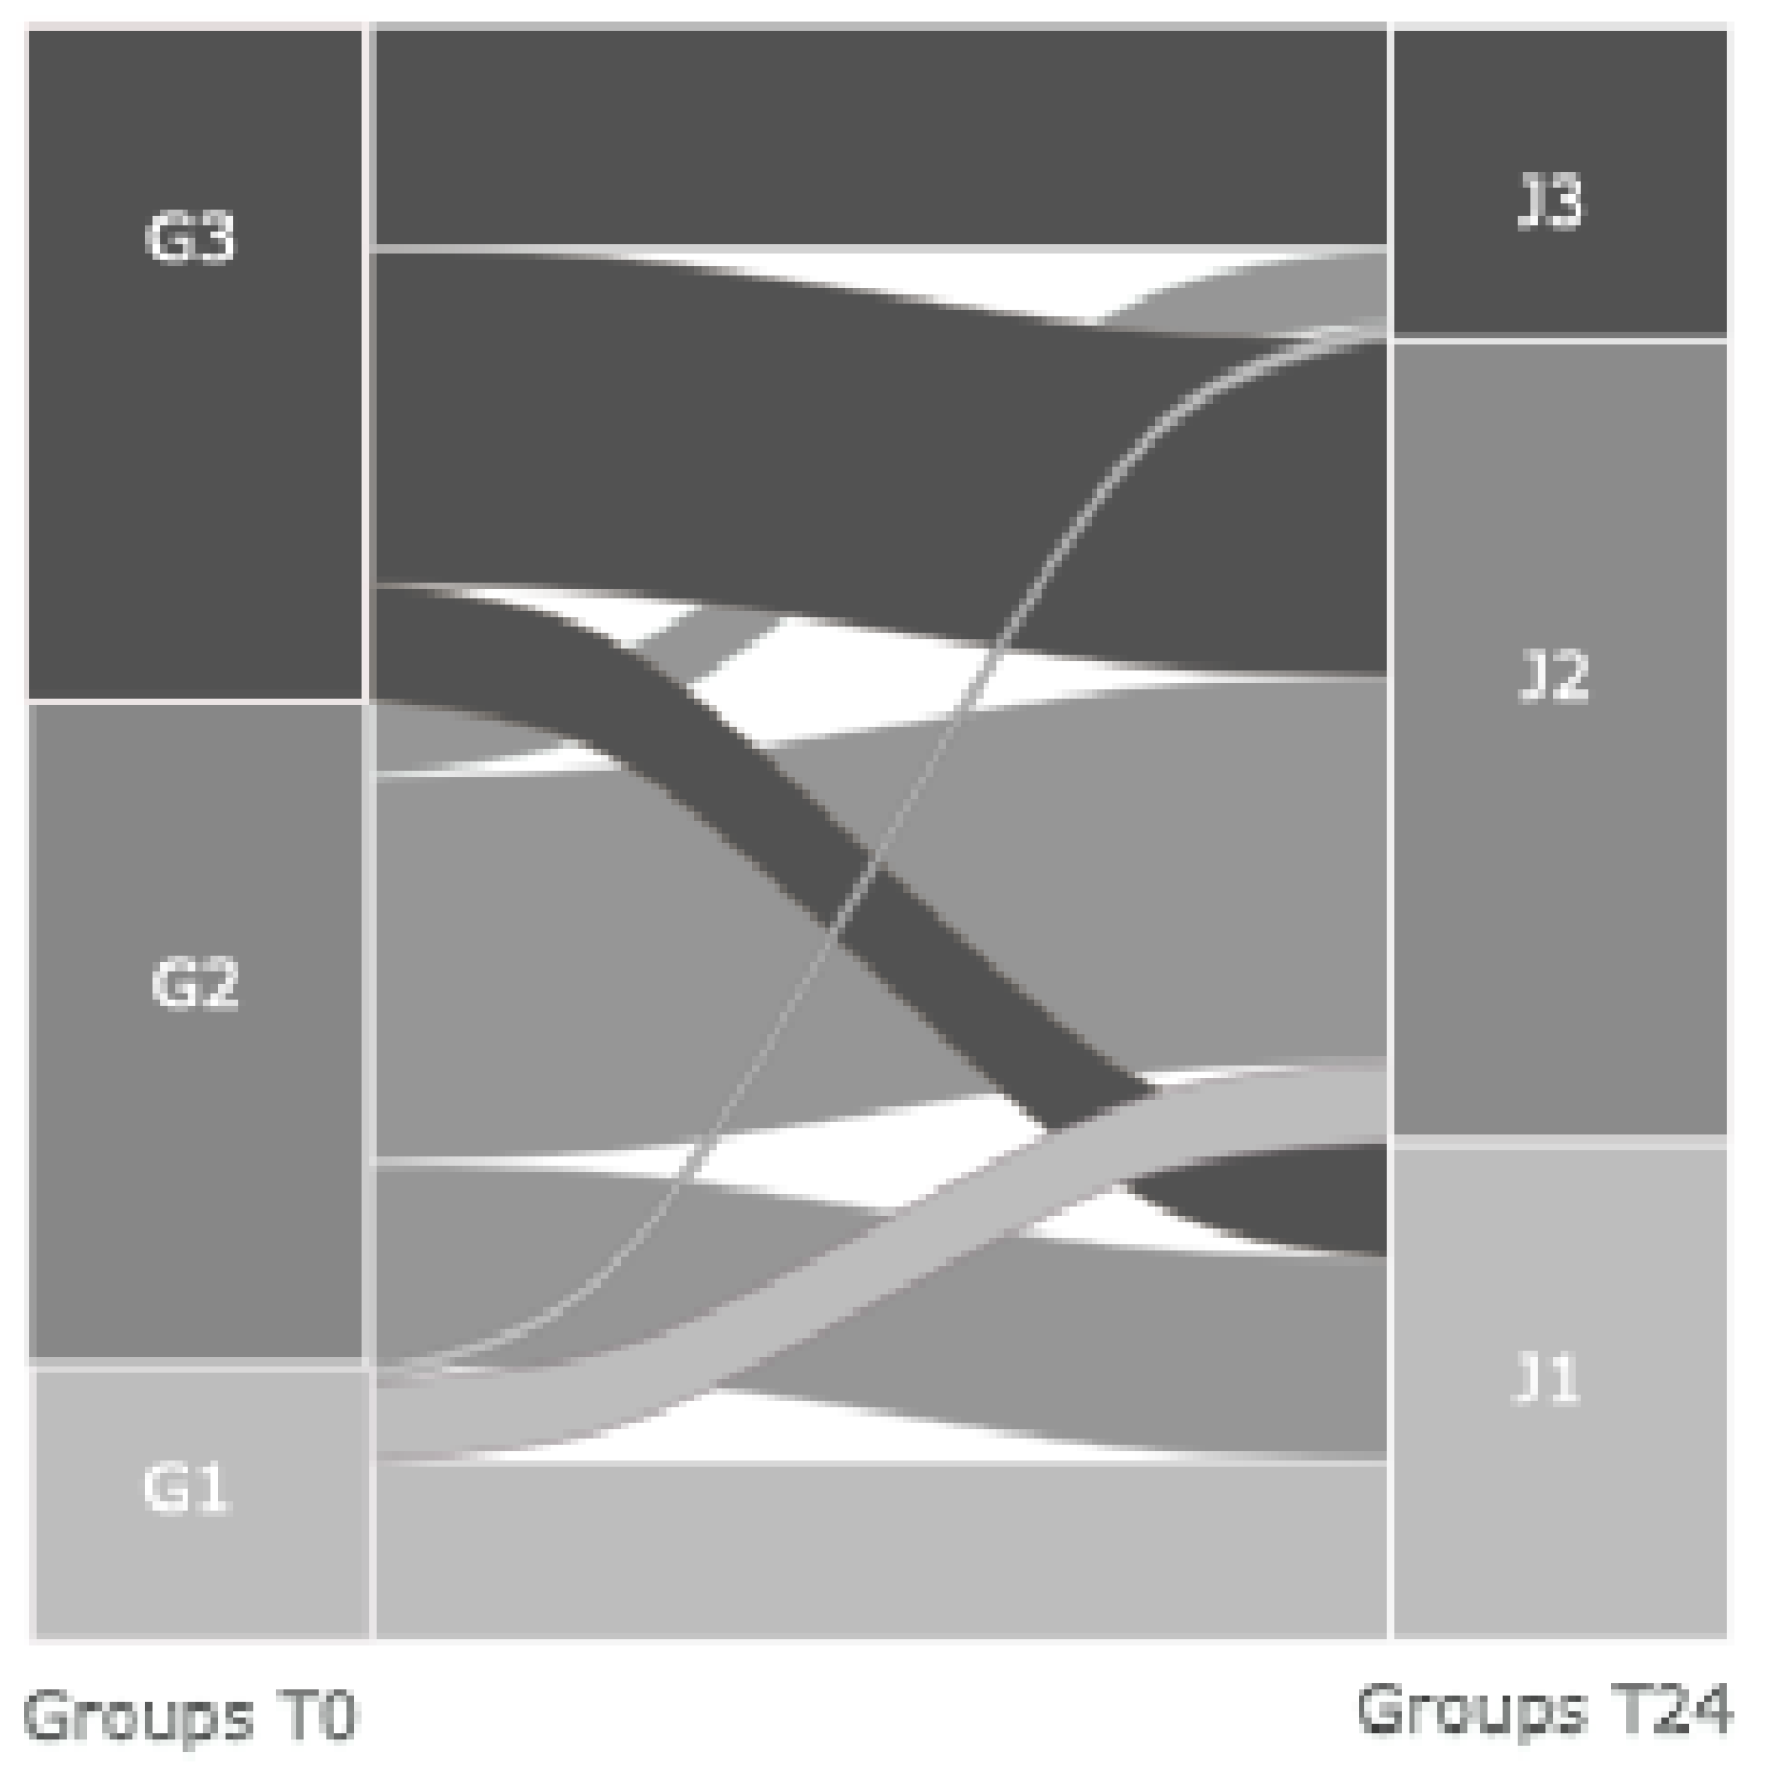

Table 1.
Anamnestic characteristics in the whole study population and in T0 subgroups.
| All (n=1392) |
G1 (n=236) |
G2 (n=574) |
G3 (n=582) |
|
| Male (%) | 779 (56%) | 125 (53%) | 327 (57%) | 327 (56%) |
| Age (Years) | 75±14 | 77 ±13°^ | 74±15 | 74±13 |
| Hypertension (%) | 803 (58%) | 151(35%) | 324 (43%) | 328 (43%) |
| Cancer (%) | 356 (26%) | 46 (20%) ° | 136 (24%) § | 174 (30%) |
| COPD (%) | 314 (23%) | 65 (28%) | 131 (23%) | 119 (20%) |
| IRC (%) | 298 (21%) | 60 (25%) ^ | 141 (25%) § | 97(17%) |
| Diabetes (%) | 282 (27%) | 52 (31%) | 116 (27%) | 115 (20%) |
| Sepsis source | ||||
| Pulmonary | 682 (9%) | 120 (51%) | 281 (49%) | 281 (48%) |
| Urinary | 394 (28%) | 67 (29%) | 176 (31%) | 151 (26%) |
| Other | 311 (22%) | 47 (20%) | 117 (20%) | 147 (25%) |
| Laboratory data | ||||
| WBC (Ux109/L) | 14,6±11 | 13±7°^ | 15±13 | 15±13 |
| PLT (Ux106/L) | 196±118 | 203±193 | 200±114 | 188±121 |
| Bilirubin (mg/dl) | 1,1±1,6 | 0,7±0,8^ | 1,2±2 | 1,3±1,5 |
| Creatinine (mg/dl) | 2±1,7 | 2±1,7 | 2,1±1,8 | 2±1,5 |
| INR | 1.6±1,3 | 1,5±0,8^ | 1,6±1,1 | ±1,7±1,6 |
| PCT (ng/ml) | 38±74 | 23±47^ | 30±66 § | 50±85 |
| 7-days-mortality (%) | 269 (19%) | 32 (14%) ^ | 91 (16%) § | 146 (25%) |
| 28-days-mortality (%) | 426 (31%) | 62 (26%) ^ | 156 (27%) § | 208 (35%) |
Table 2 ^: p<0.05 between 1 and 3; °: p<0.05 between 1 and 2; §: p<0.05 between 2 and 3.
Table 2.
Vital signs and arterial blood gas parameters in different subgroups at T0 and T24. .
| T0 | T24 | |||||||
|
All patients (n=1392) |
G1 (n=236) |
G2 (n=574) |
G3 (n=582) |
All patients (n=1375) |
J1 (n=424) |
J2 (n=683) |
J3 (n=268) |
|
| MAP (mmHg) | 77±18 | 91 ±17 °^ | 76±16 § | 72 ±16 | 78±14 | 83±14 °^ | 75±12 § | 72±14 |
| SBP (mmHg) | 106±29 | 135±26^° | 105±26 § | 95±24 | 110±25 | 130±20 ^° | 104±22 § | 97±24 |
| HR (bpm) | 98±23 | 76±14°^ | 97±21§ | 108±21 | 90±19 | 75±12^° | 95±18 § | 103±17 |
| RR (rpm) | 24±8 | 22±10^ | 23±7 § | 25±8 | 22±6 | 20±5°^ | 22±6 § | 24±7 |
| BT (C°) | 37±1,5 | 36,7±1,5 ° | 37,7±1,3 § | 37,2±1,4 | 37,5±1,4 | 36.5±2 | 36.6±1 | 36.6±1 |
| P/F | 277±16 | 291±107 | 280±116 | 269±118 | 263±117 | 277±113^ | 268±117 § | 230±116 |
| GCS | 15[14-15] | 15 [15-15] ^ | 15 [15-15] § | 15 [14-15] | 15 [15-15] | 15 [15-15] ^ | 15 [15-15] § | 15 [14-15] |
| SSI | 1±0,4 | 0,5±0,1^° | 0,1±0,3 § | 1,2±0,4 | 0,9±0,3 | 0.6±0.1°^ | 0,9±0,3 § | 1,1±0,3 |
| Lactate (mEq/l) | 2,8 ±2,6 | 1,1±0,5 ^° | 1,7±1,4 § | 4,6±3.0 | 1,8±1,8 | 1±0,4^° | 1,4 ±1,3 § | 4±2,6 |
| SOFA score | 5[3-7] | 4 [2-6] °^ | 5 [3-7] § | 5,5[4-8] | 5 [3-7] | 4 [3-6]°^ | 5 [3-7] § | 7[4-9] |
^: p<0.05 between 1and 3; °: p<0.05 between 1 and 2; §: p<0.05 between 2 and 3).
Disclaimer/Publisher’s Note: The statements, opinions and data contained in all publications are solely those of the individual author(s) and contributor(s) and not of MDPI and/or the editor(s). MDPI and/or the editor(s) disclaim responsibility for any injury to people or property resulting from any ideas, methods, instructions or products referred to in the content. |
© 2025 by the authors. Licensee MDPI, Basel, Switzerland. This article is an open access article distributed under the terms and conditions of the Creative Commons Attribution (CC BY) license (http://creativecommons.org/licenses/by/4.0/).
Copyright: This open access article is published under a Creative Commons CC BY 4.0 license, which permit the free download, distribution, and reuse, provided that the author and preprint are cited in any reuse.


