
Submitted:
03 July 2025
Posted:
04 July 2025
You are already at the latest version
Abstract
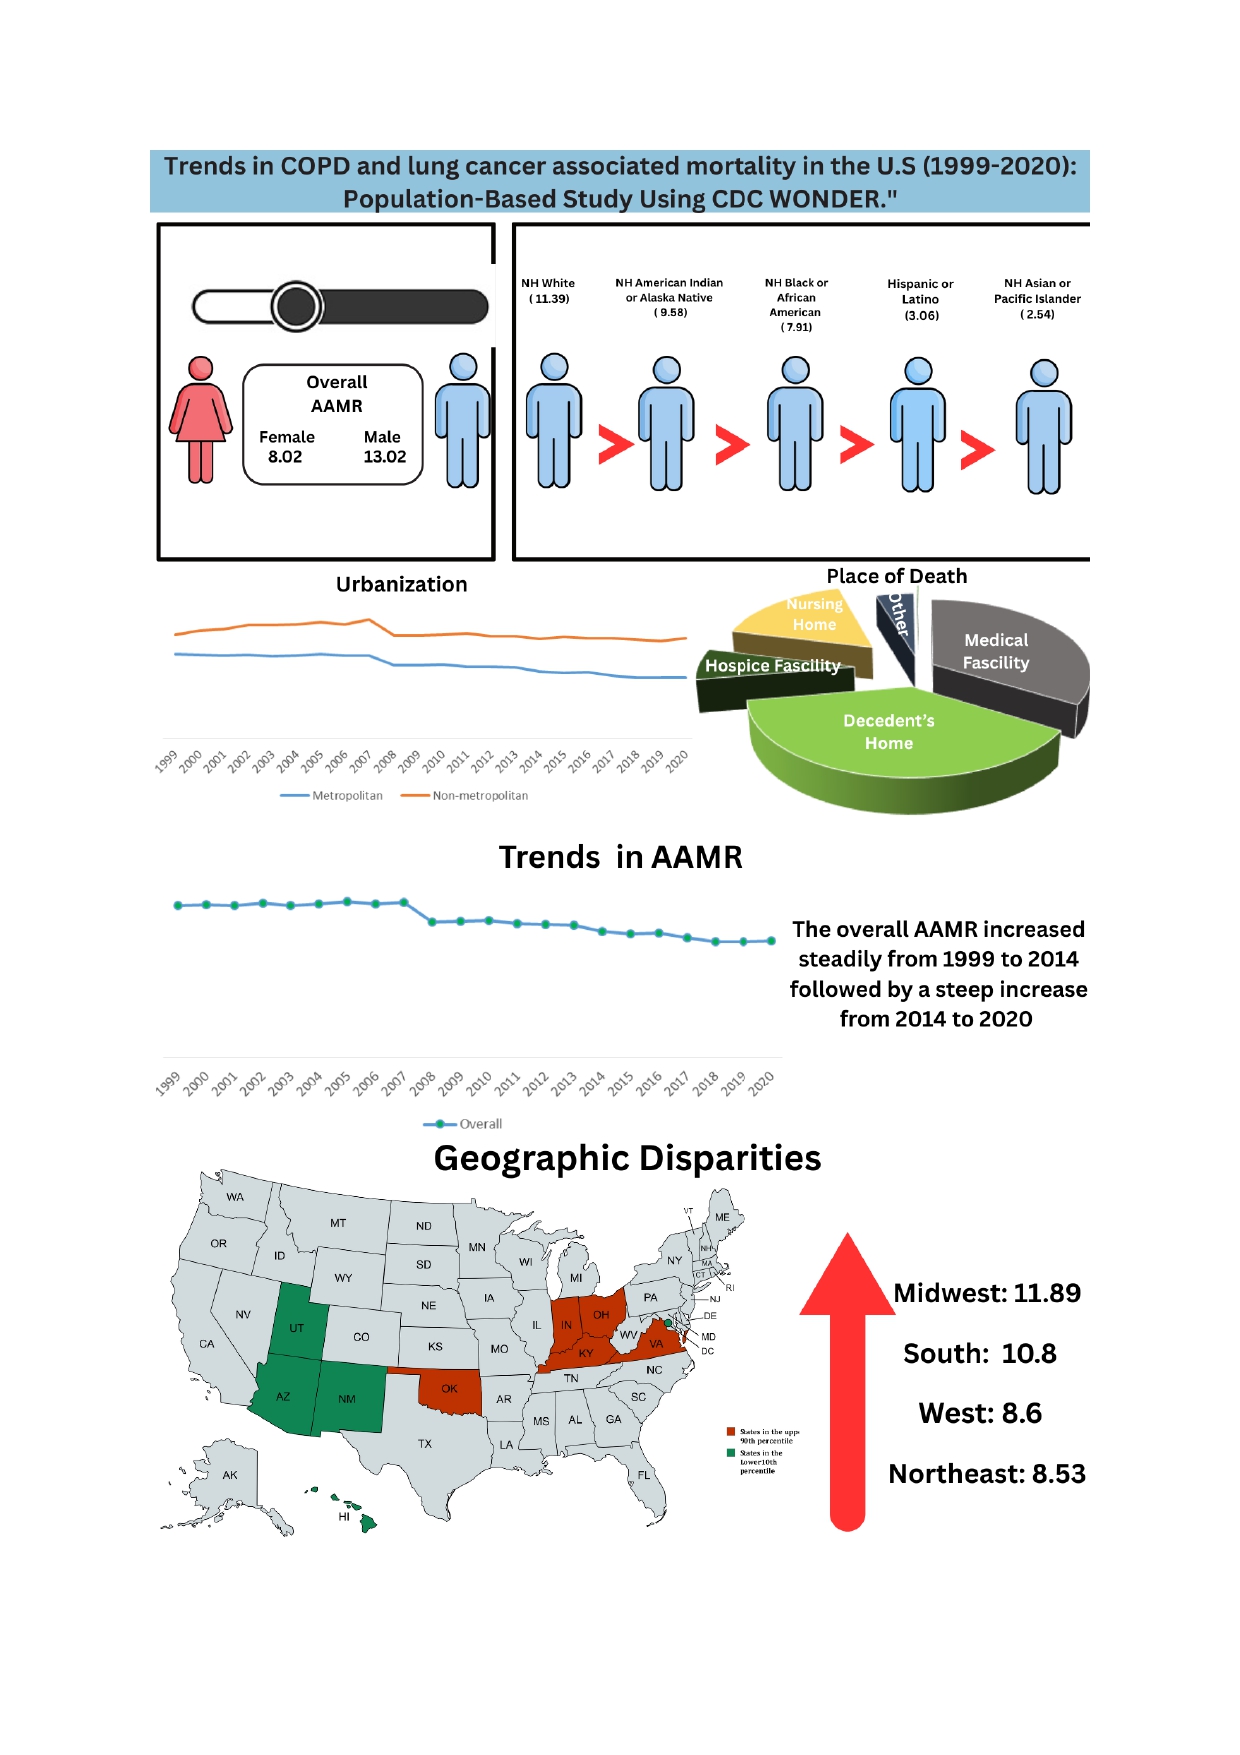
Background: COPD and lung cancer are major global respiratory diseases, with COPD causing irreversible airflow limitation and lung cancer remaining a leading cause of cancer-related deaths.Analyzing mortality trends and health disparities is crucial for shaping effective public health policies and refining prevention strategies for diseases like COPD and lung cancer. Methods: Data was extracted from the CDC WONDER database, the ICD-10 codes used were C34.0-C34.3, C34.8, C34.9 and J41-J44. Age groups were categorized from 25 to 85 and above. We applied Joinpoint regression to calculate both annual and average annual percent change (AAPC) in mortality trends. Data were analyzed based on demographics, census regions, and levels of urbanization. Results: From 1999 to 2020 the total deaths recorded in U.S. were 484941. There was a significant decrease in the AAMR from 1999-2020 (AAPC: -1.40; 95% CI -1.79 to –1.00). COPD and lung cancer-related AAMRs were consistently higher in males than females, with NH White individuals having the highest rates and NH Asian or Pacific Islanders the lowest. Most racial groups saw declining mortality trends from 1999 to 2020, with notable reductions among Hispanics and NH Asian or Pacific Islanders, while NH White individuals initially experienced a slight increase before a steady decline. Nonmetropolitan areas consistently exhibited higher mortality rates than metropolitan areas, initially rising before trending downward, while metropolitan regions saw a continuous decline. Mortality patterns varied by location, with most deaths occurring at home or in medical facilities. Regionally, the Midwest reported the highest AAMR, while West Virginia had the highest state-level mortality rate and Utah the lowest. Conclusion Although COPD and lung cancer mortality have declined overall, persistent disparities across gender, race, and geographic regions underscore inequities in healthcare access. Targeted interventions are essential to bridge these gaps and improve COPD and lung cancer care nationwide.
Keywords:
chronic obstructive pulmonary disease
; mortality
; lung cancer
1. Introduction
Chronic Obstructive Pulmonary Disease (COPD) and lung cancer are two most consequential respiratory pathologies globally, both in terms of prevalence and mortality. COPD is a progressive inflammatory disease having irreversible airflow limitation, often resulting from amassed exposure to noxious stimuli such as tobacco smoke and environmental pollutants [1]
Lung cancer, especially non-small cell lung carcinoma, remains one of the leading cause of cancer-related deaths in United States, frequently developing in the setting of chronic airway inflammation and epithelial injury [2,3]
Over the past two decades, the landscape of respiratory mortality in the U.S. has evolved, conditioned by shifts in smoking behaviours, environmental regulations, screening practices, and healthcare access. Despite over all declines in smoking prevalence, discrepancies persist: Black men, individuals in socioeconomically disadvantaged regions, and rural populations contimue to experience disproportionate burdens of disease and death [4,5]
Notably, the junction between COPD and lung cancer is of surging interest, with increasing data suggesting that COPD is not only a comorbidity but an independent risk factor for lung carcinogenesis, potentially via pathways such as chronic oxidative stress, epithelial-mesenchymal transition and inflammatory cytokine-driven DNA damage [6,7].
2. Methods
2.1. Study Setting and Population
This retrospective population study utilized data produced by the National Center for Health Statistics (NCHS) which is publically available through the Centers for Disease Control and Prevention’s Wide-ranging Online Data for Epidemiologic Research (CDC WONDER) database1. Multiple Cause-of-Death certificates were studied to analyze temporal trends in COPD and lung cancer-related mortality among adults aged ≥25 in the United States from 1999 to 2020 [8]. International Statistical Classification of Diseases, Tenth Revision, Clinical Modification (ICD-10) codes: J41-J44 for COPD and C34 for lung cancer were used. Previous studies also applied the same codes. Institutional review board (IRB) permission was not mandated, as the study employed publicly available, unrestricted, and fully anonymized data. The reporting of this observational study followed the STROBE (Strengthening the Reporting of Observational Studies in Epidemiology) guidelines [9].
2.2. Data Extraction
Data were abstracted and classified by year of occurrence, population size, number of deaths, place of death, demographics, geographic division, census region, and state. Demographic variables comprised race, ethnicity, gender, and age. Race was documented as Hispanic or Latino, non-Hispanic (NH) Black or African American, White, American Indian or Alaska Native, and Asian or Pacific Islander. Location of death was recorded as a medical facility (including outpatient, emergency room, inpatient, and death on arrival), home, hospice, nursing home/long-term care facility, and unknown.
Census regions were segmented into Northeast, Midwest, South, and West, in accordance with U.S. Census Bureau characterizations [10]. The dataset comprises death certificates from all 50 U.S. states and the District of Columbia [11]. Besides, urban and rural categorizations were defined using the 2013 National Center for Health Statistics Urban-Rural Classification Scheme. They classified counties into metropolitan and non-metropolitan regions based on population size, with urban (metropolitan) regions including counties with populations of ≥50,000, and rural (non-metropolitan) areas including counties with populations less than 50,000 [12].
2.3. Statistical Analysis
This study analyzed COPD and lung cancer related mortality from 1999 to 2020 in the United States. To evaluate regional and demographic patterns, crude mortality rates (CMR) and age-adjusted mortality rates (AAMRs) were calculated per 100,000 individuals. Rates were stratified by year, sex, race/ethnicity, age group, urbanization level, and census region, with corresponding 95% confidence intervals (CIs) documented. CMRs were obtained by dividing total deaths due to COPD and lung cancer comorbidity by the respective U.S. population on an annual basis [13]. To enable temporal comparison AAMRs were standardised to the 2000 U.S. population.
Trends in mortality were analysed using the Joinpoint Regression Program (Version 5.3.0, released November 12, 2024) developed by the National Cancer Institute (NCI) [14]. This program provides log-linear regression models to pinpoint changes in AAMRs and calculate annual percent change (APC) with 95% CIs. Average Annual Percent Change (AAPC) over the study period (1999–2020) was calculated as a weighted average of the APCs. The number of joinpoints varied from 0 to 4, following NCI guidelines. The final model selected by the software was based on the permutation test with 4,499 iterations. The parametric method was employed to compute APCs, AAPCs, and their CIs. Trends were assumed statistically significant if the two-tailed P-value was <0.05, based on t-tests.
3. Results
3.1. Annual Trends in COPD and Lung Cancer Related AAMR
A total of 89,162 death certificates were analyzed between 1999 and 2020. There was a significant decrease in the AAMR from 1999-2020 (AAPC: -1.40; 95% CI -1.79 to –1.009; p <0.000001) There was a non-significant increase in AAMR from 1999 to 2005 (APC: 0.07; 95% CI -1.19 to 1.36; p=0.900125) followed by a significant decrease till 2020 (APC: -1.98; 95% CI -2.29 to -1.68; p<0.000001) [Table 5].
3.2. COPD and Lung Cancer Related AAMR Stratified by Gender
The overall AAMR was reported to be higher in males than females (13.02; 95% CI: 12.97-13.07 vs 8.02; 95% CI: 7.98-8.05). Among male, there was an overall significant decrease in AAMR from 1999-2020 (AAPC: -2; 95% CI -3 to -2; p<0.000001). There was a decrease in AAMR from 16.32 in 1999 to 15.31 in 2006 (APC: -0.76; 95% CI -1.32 to -0.20; p=0.010886), followed by a further decrease to 12.97 till 2009 (APC: -5.12; 95% CI -8.95 to -1.13; p=0.016021). This was finally followed by a decrease to 10.42 till 2020 (APC: -2.15; 95% CI -2.43 to -1.87; p <0.000001). Among females there was an overall significant decrease in AAMR from 1999-2020 (AAPC: -1; 95% CI -1 to -0; p=0.004344). There was an increase in AAMR from 8.03 in 1999 to 8.87 in 2005 (APC: 1.51; 95% CI 0.25 to 2.78; p=0.0021139), followed by a decrease to 7.35 till 2020 (APC: -1.36; 95% CI -1.64 to -1.08; p<0.000001) [Table 4].
3.3. COPD and Lung Cancer Related AAMRs Stratified by Race
Upon stratification by race, NH White individuals exhibited the highest overall AAMR (11.39, 95% CI: 11.35-11.42), while NH Asian or Pacific Islander reported the lowest (2.54, 95% CI: 2.47-2.62). The AAMR for NH Black and NH American Indian or Alaska Native decreased from 1999-2020. The AAMR for NH White showed a non-significant increase from 1999-2005 (APC: 0.46; 95% CI -0.84 to 1.79; p=0.466164), followed by a significant decrease till 2020 (APC: -1.62; 95 % CI -1.93 to -1.31; p<0.000001). For Hispanics, there was a significant decrease in AAMR from 4.1 in 1999 to 2.5 in 2020 (APC: -2.51; 95% CI -2.92 to -2.10; p<0.000001). The AAMR for NH Asian or Pacific Islander decreased slightly from 1999-2007 (APC: -0.52; 95% CI -2.14 to 1.12; p=0.507101), followed by a steep decrease till 2010 (APC: -9.29; 95% CI -21.32 to 4.56; p=0.163414), and finally a further decrease till 2020 (APC: -2.85; 95% CI -3.81 to -1.88; p=0.000021) [Table 3].
3.4. COPD and Lung Cancer Related AAMRs Stratified by Urbanization
Nonmetropolitan areas had consistently higher COPD and lung cancer-related AAMRs than metropolitan areas throughout the study period (13.6, 95% CI: 13.52-13.68 vs 9.41, 95% CI: 9.38-9.44). AAMRs of nonmetropolitan areas inclined significantly from 1999 to 2006 (APC: 1.55; 95% CI: 1.04 to 2.07; p=0.000014), followed by abrupt decrease from 2006 to 2009 (APC: −2.21; 95% CI: −7.68 to −0.60; p=0.025692), then a persistent decline till 2020 (APC: −0.46; 95% CI: −0.70 to −0.21; p=0.001269). However, AAMRs of metropolitan areas showed a non-significant decrease from 1999 to 2005 (APC: −0.13; 95% CI: −1.35 to −1.11; p=0.826629), followed by a significant fall till 2020 (APC: −2.23; 95% CI: −2.52 to −1.93; p<0.000001) [Table 5].
3.5. COPD and Lung Cancer Related AAMRs Stratified by Census Region
On average, over the duration of the study timeframe, the Midwest region portrayed the highest AAMR of 11.89 (95% CI = 11.82 to 11.95), followed by Southern (AAMR: 10.8; 95% CI = 10.76 to 10.85), Western (AAMR: 8.6; 95% CI = 8.55 to 8.66), and Northeastern (AAMR: 8.53; 95% CI:8.47 to 8.59) regions [Table 1]. From 1999 Midwest, South, and Northeast saw a slight insignificant increase in AAMRs initially till 2005 (Midwest APC: 0.97; 95% CI: −0.55 to 2.51; p=0.197518) and 2006 (South, APC: 0.19; 95% CI: −0.51 to −0.90; p=0.572896 and Northeast APC: 0.16; 95% CI: −1.09 to 1.44; p=0.787633). Then the AAMRs decreased till 2020 in different phases in each region. From 2005 to 2020 a significant decline is observed in the Midwest region (with APC: -1.71; 95% CI: -2.07 to-1.35; p=< 0.000001). South saw a decline in AAMRs in additional two phases from 2006 to 2009 (APC: -4.27; 95% CI: -9.15 to 0.87; p=0.094962) and 2009 to 2020 (APC: -0.60; 95% CI: -0.93 to -0.28; p=0.001374). The Northeast region also reported a significant decline in AAMRs from 2006 to 2020 (APC: -2.79; 95% CI: -3.24 to -2.33; p= < 0.000001). Additionally, West also reported a decline in AAMRS from 1999 to 2020 in two different phases. First, a non-significant decrease in AAMRs was observed from 1999 to 2005 (APC: -0.20; 95% CI: -1.68 to 1.30; p=0.782474) and then a significant decline was noted till 2020 (APC: -3.41; 95% CI: -3.77 to -3.05; p= < 0.000001) [Table 2].
a Hispanics could be of any race; all other categories are non-Hispanic. * indicates that the Annual Percentage Change (APC) is significantly different from zero at the alpha = 0.05 level.
Significant disparities in AAMR in different states were reported, with the AAMRs ranging from 3.76 (95% CI: 3.54-3.98) in Utah to 18.52 (95% CI: 18.06-18.97) in West Virginia. States in the top 90th percentile—West Virginia, Kentucky, Oklahoma, Indiana, and Ohio—had AAMRs averaging approximately 16.5 per 100,000, which was more than three times higher than those in the bottom 10th percentile—Utah, Hawaii, the District of Columbia, Arizona, and New Mexico—where the average rate was about 5.4 per 100,000 [Table 6].
3.6. COPD and Lung Cancer Related AAMRs Stratified by Place of Death
From 1999 to 2020, 38.63% of the deaths due to COPD and lung cancer happened in the decedent’s home, 33.67% in medical facilities, 16.48% in nursing homes or long-term care homes, 6.59% in hospice facilities, and 4.41% in other places [Table 7].
4. Discussion
This study highlights significant temporal and demographic trends in AAMRs from COPD and lung cancer in the United States between 1999 and 2020. Overall, there was a substantial decline in AAMRS, however, the decrease was not uniform across all subpopulations. AAMRS were higher in males but declined in both sexes. The racial disparities were also evident: NH white individuals had the highest AAMRS, while non-Hispanic Asian or Pacific Islanders had the lowest. Geographic variations were substantial, with nonmetropolitan areas and certain states (e.g., West Virginia, Kentucky) bearing the highest mortality burden. In contrast, metropolitan areas and states like Utah and Hawaii had significantly lower rates, emphasizing the role of regional health policies and population-level risk factors. Finally, place-of-death data revealed that a majority of COPD and lung cancer deaths occurred at home or in medical facilities, underscoring the importance of end-of-life care planning and hospice availability. COPD is independently associated with an increased risk of lung cancer [25]. While smoking is the primary shared risk factor, evidence suggests COPD contributes to lung cancer through mechanisms beyond tobacco exposure. Chronic inflammation, airway remodelling, and lung parenchyma destruction in COPD create a pro-tumorigenic environment via oxidative stress, DNA damage, and inflammatory cytokines (TNF-α, IL-6, IL-8), which promote mutations and abnormal cell proliferation [47,48,49]. Repeated injury-repair cycles in COPD can also lead to bronchial epithelial dysplasia and metaplasia, precursors to carcinoma. Impaired immune surveillance in COPD further increases cancer risk, as chronic lung disease weakens the immune system’s ability to eliminate malignant cells. Advanced COPD often involves dysregulated innate and adaptive immunity. HIV and TB infections similarly elevate lung cancer risk through chronic inflammation and immune suppression [50,53]. Environmental and occupational exposures (air pollution, asbestos, silica, radon) compound the risk, especially in lower socioeconomic groups. Ethnicity may also influence susceptibility due to genetic, exposure, or healthcare disparities.
In summary, COPD elevates lung cancer risk through distinct mechanisms like chronic inflammation, tissue damage, and immune dysfunction. Understanding this interplay is crucial for risk stratification and targeted prevention [1,36,52].
This study showed that the age-adjusted mortality rate (AAMRS) was consistently higher in men than in women, though both groups experienced a decline in deaths after 2007–08. Over the past decade, cancer incidence rates remained stable in women while declining by 2% annually in men, with cancer death rates decreasing by 1.5% per year in both sexes [15]. Men also had a higher prevalence of COPD (72.8%) compared to women (52.5%), even among smokers [26]. Lung cancer presentation differs by sex: women are more likely to develop adenocarcinoma (twice as often as squamous cell carcinoma), while men show a near-equal ratio of adenocarcinoma to squamous cell carcinoma [16]. Biological differences include more frequent EGFR mutations, distinct KRAS mutation profiles, higher CYP1A1 expression, and greater DNA adduct formation in women, suggesting heightened susceptibility to smoking-related damage [17,18,19]. Women also report more respiratory symptoms (dyspnea, cough, chronic bronchitis) and early airway changes (bronchiolitis, bronchial wall thickening) than men with similar smoking histories [20,21,22]. Women with localized disease undergo surgery more frequently and exhibit better stage-specific survival at all stages. They are also overrepresented among younger patients, hinting at sex-based differences in carcinogen susceptibility. Even after adjusting for age, histology, and smoking, women have higher overall survival [23,46]. While men smoke more daily, women show greater intention to quit [27]. Historically, smoking rates were higher in men, but rising female smoking has increased lung cancer incidence in women. Despite this, women may have greater biological vulnerability to smoking’s effects, possibly contributing to their survival advantage. Occupational exposures further shape risk: men face higher carcinogen exposure (e.g., mining, construction), while women may encounter secondhand smoke or air pollution [43,44,45]. These sex-based differences in behavior, biology, and exposure complicate lung cancer and COPD trends [26].
According to the analysis, death rates are found to be highest in the NH White population, followed by NH American Indians, NH Black or African Americans, and Hispanics and lowest in Asians. In previous studies, the cancer-related death rates and COPD prevalence were highest among Non-Hispanic (NH) White, NH Asian, and NH Black patients who reported less breathlessness, and NH Black patients were less likely to receive inhaled treatments. It was also reported that South Asian patients had the highest influenza and pneumococcal vaccination rates [28]. NH Black or African Americans were younger at presentation and had lower overall pack-years of smoking than whites Additionally, African Americans started smoking later in life than whites [29]. COPD is rare among Chinese individuals in the USA, suggesting potential genetic factors that protect against the condition. In Hawaii, individuals who smoked more than 20 cigarettes daily had a COPD prevalence of 7.9%, compared to 16.7% in a matched Caucasian-American group. The ZZ phenotype of α1-antitrypsin is absent in Black individuals and rare in Asian populations, while abnormalities in the cystic fibrosis transmembrane conductance regulator (CFTR) are not observed in certain East Asian populations. These genetic differences across racial groups complicate comparisons and may explain the variations in how gene polymorphisms are linked to COPD in different studies [30]. The difference in lung cancer incidence between African Americans and Whites was mostly explained by variations in smoking habits among participants aged 55-84. However, among males aged 40-54, African Americans were 2-4 times more likely to develop lung cancer of any histologic type than Whites, even after adjusting for smoking habit [31] which may lead to underreporting of deaths. Racial disparities in COPD treatment have been observed, including differences in home oxygen prescriptions, influenza vaccinations, and smoking cessation referrals, which may contribute to more severe exacerbations. A study on COPD exacerbation treatment in the ED found that African American patients were more likely to be uninsured and less likely to have a primary care provider compared to Caucasians, which may lead to underreporting of cases [33].
Our study also showed a higher rate of AAMRS among non-metropolitan subgroups which can be attributed to various causes like limited access to healthcare, lower screening rates, and socio-economic barriers. Data from the 2017 National Health Interview Survey show that adults in nonmetropolitan areas had higher rates of current smoking(23% versus 13%), fewer attempts to quit, and lower success in quitting compared to those in metropolitan areas. Although national guidelines strongly advocate for regular screening and intervention for tobacco use, as well as lung cancer screening for high-risk individuals, significant disparities persist in access to these preventive services—particularly in rural areas. Behavioural interventions, including counselling and support programs for smoking cessation, along with pharmacological treatments such as nicotine replacement therapy, bupropion, or varenicline, have been proven effective in reducing tobacco dependence. Similarly, low dose computed tomography (LDCT) screening has been shown to detect lung cancer at earlier, more treatable stages and is recommended for adults with a significant smoking history. However, individuals living in rural or nonmetropolitan areas often face multiple barriers to accessing these services. A key factor is the higher rate of uninsurance among residents under age 65 in rural communities, which limits their ability to afford or seek preventive care. Even for those who are insured, geographic isolation and fewer healthcare facilities contribute to the reduced availability of providers trained in tobacco cessation counselling or equipped to perform lung cancer screenings. Moreover, rural areas may lack the necessary infrastructure—such as speciality clinics, transportation options, and broadband connectivity—to support telehealth services that could bridge these gaps. Workforce shortages in rural healthcare systems further compound the problem. Primary care providers may be overburdened or lack the time and resources to implement preventive care practices consistently. Moreover, public health campaigns and smoking cessation programs often have less reach in these communities, resulting in lower awareness and utilization of available services. Together, these factors create a substantial gap between evidence-based recommendations and real-world practice, leading to missed opportunities for early intervention and increased risk for lung cancer and other tobacco-related diseases among rural populations 37].
A study with a cohort of low socioeconomic status (SES) patients tended to travel longer distances to their transplant centres than those with higher SES. They were less likely to undergo transplants at high-volume centres, have private insurance, or switch from low- to high-volume facilities. Despite these differences, 1- and 5-year survival rates were similar across the groups. The study also found that, up to 2014, patients with private insurance or who paid out of pocket were more likely to change transplant centres [35]. Allen et al. reported that most liver transplant recipients in the UNOS database through 2008 had private insurance or were self-paying, and these patients had better survival outcomes at 3 and 5 years compared to those with Medicare or Medicaid. Ten-year survival was 7.0% lower for Medicare and 8.1% lower for Medicaid recipients. However, insurance type did not influence short-term survival at 30, 90 days, or 1 year [34].
The death rates varied among the different geographical regions, highest in the Midwest and the lowest in the West and Northeast. While comparing the states California recorded several deaths as high as 44,340, while the lowest death rates were seen in the District of Columbia, followed by Wyoming. The prevalence of cigarette smoking has remained high in Southern states and states in the Appalachian region, while decreasing over the last few decades in most other states, particularly those in the West [38,41]. Early cancer mortality studies and later case-control research in the 1970s and 1980s showed that shipyard work in southern coastal regions was linked to higher lung cancer risk, mainly due to asbestos exposure. Asbestos-containing materials were gradually phased out, leading to a decline in lung cancer rates in many coastal areas. Long-term radon exposure, particularly in non-smokers, also increases lung cancer risk, as do diesel exhaust fumes and fine particulate matter (PM2.5). These exposure risks vary across the U.S., including differences between nonmetropolitan and metropolitan areas [36,37].
A comprehensive lung cancer prevention strategy requires population-level interventions including tobacco screening, smoking cessation programs, smoke-free policies, radon testing, and asbestos exposure reduction [36]. While lung cancer screening is recommended for high-risk individuals, particularly current or former smokers, access remains limited in nonmetropolitan areas where uninsured rates are higher. Successful implementation depends on strengthening community capacity through programs like Maine’s Comprehensive Cancer Control Program, which identifies screening facilities and addresses barriers across geographic regions [40]. Patient navigation systems play a critical role in overcoming obstacles to care, with initiatives like the CDC-Appalachian Regional Commission collaboration developing culturally appropriate training for navigators to improve access [41]. Future efforts should prioritize expanding screening through mobile units and telehealth, enhancing tobacco cessation support, increasing public awareness of environmental risks, and securing sustained policy support including Medicaid expansion and workforce development. These multi-level approaches are essential for reducing disparities in lung cancer burden nationwide.
5. Limitations
This study has several important limitations that should be considered when interpreting the findings. First, it relies on death certificate data, which are known to sometimes contain inaccuracies or misclassifications in determining the underlying cause of death. This is particularly relevant when distinguishing between chronic respiratory conditions such as COPD and lung cancer, which may present with overlapping clinical features. Misclassification may lead to underestimation or overestimation of disease-specific mortality rates. Second, the study utilizes population-level data, which limits the ability to control for individual-level confounding factors. Key variables such as smoking behaviour, occupational exposures, income level, education, access to healthcare, and the presence of comorbid conditions are not captured in this dataset. These factors are critical determinants of both COPD and lung cancer risk, and their absence restricts the ability to draw more precise conclusions about the observed mortality disparities. Third, There are limitations related to the classification of race and ethnicity in death certificate data.These classifications may not accurately reflect how individuals identify themselves and may not account for multiracial individuals. This can introduce misclassification bias in analyses of racial and ethnic disparities, potentially obscuring important trends or falsely attributing risk differences to certain groups. Fourth, the classification of geographic areas based on levels of urbanization may not fully capture the complexity of regional differences in healthcare access, environmental exposures, or public health infrastructure. For example, two rural areas classified similarly may differ significantly in their proximity to healthcare facilities, local smoking rates, or levels of air pollution, all of which can influence respiratory health outcomes. Lastly, the study spans a period during which diagnostic criteria, disease coding practices, and healthcare delivery systems have evolved. Improvements in diagnostic imaging, changes in how deaths are reported, and shifts in access to care over time could have influenced mortality trends in ways not accounted for in the analysis. These evolving factors may contribute to temporal changes that are difficult to disentangle from genuine shifts in disease burden. Overall, while the study provides valuable insights into mortality patterns, these limitations highlight the need for cautious interpretation and underscore the importance of using complementary data sources and methodologies in future research.
Funding
The authors received no funds, grants or financial support for this study.
Acknowledgments
Not applicable.
Conflicts of Interest
The authors declare that they have no conflicts of interest.
References
- Agustí, A. , Celli, B. R., Criner, G. J., Halpin, D., Anzueto, A., Barnes, P., Bourbeau, J., Han, M. K., Martinez, F. J., Montes de Oca, M., Mortimer, K., Papi, A., Pavord, I., Roche, N., Salvi, S., Sin, D. D., Singh, D., Stockley, R., López Varela, M. V., Wedzicha, J. A., … Vogelmeier, C. F. Global Initiative for Chronic Obstructive Lung Disease 2023 Report: GOLD Executive Summary. The European respiratory journal 2023, 61, 2300239. [Google Scholar] [CrossRef] [PubMed]
- Siegel, R. L. , Miller, K. D., Wagle, N. S., & Jemal, A. Cancer statistics, 2023. CA: a cancer journal for clinicians 2023, 73, 17–48. [Google Scholar] [CrossRef] [PubMed]
- Herbst, R. S. , Heymach, J. V., & Lippman, S. M. Lung cancer. The New England journal of medicine 2008, 359, 1367–1380. [Google Scholar] [CrossRef]
- Curtin S, Tejada-Vera B, Bastian B. Deaths: Leading Causes for 2022.; 2024. https://www.cdc.gov/nchs/data/nvsr/nvsr73/NVSR73-10.
- State of Lung Cancer | American Lung Association. www.lung.org. https://www.lung.
- Barnes P., J. Mechanisms of development of multimorbidity in the elderly. The European respiratory journal 2015, 45, 790–806. [Google Scholar] [CrossRef]
- Durham, A. L. , & Adcock, I. M. The relationship between COPD and lung cancer. Lung cancer (Amsterdam, Netherlands), 2015, 90, 121–127. [Google Scholar] [CrossRef]
- Centers for Disease Control and Prevention. Multiple Cause of Death Data on WONDER Online Database [Internet]. Atlanta, GA: National Center for Health Statistics; [cited 2025 ]. Available from: https://wonder.cdc.gov/mcd-icd10. 04 May.
- Equator Network. *STROBE Statement—Strengthening the Reporting of Observational Studies in Epidemiology* [Internet]. [cited 2025 Mar 18]. Available from: [https://www.equator-network.org/reporting-guidelines/strobe/](https://www.equator-network.org/reporting-guidelines/strobe/).
- Centers for Disease Control and Prevention. Multiple Cause of Death Data on WONDER: Help Page [Internet]. Atlanta, GA: National Center for Health Statistics; [cited 2025 Mar 18]. Available from: https://wonder.cdc.gov/wonder/help/mcd.html#HHS%20Regions.
- Aggarwal, R. , Chiu, N., Loccoh, E. C., Kazi, D. S., Yeh, R. W., & Wadhera, R. K. Rural-Urban Disparities: Diabetes, Hypertension, Heart Disease, and Stroke Mortality Among Black and White Adults, 1999-2018. Journal of the American College of Cardiology 2021, 77, 1480–1481. [Google Scholar] [CrossRef]
- Ingram, D. D. , & Franco, S. J. 2013 NCHS Urban-Rural Classification Scheme for Counties. Vital and health statistics. Series 2, Data evaluation and methods research.
- Joinpoint Trend Analysis Software. Joinpoint Regression Program, Version 5.3.0 (released , 2024). Surveillance Research Program, National Cancer Institute. Accessed March 18, 2025. Available from: https://surveillance.cancer. 12 November.
- Anderson, R. N. , & Rosenberg, H. M. Age standardization of death rates: implementation of the year 2000 standard. National vital statistics reports : from the Centers for Disease Control and Prevention, National Center for Health Statistics, National Vital Statistics System, 1998, 47, 1–20. [Google Scholar]
- Siegel, R. L. , Miller, K. D., & Jemal, A. Cancer statistics, 2018. CA: a cancer journal for clinicians 2018, 68, 7–30. [Google Scholar] [CrossRef]
- Thun, M. J. , Lally, C. A., Flannery, J. T., Calle, E. E., Flanders, W. D., & Heath, C. W., Jr Cigarette smoking and changes in the histopathology of lung cancer. Journal of the National Cancer Institute 1997, 89, 1580–1586. [Google Scholar] [CrossRef]
- Dogan, S. , Shen, R., Ang, D. C., Johnson, M. L., D’Angelo, S. P., Paik, P. K., Brzostowski, E. B., Riely, G. J., Kris, M. G., Zakowski, M. F., & Ladanyi, M. Molecular epidemiology of EGFR and KRAS mutations in 3,026 lung adenocarcinomas: higher susceptibility of women to smoking-related KRAS-mutant cancers. Clinical cancer research : an official journal of the American Association for Cancer Research 2012, 18, 6169–6177. [Google Scholar] [CrossRef]
- Mollerup, S. , Berge, G., Baera, R., Skaug, V., Hewer, A., Phillips, D. H., Stangeland, L., & Haugen, A. Sex differences in risk of lung cancer: Expression of genes in the PAH bioactivation pathway in relation to smoking and bulky DNA adducts. International journal of cancer 2006, 119, 741–744. [Google Scholar] [CrossRef] [PubMed]
- Uppstad, H. , Osnes, G. H., Cole, K. J., Phillips, D. H., Haugen, A., & Mollerup, S. Sex differences in susceptibility to PAHs is an intrinsic property of human lung adenocarcinoma cells. Lung cancer (Amsterdam, Netherlands), 2011, 71, 264–270. [Google Scholar] [CrossRef] [PubMed]
- Sayiner, A. , Hague, C., Ajlan, A., Leipsic, J., Wierenga, L., Krowchuk, N. M., Ceylan, N., Sayiner, A., Sin, D. D., & Coxson, H. O. Bronchiolitis in young female smokers. Respiratory medicine 2013, 107, 732–738. [Google Scholar] [CrossRef]
- de Torres, J. P. , Casanova, C., Montejo de Garcini, A., Aguirre-Jaime, A., & Celli, B. R. Gender and respiratory factors associated with dyspnea in chronic obstructive pulmonary disease. Respiratory research 2007, 8, 18. [Google Scholar] [CrossRef]
- Martinez, F. J. , Curtis, J. L., Sciurba, F., Mumford, J., Giardino, N. D., Weinmann, G., Kazerooni, E., Murray, S., Criner, G. J., Sin, D. D., Hogg, J., Ries, A. L., Han, M., Fishman, A. P., Make, B., Hoffman, E. A., Mohsenifar, Z., Wise, R., & National Emphysema Treatment Trial Research Group Sex differences in severe pulmonary emphysema. American journal of respiratory and critical care medicine 2007, 176, 243–252. [Google Scholar] [CrossRef]
- Fu, J. B. , Kau, T. Y., Severson, R. K., & Kalemkerian, G. P. Lung cancer in women: analysis of the national Surveillance, Epidemiology, and End Results database. Chest 2005, 127, 768–777. [Google Scholar] [CrossRef]
- Nagasaka, M. , Lehman, A., Chlebowski, R., Haynes, B. M., Ho, G., Patel, M., Sakoda, L. C., Schwartz, A. G., Simon, M. S., & Cote, M. L. COPD and lung cancer incidence in the Women’s Health Initiative Observational Study: A brief report. Lung cancer (Amsterdam, Netherlands), 2020, 141, 78–81. [Google Scholar] [CrossRef]
- Brenner, D. R. , Boffetta, P., Duell, E. J., Bickeböller, H., Rosenberger, A., McCormack, V., Muscat, J. E., Yang, P., Wichmann, H. E., Brueske-Hohlfeld, I., Schwartz, A. G., Cote, M. L., Tjønneland, A., Friis, S., Le Marchand, L., Zhang, Z. F., Morgenstern, H., Szeszenia-Dabrowska, N., Lissowska, J., Zaridze, D., … Hung, R. J. Previous lung diseases and lung cancer risk: a pooled analysis from the International Lung Cancer Consortium. American journal of epidemiology 2012, 176, 573–585. [Google Scholar] [CrossRef]
- Loganathan, R. S. , Stover, D. E., Shi, W., & Venkatraman, E. Prevalence of COPD in women compared to men around the time of diagnosis of primary lung cancer. Chest 2006, 129, 1305–1312. [Google Scholar] [CrossRef]
- Chinwong, D. , Mookmanee, N., Chongpornchai, J., & Chinwong, S. A Comparison of Gender Differences in Smoking Behaviors, Intention to Quit, and Nicotine Dependence among Thai University Students. Journal of addiction 2018, 2018, 8081670. [Google Scholar] [CrossRef]
- Martin, A. , Badrick, E., Mathur, R., & Hull, S. Effect of ethnicity on the prevalence, severity, and management of COPD in general practice. The British journal of general practice : the journal of the Royal College of General Practitioners 2012, 62, e76–e81. [Google Scholar] [CrossRef] [PubMed]
- Chatila, W. M. , Wynkoop, W. A., Vance, G., & Criner, G. J. Smoking patterns in African Americans and whites with advanced COPD. Chest 2004, 125, 15–21. [Google Scholar] [CrossRef] [PubMed]
- Barnes P., J. Genetics and pulmonary medicine. 9. Molecular genetics of chronic obstructive pulmonary disease. Thorax 1999, 54, 245–252. [Google Scholar] [CrossRef] [PubMed]
- Schwartz, A. G. , & Swanson, G. M. Lung carcinoma in African Americans and whites. A population-based study in metropolitan Detroit, Michigan. Cancer, 1997, 79, 45–52. [Google Scholar] [CrossRef]
- Kirkpatrick, dP. , & Dransfield, M. T. Racial and sex differences in chronic obstructive pulmonary disease susceptibility, diagnosis, and treatment. Current opinion in pulmonary medicine 2009, 15, 100–104. [Google Scholar] [CrossRef]
- Tsai, C. L. , & Camargo, C. A., Jr Racial and ethnic differences in emergency care for acute exacerbation of chronic obstructive pulmonary disease. Academic emergency medicine : official journal of the Society for Academic Emergency Medicine 2009, 16, 108–115. [Google Scholar] [CrossRef]
- Allen, J. G. , Arnaoutakis, G. J., Orens, J. B., McDyer, J., Conte, J. V., Shah, A. S., & Merlo, C. A. Insurance status is an independent predictor of long-term survival after lung transplantation in the United States. The Journal of heart and lung transplantation : the official publication of the International Society for Heart Transplantation 2011, 30, 45–53. [Google Scholar] [CrossRef]
- Chan, E. G. , Hayanga, J. W. A., Tuft, M., Morrell, M. R., & Sanchez, P. G. Access to Lung Transplantation in the United States: The Potential Impact of Access to a High-volume Center. Transplantation 2020, 104, e199–e207. [Google Scholar] [CrossRef]
- Thun MJ, Henley SJ, Travis WD. Lung cancer. In: Thun MJ, Linet MS, Cerhan JR, Haiman CA, Schottenfeld D, eds. Cancer Epidemiology and Prevention. 4th ed. New York, NY: Oxford University Press; 2017:665-692.
- Berrington de González A, Bouville A, Rajaraman P, Schubauer-Berigan M. Chapter 13: Ionizing Radiation. Schottenfeld and Fraumeni Cancer Epidemiology and Prevention. 4 ed. O: New York, NY, 2018.
- Shreves, A. H. , Buller, I. D., Chase, E., Creutzfeldt, H., Fisher, J. A., Graubard, B. I., Hoover, R. N., Silverman, D. T., Devesa, S. S., & Jones, R. R. Geographic Patterns in U.S. Lung Cancer Mortality and Cigarette Smoking. Cancer epidemiology, biomarkers & prevention : a publication of the American Association for Cancer Research, cosponsored by the American Society of Preventive Oncology, 2023, 32, 193–201. [Google Scholar] [CrossRef]
- Gallaway, M. S. , Berens, A. S., Puckett, M. C., & Foster, S. Understanding geographic variations of indoor radon potential for comprehensive cancer control planning. Cancer causes & control : CCC 2019, 30, 707–712. [Google Scholar] [CrossRef]
- Maine Comprehensive Cancer Control Program. Lung cancer screening: availability of low-dose computed tomography services in Maine. Augusta, ME: Maine Center for Disease Control and Prevention; 2018. https://www.maine.gov/dhhs/mecdc/population-health/ccc/documents/Availability_2017-LDCT-Services_SurveySummary.
- Centers for Disease Control and Prevention. State-Specific Smoking-Attributable Mortality and Years of Potential Life Lost --- United States, 2000–2004. Department of Health and Human Services; 2009. 2009.
- Shreves, A. H. , Buller, I. D., Chase, E., Creutzfeldt, H., Fisher, J. A., Graubard, B. I., Hoover, R. N., Silverman, D. T., Devesa, S. S., & Jones, R. R. Geographic Patterns in U.S. Lung Cancer Mortality and Cigarette Smoking. Cancer epidemiology, biomarkers & prevention : a publication of the American Association for Cancer Research, cosponsored by the American Society of Preventive Oncology, 2023, 32, 193–201. [Google Scholar] [CrossRef]
- Status of Women Data. Gender differences in sectors of employment. Accessed , 2025. https://statusofwomendata. 6 May.
- Locke, S. J. , Colt, J. S., Stewart, P. A., Armenti, K. R., Baris, D., Blair, A., Cerhan, J. R., Chow, W. H., Cozen, W., Davis, F., De Roos, A. J., Hartge, P., Karagas, M. R., Johnson, A., Purdue, M. P., Rothman, N., Schwartz, K., Schwenn, M., Severson, R., Silverman, D. T., … Friesen, M. C. Identifying gender differences in reported occupational information from three US population-based case-control studies. Occupational and environmental medicine 2014, 71, 855–864. [Google Scholar] [CrossRef] [PubMed]
- Biswas, A. , Harbin, S., Irvin, E., Johnston, H., Begum, M., Tiong, M., Apedaile, D., Koehoorn, M., & Smith, P. Differences between men and women in their risk of work injury and disability: A systematic review. American journal of industrial medicine 2022, 65, 576–588. [Google Scholar] [CrossRef] [PubMed]
- Dransfield, M. T. , Davis, J. J., Gerald, L. B., & Bailey, W. C. Racial and gender differences in susceptibility to tobacco smoke among patients with chronic obstructive pulmonary disease. Respiratory medicine 2006, 100, 1110–1116. [Google Scholar] [CrossRef]
- Petrescu, F. , Voican, S. C., & Silosi, I. Tumor necrosis factor-alpha serum levels in healthy smokers and nonsmokers. International journal of chronic obstructive pulmonary disease 2010, 5, 217–222. [Google Scholar] [CrossRef]
- Hacievliyagil, S. S. , Mutlu, L. C., & Temel, İ. Airway inflammatory markers in chronic obstructive pulmonary disease patients and healthy smokers. Nigerian journal of clinical practice 2013, 16, 76–81. [Google Scholar] [CrossRef]
- Rovina, N. , Papapetropoulos, A., Kollintza, A., Michailidou, M., Simoes, D. C., Roussos, C., & Gratziou, C. Vascular endothelial growth factor: an angiogenic factor reflecting airway inflammation in healthy smokers and in patients with bronchitis type of chronic obstructive pulmonary disease? Respiratory research 2007, 8, 53. [Google Scholar] [CrossRef]
- Thandra, K. C. , Barsouk, A., Saginala, K., Aluru, J. S., & Barsouk, A. Epidemiology of lung cancer. Contemporary oncology (Poznan, Poland), 2021, 25, 45–52. [Google Scholar] [CrossRef]
- Samet J., M. The epidemiology of lung cancer. Chest 1993, 103(1 Suppl), 20S–29S. [Google Scholar] [CrossRef]
- de Groot, P. , & Munden, R. F. Lung cancer epidemiology, risk factors, and prevention. Radiologic clinics of North America 2012, 50, 863–876. [Google Scholar] [CrossRef]
- Molina-Romero, C. , Arrieta, O., & Hernández-Pando, R. Tuberculosis and lung cancer. Tuberculosis y cáncer de pulmón. Salud publica de Mexico 2019, 61, 286–291. [Google Scholar] [CrossRef] [PubMed]
- Florez, N. , Kiel, L., Riano, I., Patel, S., DeCarli, K., Dhawan, N., Franco, I., Odai-Afotey, A., Meza, K., Swami, N., Patel, J., & Sequist, L. V. Lung Cancer in Women: The Past, Present, and Future. Clinical lung cancer 2024, 25, 1–8. [Google Scholar] [CrossRef] [PubMed]

Table 5.
Urbanizarion- Stratified COPD and lung cancer related mortality Per 100,000 In The United States,1999-2020.
Table 5.
Urbanizarion- Stratified COPD and lung cancer related mortality Per 100,000 In The United States,1999-2020.
| YEAR | METROPOLITAN | NON-METROPOLITAN |
|---|---|---|
| 1999 | 10.92 (10.75 - 11.09) |
13.42 (13.03 - 13.81) |
| 2000 | 10.84 (10.67 - 11.01) |
13.92 (13.52 - 14.32) |
| 2001 | 10.74 (10.57 - 10.90) |
14.17 (13.77 - 14.58) |
| 2002 | 10.81 (10.65 - 10.98) |
14.68 (14.27 - 15.08) |
| 2003 | 10.61 (10.45 - 10.77) |
14.66 (14.25 - 15.06) |
| 2004 | 10.76 (10.59 - 10.92) |
14.75 (14.34 - 15.15) |
| 2005 | 10.88 (10.71 - 11.04) |
15.08 (14.67 - 15.48) |
| 2006 | 10.77 (10.61 - 10.93) |
14.76 (14.37 - 15.16) |
| 2007 | 10.76 (10.60 - 10.92) |
15.37 (14.97 - 15.78) |
| 2008 | 9.43 (9.28 - 9.57) |
13.36 (12.99 - 13.74) |
| 2009 | 9.50 (9.35 - 9.65) |
13.32 (12.95 - 13.69) |
| 2010 | 9.57 (9.42 - 9.72) |
13.38 (13.01 - 13.75) |
| 2011 | 9.25 (9.10 - 9.39) |
13.59 (13.22 - 13.96) |
| 2012 | 9.25 (9.11 - 9.39) |
13.27 (12.91 - 13.63) |
| 2013 | 9.17 (9.03 - 9.30) |
13.25 (12.89 - 13.61) |
| 2014 | 8.69 (8.56 - 8.82) |
12.90 (12.55 - 13.25) |
| 2015 | 8.46 (8.33 - 8.59) |
13.13 (12.78 - 13.48) |
| 2016 | 8.53 (8.40 - 8.66) |
12.98 (12.63 - 13.32) |
| 2017 | 8.15 (8.03 - 8.27) |
12.97 (12.62 - 13.31) |
| 2018 | 7.87 (7.75 - 7.99) |
12.78 (12.44 - 13.12) |
| 2019 | 7.88 (7.76 - 8.00) |
12.60 (12.27 - 12.93) |
| 2020 | 7.86 (7.74 - 7.98) |
12.94 (12.61 - 13.28) |
Table 4.
Overall and gender- Stratified COPD and lung cancer related mortality Per 100,000 In The United States,1999-2020.
Table 4.
Overall and gender- Stratified COPD and lung cancer related mortality Per 100,000 In The United States,1999-2020.
| Year | Female | Overall | Male |
|---|---|---|---|
| 1999 | 8.03 (7.86 - 8.21) |
11.37 (11.21 - 11.52) |
16.32 (16.03 - 16.62) |
| 2000 | 8.18 (8.01 - 8.36) |
11.39 (11.23 - 11.55) |
16.14 (15.85 - 16.44) |
| 2001 | 8.39 (8.22 - 8.57) |
11.35 (11.20 - 11.51) |
15.74 (15.46 - 16.03) |
| 2002 | 8.57 (8.39 - 8.75) |
11.54 (11.38 - 11.69) |
15.87 (15.59 - 16.16) |
| 2003 | 8.57 (8.40 - 8.75) |
11.34 (11.19 - 11.50) |
15.35 (15.07 - 15.62) |
| 2004 | 8.69 (8.52 - 8.87) |
11.47 (11.32 - 11.62) |
15.44 (15.16 - 15.71) |
| 2005 | 8.87 (8.69 - 9.05) |
11.66 (11.51 - 11.81) |
15.57 (15.30 - 15.85) |
| 2006 | 8.79 (8.62 - 8.97) |
11.48 (11.33 - 11.63) |
15.31 (15.04 - 15.58) |
| 2007 | 9.10 (8.92 - 9.27) |
11.59 (11.44 - 11.74) |
15.09 (14.82 - 15.35) |
| 2008 | 8.07 (7.91 - 8.24) |
10.14 (10.00 - 10.28) |
13.03 (12.78 - 13.27) |
| 2009 | 8.17 (8.01 - 8.34) |
10.18 (10.04 - 10.32) |
12.97 (12.73 - 13.21) |
| 2010 | 8.16 (8.00 - 8.33) |
10.25 (10.11 - 10.39) |
13.11 (12.87 - 13.35) |
| 2011 | 8.06 (7.90 - 8.22) |
10.00 (9.86 - 10.13) |
12.63 (12.40 - 12.86) |
| 2012 | 8.15 (7.99 - 8.31) |
9.94 (9.81 - 10.07) |
12.35 (12.13 - 12.58) |
| 2013 | 8.13 (7.97 - 8.29) |
9.88 (9.75 - 10.01) |
12.18 (11.96 - 12.40) |
| 2014 | 7.79 (7.64 - 7.94) |
9.41 (9.28 - 9.53) |
11.57 (11.36 - 11.78) |
| 2015 | 7.71 (7.56 - 7.86) |
9.26 (9.14 - 9.39) |
11.28 (11.08 - 11.49) |
| 2016 | 7.65 (7.50 - 7.80) |
9.29 (9.16 - 9.41) |
11.42 (11.22 - 11.62) |
| 2017 | 7.49 (7.34 - 7.63) |
8.97 (8.85 - 9.09) |
10.84 (10.65 - 11.04) |
| 2018 | 7.23 (7.09 - 7.37) |
8.68 (8.56 - 8.79) |
10.59 (10.40 - 10.78) |
| 2019 | 7.28 (7.14 - 7.42) |
8.68 (8.57 - 8.79) |
10.49 (10.30 - 10.68) |
| 2020 | 7.35 (7.22 - 7.49) |
8.72 (8.61 - 8.83) |
10.42 (10.23 - 10.60) |
Table 3.
Race- Stratified mortality in COPD and lung cancer Per 100,000 In The United States,1999-2020.
Table 3.
Race- Stratified mortality in COPD and lung cancer Per 100,000 In The United States,1999-2020.
|
Year |
NH American Indian Or Alaska Native | NH Asian Or Pacific Islander | NH Black Or African American | NH White |
Hispanic Or Latino |
|---|---|---|---|---|---|
| 1999 | 8.26 (6.29 - 10.66) |
3.47 (2.87 - 4.07) |
9.47 (8.97 - 9.97) |
12.23 (12.05 - 12.41) |
4.10 (3.65 - 4.54) |
| 2000 | 7.76 (5.83 - 10.12) |
3.40 (2.82 - 3.98) |
9.40 (8.90 - 9.89) |
12.35 (12.17 - 12.52) |
3.83 (3.40 - 4.25) |
| 2001 | 8.91 (6.92 - 11.30) |
3.61 (3.04 - 4.18) |
8.77 (8.30 - 9.24) |
12.36 (12.19 - 12.54) |
3.88 (3.46 - 4.29) |
| 2002 | 9.83 (7.72 - 12.35) |
3.73 (3.16 - 4.31) |
8.83 (8.36 - 9.30) |
12.62 (12.44 - 12.79) |
3.80 (3.41 - 4.20) |
| 2003 | 10.06 (7.98 - 12.52) |
3.07 (2.57 - 3.56) |
9.04 (8.57 - 9.51) |
12.45 (12.27 - 12.63) |
3.53 (3.16 - 3.91) |
| 2004 | 11.48 (9.15 - 13.81) |
3.42 (2.92 - 3.92) |
8.79 (8.33 - 9.25) |
12.64 (12.46 - 12.81) |
3.84 (3.47 - 4.22) |
| 2005 | 10.47 (8.36 - 12.95) |
3.49 (2.99 - 4.00) |
8.85 (8.40 - 9.31) |
12.87 (12.69 - 13.05) |
3.98 (3.61 - 4.36) |
| 2006 | 9.86 (7.86 - 12.20) |
3.45 (2.96 - 3.94) |
8.80 (8.35 - 9.25) |
12.77 (12.59 - 12.94) |
3.51 (3.16 - 3.85) |
| 2007 | 13.03 (10.68 - 15.39) |
3.55 (3.07 - 4.02) |
8.92 (8.47 - 9.36) |
12.89 (12.71 - 13.07) |
3.65 (3.31 - 3.99) |
| 2008 | 9.85 (7.90 - 12.14) |
2.79 (2.38 - 3.20) |
7.84 (7.42 - 8.25) |
11.27 (11.11 - 11.43) |
3.08 (2.78 - 3.39) |
| 2009 | 8.01 (6.34 - 9.99) |
2.61 (2.22 - 3.01) |
7.76 (7.35 - 8.17) |
11.38 (11.22 - 11.54) |
3.31 (3.00 - 3.62) |
| 2010 | 11.90 (9.70 - 14.09) |
2.62 (2.24 - 3.00) |
8.05 (7.64 - 8.46) |
11.46 (11.30 - 11.62) |
3.10 (2.80 - 3.39) |
| 2011 | 8.87 (7.07 - 10.68) |
2.46 (2.11 - 2.81) |
7.53 (7.13 - 7.92) |
11.32 (11.16 - 11.48) |
3.11 (2.83 - 3.40) |
| 2012 | 9.40 (7.57 - 11.23) |
2.31 (1.98 - 2.64) |
8.02 (7.62 - 8.42) |
11.26 (11.10 - 11.42) |
2.73 (2.47 - 2.99) |
| 2013 | 9.33 (7.60 - 11.07) |
2.32 (2.00 - 2.65) |
7.90 (7.51 - 8.29) |
11.21 (11.05 - 11.36) |
3.18 (2.91 - 3.45) |
| 2014 | 8.95 (7.29 - 10.61) |
2.33 (2.03 - 2.64) |
7.07 (6.70 - 7.43) |
10.76 (10.61 - 10.91) |
2.90 (2.64 - 3.15) |
| 2015 | 9.77 (8.11 - 11.43) |
2.28 (1.99 - 2.58) |
7.13 (6.77 - 7.48) |
10.63 (10.48 - 10.78) |
2.68 (2.44 - 2.91) |
| 2016 | 7.74 (6.31 - 9.16) |
2.05 (1.77 - 2.32) |
7.37 (7.02 - 7.73) |
10.63 (10.48 - 10.78) |
2.93 (2.69 - 3.18) |
| 2017 | 9.30 (7.73 - 10.87) |
2.11 (1.84 - 2.38) |
7.08 (6.74 - 7.43) |
10.36 (10.21 - 10.50) |
2.49 (2.28 - 2.71) |
| 2018 | 9.55 (8.01 - 11.09) |
1.91 (1.66 - 2.17) |
6.94 (6.60 - 7.27) |
10.10 (9.96 - 10.24) |
2.36 (2.16 - 2.57) |
| 2019 | 9.54 (8.04 - 11.04) |
1.89 (1.65 - 2.13) |
6.76 (6.44 - 7.09) |
10.13 (9.99 - 10.27) |
2.49 (2.29 - 2.70) |
| 2020 | 9.84 (8.34 - 11.34) |
1.92 (1.69 - 2.16) |
7.19 (6.86 - 7.51) |
10.13 (9.99 - 10.27) |
2.50 (2.30 - 2.70) |
Table 1.
Demographic Characteristics of Deaths due to COPD and lung cancer in the USA from 1999 to 2020.
Table 1.
Demographic Characteristics of Deaths due to COPD and lung cancer in the USA from 1999 to 2020.
| Variable | COPD and lung cancer Deaths | Age Adjusted Mortality Rate (AAMR) per 100,000 |
|---|---|---|
| Overall Population | 484,941 | 10.14 (10.12 - 10.17) |
| Sex | ||
| Male | 269,052 | 13.02 (12.97 - 13.07) |
| Female | 215,889 | 8.02 (7.98 - 8.05) |
| US Census Region | ||
| Northeast | 78,941 | 8.53 (8.47 - 8.59) |
| Midwest | 127,180 | 11.89 (11.82 - 11.95) |
| South | 191,362 | 10.80 (10.76 - 10.85) |
| West | 87,458 | 8.60 (8.55 - 8.66) |
| Race / Ethnicity | ||
| NH American Indian or Alaska Native | 2,476 | 9.58 (9.18 - 9.97) |
| NH Asian or Pacific Islander | 4,367 | 2.54 (2.47 - 2.62) |
| NH Black or African American | 34,577 | 7.91 (7.83 - 8.00) |
| NH White | 432,331 | 11.39 (11.35 - 11.42) |
| Hispanic / Latino | 1,011 | 4.36 (4.09 - 4.64) |
| Urban/ Rural | ||
|
Urban |
369,029 (100%) |
9.41 (9.38 - 9.44) |
| Rural |
115,912 (100%) |
13.60 (13.52 - 13.68) |
Table 2.
Annual Percentage Changes (APCs) and Average Annual Percentage Changes (AAPCs) in COPD and lung cancer, United States, 1999–2020.
Table 2.
Annual Percentage Changes (APCs) and Average Annual Percentage Changes (AAPCs) in COPD and lung cancer, United States, 1999–2020.
| Variable | Trend Segment | Segment End points | APC (95% CI) | AAPC (95% CI) |
|---|---|---|---|---|
|
Overall Population |
1 | 1999 – 2005 | 0.078(-1.19 to 1.36) | -1.40(-1.80 to -1.00) |
| 2 |
2005 – 2020 |
-1.99(-2.30 to -1.69) |
||
| Sex | ||||
|
Female |
1 | 1999 – 2005 | 1.51(0.25 to 2.78) | -1(-1 to -0) |
|
|
2 |
2005 – 2020 |
-1.37(-1.65 to -1.09) |
|
| Male | 1 | 1999 – 2006 | -0.77(-1.33 to -2.07 | -2(-3 to -2) |
| 2 | 2006 – 2009 | -5.13(-8.96 to -1.13) | ||
| 3 | 2009 – 2020 | -2.16(-2.43 to -1.88) | ||
| US Census Region | ||||
|
Northeast |
1 | 1999 – 2006 | 0.16(-1.10 to 1.44) | -1.81(-2.30 to -1.33) |
| 2 | 2006 – 2020 | -2.79(-3.24 to -2.33) | ||
| Midwest | 1 | 1999 – 2005 | 0.97(-0.55 to 2.51) | -0.95(-1.42 to -0.49) |
| 2 | 2005 – 2020 | -1.71(-2.07 to -1.36) | ||
|
South |
1 | 1999 – 2006 | 0.19(-0.51 to 0.90) | -0.87(-1.60 to -0.15) |
| 2 | 2006 – 2009 | -4.27(-9.15 to 0.87) | ||
| 3 | 2009 – 2020 | -0.60(-0.93 to -0.28) | ||
|
West |
1 | 1999 – 2005 | -0.19 (-1.68 to 1.30) | -2.50(-2.96 to -2.05) |
| 2 | 2005 – 2020 | -3.41(-3.77 to -3.05) | ||
| Race / Ethnicity a | ||||
| NH American Indian or Alaska Native | 1 | 1999 – 2020 | -0.26(-1.16 to 0.64) | -0.26(-1.16 to 0.64) |
|
Hispanic / Latino |
1 | 1999 – 2020 | -2.52(-2.93 to -2.11) | -2.52(-2.93 to -2.11) |
|
NH Black or African American |
-1.55(-1.80 to -1.30) |
|||
| 1 |
1999 – 2020 |
-1.55(-1.80 to -1.30) |
||
| NH White | 1 | 1999 – 2005 | 0.46(-0.85 to 1.79) | -1.03(-1.44 to -0.63) |
| 2 |
2005 – 2020 |
-1.63(-1.94 to -1.31) |
||
|
NH Asian or Pacific Islander |
1 | 1999 – 2007 | -0.52(-2.14 to 1.13) | -2.93(-4.84 to -0.98) |
| 2 | 2007 – 2010 | -9.30(-21.32 to 4.57) | ||
| 3 | 2010 – 2020 | -2.86(-3.82 to -1.88) | ||
| Urban/Rural | ||||
| Urban | 1 |
1999 – 2005 |
-1.30(-1.35 to 1.10) |
-1.63(-2.00 to -1.25) |
| 2 | 2005 – 2020 | -2.22(-2.52 to -1.93) |
||
| Rural | 1 | 1999 – 2006 | 1.55(1.03 to 2.07) | |
| 2 | 2006 – 2009 | -4.23(-7.69 to -0.60) | -0.33(-0.86 to 0.18) |
|
| 3 | 2009 – 2020 | -0.46(-0.70 to -0.21) | ||
Table 6.
States- Stratified COPD and lung cancer related mortality Per 100,000 In The United States,1999-2020.
Table 6.
States- Stratified COPD and lung cancer related mortality Per 100,000 In The United States,1999-2020.
| States | Deaths | AAMR |
|---|---|---|
| Alabama | 7,784 | 10.04 (9.82 - 10.26) |
| Alaska | 701 | 10.55 (9.73 - 11.38) |
| Arizona | 5,913 | 5.76 (5.61 - 5.90) |
| Arkansas | 5,357 | 11.03 (10.74 - 11.33) |
| California | 44,340 | 8.72 (8.63 - 8.80) |
| Colorado | 6,131 | 9.32 (9.08 - 9.56) |
| Connecticut | 5,421 | 9.05 (8.80 - 9.29) |
| Delaware | 1,623 | 10.75 (10.22 - 11.27) |
| District of Columbia | 487 | 5.83 (5.31 - 6.35) |
| Florida | 32,947 | 8.70 (8.61 - 8.80) |
| Georgia | 10,481 | 8.36 (8.20 - 8.52) |
| Hawaii | 1,109 | 4.88 (4.59 - 5.17) |
| Idaho | 2,172 | 9.55 (9.15 - 9.95) |
| Illinois | 17,601 | 9.20 (9.06 - 9.33) |
| Indiana | 14,863 | 14.87 (14.63 - 15.11) |
| Iowa | 6,744 | 12.72 (12.41 - 13.02) |
| Kansas | 4,886 | 10.95 (10.64 - 11.26) |
| Kentucky | 12,451 | 18.06 (17.74 - 18.38) |
| Louisiana | 5,166 | 7.63 (7.42 - 7.84) |
| Maine | 3,003 | 12.10 (11.66 - 12.54) |
| Maryland | 8,446 | 10.00 (9.78 - 10.21) |
| Massachusetts | 7,943 | 7.33 (7.17 - 7.49) |
| Michigan | 17,995 | 11.09 (10.93 - 11.25) |
| Minnesota | 8,521 | 10.48 (10.25 - 10.70) |
| Mississippi | 5,033 | 11.10 (10.79 - 11.41) |
| Missouri | 12,499 | 12.76 (12.53 - 12.98) |
| Montana | 1,683 | 9.84 (9.37 - 10.32) |
| Nebraska | 4,017 | 13.83 (13.40 - 14.26) |
| Nevada | 2,619 | 6.92 (6.65 - 7.19) |
| New Hampshire | 2,359 | 11.06 (10.61 - 11.51) |
| New Jersey | 10,663 | 7.59 (7.44 - 7.73) |
| New Mexico | 2,133 | 6.79 (6.50 - 7.08) |
| New York | 21,391 | 6.90 (6.81 - 7.00) |
| North Carolina | 16,664 | 11.40 (11.22 - 11.57) |
| North Dakota | 1,334 | 11.67 (11.04 - 12.30) |
| Ohio | 28,571 | 14.86 (14.69 - 15.03) |
| Oklahoma | 9,670 | 16.28 (15.96 - 16.61) |
| Oregon | 7,414 | 11.73 (11.46 - 12.00) |
| Pennsylvania | 24,307 | 10.55 (10.42 - 10.68) |
| Rhode Island | 2,435 | 13.34 (12.81 - 13.88) |
| South Carolina | 8,360 | 11.17 (10.93 - 11.41) |
| South Dakota | 1,684 | 12.21 (11.63 - 12.80) |
| Tennessee | 14,590 | 14.43 (14.20 - 14.67) |
| Texas | 35,726 | 11.40 (11.28 - 11.52) |
| Utah | 1,113 | 3.76 (3.54 - 3.98) |
| Vermont | 1,419 | 13.16 (12.47 - 13.85) |
| Virginia | 10,156 | 8.78 (8.60 - 8.95) |
| Washington | 11,268 | 11.40 (11.18 - 11.61) |
| West Virginia | 6,421 | 18.52 (18.06 - 18.97) |
| Wisconsin | 8,465 | 9.17 (8.97 - 9.36) |
| Wyoming | 862 | 10.48 (9.78 - 11.19) |
Table 7.
Plac eof death- Stratified COPD and lung cancer related mortality Per 100,000 In The United States,1999-2020.
Table 7.
Plac eof death- Stratified COPD and lung cancer related mortality Per 100,000 In The United States,1999-2020.
| Place of Death | Deaths | Percentage |
|---|---|---|
| Medical Facility | 163245 | 33.67% |
| Decedent’s home | 187,313 | 38.63% |
| Hospice facility | 31,960 | 6.59% |
| Nursing home | 79,904 | 16.48% |
| Other | 21,392 | 4.41% |
Disclaimer/Publisher’s Note: The statements, opinions and data contained in all publications are solely those of the individual author(s) and contributor(s) and not of MDPI and/or the editor(s). MDPI and/or the editor(s) disclaim responsibility for any injury to people or property resulting from any ideas, methods, instructions or products referred to in the content. |
© 2025 by the authors. Licensee MDPI, Basel, Switzerland. This article is an open access article distributed under the terms and conditions of the Creative Commons Attribution (CC BY) license (http://creativecommons.org/licenses/by/4.0/).
Copyright: This open access article is published under a Creative Commons CC BY 4.0 license, which permit the free download, distribution, and reuse, provided that the author and preprint are cited in any reuse.


