
Submitted:
03 July 2025
Posted:
04 July 2025
You are already at the latest version
Abstract
The classification of urban residential settlements using Machine Learning (ML) and Deep Learning (DL) methods is challenging due to the complexity and heterogeneity of urban environments, which require extensive and precisely labeled training datasets that are of-ten unavailable. To address this limitation, this research proposes an innovative unsu-pervised classification framework that leverages Fuzzy C-Means (FCM) clustering within a GIS-based approach. The proposed method performs a fuzzy classification of census data, which represents the atomic unit of urban analysis, based on construction tech-niques and building eras. The framework clusterizes census area with similar building characteristics, offering a flexible and data-driven approach to urban classification. The analysis of cluster centroids’ predominant features enables a detailed interpretation of the urban fabric’s spatial organization. The resulting thematic maps visualize the distribution and significance of the identified clusters, providing valuable insights into urban mor-phology. The framework has been validated through its application to ten sample Italian cities, representative of diverse urban contexts. The results demonstrate the effectiveness of this approach in supporting decision makers by identifying homogeneous areas in terms of building characteristics, thus facilitating targeted interventions on existing buildings in urban settlements. This innovative methodology represents a powerful tool for the sys-tematic analysis of urban building features and the strategic planning of renovation in-terventions.
Keywords:
FCM
; GIS
; multiclassification
; unsupervised classification
; urban settlement
; residential buildings
1. Introduction
An analysis of urban building structure is fundamental for identifying the distinctive characteristics of the building fabric and guiding targeted interventions. Traditionally, this process has relied on manual classification methods, which are time-consuming and labor-intensive.
The rapid and heterogeneous urban development of contemporary cities further complicates the reading and understanding of the built environment configuration.
Studies on urban settlement classification play a crucial role in multiple disciplines, supporting applications such seismic vulnerability modeling, energy planning and urban retrofitting strategies aimed at the reducing of carbon emissions.
Conventional image-based mapping approaches become impractical metropolitan scale studies due to the extensive manual effort required [1]. This underscores the need for automated methods capable of efficiently analyzing complex urban fabrics.
The growing integration of AI Machine Learning (ML) e Deep Learning (DL) computer vision techniques into urban studies has introduced innovative methods for analyzing and interpreting city structures [2]. This approach has opened a better understanding of the complexities of urban settlements, allowing researchers to explore urban forms and patterns with greater precision and depth.
ML techniques are widely used in urban studies to analyze and classify spatial structures, detect patterns, and model complex relationships within the built environment [2,3]. These approaches enable the automated extraction of relevant features from large-scale urban datasets, facilitating tasks such as land-use classification, transportation network analysis, and spatial clustering. ML classification methods can be applied to identify correlations and trends that might not be immediately apparent, improving the understanding of urban growth, density, and functionality. DL techniques extend the capability of ML methods in analyzing urban structures by enhancing feature extraction and pattern recognition. These techniques leverage digital image representations of physical urban forms, captured from drones or patches cropped from satellite images. DL models, originally developed for general image classification tasks, can be adapted and trained to categorize the urban fabric patterns depicted in these images into morphological types. While ML relies on predefined statistical and computational intelligence techniques to detect correlations and classify spatial structures, DL goes further by employing hierarchical feature learning, allowing for the automatic identification of complex urban patterns from large-scale imagery.
Despite the increasing use of ML and DL models in urban settlement studies, several critical research gaps persist:
- Dependence on labeled training data: ML and DL models require high-quality training datasets, meaning large amounts of precisely labeled data, a resource that is often expensive and time-consuming to produce. This dependency represents a major challenge in applying these methods effectively.
- Limited Portability of classification models: since ML and DL methods rely heavily on locally trained datasets, their applicability is often limited to specific urban contexts. This dependence on local training data reduces the adaptability of these classification models, limiting their ability to accurately analyze the building fabric in diverse urban settlements.
- Heterogeneity and Complexity of Urban Settlements: Cities exhibit highly diverse configurations due to their unique historical, economic, and socio-political development processes. This diversity makes it difficult to apply rigid ML/DL models, which typically require homogeneous and well-labeled datasets, thus restricting their usability to specific local conditions.
These limitations impact the usability of MD and DL models in large-scale urban studies and necessitate alternative approaches better suited for complex urban morphologies.
To overcome the above issues, this study introduces an innovative unsupervised classification framework based on FCM clustering for partitioning an urban settlement in urban patterns, which represent urban agglomerations with specific building characteristics.
The urban settlement is initially divided into subzones, given by atomic urban areas with homogeneous urban characteristics, which serve as the atomic unit for urban analysis. A set of FCM-based validity indices are used to determine the optimal number of clusters. After executing FCM, a fuzzification process is performed, in which each cluster is related to an urban pattern, based on the feature values of its centroid. Finally, adjacent subzones assigned to the same urban pattern are dissolved and the thematic map is provided in which the urban settlement is partitioned in urban patterns.
Unlike ML and DL classification methods, the proposed framework does not require pre-labeled training data, allowing for a more flexible, scalable, and adaptable classification of urban settlements. It categorizes subzones by analyzing construction techniques and building eras, providing a structured and adaptable method to classify the built environment.
The framework ensures high scalability and portability, enabling its application across different urban settlements, without the need for model recalibration. Additionally, the use of FCM allows for a more nuanced representation of the built environment by capturing gradual transitions between different building characteristics, an aspect often overlooked by rigid classification models.
A key feature of the framework is the automated generation of GIS-based thematic maps, which provide a spatial visualization of the distribution and significance of the identified clusters. These maps serve as a powerful tool for urban planners, policymakers, and stakeholders, facilitating data-driven decision-making for urban redevelopment and conservation strategies.
The proposed framework has been validated through its application to ten Italian cities, representing diverse urban morphologies. Urban subzones are constituted by census areas, which represent homogeneous spatial units for urban characteristics.
The analysis of cluster centroids allowed for the identification of recurring patterns and significant differences between the studied cities, demonstrating the reliability of the method in characterizing different urban residential typologies.
The remainder of this paper is organized as follows:
Section 2 presents a literature review on related works centered around urban typo- form classification studies. Section 3 introduces the proposed framework for the urban subzone classification. Section 4 describes the experiment settings and then presents the results. Section 5 concludes the paper and discusses its contribution.
2. Related Work
The classification of urban form has historically been based on an empirical approach that relies on direct observation, cartographic analysis, and the interpretation of socio-economic and morphological data.
Early studies used cartographic analysis, field surveys, and census data to classify urban structures based on morphological and functional characteristics [4,5].
These methods provided valuable insights into urban form and spatial organization, but were inherently time-consuming, resource-intensive, and difficult to apply at scale in rapidly changing metropolitan areas.
Their reliance on visual interpretation and historical records limited their adaptation to dynamic urban transformations. Furthermore, traditional typological classifications based on morphological attributes [6,7] required expert analysis, making their large-scale implementation difficult.
While traditional methods laid the groundwork for urban morphology studies, the integration of Artificial Intelligence (AI) and data-driven analytical approaches represents a significant evolution, allowing for more structured analyses and classifications of urban structures. Among the various AI techniques, ML plays a central role in urban analysis. Due to its ability to analyze geographic data, extract meaningful insights from complex spatial information, and continuously improve its performance, ML provides a scalable and adaptive approach to studying the evolving morphology of contemporary metropolitan areas [8,9].
ML encompasses a range of algorithms, each designed to handle specific types of problems and datasets. The selection of an appropriate method depends on various factors, including the complexity of the data, the need for labeled examples, and the desired outcome of the analysis [10,11,12].
Among these approaches, Supervised Learning (SL) stands out as one of the most widely used techniques in urban classification, as it relies on labeled training data to recognize patterns and categorize spatial structures. Supervised learning methods are particularly effective in classification and regression tasks, making them essential tools for analyzing and modeling urban settlements [13].
Classification methods are widely employed for tasks such as distinguishing land-use types, identifying species, or making predictive analyses [14].
In the context of urban analysis, several SL algorithms, including Support Vector Machines (SVM), Decision Trees (DT), and Random Forests (RF), have been extensively used for land-use classification and Built-up area detection. These methods work by identifying common characteristics in urban structures from labeled data, enabling a more systematic and data-driven approach to understanding and categorizing the urban fabric.
SVMs are particularly effective for high-dimensional urban classification problems, as they can delineate complex boundaries between different urban typologies. They classify urban areas based on their spectral and morphological features, enabling precise land-use mapping.
SVMs have been widely used to monitor land-use change, distinguish between built-up and non-built-up areas, and identify morphological patterns in urban settlements [15].
DTs are effective methods for classifying spatial and non-spatial datasets in urban studies. Starting from Satellite imagery, GIS data, socio-economic indicators, morphological characteristics of buildings, DT classifies urban settlements based on a hierarchy of rules derived from data attributes, facilitating urban segmentation and land-use prediction. DTs have been used to identify residential, commercial, and industrial areas, as well as to assess urban land-use changes over time [16].
RFs is a learning method that extends Decision Trees by improving model robustness and reducing overfitting. Starting from Remote sensing imagery, LiDAR data and census datasets, RF enables the classification of different urban zones based on their spatial and morphological characteristics. It can detect spatial heterogeneity in the built environment and assess urban density variations. RF has been applied to differentiate between residential, industrial, and commercial areas, and to evaluate environmental impacts related to urbanization [17,18].
While SVM algorithms are commonly used to detect and classify urban forms from remote sensing images, identifying building structures by analyzing open space distribution and distinguishing densely built-up areas from unbuilt areas, DTs and RFs rely on a broader range of spatial and morphological features, including tabular variables. These models classify urban areas based on land-use types and differentiate between residential, commercial, and industrial zones by evaluating their structural and environmental characteristics [19].
Moreover, DL, a subset of ML that relies on Artificial Neural Networks (ANNs), has proven to be highly efficient in processing extensive and complex data sets, such as satellite images, for purposes like categorizing images and objects identification [20]. DL offers a flexible and non-linear approach to analyzing urban environments by learning complex spatial relationships. Through the analysis of high-resolution satellite imagery, orthophotos, and geospatial data DL can identify intricate urban structures, segment buildings, and detect infrastructural elements. These techniques have been applied in the automatic generation of urban maps, monitoring urban sprawl, and assessing building morphology at different scales [21].
Deep Learning techniques, such as Convolutional Neural Networks (CNNs) and Deep Neural Forests (DNFs), have demonstrated significant potential in remote sensing and urban analysis. These methods leverage high-resolution satellite imagery and multi-source geospatial data for tasks including land-use classification, semantic segmentation, and change detection. CNNs, in particular, excel at extracting spatial features for urban mapping, while DNFs enhance classification accuracy by integrating hierarchical decision processes [22].
Both CNNs and Deep Neural Forests (DNFs) utilize multispectral satellite data for land-use classification, leveraging spectral band characteristics to enhance accuracy. While these methods improve upon previous approaches, they present two key limitations:
- some spectral bands have low-resolution imagery, which may reduce classification precision;
- blurred areas can be present due to atmospheric interference, sensor limitations, or preprocessing errors.
Despite these challenges, CNNs and DNFs effectively classify urban settlements, distinguishing various land-use types and differentiating built-up areas from non-built-up zones. However, they require large, high-quality training datasets, and in some cases, low-resolution data may affect Deep Learning model performance.
These models primarily focus on land-use classification, which, while valuable, does not fully capture the complexity of urban morphology and spatial organization.
While supervised learning (SL) has been widely applied in urban studies, it faces significant limitations due to its reliance on labeled training data, which is often costly and time-consuming to obtain [23,24].
Additionally, SL models lack adaptability, as their performance is highly dependent on context-specific datasets, limiting their scalability across different urban environments [25].
Given these constraints, unsupervised learning (UL) has emerged as a powerful alternative, allowing for pattern discovery in unlabeled urban datasets [26]. Unlike SL, which relies on predefined categories, UL techniques automatically cluster data based on intrinsic similarities, making them well-suited for the heterogeneity of urban environments [27]. Recent research underscores the potential of UL in urban classification, as it provides more flexible and scalable analytical frameworks for complex urban structures [28].
Unlike satellite image-based methods, some studies employ clustering techniques to classify urban structures using alternative data sources. K-Means, for example, has been applied to classify urban areas based on socioeconomic indicators, infrastructure attributes, and spatial characteristics, offering an alternative approach to urban classification beyond remote sensing.
K-Means [29], assigns data points to the nearest cluster centers iteratively calculated by the algorithm. The number of clusters is predefined by the user, influencing the segmentation results.
In [30] Zhou et al. utilized hierarchical clustering and Principal Component Analysis (PCA) to classify 8,910 global urban street networks based on 25 morphological indicators. Their study demonstrated that clustering methods can effectively reveal spatial patterns of urban forms, distinguishing cities based on size, regularity, and topological complexity.
However, these techniques assume rigid class boundaries, making them unsuitable for modelling the gradual transitions characteristic of urban fabrics [31]. Moreover, their reliance on predefined cluster numbers reduces their adaptability to different urban contexts.
In [32] the authors propose a clustering ensemble framework that integrates multiple clustering methods to improve classification robustness and reliability.
Their study, which applies this framework to 3D building data in Guangzhou, demonstrates the potential of combining hierarchical clustering, Gaussian Mixture Models (GMM), spectral clustering (SC), Fuzzy C-Means (FCM) and K-Means to identify urban form typologies. However, despite these advances, few studies have explored the potential of FCM clustering for urban form classification, despite its ability to handle soft boundaries and overlapping spatial categories—critical aspects of urban morphology. This research aims to fill this gap by leveraging FCM clustering to analyze urban settlement patterns with greater flexibility and adaptability.
The primary limitation of partitioning clustering approaches in urban form classification lies in the selection of the number of clusters. Defining a fixed number of clusters introduces portability issues, as urban form characteristics can vary significantly from city to city. This variability necessitates adjusting the cluster count based on the specific urban context, reducing the adaptability and generalizability of the classification model.
The following sections detail the workflow of the proposed framework, including the dataset preparation, the clustering algorithm configuration, and the visualization of results through GIS-based thematic mapping. This process allows for the identification of urban clusters while capturing gradual transitions between different building characteristics, an aspect often overlooked by rigid classification models.
3. The Proposed Framework
To overcome the limitations of the ML and DL approaches discussed earlier, this study introduces a replicable unsupervised classification framework based on FCM. Unlike supervised ML and DL techniques, which rely on labeled datasets, and traditional partitioning clustering methods, which require a predefined number of clusters, the proposed framework, illustrated in the flow diagram in Figure 1, offers a more flexible and adaptive approach to urban classification.
The urban area of study is partitioned into subzones, consisting of urban areas with homogeneous characteristics. A subzone represents the atomic urban unit.
After acquiring from institutional sources census data collected by subzones, the framework performs a subzone classification based on the characteristics of the buildings being censused.
The objective of this classification process is to identify significant patterns that typify the urban area under study. This process is achieved by running FCM and subsequently mapping each cluster to a pattern that represents a typology of urban form. The framework is designed to be adaptable, allowing researchers and urban planners to select any relevant set of features related to census areas for clustering, based on their specific objectives and available data.
The proposed framework is structured into multiple sequential phases, integrating the FCM algorithm within a GIS-based spatial analysis approach.
The methodological process consists of the following key phases:
- Data Collection and Preprocessing
The proposed methodology starts with census data collection, which serves as the foundation for the classification process. This data provides essential spatial and demographic information, including administrative boundaries, population distribution, and building characteristics, that define the spatial configuration of the study area. Census areas represent the subzones and serve as the primary analytical units, ensuring a systematic and standardized basis for classification.
- Feature Selection and Dataset Construction
A feature selection step is conducted to identify the most relevant building variables for classification. The framework is designed to be flexible, imposing no constraints on feature choice, thus allowing researchers to tailor the selection according to the specific objectives and context of the study. The selected variables are then standardized and normalized in the interval [0, 1] to ensure consistency in data representation.
- Clustering Process
The clustering process represents the core of the framework. Through the implementation of FCM, each census area is assigned a membership degree to multiple clusters, capturing the continuous and gradual transitions that characterize urban morphology.
This process consists of the following steps:
- -
- Validity Index Calculation: To determine the optimal number of clusters, six well-known validity metrics are computed: Xie-Beni, Partition Coefficient, and Fuzzy Silhouette indexes. Using multiple validity indexes ensures the accuracy of the optimal value of the class number. In fact, in some cases the optimal number of clusters determined with different validity measures may not be the same; then using multiple validity indexes allows to assign the appropriate number of clusters equal to the most frequent optimal value.
- -
- Execute FCM: Once the optimal number of clusters is established, the algorithm assigns each subzone to each detected cluster with a fuzzy membership degree.
The subzone is assigned to the cluster to which it belongs with the highest member degree. Each cluster is represented by a centroid, which reflects the average feature of the subzones most strongly associated with it.
Which represents those urban areas typified mostly by a set of characteristics.
- Cluster Labeling
Each census subzone is assigned to the cluster for which it exhibits the highest membership degree.
A fuzzification process is performed by analyzing the centroids of each cluster. To execute this process a fuzzification of the values of the features in each centroid is executed in which a Ruspini fuzzy partition [30] on the domain [0, 1] of the features is built, where the Ruspini condition ensures that the sum of the degrees of membership of a subzone to the clusters is equal to 1. The cluster is classified by assigning to each feature the label of the fuzzy set to which the cluster’s centroid feature value belongs. The fuzzy partition is given by the three triangular fuzzy sets in Figure 2.
As an example, let’s consider a set of 6 features, called:
f1: Percentage of residential buildings constructed in load-bearing masonry
f2: Percentage of residential buildings constructed in reinforced concrete
f3: Percentage of residential buildings constructed in laminated timber
f4: Percentage of residential buildings constructed before 1960
f5: Percentage of residential buildings constructed between 1960 and 2000
f6: Percentage of buildings constructed after 2000.
In the example in Table 1 the values of the features of a cluster centroid are assigned.
Then, to each feature is assigned the label of the fuzzy set to whom it belongs with greatest membership degree. Table 2 shows the labels with which the features of the cluster centroid are assigned.
Analyzing the result of this process we can deduce that the subzones belonging to this cluster are rubicund areas specifically characterized by recently formed building settlements built mainly using cross-laminated timber technology.
Then, this cluster identifies a pattern that could be labelled accordingly, e.g., as Contemporary Eco-Residential Zone.
- Subzones Dissolving and Thematic Map Generation
Finally, spatially contiguous subzones that belong to the same cluster are dissolved to form an urban area representing the pattern identified by the cluster.
The outcome of this process is a thematic map in which the urban settlement is partitioned in patterns, where each pattern is given by neighborhood subzones belonging to the same cluster.
We’ve implemented our method in the GIS-based suit ESRI ArcGIS PRO 3.4. The algorithm was implemented in Python language using the ERSI ARCPy library for ArcGIS PRO 3.4 and encapsulated in the GIS platform.
In the next section we show the results obtained by applying our method on a s
4. Results and Discussion
4.1. The Case Study
The experimental phase was carried out on a selection of ten Italian cities: Bari, Bologna, Bolzano, Cagliari, Florence, Genoa, Naples, Palermo, Turin, Trieste.
These cities were chosen to test how the framework performs in cities with different urban features. In fact, the selected cities have different histories, building types, and environments, which made them a good test to see how adaptable the method is.
For each city, a structured dataset was compiled based on census data from the 2011 population and building census dataset provided by the Italian National Statistical Institute (ISTAT). These data, collected at the level of census areas as the smallest territorial units used for statistical purposes, provided detailed information on population distribution, household composition, building typologies, and residential structures.
Population and building census data are collected every 10 years and released by the ISTAT; the last census dataset was carried out in 2021, but it does not include information on buildings due to the limited urban-residential development in Italian cities in the last decade. This led to the choice to use the previous census dataset from 2011.
4.2. Dataset Preprocessing
To construct the datasets to be used for evaluating the performances of the proposed clustering model, urban census areas without residential buildings were excluded from the analysis. This methodological choice allows us to work on a homogeneous sample, composed exclusively of comparable residential urban areas, in order to ensure greater consistency and reliability in the classification results.
To support the clustering process, a set of census-derived variables was selected, capturing both the construction period and the structural characteristics of residential buildings. Specifically, the 2011 ISTAT population and building census dataset provides detailed information on the structural typologies of residential buildings, such as load-bearing masonry, reinforced concrete and other materials (e.g., wood, steel), and on their construction periods, divided into twelve distinct time classes (e.g., pre-1919, 1919-1945, 1946-1960, etc.). These features provide valuable information on the evolution and stratification of the built urban environment over time. Table 3 summarizes the selected variables used in the clustering analysis.
To enable meaningful comparisons across census areas of varying sizes, all variables were transformed by dividing the raw value of each variable by the area of the corresponding census area. This process ensures that the dataset captures the density of each building characteristic per unit area, rather than absolute quantities, allowing the clustering algorithm to more effectively detect structural and temporal patterns in the urban fabric. Following normalization, all variables were finally scaled using a Min-Max normalization to project feature values onto a [0,1] interval. This ensures that each variable contributes equally to the clustering process, avoiding dominance by variables with inherently larger numeric ranges.
The final dataset is given by twelve features, corresponding to the variables in Table 3; it was then used as input for the FCM clustering algorithm.
4.3. Cluster Characterization and Centroid Analysis
After determining the optimal number of clusters using the six validity indices described previously; FCM is executed and each census subzone was assigned to the cluster for which it had the highest membership value. To assign a building specificity to each cluster, a fuzzification was applied to the feature values of the cluster centroid. This process uses the Ruspini fuzzy partition in Figure 3. given by three overlapping fuzzy numbers, called Low, Medium, and High.
Each feature value in the centroid was then assigned to the fuzzy set (Low, Medium or High) corresponding to the highest membership degree.
This fuzzy labeling process allows each cluster to be semantically described through the identification of the dominant building typologies and historical construction periods.
For example, a centroid with high values in load-bearing masonry and early construction periods is indicative of a historic urban fabric, while high values in reinforced concrete construction and recent construction periods suggest the presence of recent residential developments.
The cluster labelling process provides a detailed understanding of the spatial articulation of the built environment. Based on the combination of dominant features, each cluster was assigned a descriptive label that captures its most representative urban characteristics.
Labels such as “Historical masonry residential area”, “Post-war reinforced concrete area” or “Contemporary reinforced concrete residential area” were adopted to summarize the results and facilitate the communication of spatial patterns to stakeholders and professionals. These semantic labels enrich both the interpretability of the clustering results and their subsequent cartographic representation through GIS-based thematic mapping, allowing for a deeper understanding of the urban morphology in the cities under study.
Finally, the Subzone dissolving process is performed; neighborhood census zones belonging to the same cluster are dissolved in an urban pattern; the thematic map of the urban patterns is generated.
Now the details obtained applying the proposed methods to the city of Florence are shown and discussed. The city was segmented into four clusters; analyzing the values of the centroids of each cluster were assigned specific labels which semantically summarize the urban characteristics of each cluster.
Below, for each cluster, the results of the clustering and fuzzification processes are shown.
As can be seen from the results in Table 4.1, Cluster 1 is predominantly characterized by high values both in E5 - Residential buildings in load-bearing masonry (value: 0.2958, membership degree: High) and E8 – Buildings constructed before 1919 (value: 0.2803, membership degree: High)
At the same time, all other construction period variables (E9–E16) and structural typologies (E6: reinforced concrete, E7: other materials) fall within the Low fuzzy set, with very small or null values.
This suggests that Cluster 1 corresponds to the Historic mansory centre of Florence, where the architectural fabric is primarily composed of masonry buildings built before the 1919th.

Table 4.1.
Fuzzification of Cluster 1 centroids: Historic Masonry Core.
| ISTAT variable | Value | Membership degree to the three fuzzy sets | Label of the fuzzy set | ||
| Low | Medium | High | |||
| E5 | 0,2958 | 0,00 | 0,00 | 1,00 | High |
| E6 | 0,0228 | 1,00 | 0,00 | 0,00 | Low |
| E7 | 0,0172 | 1,00 | 0,00 | 0,00 | Low |
| E8 | 0,2803 | 0,00 | 0,00 | 1,00 | High |
| E9 | 0,0310 | 1,00 | 0,00 | 0,00 | Low |
| E10 | 0,0248 | 1,00 | 0,00 | 0,00 | Low |
| E11 | 0,0129 | 1,00 | 0,00 | 0,00 | Low |
| E12 | 0,0031 | 1,00 | 0,00 | 0,00 | Low |
| E13 | 0,0041 | 1,00 | 0,00 | 0,00 | Low |
| E14 | 0,0048 | 1,00 | 0,00 | 0,00 | Low |
| E15 | 0,0000 | 1,00 | 0,00 | 0,00 | Low |
| E16 | 0,0095 | 1,00 | 0,00 | 0,00 | Low |
The results in Table 4.2 indicate that all building features in Cluster 2 fall within the Low fuzzy membership set.
This suggests that this cluster corresponds to sparse or transitional residential development with low residential building density.
Table 4.2.
Fuzzification of Cluster 2 centroids: Peripheral Urban Zones.
| ISTAT variable | Value | Membership degree | Fuzzy set | ||
| Low | Medium | High | |||
| E5 | 0,0353 | 1,00 | 0,00 | 0,00 | Low |
| E6 | 0,0223 | 1,00 | 0,00 | 0,00 | Low |
| E7 | 0,0047 | 1,00 | 0,00 | 0,00 | Low |
| E8 | 0,0200 | 1,00 | 0,00 | 0,00 | Low |
| E9 | 0,0181 | 1,00 | 0,00 | 0,00 | Low |
| E10 | 0,0227 | 1,00 | 0,00 | 0,00 | Low |
| E11 | 0,0135 | 1,00 | 0,00 | 0,00 | Low |
| E12 | 0,0088 | 1,00 | 0,00 | 0,00 | Low |
| E13 | 0,0061 | 1,00 | 0,00 | 0,00 | Low |
| E14 | 0,0111 | 1,00 | 0,00 | 0,00 | Low |
| E15 | 0,0034 | 1,00 | 0,00 | 0,00 | Low |
| E16 | 0,0079 | 1,00 | 0,00 | 0,00 | Low |
Table 4.3 presents the fuzzy labeling of the centroid for Cluster 3. This cluster shows a clear predominance of both E6 – Reinforced concrete buildings with a High fuzzy membership (value: 0.2118) and E10 (1946–1960) and E11 (1961–1970) with Medium fuzzy memberships, indicating concentration of buildings constructed during the post-war period. All other variables fall within the Low fuzzy category.
This suggests a residential urban fabric developed primarily in the 1950s–1970s, dominated by reinforced concrete structures.
Table 4.3.
Fuzzification of Cluster 3 centroids: Reinforced Concrete Residential Zone.
| ISTAT variable | Value | Membership degree to the three fuzzy sets | Label of the fuzzy set | ||
| Low | Medium | High | |||
| E5 | 0,0501 | 1,00 | 0,00 | 0,00 | Low |
| E6 | 0,2118 | 0,00 | 0,00 | 1,00 | High |
| E7 | 0,0156 | 1,00 | 0,00 | 0,00 | Low |
| E8 | 0,0121 | 1,00 | 0,00 | 0,00 | Low |
| E9 | 0,0297 | 1,00 | 0,00 | 0,00 | Low |
| E10 | 0,1102 | 0,00 | 0,90 | 0,10 | Medium |
| E11 | 0,1246 | 0,00 | 0,75 | 0,25 | Medium |
| E12 | 0,0726 | 0,55 | 0,45 | 0,00 | Low |
| E13 | 0,0210 | 1,00 | 0,00 | 0,00 | Low |
| E14 | 0,0140 | 1,00 | 0,00 | 0,00 | Low |
| E15 | 0,0063 | 1,00 | 0,00 | 0,00 | Low |
| E16 | 0,0111 | 1,00 | 0,00 | 0,00 | Low |
The fuzzification results of the features of Cluster 4, shown in Table 4.4, reveal a clear predominance of buildings constructed with load-bearing masonry techniques, with a high degree of membership to the variable E5 (value: 0.1965). Furthermore, the most representative construction period is 1919-1945, as indicated by the high degree of membership associated with E9 (value: 0.3029), followed by the period 1946-1960 with a medium degree of membership, suggesting some post-war additions. These variables define the primary characteristics of this cluster, indicating a built environment composed largely of masonry structures developed during the interwar period and up to 1960. The remaining periods (from E11 to E16) and the structural categories show a low influence.
These urban features are located just beyond the historic center, forming a first suburban ring that preserves a compact and coherent morphological structure.
Given the structural and temporal attributes observed in the centroid, Cluster 4 was semantically labelled as Suburban Residential Area.
Table 4.4.
Fuzzification of Cluster 4 centroids: Load-bearing Masonry Residential Zone.
| ISTAT variable | Value | Membership degree | Fuzzy set | ||
| Low | Medium | High | |||
| E5 | 0,1965 | 0,00 | 0,03 | 0,97 | High |
| E6 | 0,0585 | 0,83 | 0,17 | 0,00 | Low |
| E7 | 0,0109 | 1,00 | 0,00 | 0,00 | Low |
| E8 | 0,0384 | 1,00 | 0,00 | 0,00 | Low |
| E9 | 0,3029 | 0,00 | 0,00 | 1,00 | High |
| E10 | 0,0837 | 0,33 | 0,67 | 0,00 | Medium |
| E11 | 0,0374 | 1,00 | 0,00 | 0,00 | Low |
| E12 | 0,0131 | 1,00 | 0,00 | 0,00 | Low |
| E13 | 0,0069 | 1,00 | 0,00 | 0,00 | Low |
| E14 | 0,0082 | 1,00 | 0,00 | 0,00 | Low |
| E15 | 0,0049 | 1,00 | 0,00 | 0,00 | Low |
| E16 | 0,0035 | 1,00 | 0,00 | 0,00 | Low |
To better visualize the distribution of urban typologies across the city of Florence, Figure 3 presents the final thematic map of the urban patterns, classified based on its cluster labels.
The map illustrates the spatial distribution of the four urban patterns identified in the city of Florence, based on the results of the fuzzy classification model.
In the map each cluster is associated with the corresponding semantic label; the spatial distribution of the patterns highlights the morphological differentiation within the urban fabric.
The Historic Masonry Nucleus (in green), located mainly in the central part of the city, delineates the oldest portion of the urban fabric. This cluster includes census areas where buildings constructed before 1919 with load-bearing masonry techniques are particularly widespread, reflecting the oldest portions of the urban settlement.
Adjacent to this area, the Residential Zone in Load-bearing Masonry (in blue) extends towards the eastern and north-eastern portions of the city. This zone includes buildings constructed mainly between 1919 and 1960, also with masonry techniques, and corresponds to development phases subsequent to the historic center.
The Reinforced Concrete Residential Zone (in red) is mainly located in the outer areas, particularly in the southern and south-eastern portions of the city. The buildings in this cluster were generally built between the 1940s and the 1970s and are characterized by the use of reinforced concrete, in line with post-war building practices.
The remaining areas of the city, assigned to the Peripheral Urban Zones cluster (in beige), are generally located at the urban fringes. These areas show lower values in all structural and temporal indicators of the buildings, suggesting a more heterogeneous or non-predominant pattern in terms of construction techniques and periods.
This process was performed for all the ten Italian cities; thematic maps of the urban patterns were generated for each city to spatially represent their spatial distribution. These maps allow for an immediate and intuitive reading of the morphological structure of urban settlements, providing visual insight into the spatial extent and concentration of homogeneous building typologies.
For brevity, below are shown the results obtained for three others Italian cities: Genoa, Naples and Turin. Figure 4, Figure 5 and Figure 6 show, respectively, the urban pattern thematic maps obtained for the cities of Genoa, Naples and Turin. In each map, the classified urban patterns are displayed using a distinct color scheme, with legends reflecting the semantic labels derived from the fuzzy centroid analysis. These visualizations serve as practical tools for identifying areas with similar construction characteristics and can support targeted urban regeneration strategies, especially in contexts marked by complex stratifications of building age and technique.
Figure 4 visualizes the spatial distribution of urban pattern of Genoa, in which each cluster is associated with a semantic label that synthetically captures its predominant construction characteristics. The Historic Masonry Core (in red) is distributed mainly along the coastal strip, the census areas that identify this pattern are aligned along the central valleys and hillsides of the city. This cluster includes census areas characterized by buildings constructed before 1919 with load-bearing masonry techniques. The Reinforced Concrete Residential Zones (in blue) appear more dispersed and fragmented, following the post-war urban expansion that occurred in the 1960s. The remaining areas are classified as Peripheral Urban Zones (in beige), located mostly in peripheral or less consolidated parts of the municipality. These zones do not show a predominance of any specific building technique or historical period, suggesting a more heterogeneous urban structure.
Figure 5 displays the spatial distribution of the urban patterns identified in the city of Naples. The classification highlights the structural and historical layering of the built environment. The Historic Masonry Core (in red) is concentrated in the oldest part of the city, particularly around the central and coastal areas. This cluster includes buildings mostly constructed before 1919 and built using traditional load-bearing masonry methods, reflecting the city’s historical urban core. The Reinforced Concrete Residential Zones (in blue) extend across various parts of the city, particularly in areas that underwent expansion during the 1960s and 1970s. The Peripheral Urban Zones (in beige) represent the rest of the city, often located in the outer margins of the urban territory. These zones exhibit a more mixed or less clearly defined building composition, without strong dominance of either specific structural types or time periods.
The spatial distribution of urban patterns in Turin is presented in Figure 6.
The classification outlines three distinct urban typologies: the Historic Masonry Core (in red) extends concentrically from the central part of the city and includes portions of the built environment dating back to before 1919, as well as to the 1946–1960 period. This dual component reflects both the historical center and the masonry-based expansion that followed World War II.
The Reinforced Concrete Residential Zones (in blue) are widely distributed across the municipality. These areas are associated with reinforced concrete buildings erected primarily between 1946 and 1970. Finally, the Peripheral Urban Zones (in beige) comprise census areas with no dominant structural typology or construction period. These are generally located at the outer edges of the city and may include mixed-use or less consolidated residential areas.
5. Conclusion
This study presents an innovative and replicable approach to classify urban settlements based on building characteristics, using the FCM clustering algorithm integrated into a GIS environment. The proposed methodology overcomes the limitations of traditional supervised Machine Learning and Deep Learning approaches, which strongly depend on massive, labeled datasets and are often not transferable between different urban contexts.
Starting from building census data summarized by subzones, where a subzone represents the minimum spatial unit of analysis, and applying a fuzzification process to the final clusters, the framework allows to identify urban patterns given by homogeneous areas according to the age and construction technique of residential buildings. Thanks to the fuzzy nature of the method, it is possible to represent gradual transitions between different urban morphologies, offering a more nuanced view of the built structure. The automatic generation of thematic maps further improves the usability of the method for planning and urban diagnosis purposes. The methodology has been tested on ten Italian cities, chosen for their morphological and historical variety, proving to be robust, flexible and easily adaptable. The identified urban patterns reflect the construction evolution over time and the technologies used, offering useful insights for urban analysts and decision makers. In future research we intend to include also socio-economic and spatial variables to enrich the classification process. Furthermore, the application of the framework in international urban settlements will allow us to further test its adaptability and refine its effectiveness.
In summary, the proposed framework is configured as a powerful and scalable tool for supporting decision makers in the analysis of urban patterns and in planning interventions in the fields of regeneration, energy retrofit and resilient planning.
Author Contributions
Conceptualization, R.C., B.C., V.D., F.D.M and V.M.; methodology, R.C., B.C., V.D., F.D.M and V.M.; software, R.C., B.C., V.D., F.D.M and V.M.; validation, R.C., B.C., V.D., F.D.M and V.M.; formal analysis, R.C., B.C., V.D., F.D.M and V.M.; investigation, R.C., B.C., V.D., F.D.M and V.M.; resources, R.C., B.C., V.D., F.D.M and V.M.; data curation, R.C., B.C., V.D., F.D.M and V.M.; writing—original draft preparation, R.C., B.C., V.D., F.D.M and V.M.; writing—review and editing, R.C., B.C., V.D., F.D.M and V.M.; visualization, R.C., B.C., V.D., F.D.M and V.M.; supervision, R.C., B.C., V.D., F.D.M and V.M. All authors have read and agreed to the published version of the manuscript.
Funding
This research received no external funding.
Data Availability Statement
The data presented in this study are available on request from the corresponding author.
Acknowledgments
The article has been developed within the context of the project RETURN (Multi-Risk sciEnce for resilienT commUnities undeR a changiNg climate) – the extended partnership that aims to strengthen research chains on environmental, natural and anthropogenic risks at national level and promote their participation in strategic European and global value chains.
Conflicts of Interest
The authors declare no conflicts of interest.
References
- Thakur, G.; Fan, J. 2021. MapSpace: POI-Based Multi-Scale Global Land Use Modeling. In Proceedings of the GIScience 2021 Short Paper Proceedings, Poznań, Poland, 27–30 September 2021. [Google Scholar] [CrossRef]
- Cai, Z.; Demuzere, M.; Tang, Y.; Wan, Y. The characteristic and transformation of 3D urban morphology in three Chinese mega-cities. Cities 2022, 131, 103988. [Google Scholar] [CrossRef]
- Chen, W.; Wu, A.N.; Biljecki, F. Classification of urban morphology with deep learning: Application on urban vitality. Comput. Environ. Urban Syst. 2021, 90, 101706. [Google Scholar] [CrossRef]
- Batty, M.; Longley, M. Fractal Cities - A Geometry of Form and Function; Academic Press: London, UK, 1994. [Google Scholar]
- Whitehand, J.W.R.; Samuels, I.; Conzen, M.P. Conzen, M.R.G. 1960: Alnwick, Northumberland: a study in town-plan analysis. Prog. Hum. Geogr. 2009, 33, 859–864. [Google Scholar] [CrossRef]
- Caniggia, G.; Maffei, G.L. Composizione architettonica e tipologia edilizia 1. Lettura dell’edilizia di base; Marsilio: Padova, Italy, 1979. [Google Scholar]
- Whitehand, J.W.R. British Urban Morphology: The Conzenian Tradition. Urban Morphol. 2001, 5, 103–109. [Google Scholar] [CrossRef]
- Koutra, S.; Ioakimidis, C.S. Unveiling the Potential of Machine Learning Applications in Urban Planning Challenges. Land 2023, 12, 83. [Google Scholar] [CrossRef]
- Arditi, Ayelet, and Eran Toch. Evaluating Package Delivery Crowdsourcing Using Location Traces in Different Population Densities. Computers, Environment and Urban Systems 2022, 96, 101842. [Google Scholar] [CrossRef]
- Wang, J. , and F. Biljecki. Unsupervised Machine Learning in Urban Studies: A Systematic Review of Applications. Cities 2022, 129, 103925. [Google Scholar] [CrossRef]
- Huertas-Tato, A. , et al. Machine Learning for Spatial Analyses in Urban Areas: A Scoping Review. Computers, Environment and Urban Systems 2022, 97, 101842. [Google Scholar]
- Wu, C.; Wang, J.; Wang, M.; Kraak, M.-J. . Machine Learning-Based Characterisation of Urban Morphology with the Street Pattern. Computers, Environment and Urban Systems 2024, 109, 102078. [Google Scholar] [CrossRef]
- Foody, G.M.; Mathur, A. Implementation of Machine-Learning Classification in Remote Sensing: An Applied Review. International Journal of Remote Sensing 2018, 39, 8803–8825. [Google Scholar] [CrossRef]
- Panđa, Lovre, Dorijan Radočaj, and Rina Milošević. Methods of Land Cover Classification Using WorldView-3 Satellite Images in Land Management. Technical Journal 2024, 18, 142–147. [Google Scholar] [CrossRef]
- Vakula, C.S.V.; Anitha, P. Building Footprint Extraction from LIDAR Data Using SVM Classification. Int. J. Sci. Res. Eng. 2019, 7. [Google Scholar]
- Samardžić-Petrović, Mileva, Suzana Dragićević, Branislav Bajat, and Miloš Kovačević. Exploring the Decision Tree Method for Modelling Urban Land Use Change. Geomatica 2015, 69, 313–325. [Google Scholar] [CrossRef]
- Kim, J. Building Classification Using Random Forest to Develop a Geodatabase for Probabilistic Hazard Information. Nat. Hazards Rev. 2022, 23, 3. [Google Scholar] [CrossRef]
- Ruiz Hernández, I. E., and W. Shi. A Random Forests Classification Method for Urban Land-Use Mapping Integrating Spatial Metrics and Texture Analysis. International Journal of Remote Sensing 2018, 39, 1175–1198. [Google Scholar] [CrossRef]
- Zhang, C.; Zhang, M.; Shi, W.; Sun, Z. Detailed Urban Land Use Land Cover Classification at the Parcel Level: A Comparison of Decision Tree, Random Forest, and Support Vector Machine. Sensors 2019, 19, 3120. [Google Scholar] [CrossRef]
- Rewhel, E.M. , Li, J.Q., Hamed, A.A., et al., Deep Learning Methods Used in Remote Sensing Images: A Review. Journal of Environmental & Earth Sciences 2023, 5, 33–64. [Google Scholar] [CrossRef]
- Qi, Yifan. Evaluation of Urbanization Quality Based on Deep Learning and Intelligent Algorithms. International Journal of High Speed Electronics and Systems 2024, 33, 2540144. [Google Scholar] [CrossRef]
- Lai, Fa, Anshu Sharma, Xuan Liu, and Xiaojun Yang. Deep Learning for Urban and Landscape Mapping from Remotely Sensed Imagery. In Urban Remote Sensing; Yang, X., Ed.; Chapter 8; Wiley: Hoboken, NJ, 2021. [Google Scholar] [CrossRef]
- Grekousis, G. Artificial neural networks and deep learning in urban geography: A systematic review and meta-analysis. Comput. Environ. Urban Syst. 2019, 74, 244–256. [Google Scholar] [CrossRef]
- Ullah, Z.; Al-Turjman, F.; Mostarda, L.; Gagliardi, R. Applications of Artificial Intelligence and Machine Learning in Smart Cities. Comput. Commun. 2020, 154, 313–323. [Google Scholar] [CrossRef]
- Li, Z.; Xia, L.; Tang, J.; Xu, Y.; Shi, L.; Xia, L.; Yin, D.; Huang, C. UrbanGPT: Spatio-Temporal Large Language Models. 2024, 5351–5362. [Google Scholar] [CrossRef]
- Wang, J.; Biljecki, F. Unsupervised machine learning in urban studies: A systematic review of applications. Cities 2022, 129, 103925. [Google Scholar] [CrossRef]
- Bengio, Y.; Courville, A.; Vincent, P. Representation learning: A review and new perspectives. IEEE Trans. Pattern Anal. Mach. Intell. 2013, 35, 1798–1828. [Google Scholar] [CrossRef] [PubMed]
- Wang, J.; Biljecki, F. Unsupervised machine learning in urban studies: A systematic review of applications. Cities 2022, 129, 103925. [Google Scholar] [CrossRef]
- Hartigan, J.A. , and M.A. Wong. “Algorithm AS 136: A K-means Clustering Algorithm.” Journal of the Royal Statistical Society. Series C (Applied Statistics) 1979, 28, 100–108. [Google Scholar] [CrossRef]
- Zhou, Q.; Bao, J.; Liu, H. Mapping Urban Forms Worldwide: An Analysis of 8910 Street Networks and 25 Indicators. ISPRS Int. J. Geo-Inf. 2022, 11, 370. [Google Scholar] [CrossRef]
- Oh, M.; Kim, Y. Identifying urban geometric types as energy performance patterns. Energy Sustain. Dev. 2019, 48, 115–129. [Google Scholar] [CrossRef]
- Bai, L., J. Liang, H. Du, and Y. Guo. “An Information-Theoretical Framework for Cluster Ensemble.” IEEE Transactions on Knowledge and Data Engineering 2019, 31, 1464–1477. [Google Scholar] [CrossRef]
- Ruspini, E.H. A new approach to clustering. Inf. Control 1969, 15, 22–32. [Google Scholar] [CrossRef]
Figure 1.
Flow diagram of the proposed method.
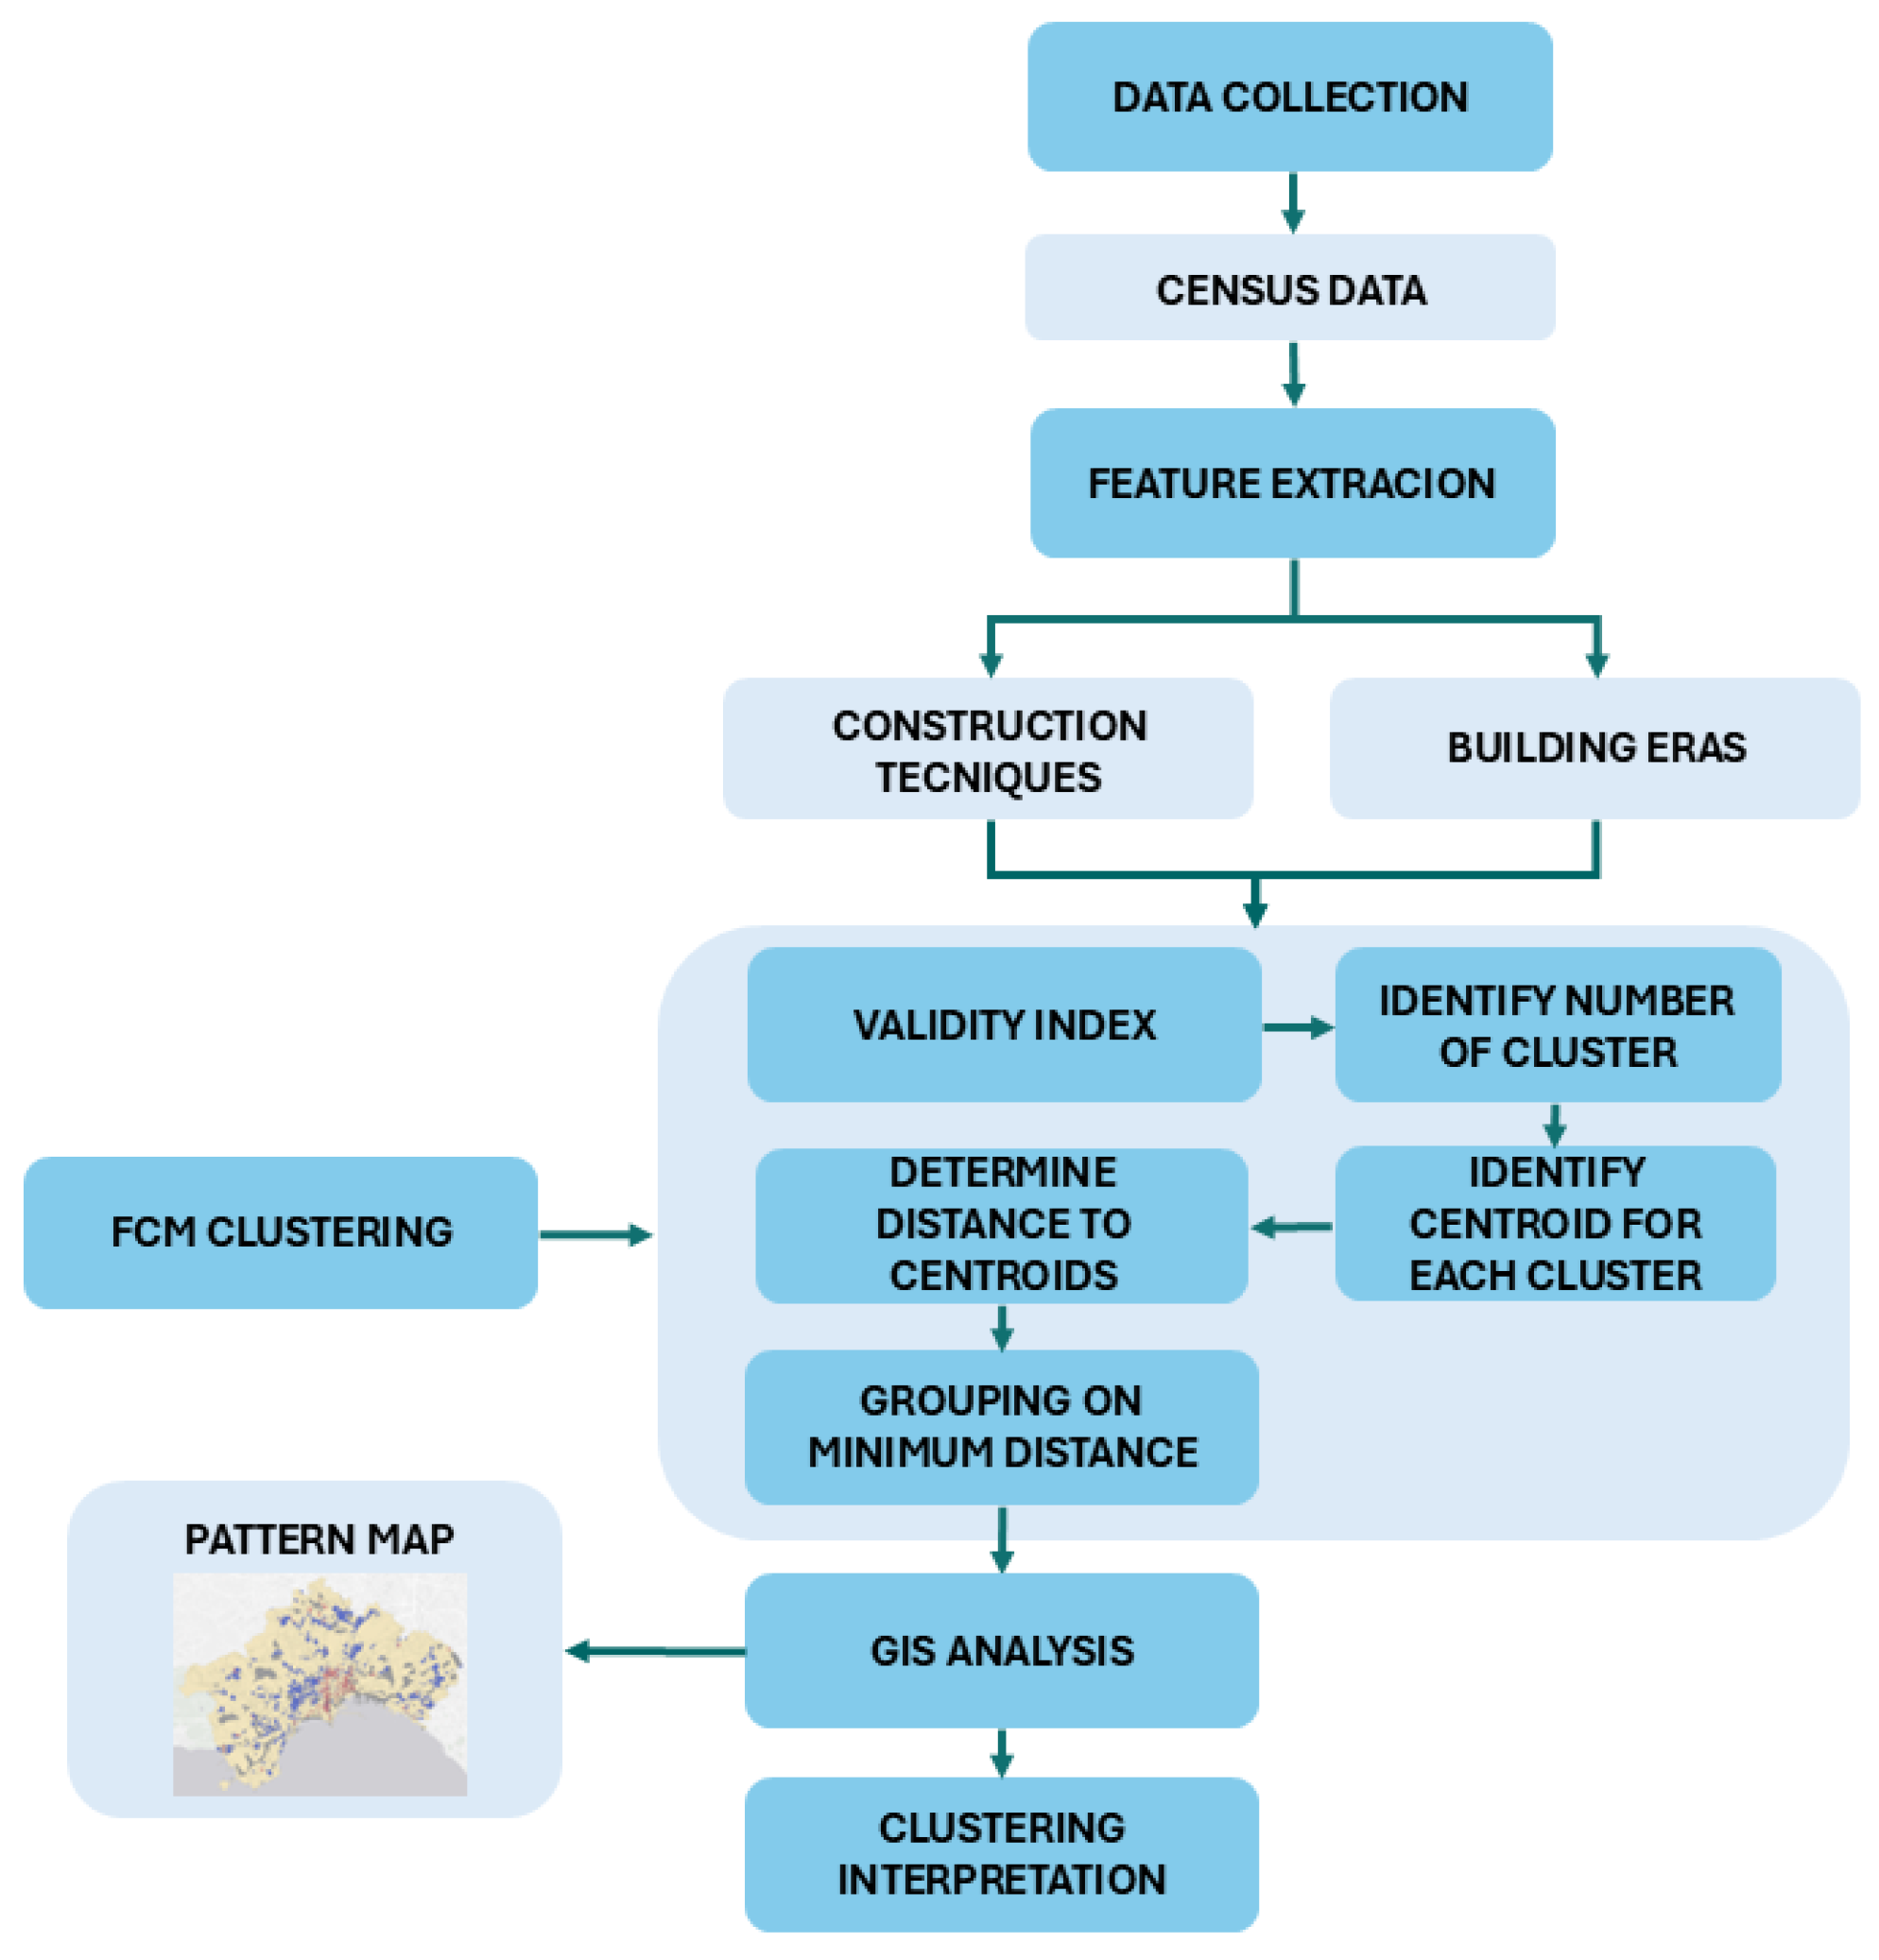
Figure 2.
Example of triangular Ruspini Fuzzy partition.
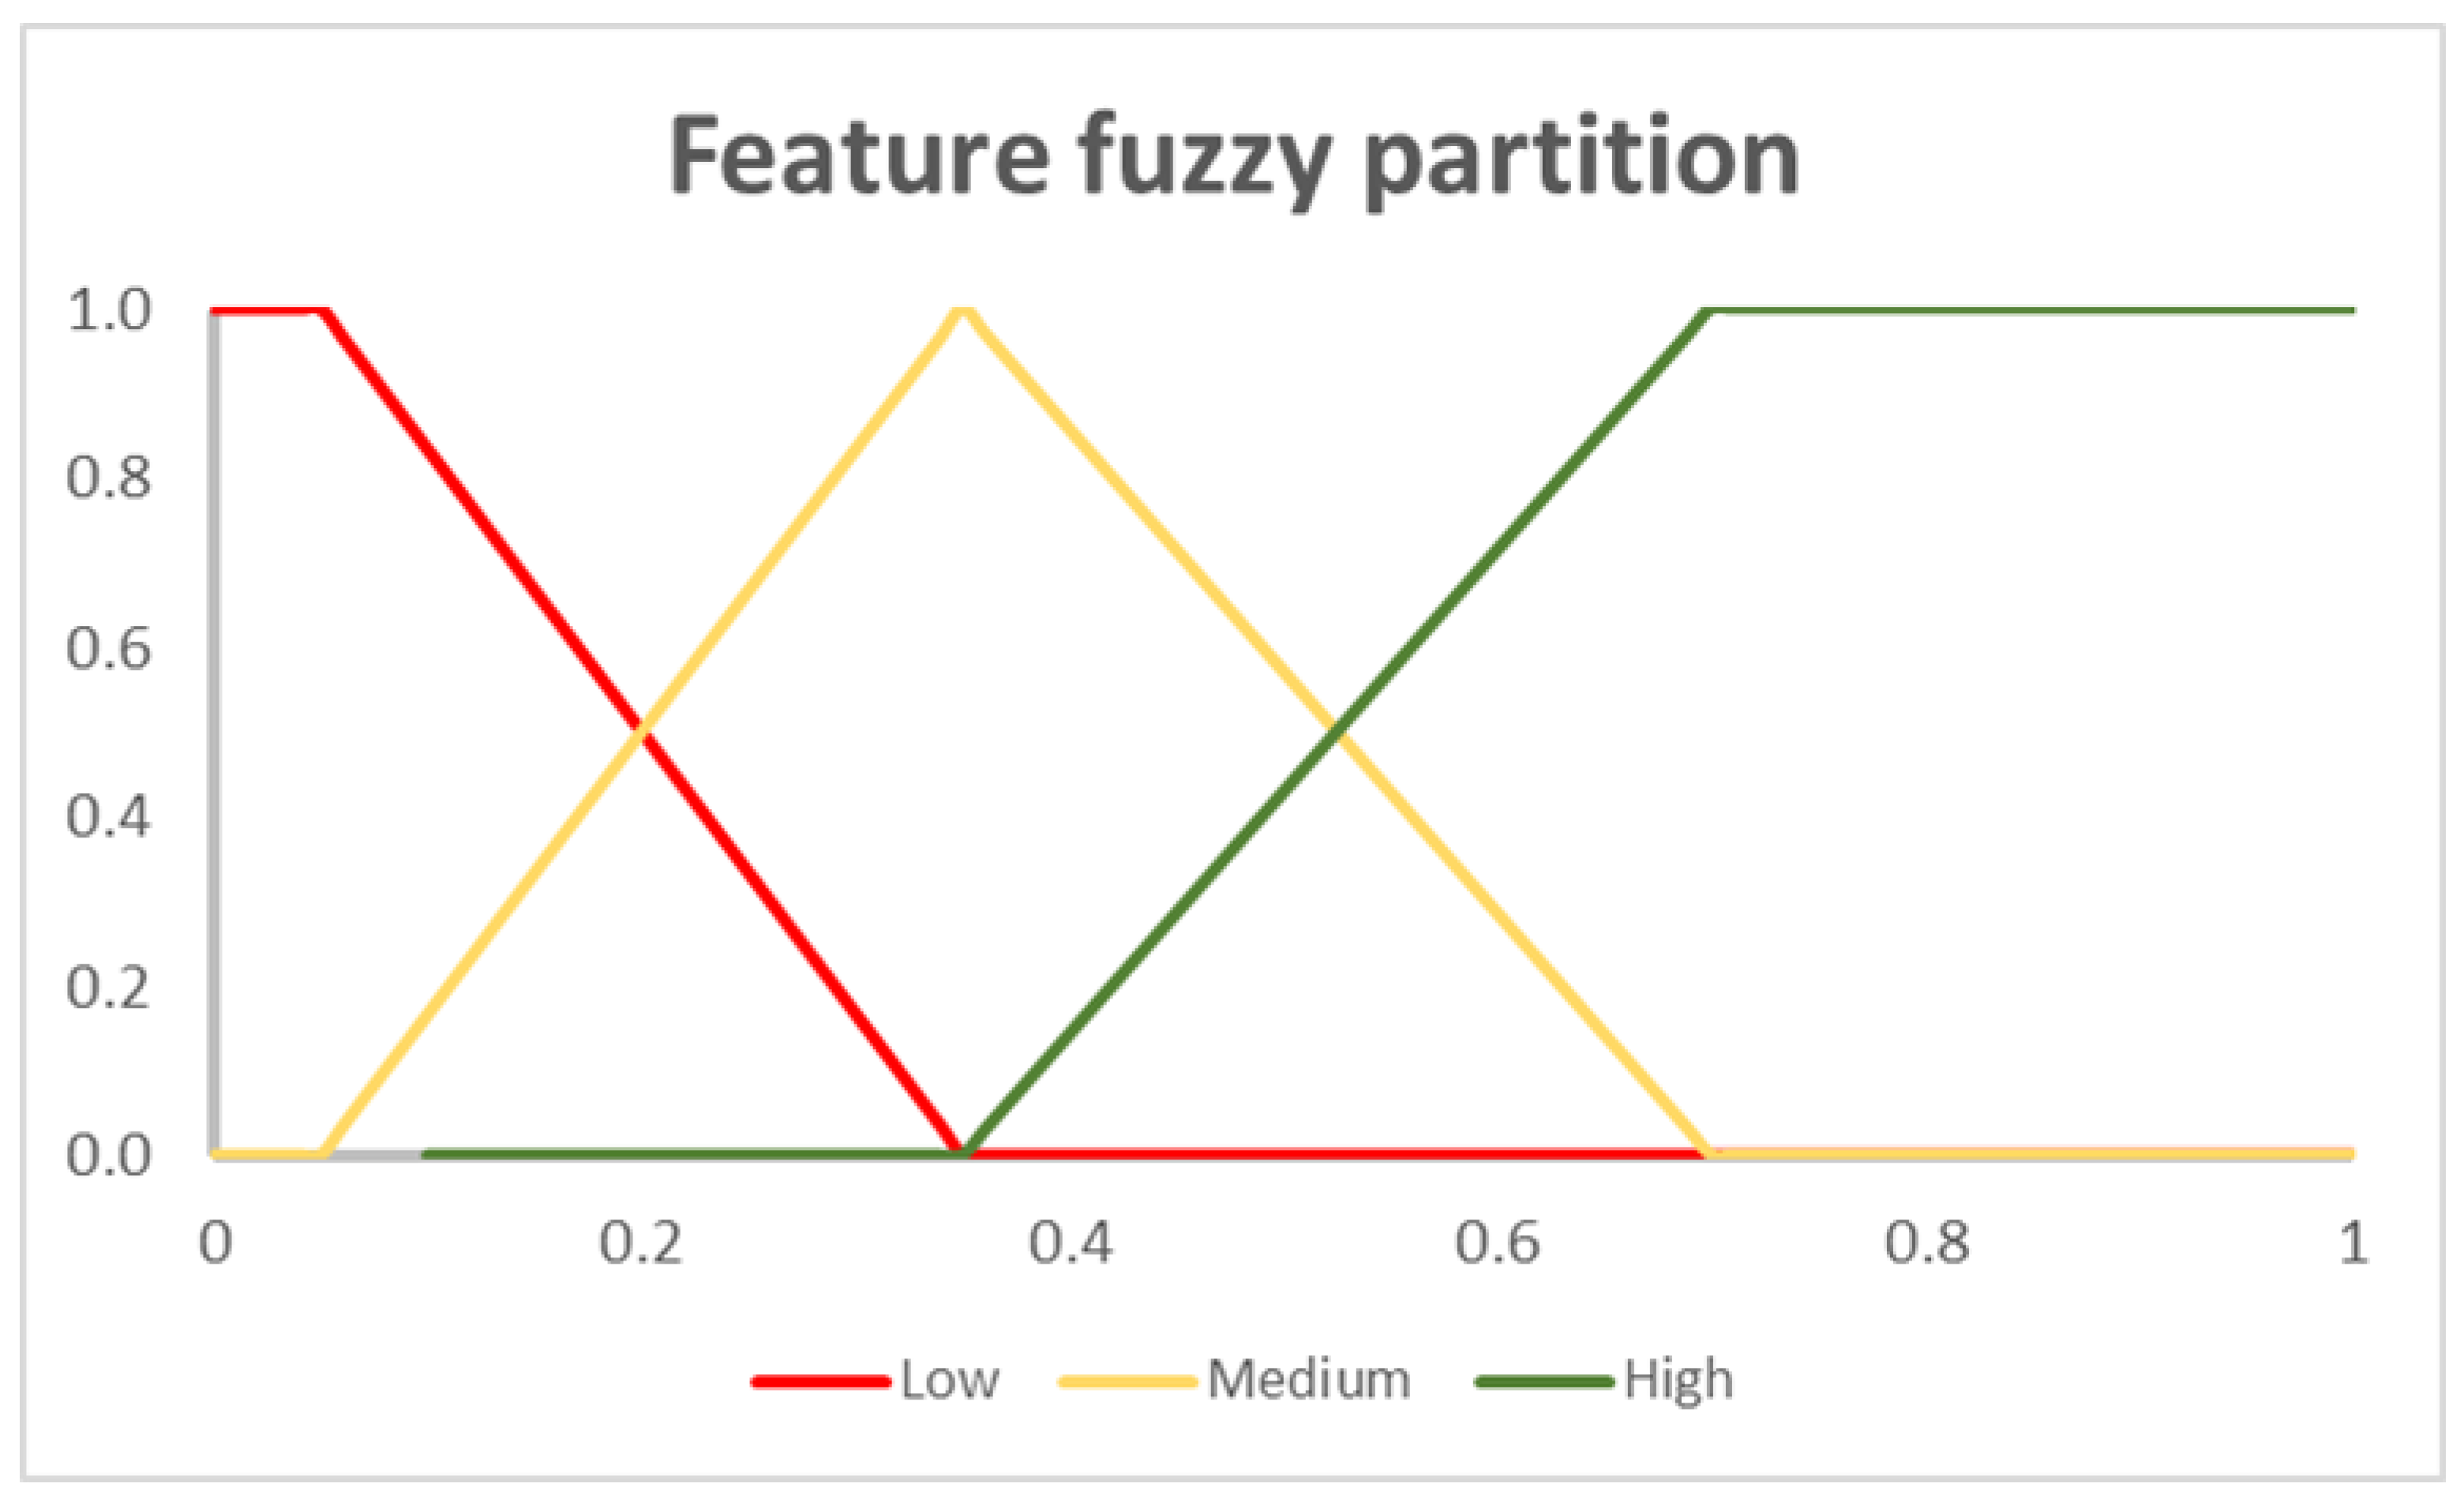
Figure 3.
Thematic map of cluster distribution in Florence.
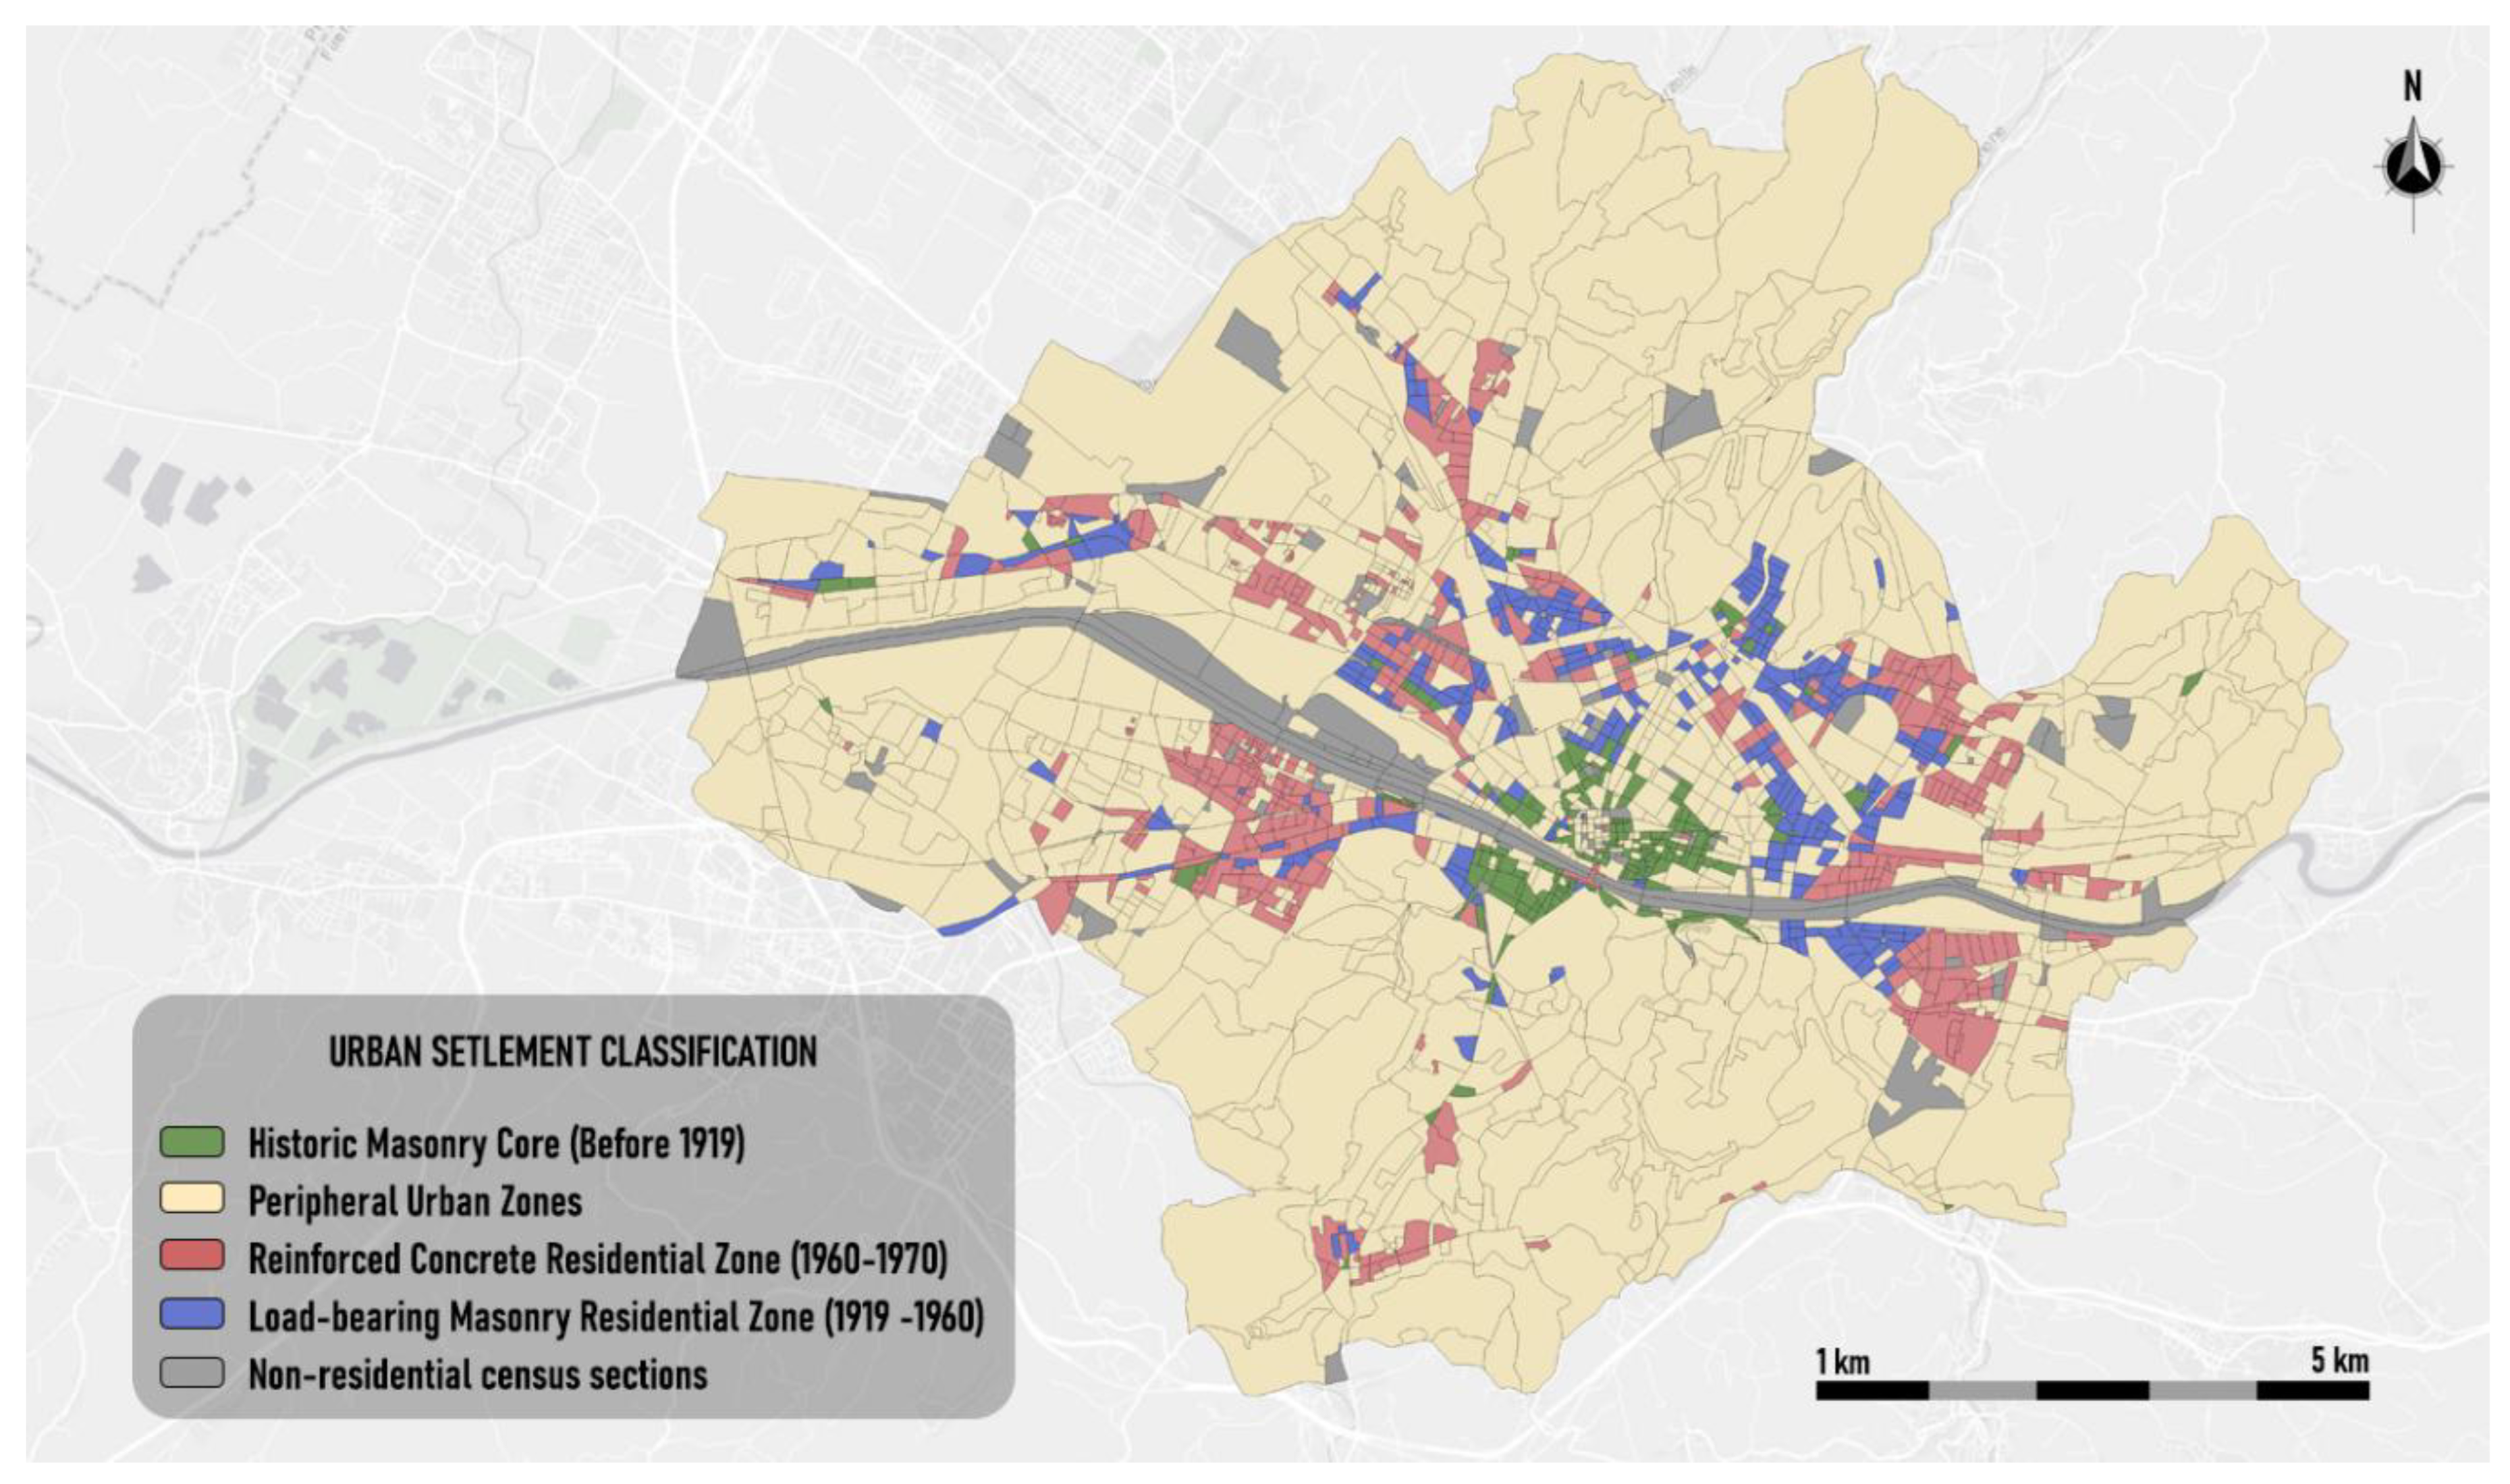
Figure 4.
Thematic map of the urban patterns of Genoa.
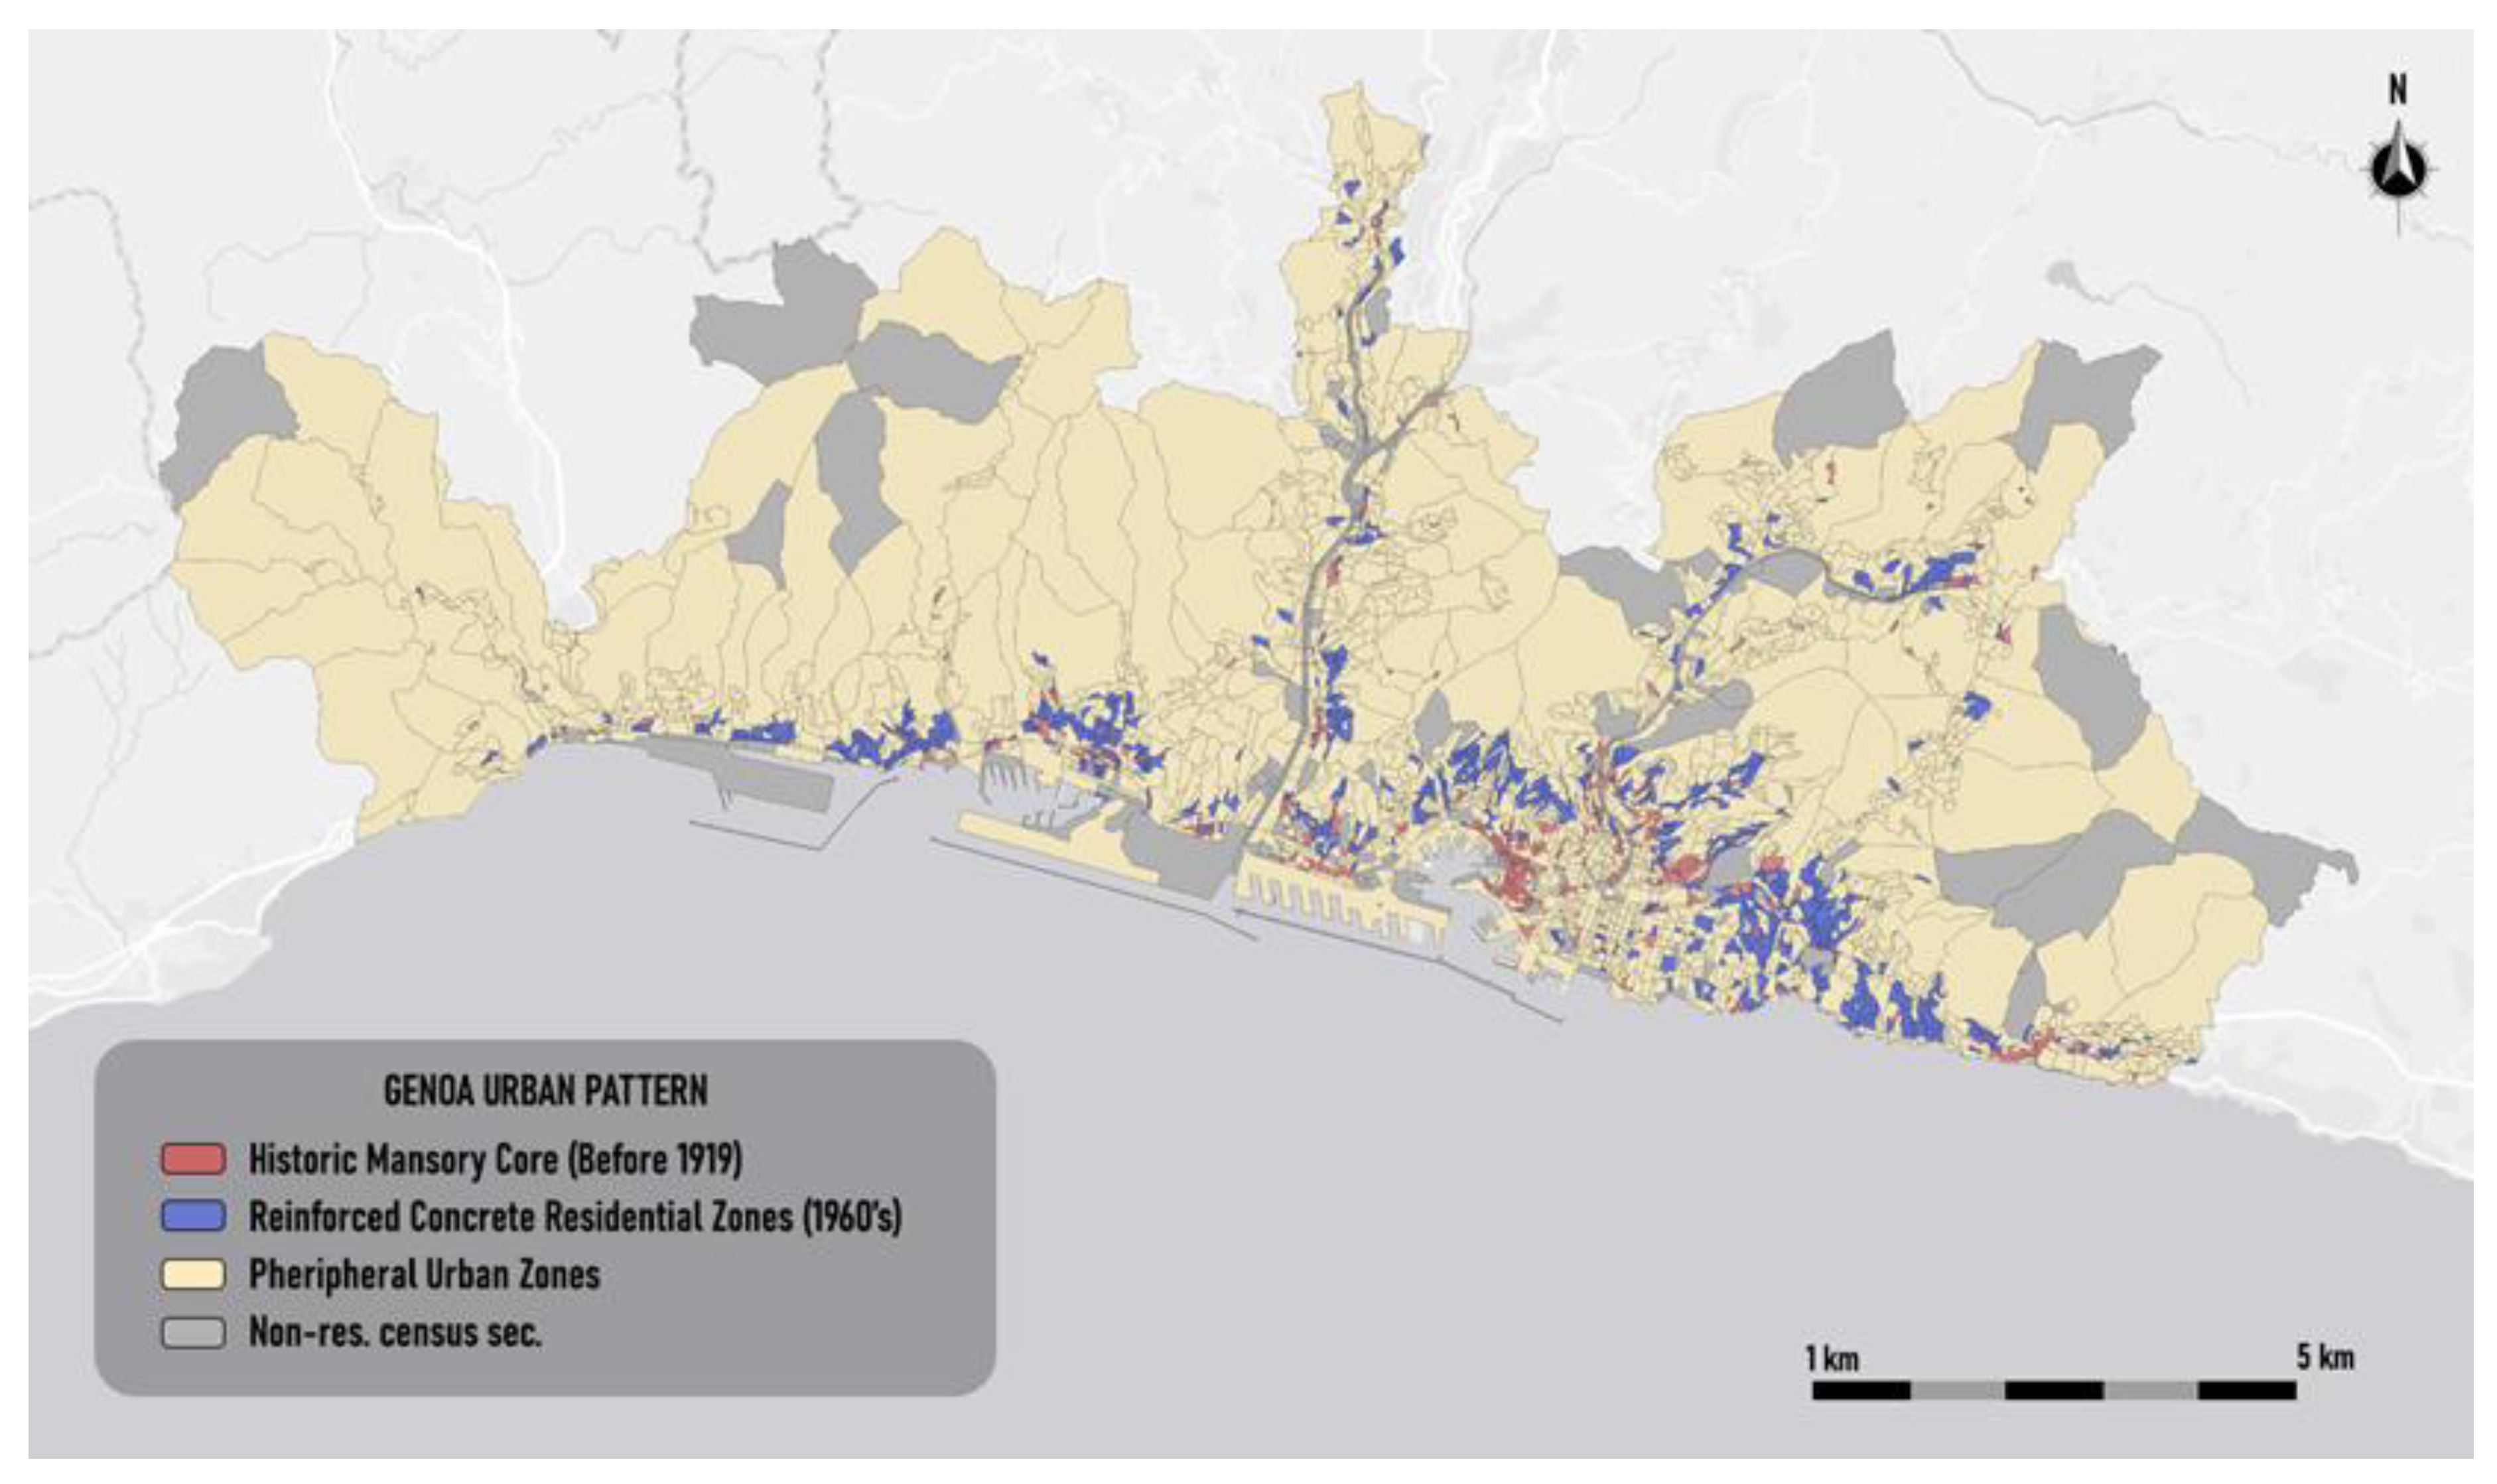
Figure 5.
Thematic map of the urban patterns of Naples.
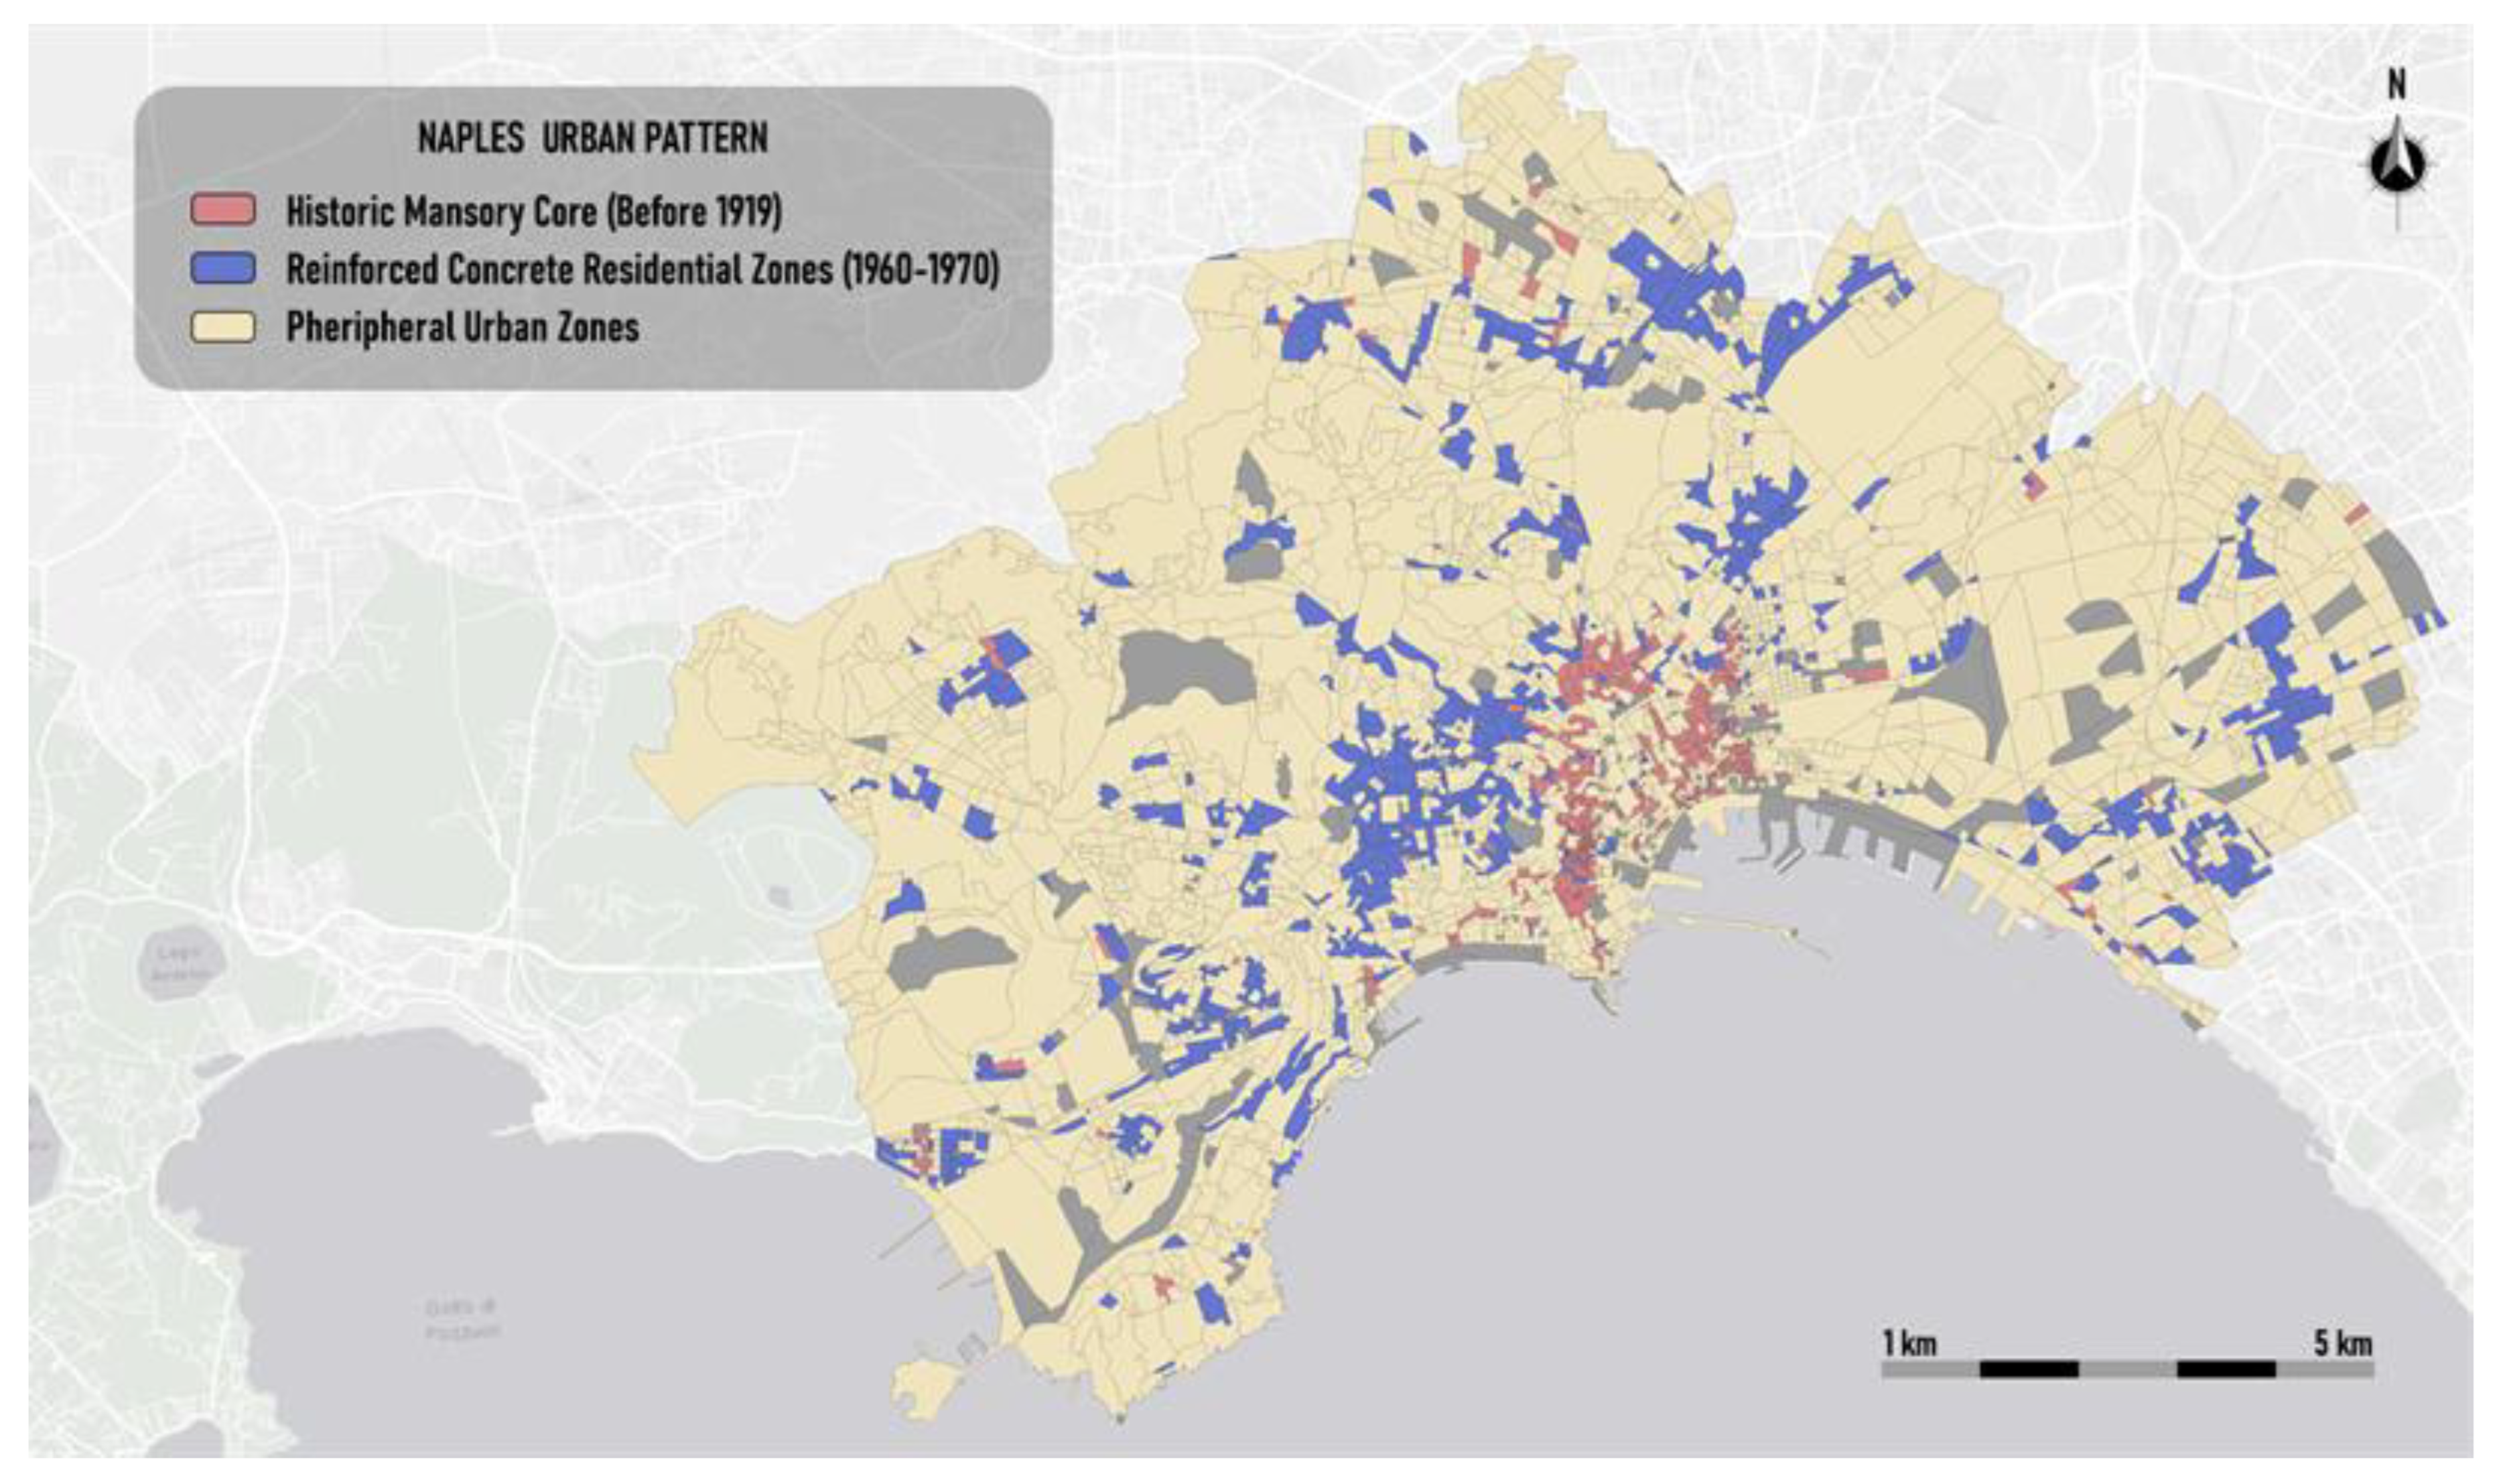
Figure 6.
Thematic map of the urban patterns of Turin.
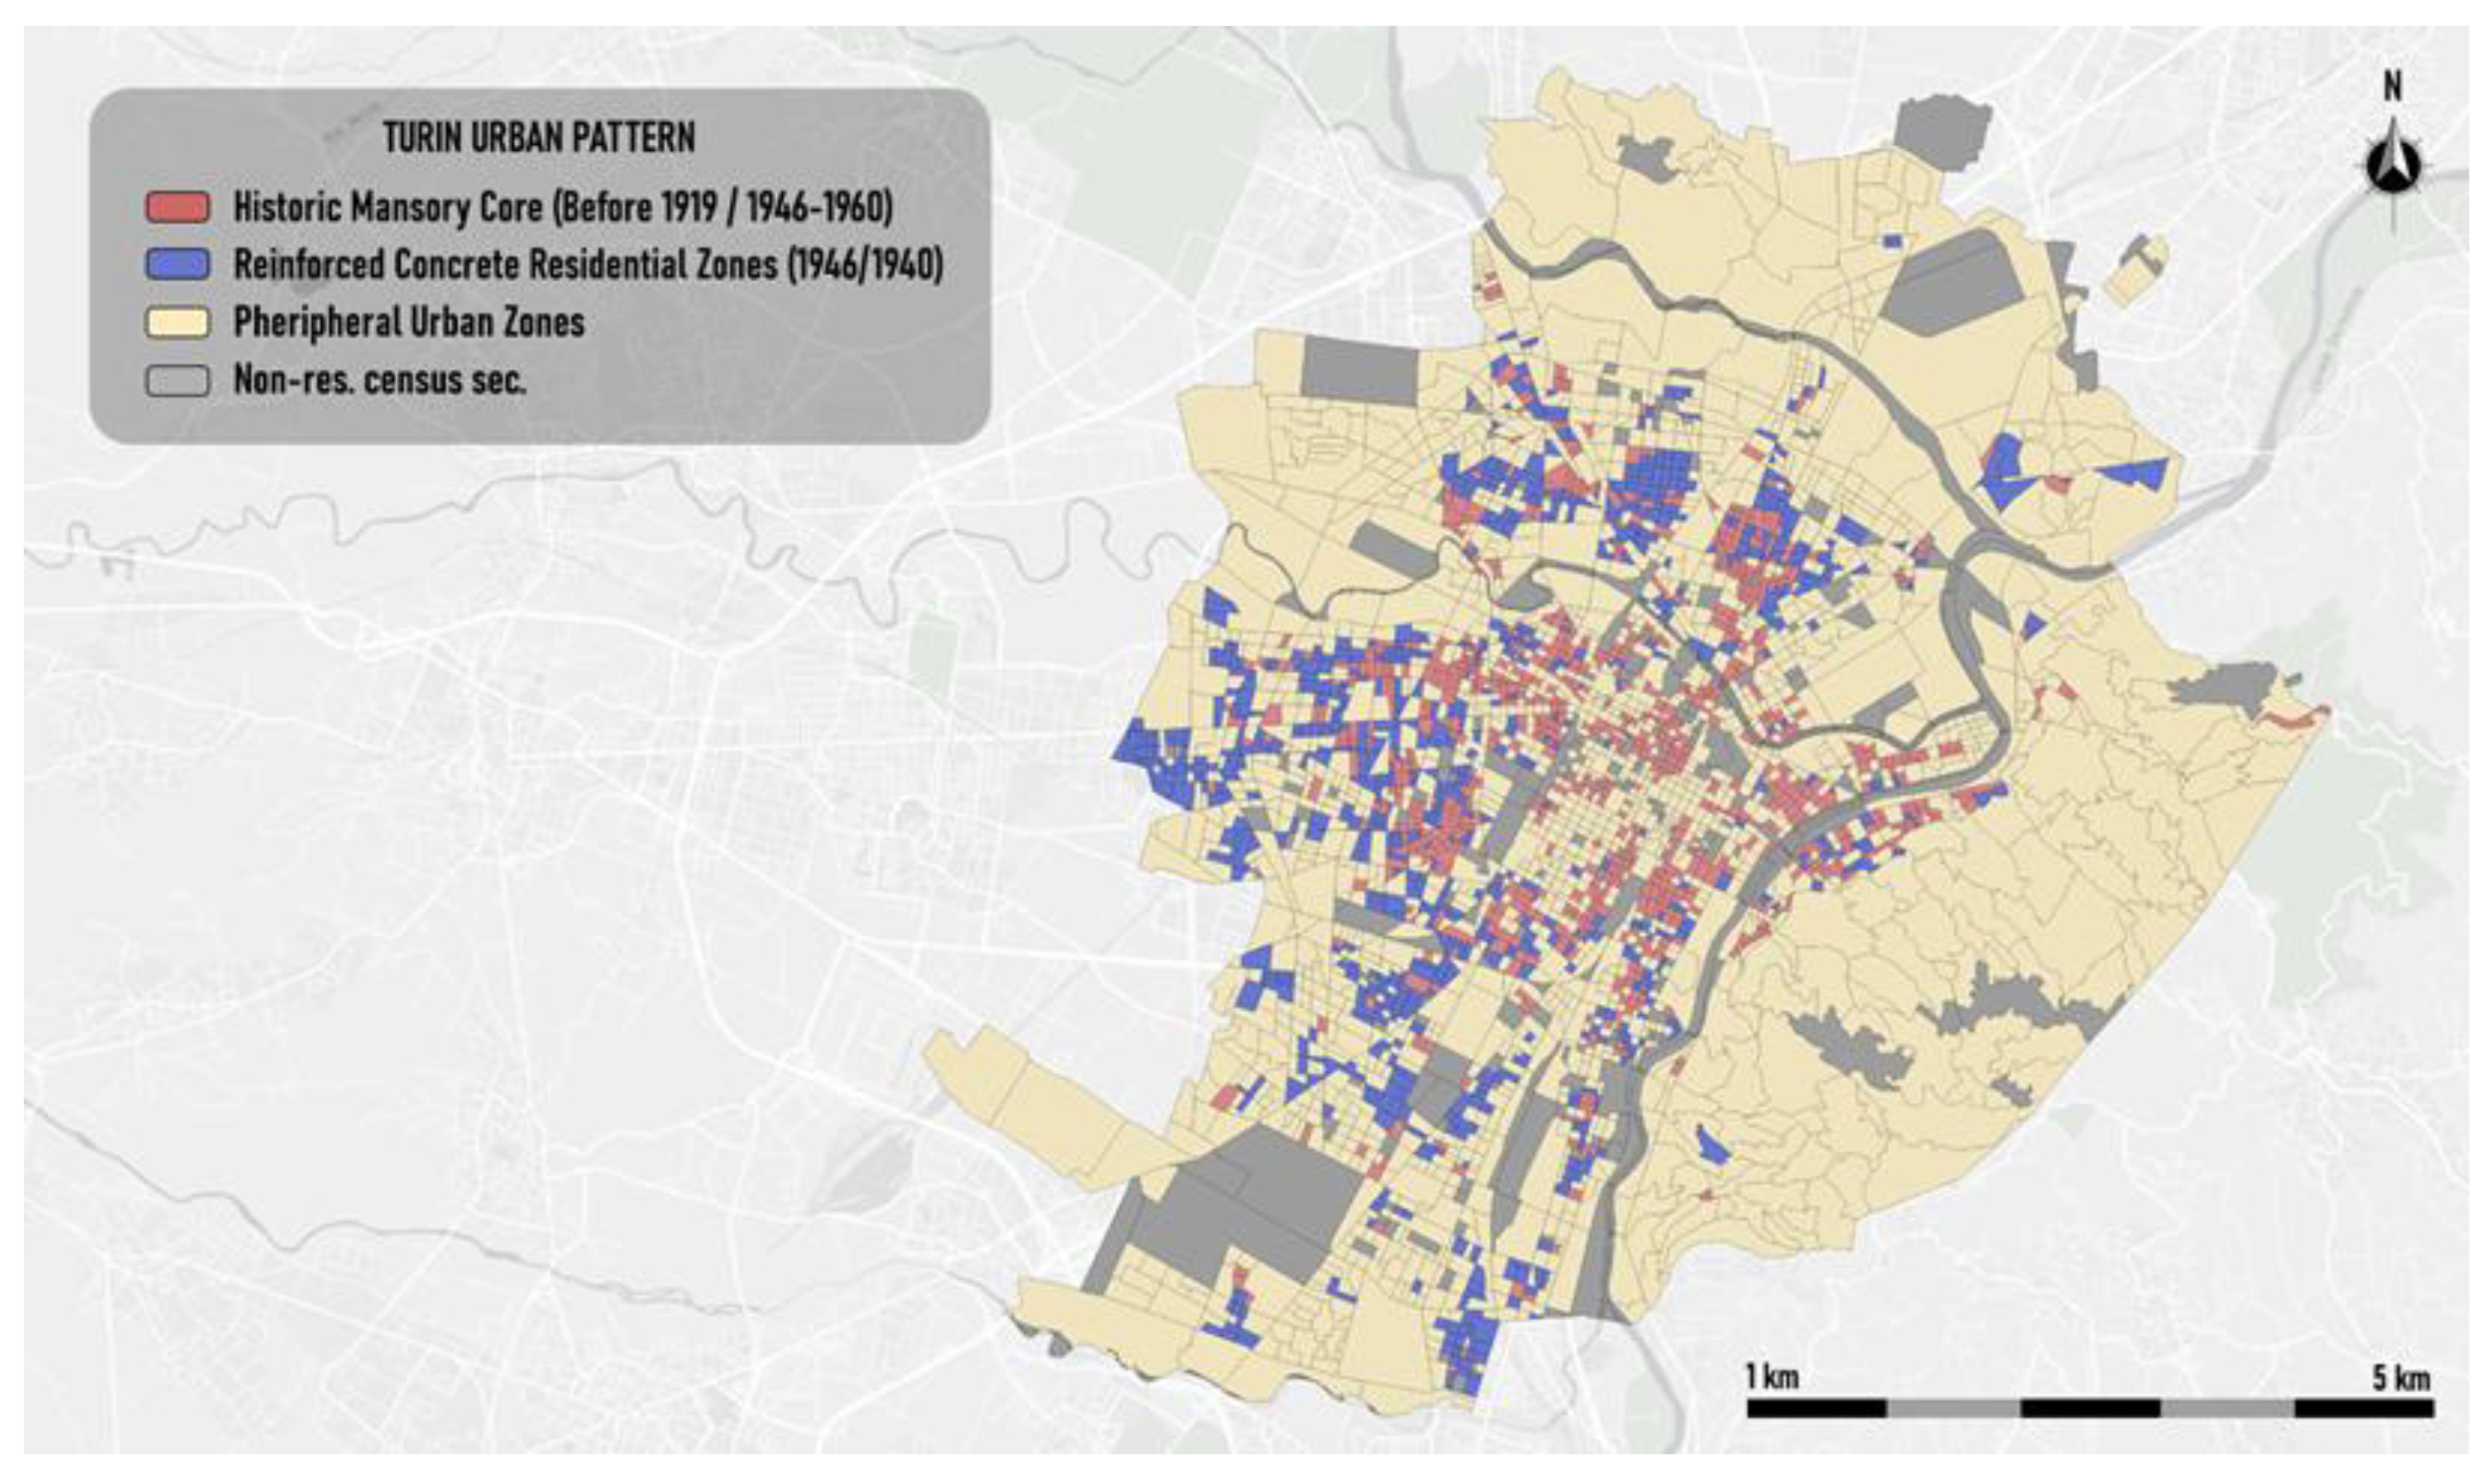
Table 1.
Example of values of the features of a cluster’s centroid.
| Feature | Value |
| f1 | 0,16 |
| f2 | 0,10 |
| f3 | 0,78 |
| f4 | 0,02 |
| f5 | 0,09 |
| f6 | 0,95 |
Table 2.
Fuzzification of the cluster centroid in the example.
| Feature | Label |
| f1 | Low |
| f2 | Low |
| f3 | High |
| f4 | Low |
| f5 | Low |
| f6 | High |
Table 3.
ISTAT variables used for clustering analysis.
| ISTAT variables | Description |
| E5 | Residential buildings with load-bearing masonry structure |
| E6 | Residential buildings with reinforced concrete structure |
| E7 | Residential buildings made of other materials (steel, wood, etc.) |
| E8 | Residential buildings built before 1919 |
| E9 | Residential buildings built between 1919 and 1945 |
| E10 | Residential buildings built between 1946 and 1960 |
| E11 | Residential buildings built between 1961 and 1970 |
| E12 | Residential buildings built between 1971 and 1980 |
| E13 | Residential buildings built between 1981 and 1990 |
| E14 | Residential buildings built between 1991 and 2000 |
| E15 | Residential buildings built between 2001 and 2005 |
| E16 | Residential buildings built between 2005 and 2011 |
Disclaimer/Publisher’s Note: The statements, opinions and data contained in all publications are solely those of the individual author(s) and contributor(s) and not of MDPI and/or the editor(s). MDPI and/or the editor(s) disclaim responsibility for any injury to people or property resulting from any ideas, methods, instructions or products referred to in the content. |
© 2025 by the authors. Licensee MDPI, Basel, Switzerland. This article is an open access article distributed under the terms and conditions of the Creative Commons Attribution (CC BY) license (http://creativecommons.org/licenses/by/4.0/).
Copyright: This open access article is published under a Creative Commons CC BY 4.0 license, which permit the free download, distribution, and reuse, provided that the author and preprint are cited in any reuse.


