
Submitted:
03 July 2025
Posted:
04 July 2025
You are already at the latest version
Abstract
Cocoa pod husk (CPH) is a potential material to produce value-added products. The objective of this study was to optimize the microwave-assisted hydrothermal pretreatment (MA-HTP) of CPH and CPH hemicellulose (HMC-CPH) using a combination of response surface analysis (RSA), Box Behnken design (BBD), and proton nuclear magnetic resonance identification and quantification (1H NMR Qu) to provide an efficient protocol for the extraction of mono- and disaccharides. The methodology consisted of 15 CPH MA-HTPs and 15 HMC-CPH MA-HTPs (triplicate) designed by RSA-BBD; experimental variables: time, temperature and power; response: concentration of extraction products. Glucose, sucrose and fructose were identified as products of the extractions by 1H NMR. With 95% confidence, higher sucrose content was determined for CPH (45.62%) compared to HMC-CPH (17.34%) and high fructose content for both CPH and HMC-CPH (37.88% and 35.37%, respectively), minimal glucose concentrations were obtained in both CPH and HMC-CPH (4.57% and 0.93%, respectively). Using RSA-BBD, optimal temperature, power and time points were predicted for glucose CPH: 135.4°C-180.6 W and 5.8 min; sucrose: 154.3°C-256.3 W and 20. 2 min; fructose 129.5°C-173.8 W and 5.27 min. For HMC-CPH: glucose: 142.2°C-204.4 W and 10.5 min; sucrose 148.8°C-215.6 W and 14.3 min; fructose: 151.6°C-231.6 W and 13 min.
Keywords:
Response surface analysis (RSA)
; Box Behnken design (BBD)
; microwave-assisted hydrothermal pre-treatment (MA-HPT)
; hemicellulose from cocoa pod husk (HMC-CPH)
1. Introduction
The cocoa industry generates large amounts of waste; in 2021, cocoa bean production will be 4.2 million tons [1]. Cocoa beans make up about 10% of the total weight of the fruit and are used to make chocolate [2]. The cocoa pod husk (CPH) is the main by-product of the cocoa industry, accounting for approximately 75% of the total weight of the fruit [3,4], with annual estimates of 48 million tons of CPH worldwide [5]. Management of these residues is costly and complex, and they generally remain on the land, causing odors, soil contamination, greenhouse gas emissions, and excessive growth of pathogenic fungi that cause diseases that affect crop production [6,7]. However, it is also an important and challenging renewable source for biorefining and has been the focus of research interest for several decades [8]. CPH is rich in biologically active molecules with nutraceutical properties, consisting of carbohydrates, lignin, proteins, lipids, pectin, minerals, theobromine, phenolic compounds, and tannins [4]. Sugars in CPH pectin include xylose, arabinose, rhamnose, galactose, mannose, glucose, and galacturonic acid, making it a good source for the food industry [9]. Hemicellulose is rich in xylose with neutral sugar substitutions and phenolic acid esters used in the food and pharmaceutical industries [10]. In this sense, CPH can be pretreated to separate its components such as lignin from cellulose and hemicellulose, and to obtain molecules from xylo-oligosaccharides [11]. There are several types of pre-treatment, including thermal, chemical, physical, biological, and combinations of these [12,13]. Microwave-assisted hydrothermal pretreatment (MA-HTP) is a pretreatment that combines microwave methodology with chemical reagents and is known to be more efficient than conventional heating [14]. Several studies have been reported on the extraction of pectin from CPH with MA-HTP in combination with strong acids, organic acids, enzymatic methods, etc. [2,6,15,16], the results highlight the impact on time savings, which is why it is considered a green technology [10,17]. MAE has also been used in combination with strong acids to delignify lignocellulosic materials with maximum lignin removal [14]. The efficacy of MA-HTP can be assessed using a mathematical model that predicts the statistical significance of the dependent variables and their interactions, providing optimal conditions using tools that reduce the number of experiments [18], these are response surface analyses (RSA), which allow the variables of an experiment to be optimized to optimize a response [2]. An example is the Box Behnken design (BBD), a mathematical model with first and second-order coefficients, which is a three-level incomplete factorial design for three factors [19]. The BBD is slightly more efficient than the central composite design and much more efficient than the three-level full factorial designs [18,20]. Therefore, MA-HTP in combination with RSA is a technique used to extract active compounds from plant materials, where the relationship between solvent, extraction time, and irradiation power is studied [21]. On the other hand, NMR has been successfully used as a quantitative method for natural products, as all components resonate at very low concentrations, just above the detection threshold (5-10 µM) [22], it is also over 98% accurate and is therefore considered a reliable technique for quantitative estimation. This has been established through validation procedures for precision, accuracy, linearity, reproducibility, robustness, selectivity, and specificity. However, this is only true as long as the sampling and processing parameters are well-known [23]. 1H NMR spectra of carbohydrates have constant shifts concerning a reference because they are not affected by pH or ionic strength due to the absence of ionizable groups. Therefore the acquisition parameters remain constant for each sample and a list of frequencies can be constructed [24]. To date, no publication proposes the extraction of mono- and disaccharides from CPH by MA-HTP using only water as an extraction medium, so it is feasible to seek the optimization of the process parameters, reducing time and cost using a statistical model. Therefore, the present study aims to optimize the conditions for the extraction of carbohydrates from CPH and HMC-CPH by MA-HTP, using DBB response surface analysis and 1H NMR quantification, to make a green pretreatment for this lignocellulosic material more efficient.
2. Materials and Methods
2.1. General Methology
In this study, CPH and HMC-CPH were used as raw materials. The species studied was Theobroma cacao L. variety Carmelo, collected at the Rancheria Rio Seco, municipality of Cunduacan [latitude: 18° 7'55.90" N, longitude: 93° 18'4.49" W] and at the farm Jesús María, municipality of Comalcalco [latitude: 18° 11'0.22" N, longitude: 93° 14'28.02" W], state of Tabasco, Mexico. At altitudes of 10 and 13 meters above sea level (MASL). The CPH was dried under ambient conditions with indirect sun exposure (average maximum temperature 21°C, average minimum temperature 6°C, and relative humidity less than 10%). The CPH was then mechanically ground in a Thomas Wiley Model 4 laboratory mill (TP4274E70520A, Thomas Scientific, Swedesboro, New Jersey, USA) and the particle size was graded using a US STD 100 laboratory sieve (W. S. Tyler, Ohio, USA). The particle that remained on the sieve was classified as larger than 150 µm and the particle that passed through the sieve was classified as smaller than 150 µm, the latter being used for this study. Finally, this material was oven-dried at 102°C ± 3°C to constant weight. From a fraction of this material, hemicellulose was obtained according to the methodology reported by Peng & She [25]. Finally, CPH and HMC-CPH were reserved for further processing.
2.2. Reagents
The standards and solvents used for the analysis of the pretreatments were D-fructose ≥ 99% (CAS no. 57-48-7), sucrose ≥ 99.5% (CAS no. 57-50-1), and D-glucose ≥ 99.5% (CAS no. 50-99-7), deuterium oxide 99.9% (CAS no. 7789-20-0) and 3-(trimethylsilyl)propionic acid-2,2,2,3,3-d4-acid sodium salt 98% (CAS no. 24493-21-8), all from Sigma Aldrich (Merck KGaA, Saint Louis Missouri, USA).
2.3. Microwave-Assisted Hydrothermal Pretreatment of CPH and HMC-CPH
A MARS 6TM microwave digestion system (CEM Corporation, Mecklenburg, North Carolina, USA) was used for microwave-assisted extraction of CPH and HMC-CPH. 1 g of CPH fines less than 150 µm and 1 g of HMC-CPH were weighed and placed separately in lidded silicone cups (Xpress Plus, CEM Corporation) to which 10 mL of distilled water was added to obtain a 1:10 ratio (CPH: distilled H2O). The CPH and HMC-CPH cups with their respective triplicates were placed in the carousel of the microwave oven programmed with a temperature, power, and time previously defined by the BBD. From this pre-treatment, a heterogeneous biphasic mixture with a solid and an aqueous phase was obtained, the solid phase corresponding to the fine particles of the study sample that did not undergo visible changes after the treatment and the aqueous phase to the product of the hydrothermal extraction; this mixture was poured into a conical tube (50 mL Eppendorf) and centrifuged at 3700 rpm for 40 minutes in a Centra CL2 centrifuge (Cat. No. 426, Thermo Scientific, Needham, Massachusetts, USA). The aqueous fraction was collected and freeze-dried at -50°C under reduced pressure of 0.045 bar in a 2.5 L Freezone Legacy freeze-dryer (Labconco Corporation, Kansas City, Missouri, USA), and the freeze-dried CPH and HMC extract was then analyzed by nuclear magnetic resonance (NMR).
2.4. Acquisition of 1H NMR Spectra
NMR spectroscopy was performed on a VARIAN 600 MHz (14.1 T) Premium COMPAC spectrometer (Agilent Technologies Inc., California, USA). For the analysis of CPH and HMC-CPH extracts, analytes were prepared by dissolving 30 mg of each lyophilized extract in 600 µL of a 5 mM solution of TSP (3-(trimethylsilyl) propionic acid-2,2,2,3,3-d4-acid sodium salt) and D2O (deuterium oxide). For this purpose, 5 mm NMR tubes were used and sonicated for 20 minutes to completely dilute the sample. The 1H NMR spectra were acquired with 64 scans of 32 K complex points at 25°C, a spectral width of 16 ppm, an acquisition time of 4 s, a relaxation time of 2 s, an angle of 90°, and an acquisition time of 4 min. The water suppression scheme used was PRESAT, the presaturation during the relaxation delay was performed at the minimum power for complete water suppression, and the receiver gain was set to 30 and held constants for all spectra. Spectrum acquisition and data processing were performed according to the methodology of del Campo et al. and Hernández Bolio et al. [22,26]. The phase correction, baseline correction, and integration of the spectra obtained on the signals of interest were performed in MNova software (Mestrelab Research SL, Santiago de Compostela free version). The integral values were entered into Microsoft Excel spreadsheets for the quantification process. Quantification was carried out using the formula:
where: I, N, M, W, and P; are the area of the integral, the number of nuclei in the molecule, the molar mass, the gravimetric weight, and the purity of the analyte (x) and standard (std), respectively [23,27].
2.5. Response Surface Analysis, Box Behnken Design
The RSA methodology was used to optimize the microwave-assisted hydrothermal pretreatment for carbohydrate extraction from CPH and HMC-CPH, using the Box Behnken design to model and optimize the experimental conditions using the second-order polynomial equation (Equation 1):
where: is the dependent variable; is the sample number, are the index numbers of the samples; is the lag term; is the first-order linear effect of the input factor (); is the quadratic effect of the input factor (squared) () and is the linear-linear interaction effect between the input factors [2,14,19,21]. In the Box Behnken design, there is a relationship between the uncoded and coded independent variables, which is shown in Equation 2.
where , , are coded value, natural value, and natural value at the midpoint (of the i-th independent variable) and is the change value of an independent variable [19].
Three independent variables with three levels each (-1, 0, and 1) were used, the independent variables were: temperature (T=100, 150, and 200°C), power (P= 100, 200, and 300 W), and time (t= 5, 10 and 15 min), giving a total of 15 experiments performed in triplicate, the runs were performed in an ordered fashion according to the BBD, the response variable was the quantification of carbohydrates determined by NMR. Analyses were performed in R software (RStudio Inc. Version 4.2.3, Boston, Massachusetts, USA).
3. Results and Discussion
3.1. 1H NMR Spectra Elucidation
As a result, two monosaccharides (glucose and fructose) and one disaccharide (sucrose) could be identified by proton nuclear magnetic resonance from the freeze-dried aqueous extracts obtained from microwave-assisted hydrothermal treatments of cocoa pod husk, as well as from the hemicellulose extracted from the same. Table 1 shows the chemical shifts, and the multiplicity of signals identified in the experimental 1H NMR spectra of MA-HTP of CPH and HMC-CPH, as well as in the spectra of the D-fructose, sucrose, and D-glucose standards.
As can be seen in Table 1, the identification of the monosaccharides and disaccharides was supported by the spectra of the standards as well as by data from the literature. Three signals were identified for fructose elucidation and only two for quantification. In contrast, six signals were identified for sucrose elucidation two of them for quantification, as well as two of the four signals identified for glucose quantification. In this respect, del Campo et al. [22]. report for fructose from honey samples two signals identified as multiplets at the same chemical shifts reported in this study (4.00 ppm and 4.10 ppm), but with different multiplicity. On the other hand, for sucrose, they report one signal with a doublet multiplicity at the chemical shift of 5.42 ppm, which coincides with the same signal reported in this study. Finally, they reported 5 signals for glucose, for β-glucose one doublet and two doublets of doublets were identified at chemical shifts of 4.65 ppm, 3.40 ppm, and 3.25 ppm respectively. In contrast, for α-glucose two signals, one doublet and one doublet of doublets were identified at chemical shifts of 5.22 ppm and 3.42 ppm respectively. Four of the five signals identified in this study, two for β-glucose and two for α-glucose, were coincident, with one doublet of doublets missing at the chemical shift of 3.40 ppm corresponding to β-glucose. On the other hand, Al-Mekhlafi et al. [28]. reported six, five, and two signals respectively at chemical shifts 4.08 ppm, 4.00 ppm, 3.93 ppm, 3.79-3.85 ppm, 3.69 ppm, and 3.51-3.57 ppm for fructose, 5.39 ppm, 4.16 ppm, 4.07 ppm, 3.87-3.67 ppm and 3.53-3.42 ppm for sucrose and 5.19 ppm and 4.59 ppm for glucose, with differences of about 0.04-0.12 ppm for most chemical shifts. Finally, agreement was also found with the data of Spiteri et al. [29]. They identified a signal for fructose with a chemical shift of 4.1 ppm, a signal for sucrose at 4.22 ppm, and two signals for glucose at 5.23 ppm and 3.24 ppm, corresponding to α-glucose and β-glucose respectively, but did not report signal multiplicity data. Identification of sugars by 1H NMR is limited because oligosaccharides incorporated into an isolated spin system per monomer unit are separated from each other by glycosidic bonds and, considering that oligosaccharides can be formed from the same monomers and in the same sequences, they will overlap in the spectra so that only a few sugars can be identified [24].
According to the PubChem databases (CID: 5984), fructose is a monosaccharide found in fruits and honey, soluble in water, ether, and alcohol, and is mainly used as a preservative and as an intravenous infusion in parenteral nutrition. Sucrose (PubChem CID: 5988), a glycosyl-glycoside composed of glucose and fructose units, is used as an osmolyte, food sweetener, human metabolite, etc., and is mainly obtained from sugar cane and sugar beet. Finally, according to the PubChem databases (CID: 5793), D-glucose or dextrose, the most abundant isomer of glucose in nature, is produced by photosynthesis in plants and by hepatic gluconeogenesis in humans. On the other hand, a study by Perwitasari et al. [8], hydrolyzed CPH to monosaccharides, which were then metabolized by A. niger via the tricarboxylic acid cycle to citric acid, which could also be used in the food industry.
3.2. Optimization of CPH and HMC-CPH MA-HTP Conditions Through RSA-BBD
The 1H NMR Qu results were used to optimize the MA-HTP of CPH and HMC-CPH using BBD response surface analysis. The BBD indicates the optimal points of the factor’s temperature, power, and time in the MA-HTP of CPH and HMC-CPH. The three factors were coded as -1, 0, and 1 for low, medium, and high levels, respectively. This study presents the optimal level for each dependent variable, as well as the quadratic polynomial equations and three-dimensional graphical representations. Table 2 shows the 1H NMR Qu of carbohydrates; glucose, sucrose, and fructose obtained from 15 MA-HTP of CPH and 15 MA-HTP of HMC-CPH.
3.3. RSA—BBD ANOVA
The concentration of glucose, sucrose, and fructose extracted from CPH and HMC-CPH by MA-HTP were determined in percent by 1H NMR Qu for each treatment designed by BBD. Table 2 shows an apparent difference in mono- and disaccharide concentrations between the CPH and HMC-CPH whole matrix, however, by analysis of variance only a statistically significant difference (p≤0.05) was found between the sucrose concentrations of CPH and HMC-CPH, with the highest concentration being the sucrose content extracted from cocoa pod shells.
On the other hand, a significant statistical difference (p≤0.05) was found between the concentrations of sucrose, fructose, and glucose extracted from CPH, given the variables of time and power. With 95% confidence, two groups of means were identified for sugar concentrations, two groups for time and two groups for power, finding sucrose and fructose from CPH in the same group with a mean of 45.62% and 37.88% respectively, being the sugars with the highest concentration in cocoa pod husk, while power of 300 W and time of 15 min are identified with the highest extraction of sugars, 37.69% and 36.08% respectively. Similarly, a statistically significant difference (p≤0.05) was obtained between sucrose, fructose, and glucose concentrations of HMC-CPH, for sugars extracted from hemicellulose, temperature and power were significant. Using analysis (Tukey), two groups were identified for temperature and two groups for power, with the temperature of 150°C giving the highest concentration of sugars with a mean of 23.37% and the power of 200 to 300 W with mean concentrations of 20.78% and 20.77% of sugars, while for the concentration of mono- and disaccharides three groups were obtained, the highest concentration being fructose, followed by sucrose and finally glucose with mean values of 35.37%, 17.34% and 0.93% respectively. Minimal glucose content was found in both CPH and HMC-CPH matrices, which could indicate the absence or minimal depolymerization of cellulose. The higher glucose content can be attributed to free sugars reported in the literature as an extractable fraction of the lignocellulosic matrix.(Quiceno Suarez et al., 2024; Vasquez et al., 2019). In summary, the hemicellulose fraction extracted from the cocoa pod shell is predominantly rich in fructose, while the whole cocoa shell matrix is rich in sucrose and fructose. Table 3 shows the optimal treatment results predicted by the Box Behnken response surface design for glucose, sucrose, and fructose extracted from cocoa pod husk and the hemicellulose fraction of the same.
As can be seen, the predicted optimum temperatures, power, and time for the extraction of glucose, sucrose, and fructose from CPH range between 129.5°C and 154.3°C, between 173.8 W and 256.3 W, and between 5.27 min and 20.2 min, with higher conditions for sucrose and lower for fructose. Contrary to the conditions proposed for the extraction of glucose, sucrose and fructose extracted from HMC-CPH ranged between 142.2°C and 151.6°C, power between 204.4 and 231.6 W, and times between 10.5 min and 13 min, with central values prevailing in all cases.
The coded factor equations can predict the response to determine the levels of each factor, with high levels coded as 1, low levels -1, and intermediate levels coded as 0. Positive represents the synergistic relationship, while negative represents the antagonistic relationship between the variables [30]. Uncoded quadratic polynomial equations of the independent variables to explain the efficacy of MA-HTP, constructed by multiple regression analysis of the BBD matrix for all dependent variables (Equations (3)–(8)), are presented.
where: T, temperature; P, power; t, time.
The model is significant (p≤0.05) for sucrose and fructose from CPH, the response surface curves are shown in Figure 1 D/E/F and G/H/I respectively. The model is significant (p≤0.05) for fructose from HMC-CPH, the response surface curves are shown in Figure 2 P/Q/R. Regarding the calculated coefficient of determination, it was found that there was no lack of fit (p>0.05) for the CPH models for glucose, sucrose, and fructose, and for HMC-CPH for sucrose.
Figure 1 shows the three-dimensional valley response plots of the effect of the variable’s temperature, power, and time of CPH MA-HTP, these follow a minimum stationary point pattern indicating that the response (carbohydrate yield) increases with central values of temperature and power and a low level of time for CPH glucose concentration. Whereas for CPH sucrose the yield is maximized at high power and time and a central value of temperature. And for CPH fructose the yield is maximized with central values of temperature and power and a low level of time.
Optimal extraction temperatures of 129.5°C and 154.3°C correlate with power ratings of 173.8 W and 256.3 W for glucose, sucrose, and fructose CPH, respectively. Extraction times range from 5.27 min to 20.2 min for average concentrations of 4.57% for glucose (Figure 1 A, B, and C), 45.62% for sucrose (1 D, E and F), and 37.88% for fructose (G, H and I). The extraction concentration is given on the y-axis.
The three-dimensional response surface plots in Figure 2 follow a maximum stationary point type pattern, with optimum yields of mono- and disaccharides increasing with a central value of temperature, power, and time for HMC-CPH glucose, and central values of temperature and power with a high level of time for maximum yields in HMC-CPH sucrose, and a central value of temperature and high levels of power and time required for optimum values of HMC-CPH fructose.
Optimal extraction temperatures for HMC-CPH carbohydrates range from 142.2°C to 151.6°C, and optimal power for these carbohydrates ranges from 204.4 W to 231.6 W for HMC-CPH glucose, sucrose, and fructose. Extraction times range from 10.5 min to 14.3 min for average concentrations of 0.931% for glucose (Figure 2 J, K, and L), 17.34% for sucrose (Figure 2 M, N, and O), and 35.37% for fructose (Figure 2 P, Q, and R).
4. Conclusions
The conditions for microwave-assisted hydrothermal pretreatment of cocoa pod husk and cocoa pod husk of hemicellulose were optimized for glucose, sucrose, and fructose and predicted by Box Behnken response surface design. For the optimization of mono- and disaccharides from cocoa pod husk, the predicted values of optimum temperature, power, and time were: 1) for glucose; 135.4 °C, 180.6 W, and 5.8 min, 2) for sucrose; 154.3 °C, 256.3 W and 20.2 min and, 3) for fructose; 129.5 °C, 173.8 W and 5.27 min. For the optimization of mono- and disaccharides from cocoa pod husk of hemicellulose, the predicted optimal temperature, power, and time values were: 4) for glucose; 142.2°C, 204.4 W, and 10.5 min, 5) for sucrose; 148.8°C, 215.6 W and 14.3 min and 6) for fructose; 151.6°C, 231.6 W and 13 min. The proposed optimization of microwave-assisted hydrothermal pretreatment for the extraction of glucose, sucrose, and fructose can be a green protocol for the utilization of cocoa pod husk.
Author Contributions
Conceptualization, E.H.N., E.E.S.P. and H.Z.P.; methodology, E.H.N., E.E.S.P. and H.Z.P.; software, E.H.N., E.E.S.P., T.E.S. and H.Z.P.; validation, E.H.N., E.E.S.P. and H.Z.P.; formal analysis, E.H.N., E.E.S.P. and H.Z.P.; investigation, E.H.N., T.E.S., J.E.H.P. and H.Z.P.; resources, E.H.N., T.E.S. and H.Z.P.; data curation, E.H.N., J.E.H.P. and H.Z.P.; writing—original draft preparation, E.H.N., E.E.S.P., J.E.H.P. and H.Z.P.; writing—review and editing, E.H.N., E.E.S.P. and H.Z.P.; visualization, E.H.N., J.E.H.P. and H.Z.P.; supervision, E.H.N., J.E.H.P. and H.Z.P.; project administration, E.H.N. and H.Z.P. All authors have read and agreed to the published version of the manuscript.
Funding
This research received no external funding.
Acknowledgments
The authors thank the Consejo Nacional de Humanidades, Ciencia y Tecnología (CONAHCYT) for the Postgraduate Grant no. 763652, the Laboratorio de Productos Naturales del Departamento de Química of the Universidad Autónoma Chapingo, the Laboratorio de Geoquímica Marina and LANNBIO of CINVESTAV-IPN, Unidad Mérida, the Instituto Nacional de Investigaciones Forestales Agrícolas y Pecuarias (INIFAP) and C. Carlos Hernández Echeverría for providing the raw material for the study (cocoa pod husk of the Carmelo variety).
Conflicts of Interest
The authors declare no conflicts of interest.
Abbreviations
The following abbreviations are used in this manuscript:
| CPH | Cocoa pod husk |
| MA-HTP | microwave-assisted hydrothermal pretreatment |
| HMC-CPH | hemicellulose Cocoa pod husk |
| RSA | Response surface analysis |
| BBD | Box Behnken design |
| 1H NMR Qu | proton nuclear magnetic resonance identification and quantification |
| 1H NMR | proton nuclear magnetic resonance |
| µM | Micro molar |
| NMR | nuclear magnetic resonance |
| pH | Hydrogen potential |
References
- Ramos-Escudero, F.; Casimiro-Gonzales, S.; Cádiz-Gurrea, M. de la L.; Cancino Chávez, K.; Basilio-Atencio, J.; Ordoñez, E. S.; Muñoz, A. M.; Segura-Carretero, A. Optimizing Vacuum Drying Process of Polyphenols, Flavanols and DPPH Radical Scavenging Assay in Pod Husk and Bean Shell Cocoa. Scientific Reports 2023 13:1 2023, 13, 1–15. [Google Scholar] [CrossRef]
- Jarrín-Chacón, J. P.; Núñez-Pérez, J.; Espín-Valladares, R. del C.; Manosalvas-Quiroz, L. A.; Rodríguez-Cabrera, H. M.; Pais-Chanfrau, J. M. Pectin Extraction from Residues of the Cocoa Fruit (Theobroma Cacao L.) by Different Organic Acids: A Comparative Study. Foods 2023, Vol. 12, Page 590 2023, 12. [Google Scholar] [CrossRef]
- Lu, F.; Rodriguez-Garcia, J.; Van Damme, I.; Westwood, N. J.; Shaw, L.; Robinson, J. S.; Warren, G.; Chatzifragkou, A.; McQueen Mason, S.; Gomez, L.; Faas, L.; Balcombe, K.; Srinivasan, C.; Picchioni, F.; Hadley, P.; Charalampopoulos, D. Valorisation Strategies for Cocoa Pod Husk and Its Fractions. Curr Opin Green Sustain Chem 2018, 14, 80–88. [Google Scholar] [CrossRef]
- Vásquez, Z. S.; de Carvalho Neto, D. P.; Pereira, G. V. M.; Vandenberghe, L. P. S.; de Oliveira, P. Z.; Tiburcio, P. B.; Rogez, H. L. G.; Góes Neto, A.; Soccol, C. R. Biotechnological Approaches for Cocoa Waste Management: A Review. Waste Management 2019, 90, 72–83. [Google Scholar] [CrossRef]
- Quiceno-Suarez, A.; Cadena-Chamorro, E. M.; Ciro-Velásquez, H. J.; Arango-Tobón, J. C. By-Products of the Cocoa Agribusiness: High Valueadded Materials Based on Their Bromatological and Chemical Characterization. Rev Fac Nac Agron Medellin 2024, 77, 10585–10599. [Google Scholar] [CrossRef]
- Priyangini, F.; Walde, S. G.; Chidambaram, R. Extraction Optimization of Pectin from Cocoa Pod Husks (Theobroma Cacao L.) with Ascorbic Acid Using Response Surface Methodology. Carbohydr Polym 2018, 202, 497–503. [Google Scholar] [CrossRef]
- Soares, T. F.; Oliveira, M. B. P. P. Cocoa By-Products: Characterization of Bioactive Compounds and Beneficial Health Effects. Molecules 2022, Vol. 27, Page 1625 2022, 27. [Google Scholar] [CrossRef]
- Perwitasari, U.; Agustina, N. T.; Pangestu, R.; Amanah, S.; Saputra, H.; Andriani, A.; Fahrurrozi; Juanssilfero, A. B.; Thontowi, A.; Widyaningsih, T. D.; Eris, D. D.; Amaniyah, M.; Yopi; Habibi, M. S. Cacao Pod Husk for Citric Acid Production under Solid State Fermentation Using Response Surface Method. Biomass Convers Biorefin 2023, 13, 7165–7173.
- Muñoz-Almagro, N.; Valadez-Carmona, L.; Mendiola, J. A.; Ibáñez, E.; Villamiel, M. Structural Characterisation of Pectin Obtained from Cacao Pod Husk. Comparison of Conventional and Subcritical Water Extraction. Carbohydr Polym 2019, 217, 69–78. [Google Scholar] [CrossRef]
- Kley Valladares-Diestra, K.; Porto de Souza Vandenberghe, L.; Ricardo Soccol, C. A Biorefinery Approach for Pectin Extraction and Second-Generation Bioethanol Production from Cocoa Pod Husk. Bioresour Technol 2022, 346, 126635. [Google Scholar] [CrossRef]
- Rogoski, W.; Pereira, G. N.; Cesca, K.; de Oliveira, D.; de Andrade, C. J. An Overview on Pretreatments for the Production of Cassava Peels-Based Xyloligosaccharides: State of Art And Challenges. Waste Biomass Valorization 2023, 14, 2115–2131. [Google Scholar] [CrossRef]
- Fan, X.; Ren, M.; Zhou, C.; Kong, F.; Hua, C.; Fakayode, O. A.; Okonkwo, C. E.; Li, H.; Liang, J.; Wang, X. Total Utilization of Lignocellulosic Biomass with Xylooligosaccharides Production Priority: A Review. Biomass Bioenergy 2024, 181, 107038. [Google Scholar] [CrossRef]
- Lubis, M. A. R.; Lee, S. H.; Mardawati, E.; Rahimah, S.; Antov, P.; Andoyo, R.; Kristak, L.; Nurhadi, B. Biomass Conversion and Sustainable Biorefinery. Biomass Convers Biorefin 2024, 12. [Google Scholar] [CrossRef]
- Muharja, M.; Fitria Darmayanti, R.; Palupi, B.; Rahmawati, I.; Arief Fachri, B.; Arie Setiawan, F.; Wika Amini, H.; Fitri Rizkiana, M.; Rahmawati, A.; Susanti, A.; Kharisma Yolanda Putri, D.; Muharja, M.; Darmayanti, R.; Palupi, B.; Rahmawati, I.; Fachri, B.; Setiawan, F.; Amini, H.; Rizkiana, M.; Rahmawati, A.; Susanti, A.; Putri, D. Optimization of Microwave-Assisted Alkali Pretreatment for Enhancement of Delignification Process of Cocoa Pod Husk. Bulletin of Chemical Reaction Engineering & Catalysis 2021, 16, 31–43. [Google Scholar] [CrossRef]
- Pangestu, R.; Amanah, S.; Juanssilfero, A. B.; Yopi; Perwitasari, U. Response Surface Methodology for Microwave-Assisted Extraction of Pectin from Cocoa Pod Husk (Theobroma Cacao) Mediated by Oxalic Acid. Journal of Food Measurement and Characterization 2020, 14, 2126–2133. [CrossRef]
- Saelee, M.; Sivamaruthi, B. S.; Tansrisook, C.; Duangsri, S.; Chaiyasut, K.; Kesika, P.; Peerajan, S.; Chaiyasut, C. Response Surface Methodological Approach for Optimizing Theobroma Cacao L. Oil Extraction. Applied Sciences 2022, Vol. 12, Page 5482 2022, 12. [Google Scholar] [CrossRef]
- Hennessey-Ramos, L.; Murillo-Arango, W.; Vasco-Correa, J.; Astudillo, I. C. P. Enzymatic Extraction and Characterization of Pectin from Cocoa Pod Husks (Theobroma Cacao L.) Using Celluclast® 1. 5 L. Molecules 2021, Vol. 26, Page 1473 2021, 26. [Google Scholar] [CrossRef]
- Ferreira, S. L. C.; Bruns, R. E.; Ferreira, H. S.; Matos, G. D.; David, J. M.; Brandão, G. C.; da Silva, E. G. P.; Portugal, L. A.; dos Reis, P. S.; Souza, A. S.; dos Santos, W. N. L. Box-Behnken Design: An Alternative for the Optimization of Analytical Methods. Anal Chim Acta 2007, 597, 179–186. [Google Scholar] [CrossRef]
- Aycan Dümenci, N.; Aydın Temel, F.; Turan, N. G. Role of Different Natural Materials in Reducing Nitrogen Loss during Industrial Sludge Composting: Modelling and Optimization. Bioresour Technol 2023, 385, 129464. [Google Scholar] [CrossRef]
- Nassef, H. M.; Al-Hazmi, G. A. A. M.; Alayyafi, A. A. A.; El-Desouky, M. G.; El-Bindary, A. A. Synthesis and Characterization of New Composite Sponge Combining of Metal-Organic Framework and Chitosan for the Elimination of Pb(II), Cu(II) and Cd(II) Ions from Aqueous Solutions: Batch Adsorption and Optimization Using Box-Behnken Design. J Mol Liq 2024, 394, 123741. [Google Scholar] [CrossRef]
- Chan, C. H.; Yusoff, R.; Ngoh, G. C. Optimization of Microwave-Assisted Extraction Based on Absorbed Microwave Power and Energy. Chem Eng Sci 2014, 111, 41–47. [Google Scholar] [CrossRef]
- Del Campo, G.; Zuriarrain, J.; Zuriarrain, A.; Berregi, I. Quantitative Determination of Carboxylic Acids, Amino Acids, Carbohydrates, Ethanol and Hydroxymethylfurfural in Honey by 1H NMR. Food Chem 2016, 196, 1031–1039. [Google Scholar] [CrossRef] [PubMed]
- Bharti, S. K.; Roy, R. Quantitative 1H NMR Spectroscopy. TrAC Trends in Analytical Chemistry 2012, 35, 5–26. [Google Scholar] [CrossRef]
- Schievano, E.; Tonoli, M.; Rastrelli, F. NMR Quantification of Carbohydrates in Complex Mixtures. A Challenge on Honey. Anal Chem 2017, 89, 13405–13414. [Google Scholar] [CrossRef] [PubMed]
- Peng, P.; She, D. Isolation, Structural Characterization, and Potential Applications of Hemicelluloses from Bamboo: A Review. Carbohydr Polym 2014, 112, 701–720. [Google Scholar] [CrossRef]
- Hernández-Bolio, G. I.; Fagundo-Mollineda, A.; Caamal-Fuentes, E. E.; Robledo, D.; Freile-Pelegrin, Y.; Hernández-Núñez, E. NMR Metabolic Profiling of Sargassum Species Under Different Stabilization/Extraction Processes. J Phycol 2021, 57, 655–663. [Google Scholar] [CrossRef]
- Hou, Z.; Liang, X.; Du, L.; Su, F.; Su, W. Quantitative Determination and Validation of Avermectin B1a in Commercial Products Using Quantitative Nuclear Magnetic Resonance Spectroscopy. Magnetic Resonance in Chemistry 2014, 52, 480–485. [Google Scholar] [CrossRef]
- Al-Mekhlafi, N. A.; Mediani, A.; Ismail, N. H.; Abas, F.; Dymerski, T.; Lubinska-Szczygeł, M.; Vearasilp, S.; Gorinstein, S. Metabolomic and Antioxidant Properties of Different Varieties and Origins of Dragon Fruit. Microchemical Journal 2021, 160, 105687. [Google Scholar] [CrossRef]
- Spiteri, M.; Jamin, E.; Thomas, F.; Rebours, A.; Lees, M.; Rogers, K. M.; Rutledge, D. N. Fast and Global Authenticity Screening of Honey Using 1H-NMR Profiling. Food Chem 2015, 189, 60–66. [Google Scholar] [CrossRef]
- Ouattara, L. Y.; Kouassi, E. K. A.; Soro, D.; Yao, K. B.; Fanou, G. D.; Drogui, A. P.; Tyagi, D. R. Optimization of Thermochemical Hydrolysis of Potassium Hydroxide-Delignified Cocoa (Theobroma Cacao L) Pod Husks under Low Combined Severity Factors (CSF) Conditions. Sci Afr 2023, 22, e01908. [Google Scholar] [CrossRef]
Figure 1.
Effect of temperature, power, and time relationship in microwave-assisted hydrothermal pretreatment on total extraction yield of fructose, sucrose, and glucose from CPH: (A) temperature plot, (B) power plot, and (C) time plot corresponding to glucose from CPH; (D) temperature plot, (E) power plot, and (F) time plot corresponding to sucrose from CPH; and (G) temperature plot, (H) power plot, and (I) time plot corresponding to fructose from CPH.
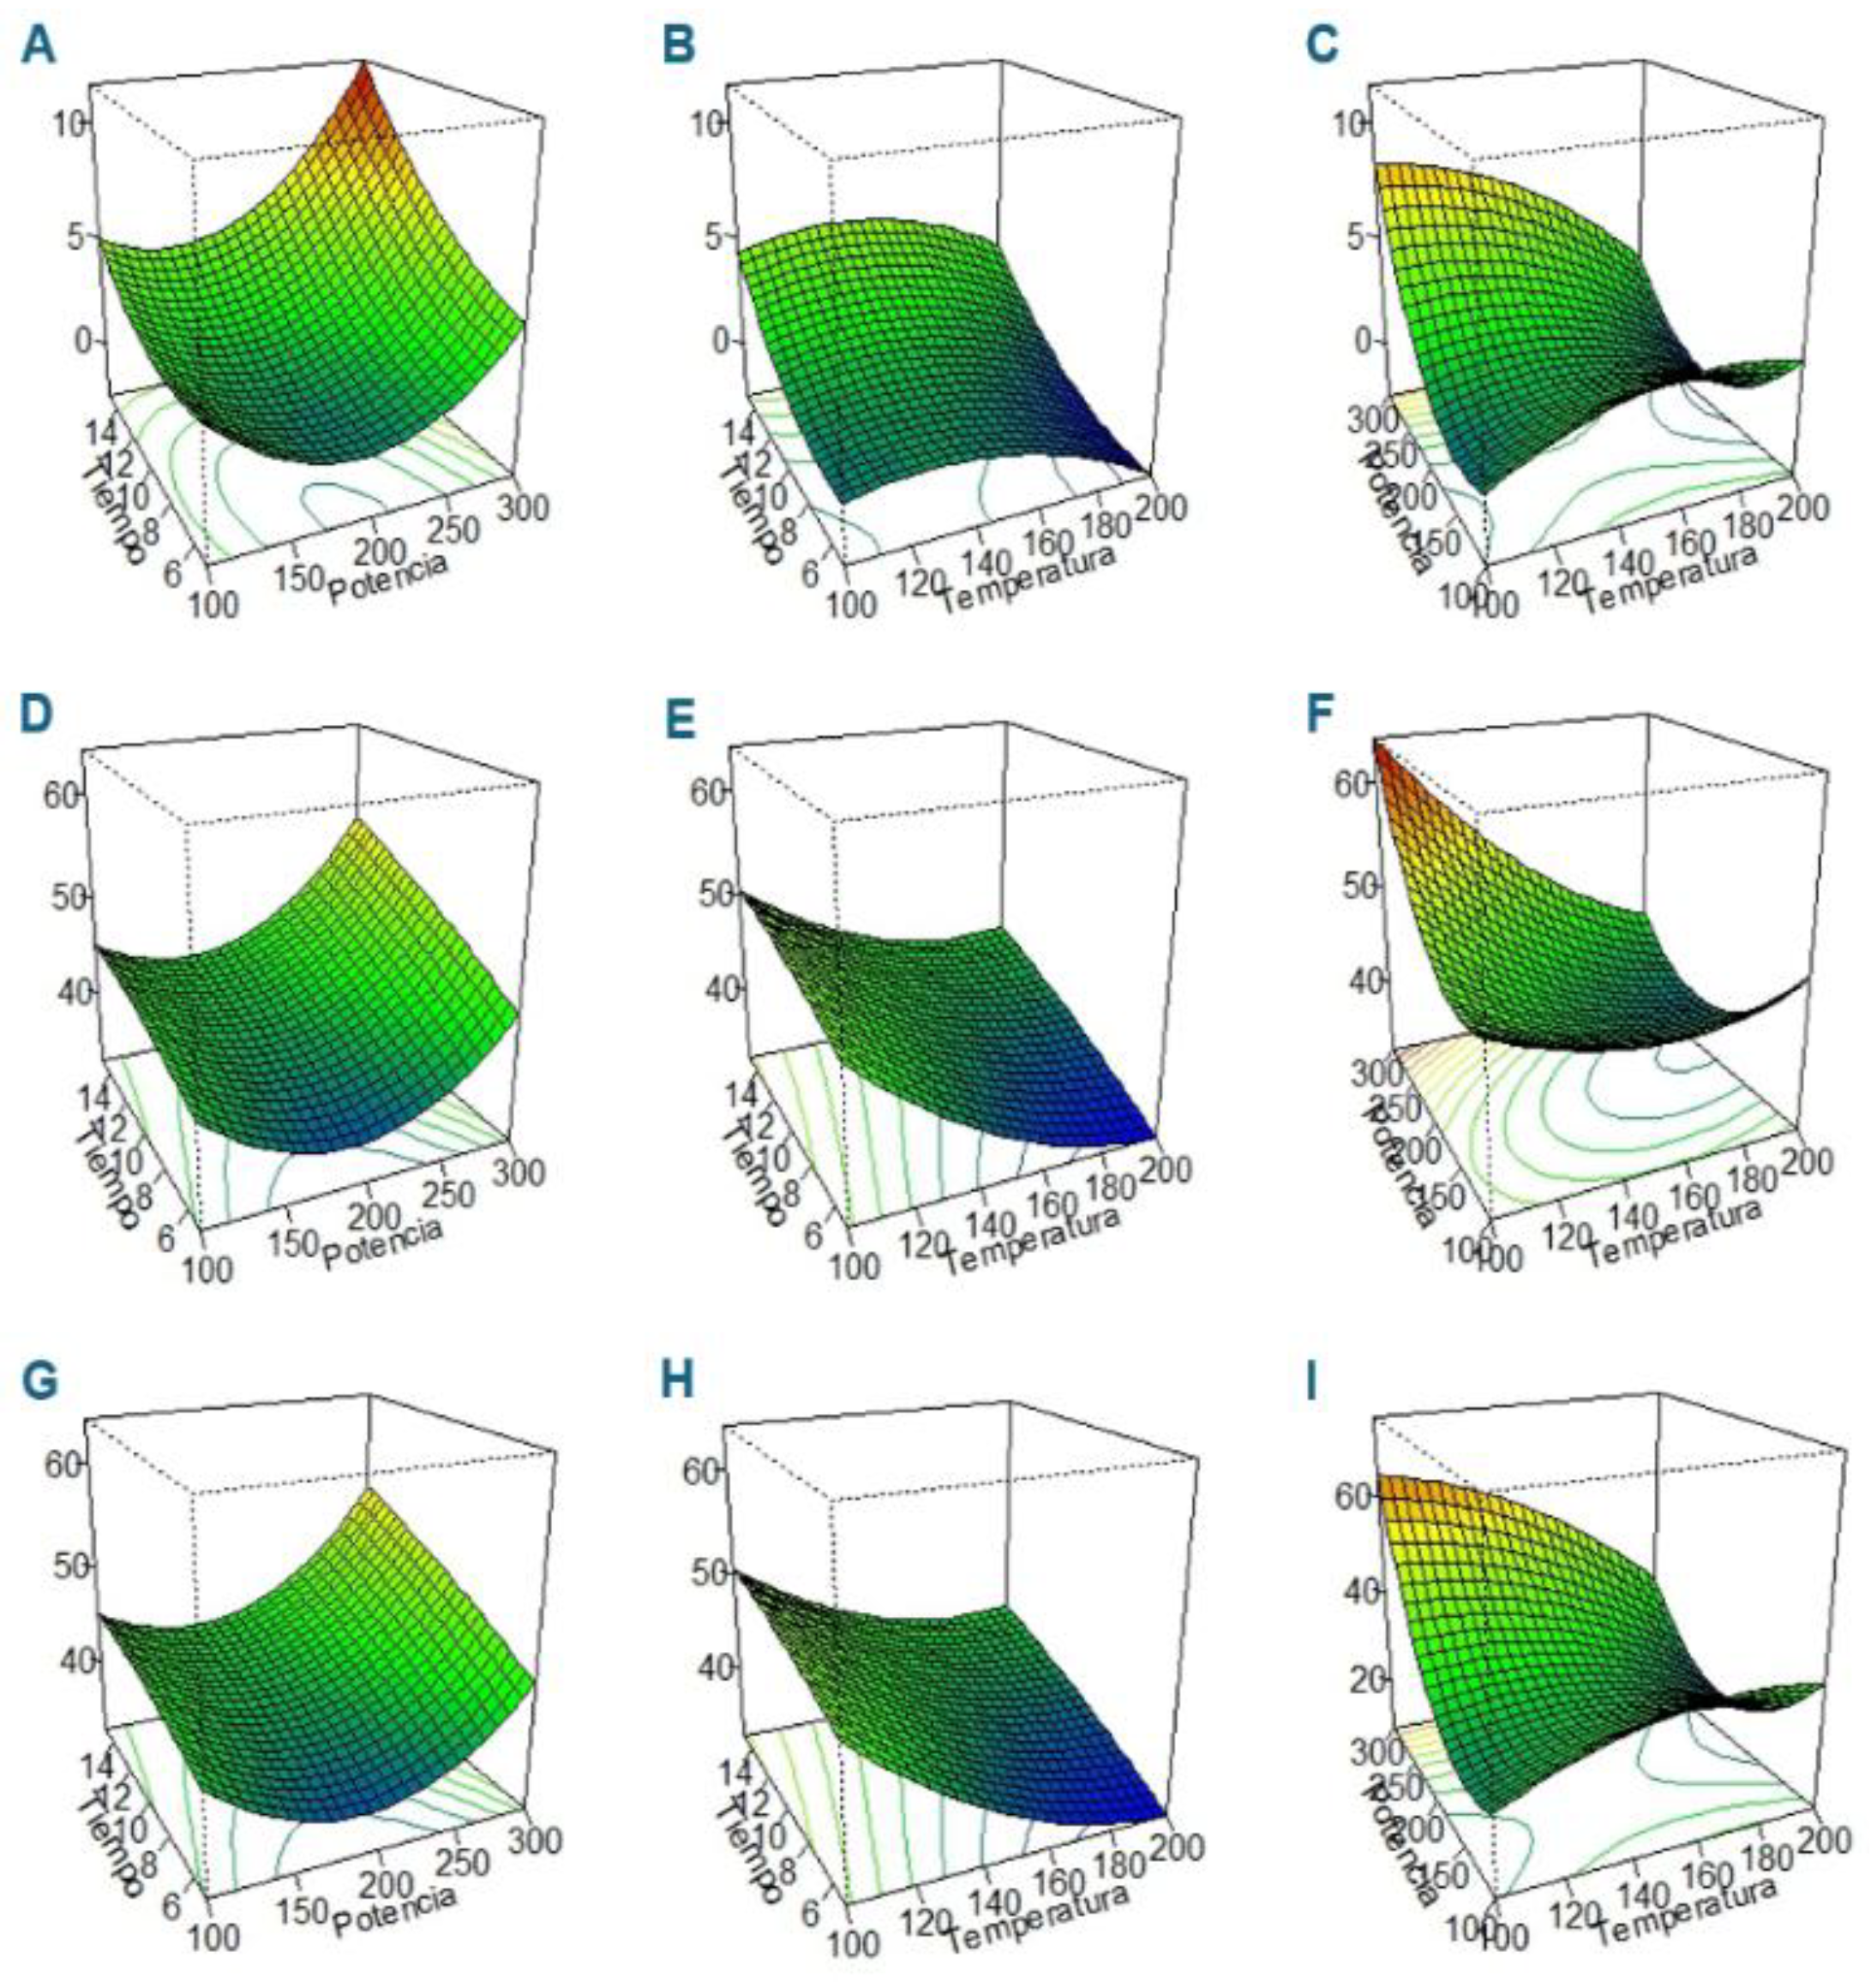
Figure 2.
Effect of temperature, power and time relationship in microwave-assisted hydrothermal pretreatment on total extraction yield of fructose, sucrose and glucose from HMC-CPH: (J) temperature plot, (K) power plot and (L) time plot corresponding to glucose from HMC-CPH; (M) temperature plot, (N) power plot and (O) time plot corresponding to sucrose from HMC-CPH; and (P) temperature plot, (Q) power plot and (R) time plot corresponding to fructose from HMC-CPH.
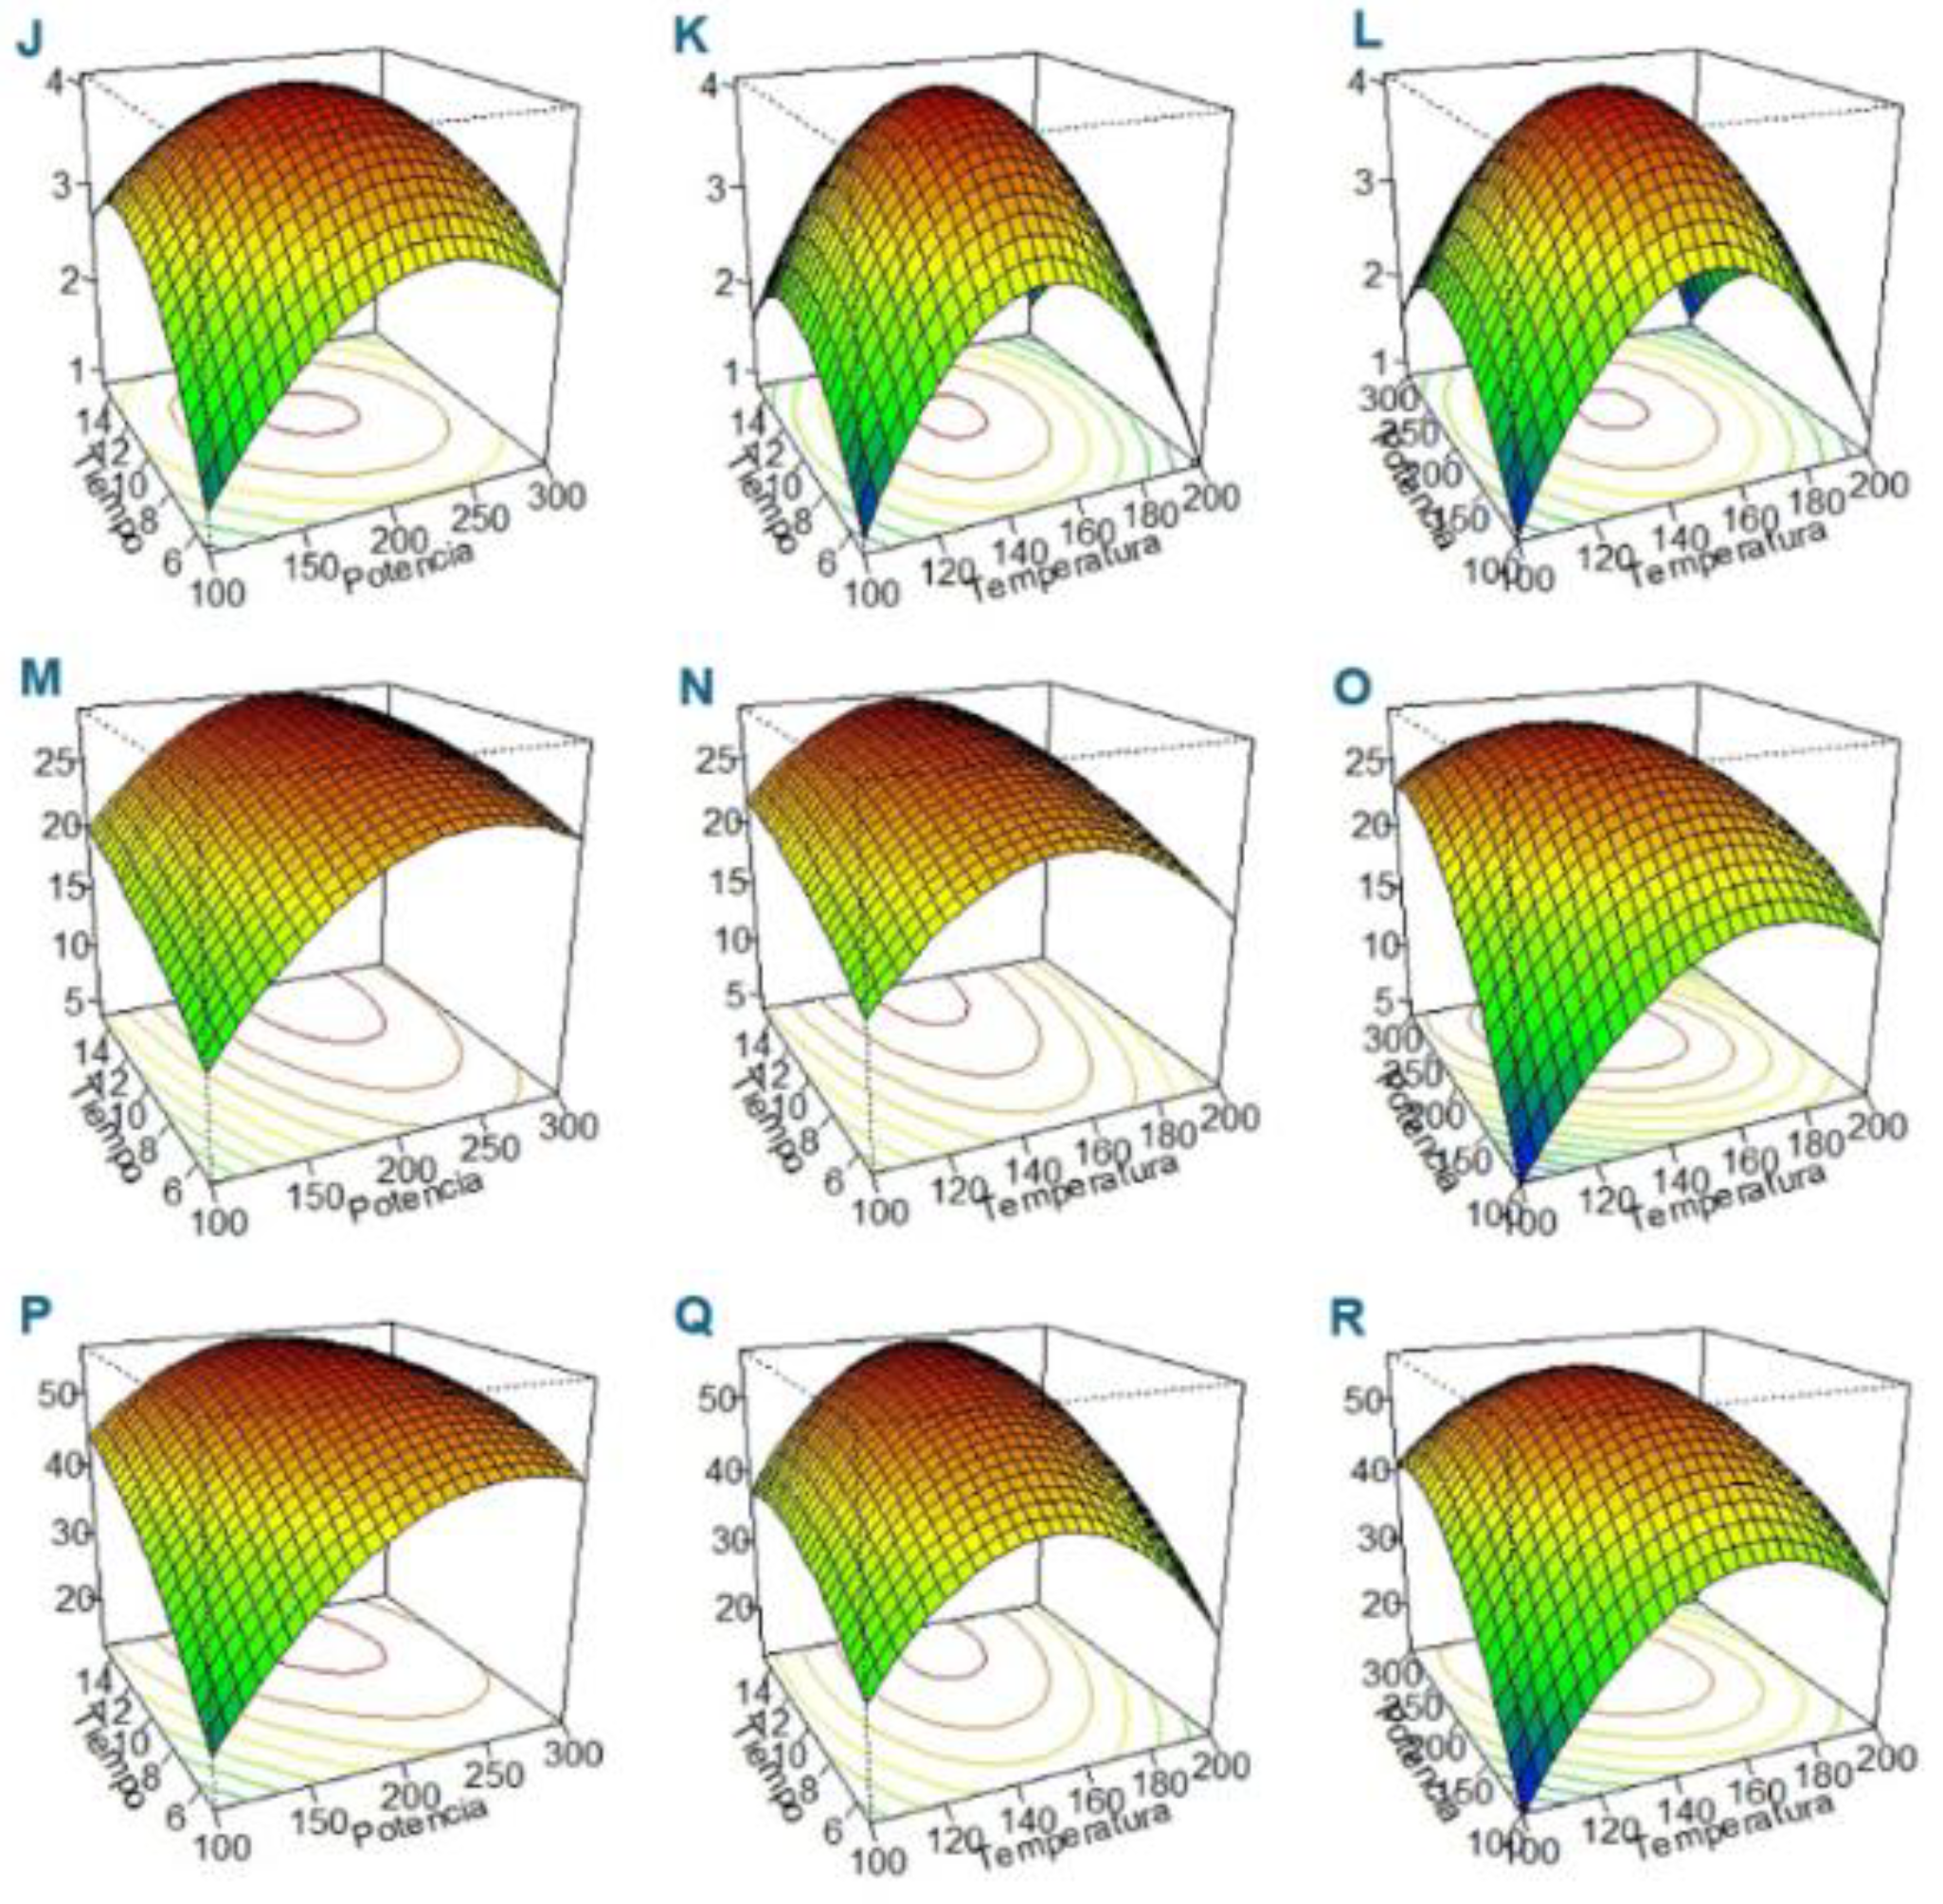

Table 1.
Characteristics of the 1H NMR signals observed in MA-HTP of CPH and HMC-CPH.
| D-Fructose, Sucrose, and D-Glucose Standards | CPH and HMC-CPH MA-HTP Extracts | ||||
| Assignment | Chemical shifts used for identity check | Chemical shift | |||
| δ (ppm) | Multiplicity |
Identity check δ (ppm) |
Quantity δ (ppm) |
Multiplicity | |
| Fructose | 4.11 | d | 4.11 | d | |
| Fructose | 4.01 | t | 4.01 | t | |
| Fructose | 3.89 | dd | 3.90 | m | |
| Sucrose | 5.40 | d | 5.40 | d | |
| Sucrose | 4.21 | d | 4.20 | d | |
| Sucrose | 4.05 | t | 4.05 | t | |
| Sucrose | 3.76 | t | 3.76 | t | |
| Sucrose | 3.67 | s | 3.67 | s | |
| Sucrose | 3.55 | dd | n/d | n/d | |
| Sucrose | 3.47 | t | 3.47 | t | |
| Glucose | 5.24 | d | 5.24 | d | |
| Glucose | 4.65 | d | 4.65 | d | |
| Glucose | 3.89 | dd | n/d | n/d | |
| Glucose | 3.53 | dd | 3.53 | dd | |
| Glucose | 3.25 | t | 3.25 | t | |
s, singlet; d, doublet; t, triplet; m, multiplet; dd, doublet–doublet.
Table 2.
BBD model for MA-HTP optimization of CPH and HMC-CPH by 1H NMR Qu.
| Independent variables | Dependent variable Y | |||||||
|---|---|---|---|---|---|---|---|---|
| Coded -1,0,1 [Uncoded] | Concentration CPH |
Concentration HMC-CPH |
||||||
| A (°C) |
B (W) |
C (min) |
Glucose (%) | Sucrose (%) | Fructose (%) | Glucose (%) | Sucrose (%) | Fructose (%) |
| -1 [100] | -1 [100] | 0 [10] | 1.0 | 51.10 | 29.90 | 1.2 | 7.70 | 16.91 |
| 1 [200] | -1 [100] | 0 [10] | 1.0 | 43.17 | 27.80 | 0.4 | 12.00 | 25.16 |
| -1 [100] | 1 [300] | 0 [10] | 9.4 | 68.02 | 70.26 | 2.2 | 26.23 | 44.78 |
| 1 [200] | 1 [300] | 0 [10] | 1.0 | 39.20 | 27.07 | 0.6 | 8.67 | 23.87 |
| -1 [100] | 0 [200] | -1 [5] | 1.2 | 50.39 | 29.56 | 0.5 | 8.15 | 20.20 |
| 1 [200] | 0 [200] | -1 [5] | 0.8 | 43.38 | 26.87 | 1.3 | 17.19 | 27.49 |
| -1 [100] | 0 [200] | 1 [15] | 0.7 | 39.41 | 23.51 | 1.1 | 20.90 | 35.43 |
| 1 [200] | 0 [200] | 1 [15] | 1.1 | 37.91 | 28.08 | 1.7 | 26.92 | 49.61 |
| 0 [150] | -1 [100] | -1 [5] | 0.5 | 34.63 | 20.94 | 1.4 | 13.98 | 21.58 |
| 0 [150] | 1 [300] | -1 [5] | 1.1 | 36.78 | 29.23 | 2.3 | 25.76 | 47.07 |
| 0 [150] | -1 [100] | 1 [15] | 7.5 | 52.79 | 57.48 | 2.8 | 16.42 | 41.23 |
| 0 [150] | 1 [300] | 1 [15] | 14.0 | 61.78 | 88.57 | 1.8 | 22.96 | 44.31 |
| 0 [150] | 0 [200] | 0 [10] | 1.0 | 42.15 | 27.91 | 7.8 | 35.80 | 75.56 |
| 0 [150] | 0 [200] | 0 [10] | 0.8 | 35.13 | 23.10 | 2.3 | 28.57 | 51.86 |
| 0 [150] | 0 [200] | 0 [10] | 1.4 | 43.38 | 31.83 | 2.1 | 17.45 | 34.10 |
Table 3.
Optimum values provided by RSA-BBD for glucose, sucrose, and fructose from CPH and HMC-CPH.
Table 3.
Optimum values provided by RSA-BBD for glucose, sucrose, and fructose from CPH and HMC-CPH.
| Source | Carbohydrate | Threshold (0.01) |
||
|---|---|---|---|---|
| Temperature (°C) |
Power (Watt) |
Time (min) |
||
| CPH | Glucose | 135.4 | 180.6 | 5.8 |
| CPH | Sacarose | 154.3 | 256.3 | 20.2 |
| CPH | Fructose | 129.5 | 173.8 | 5.2 |
| HMC-CPH | Glucose | 142.2 | 204.4 | 10.5 |
| HMC-CPH | Sacarose | 148.8 | 215.6 | 14.3 |
| HMC-CPH | Fructose | 151.6 | 231.6 | 13.0 |
Disclaimer/Publisher’s Note: The statements, opinions and data contained in all publications are solely those of the individual author(s) and contributor(s) and not of MDPI and/or the editor(s). MDPI and/or the editor(s) disclaim responsibility for any injury to people or property resulting from any ideas, methods, instructions or products referred to in the content. |
© 2025 by the authors. Licensee MDPI, Basel, Switzerland. This article is an open access article distributed under the terms and conditions of the Creative Commons Attribution (CC BY) license (http://creativecommons.org/licenses/by/4.0/).
Copyright: This open access article is published under a Creative Commons CC BY 4.0 license, which permit the free download, distribution, and reuse, provided that the author and preprint are cited in any reuse.


