Submitted:
01 July 2025
Posted:
04 July 2025
You are already at the latest version
Abstract
In this paper, we present the Genomic Compute Trifecta, which are the fundamental structural barriers to scalable computation of genomics and multi-omics workloads due to the complexity of the data structure and its incompatibility with the assumptions underpinning traditional computing architectures. Bioinformatics pipelines work over sparse graphs with nonuniform memory access patterns, dynamic control flow, and power-law distributions and control-heavy logic flows which lead clinical interpretability decreases logarithmically with computational burden due to system overhead, memory latency,and parallel speedups plateau due to Amdahl's law. This presents fundamental bottlenecks for fields that require real-time analytical capabilities such as precision medicine, AI-driven drug discovery, and clinical diagnostics. We establish that satisfying computational requirements alone is insufficient to ensure actionable clinical insight. As the biological state space expands superpolynomially, both analytical efficiency and signal fidelity degrade substantially. We derive a resource estimation formula to allow bioinformaticians to determine minimum computational thresholds for maintaining clinical return on investment (ROI).
Keywords:
Bioinformatics
; computational biology
; data analytics
1. Introduction
As the cost of DNA sequencing continues to decline, emerging technologies now enable the extraction of phenotypic data through high-throughput sequencing (HTS) methods. These generate a wide array of data formats, such as FASTQ, BAM, and VCF, each of which requires different handling and analysis workflows. This heterogeneity complicates the integration of data sets between sources and demands more advanced data management strategies. Furthermore, single-cell and spatial technologies introduce layers of complexity that far exceed the capacity of conventional bioinformatics infrastructure.
However, the ability to extract clinically meaningful information has not kept pace with advances in cloud computing and high-performance computing (HPC). In diagnosing how genomic data are stored and processed in typical bioinformatics workflows, including variant calling, multimodal integration, genome assembly, and transcript reconstruction, we observe that data access is inherently unpredictable. These tasks require irregular memory access patterns involving the traversal of sparse graphs, nonlocal dependencies, and conditional control flow, all of which challenge the assumptions of contemporary hardware.
To formalize this disconnect, we define the concept of a Computational Thread Path (), representing the complete execution journey from high-level genomics code to binary-level instructions:
Where:
- C: Code complexity (e.g., – in genome analysis)
- : Operating system overhead (context switches, thread management)
- M: Memory hierarchy inefficiencies (cache miss rates, RAM/disk access latency)
- B: Binary execution inefficiencies (pipeline stalls, branch mispredictions)
Each component introduces non-linear overhead, such that the total runtime grows superlinearly with input size:
We validate this scaling behavior across key genomics workloads including variant calling, phylogenetics, genome wide association studies (GWAS), and single-cell analysis and demonstrate that even idealized parallelization cannot overcome these barriers due to communication and synchronization costs. According to Amdahl’s Law, speedup plateaus sublinearly with increased parallel resources.
Moreover, we find that increased computational resources do not necessarily translate to improved insight. As computational complexity grows, biological interpretability and clinical utility often degrade. Specifically, clinical value diminishes in proportion to the logarithm of computational complexity:
2. Methods
2.1. 1. Complexity of the Data Structure
Genomic information can be formally represented as a multi-layered graph topology composed of DNA sequences, protein interaction networks, and metabolic pathways. These structures exhibit three defining characteristics that fundamentally challenge conventional computing paradigms:
Sparsity.
Non-coding regions comprise over 98% of the human genome, resulting in discontinuous data hot spots. Functional elements such as exons and regulatory sequences represent only a small fraction of the total sequence, leading to sparse data representations and localized computational activity. This non-uniform distribution creates challenges for memory locality and cache efficiency.
Power-law Distribution.
Most edges in genomic graphs are concentrated in a small subset of highly connected nodes. This behavior follows the scale-free network model described by Barabási–Albert, where the degree distribution follows a power law. For instance, in protein-protein interaction networks, certain hub proteins may interact with hundreds of partners, while the majority of proteins interact with only a few.
Dynamic Topology.
Genomic network structures are constantly reshaped by biological events such as CRISPR-induced edits, epigenetic modifications, and alternative RNA splicing. Environmental factors and local sequence effects also introduce variability in DNA flexibility AT-rich regions tend to be more flexible due to weaker hydrogen bonding, whereas GC-rich regions are more structurally rigid.
These characteristics generate memory access patterns that violate the spatial and temporal locality assumptions underpinning CPU cache hierarchies and GPU coalesced memory architectures. Mathematically, graph-based representations of these biological structures offer more efficient computational models than traditional linear approaches.
Theorem 1: Runtime Scaling Bound
Statement. For any genomic workload processing input size n, the runtime satisfies:
Proof. Let be any genomic computation thread path, where:
- : Algorithmic complexity
- : Operating system overhead
- : Memory hierarchy latency
- : Binary execution inefficiency
We prove each lower bound as follows:
Algorithmic Lower Bound.
- Genome assembly requires pairwise overlap comparisons.
- Variant calling on n variants requires genotype likelihood operations.
- Thus, .
OS Overhead Lower Bound.
- For n processes on p processors, context switches .
- Scheduling latency grows as .
- Thus, .
Memory Access Lower Bound.
- Genomic graphs have working set size .
- For any fixed cache size , there exists such that for all , .
- Thus, .
Execution Stalls Lower Bound.
- Branch prediction is bounded by input-dependent variation.
- Pipeline stalls scale linearly with n, so .
Compositions
Each component multiplies non-linearly:
With algorithmic optimizations, this bound reduces to:
Our findings show that genomic computations scale remarkably poorly, with superpolynomial growth that deviates significantly from classical algorithmic behavior. As input size increases, the runtime curve bends sharply upward—rendering large-scale genomic workloads computationally prohibitive.
Theorem 2: Parallelization Ineffectiveness
Statement. For any parallel implementation of genomic workloads, the asymptotic complexity remains superpolynomial.
Proof. Let P be any parallel algorithm for genomic computation using p processors. Then, for all such algorithms, there exists a serial fraction such that:
Figure 1.
Empirical illustration of genomic runtime scaling. The runtime curve becomes nearly vertical as n increases, validating Theorem 1. While 1,000 variants process in seconds, 1 billion variants require projected runtimes of several years.
Figure 1.
Empirical illustration of genomic runtime scaling. The runtime curve becomes nearly vertical as n increases, validating Theorem 1. While 1,000 variants process in seconds, 1 billion variants require projected runtimes of several years.

Serial Dependency Analysis
- Genome assembly involves graph construction and consensus phases that are inherently sequential.
- For all assembly algorithms, topological ordering and consistency checking require serial operations.
- Thus, serial fraction .
Amdahl’s Law Application.
- The theoretical speedup is bounded as:
- For , we obtain:
- Therefore, the parallel execution time is lower bounded by:
Asymptotic Preservation.
Since is a constant, the asymptotic complexity is preserved:
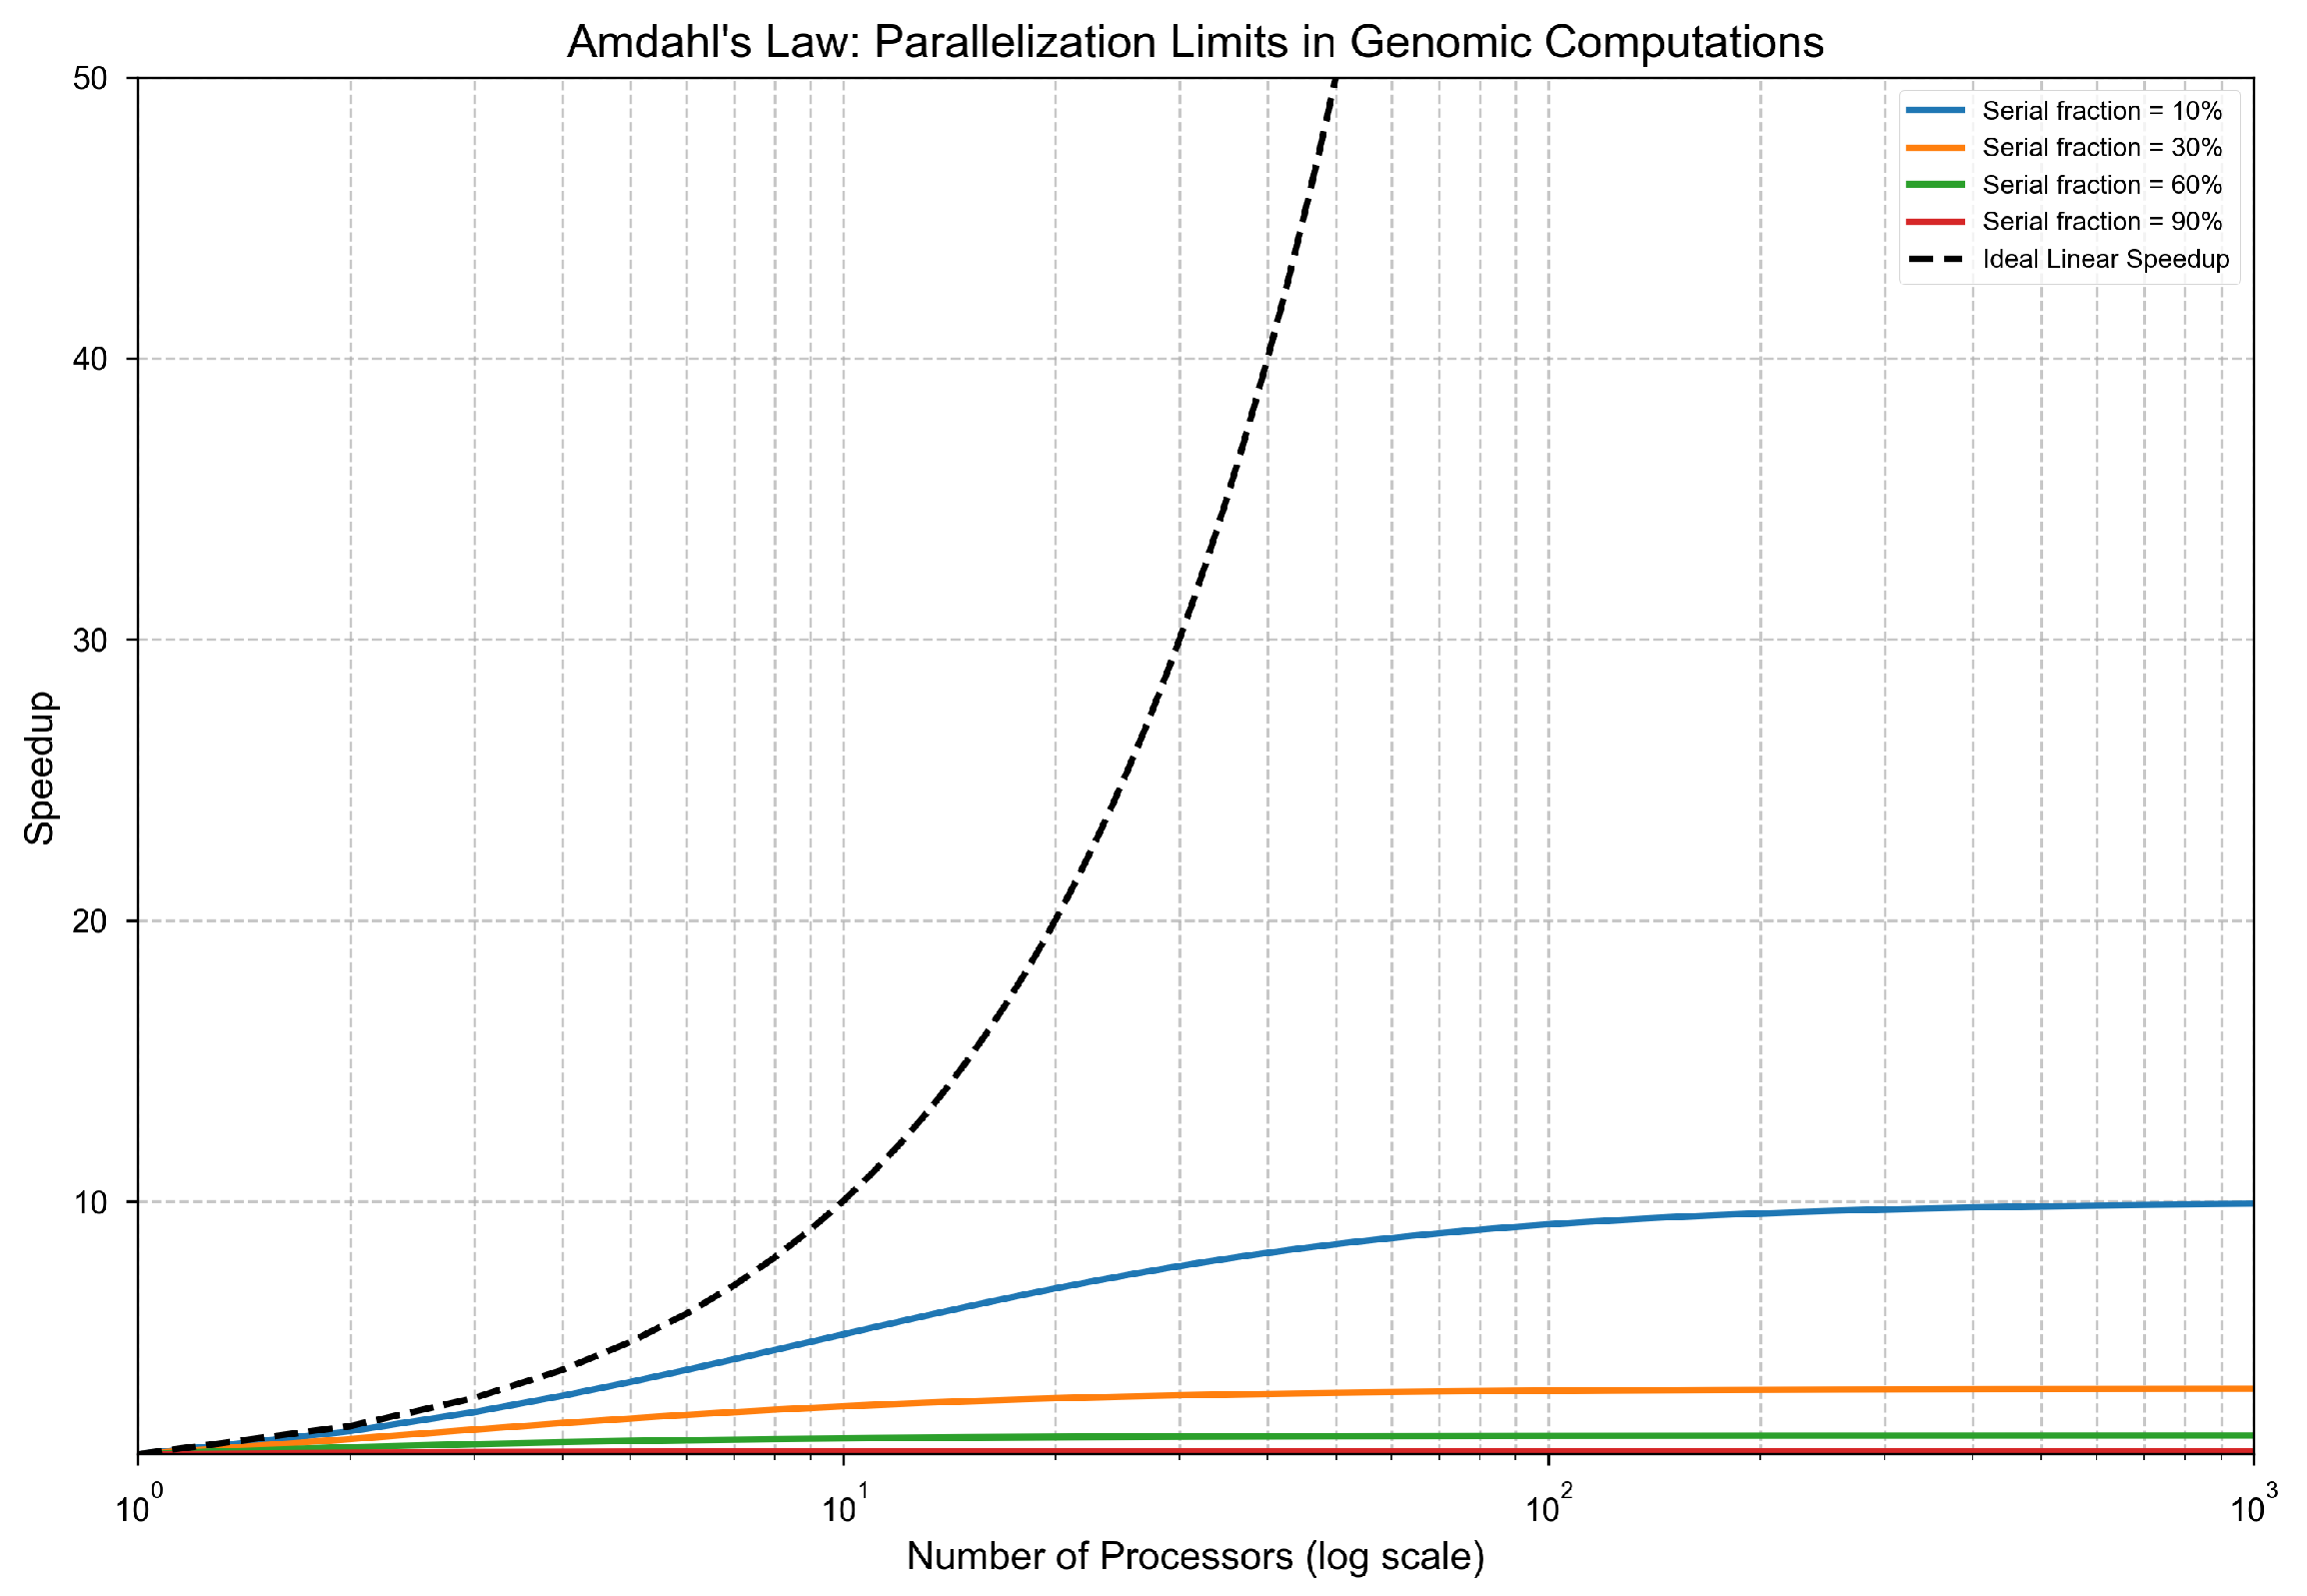
Parallel speedup is still fundamentally constrained even under modest serial fractions. According to Amdahl’s Law, a workload with a 30% serial component has a maximum speedup of less than , regardless of the number of processors. As the serial fraction increases, the gains from parallelization diminish rapidly. This exposes a hard architectural ceiling imposed by the naturally sequential components of genomic pipelines.
Figure 2.
Maximum theoretical speedup as a function of serial fraction under Amdahl’s Law. For , speedup asymptotes at ; for , it drops to . Genomic workloads frequently exceed these thresholds due to inherently sequential operations.
Figure 2.
Maximum theoretical speedup as a function of serial fraction under Amdahl’s Law. For , speedup asymptotes at ; for , it drops to . Genomic workloads frequently exceed these thresholds due to inherently sequential operations.
Theorem 3: Clinical Interpretability Decay
Statement. Clinical value decays inversely with computational complexity, such that:
Proof. Let denote the clinical value as a function of data size n. For all genomic analyses of size n, clinical interpretability is limited by both cognitive and technical factors:
Cognitive Capacity Bound.
- Human interpretability is bounded by Miller’s Law: the brain can process approximately elements.
- Define actionability as , where .
- Hence, .
Signal Degradation.
- For computational steps, error accumulation follows .
- Given , signal-to-noise ratio is bounded by:
Time-to-Insight Penalty.
- Longer runtime delays clinical relevance: utility diminishes as .
- With , temporal discounting becomes:
Composite Clinical Value.
Combining all components:
Substituting bounds:
For total complexity , we simplify to:
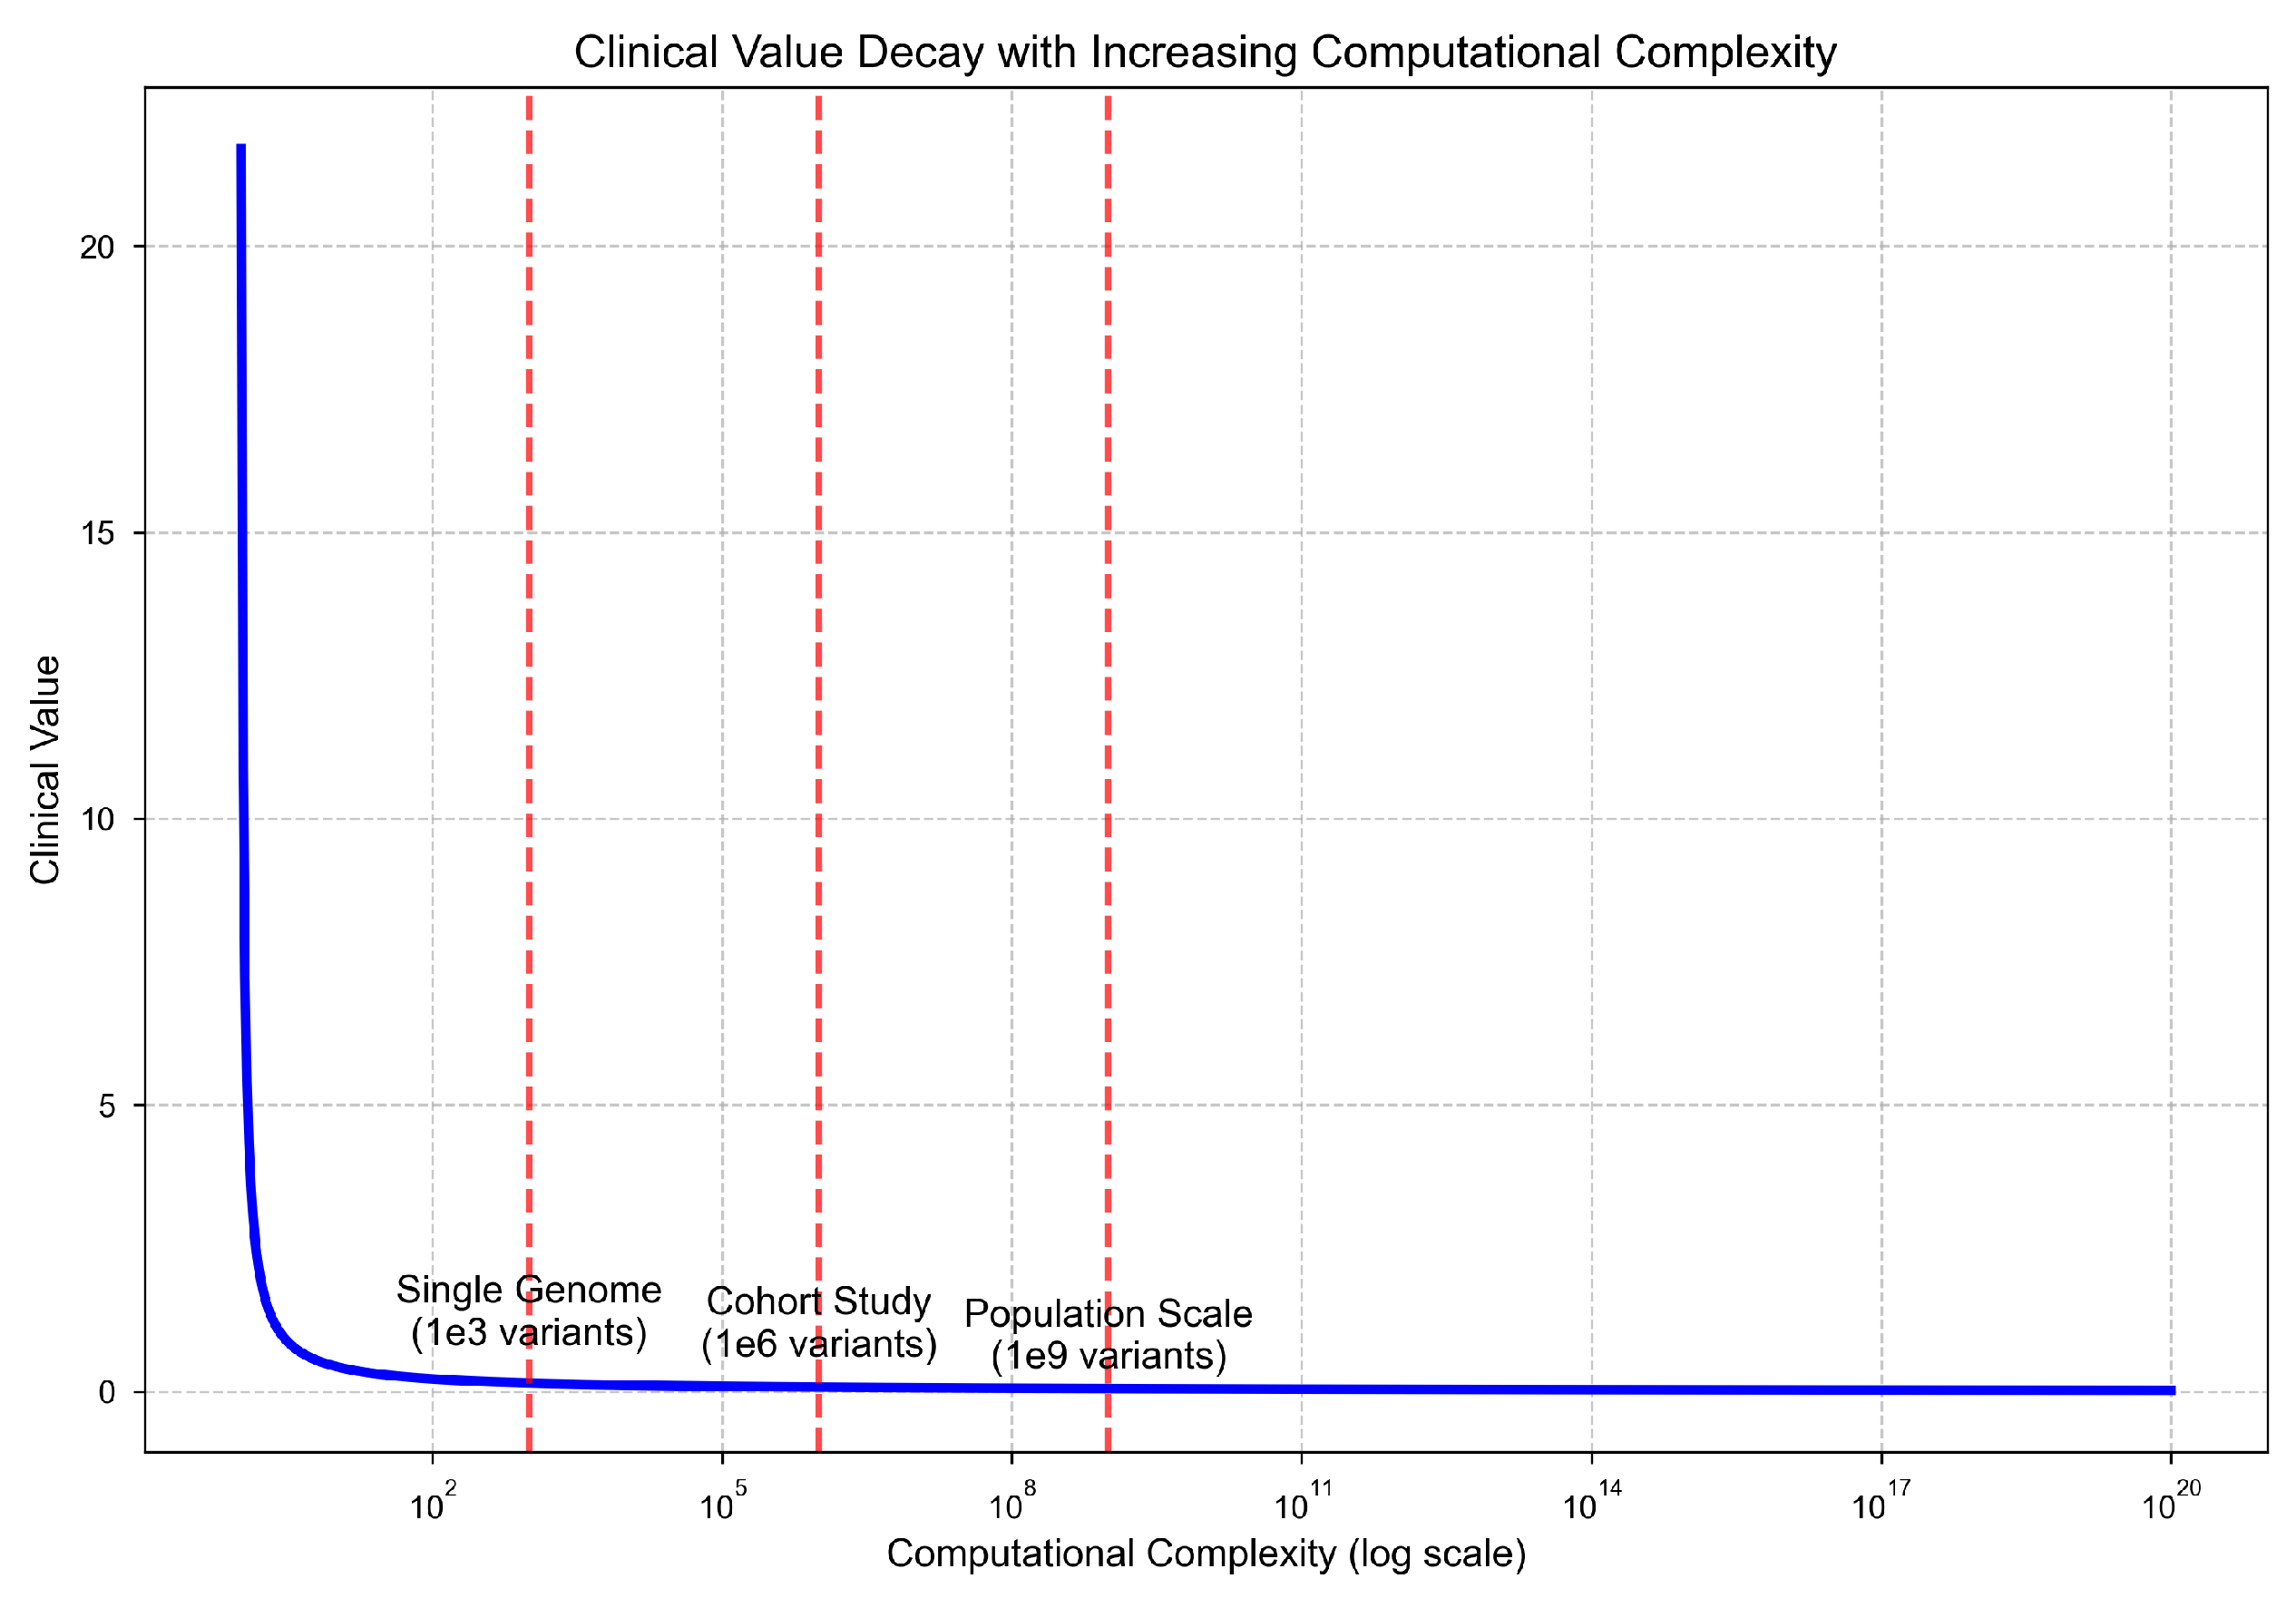
As computational complexity increases, clinical utility declines rapidly. While single-genome analyses maintain high diagnostic yield, population-scale studies show a steep drop in clinical value per unit of computation. This reflects a nonlinear trade-off where the exponential growth in processing cost and noise accumulation outpaces the marginal utility of additional samples.
Figure 3.
Clinical interpretability declines as computational complexity increases. Single-genome analysis remains interpretable, but population-scale studies face steep reductions in signal quality and utility.
Figure 3.
Clinical interpretability declines as computational complexity increases. Single-genome analysis remains interpretable, but population-scale studies face steep reductions in signal quality and utility.
Theorem 4: Resource Exhaustion Inevitability
Statement. For any fixed computational capacity , there exists such that for all , the resource demand exceeds :
Proof by Strong Induction.
Base Cases.
These represent tractable problem sizes.
Inductive Hypothesis.
Assume for all , the resource demand grows at least as fast as:
Inductive Step.
For , the added complexity from incorporating one additional data element interacts with all existing n elements, forming at least additional computations.
Divergence.
The derivative of resource demand with respect to input size grows superpolynomially:
Taking the limit:
Therefore, for any finite compute budget , there exists a threshold such that:
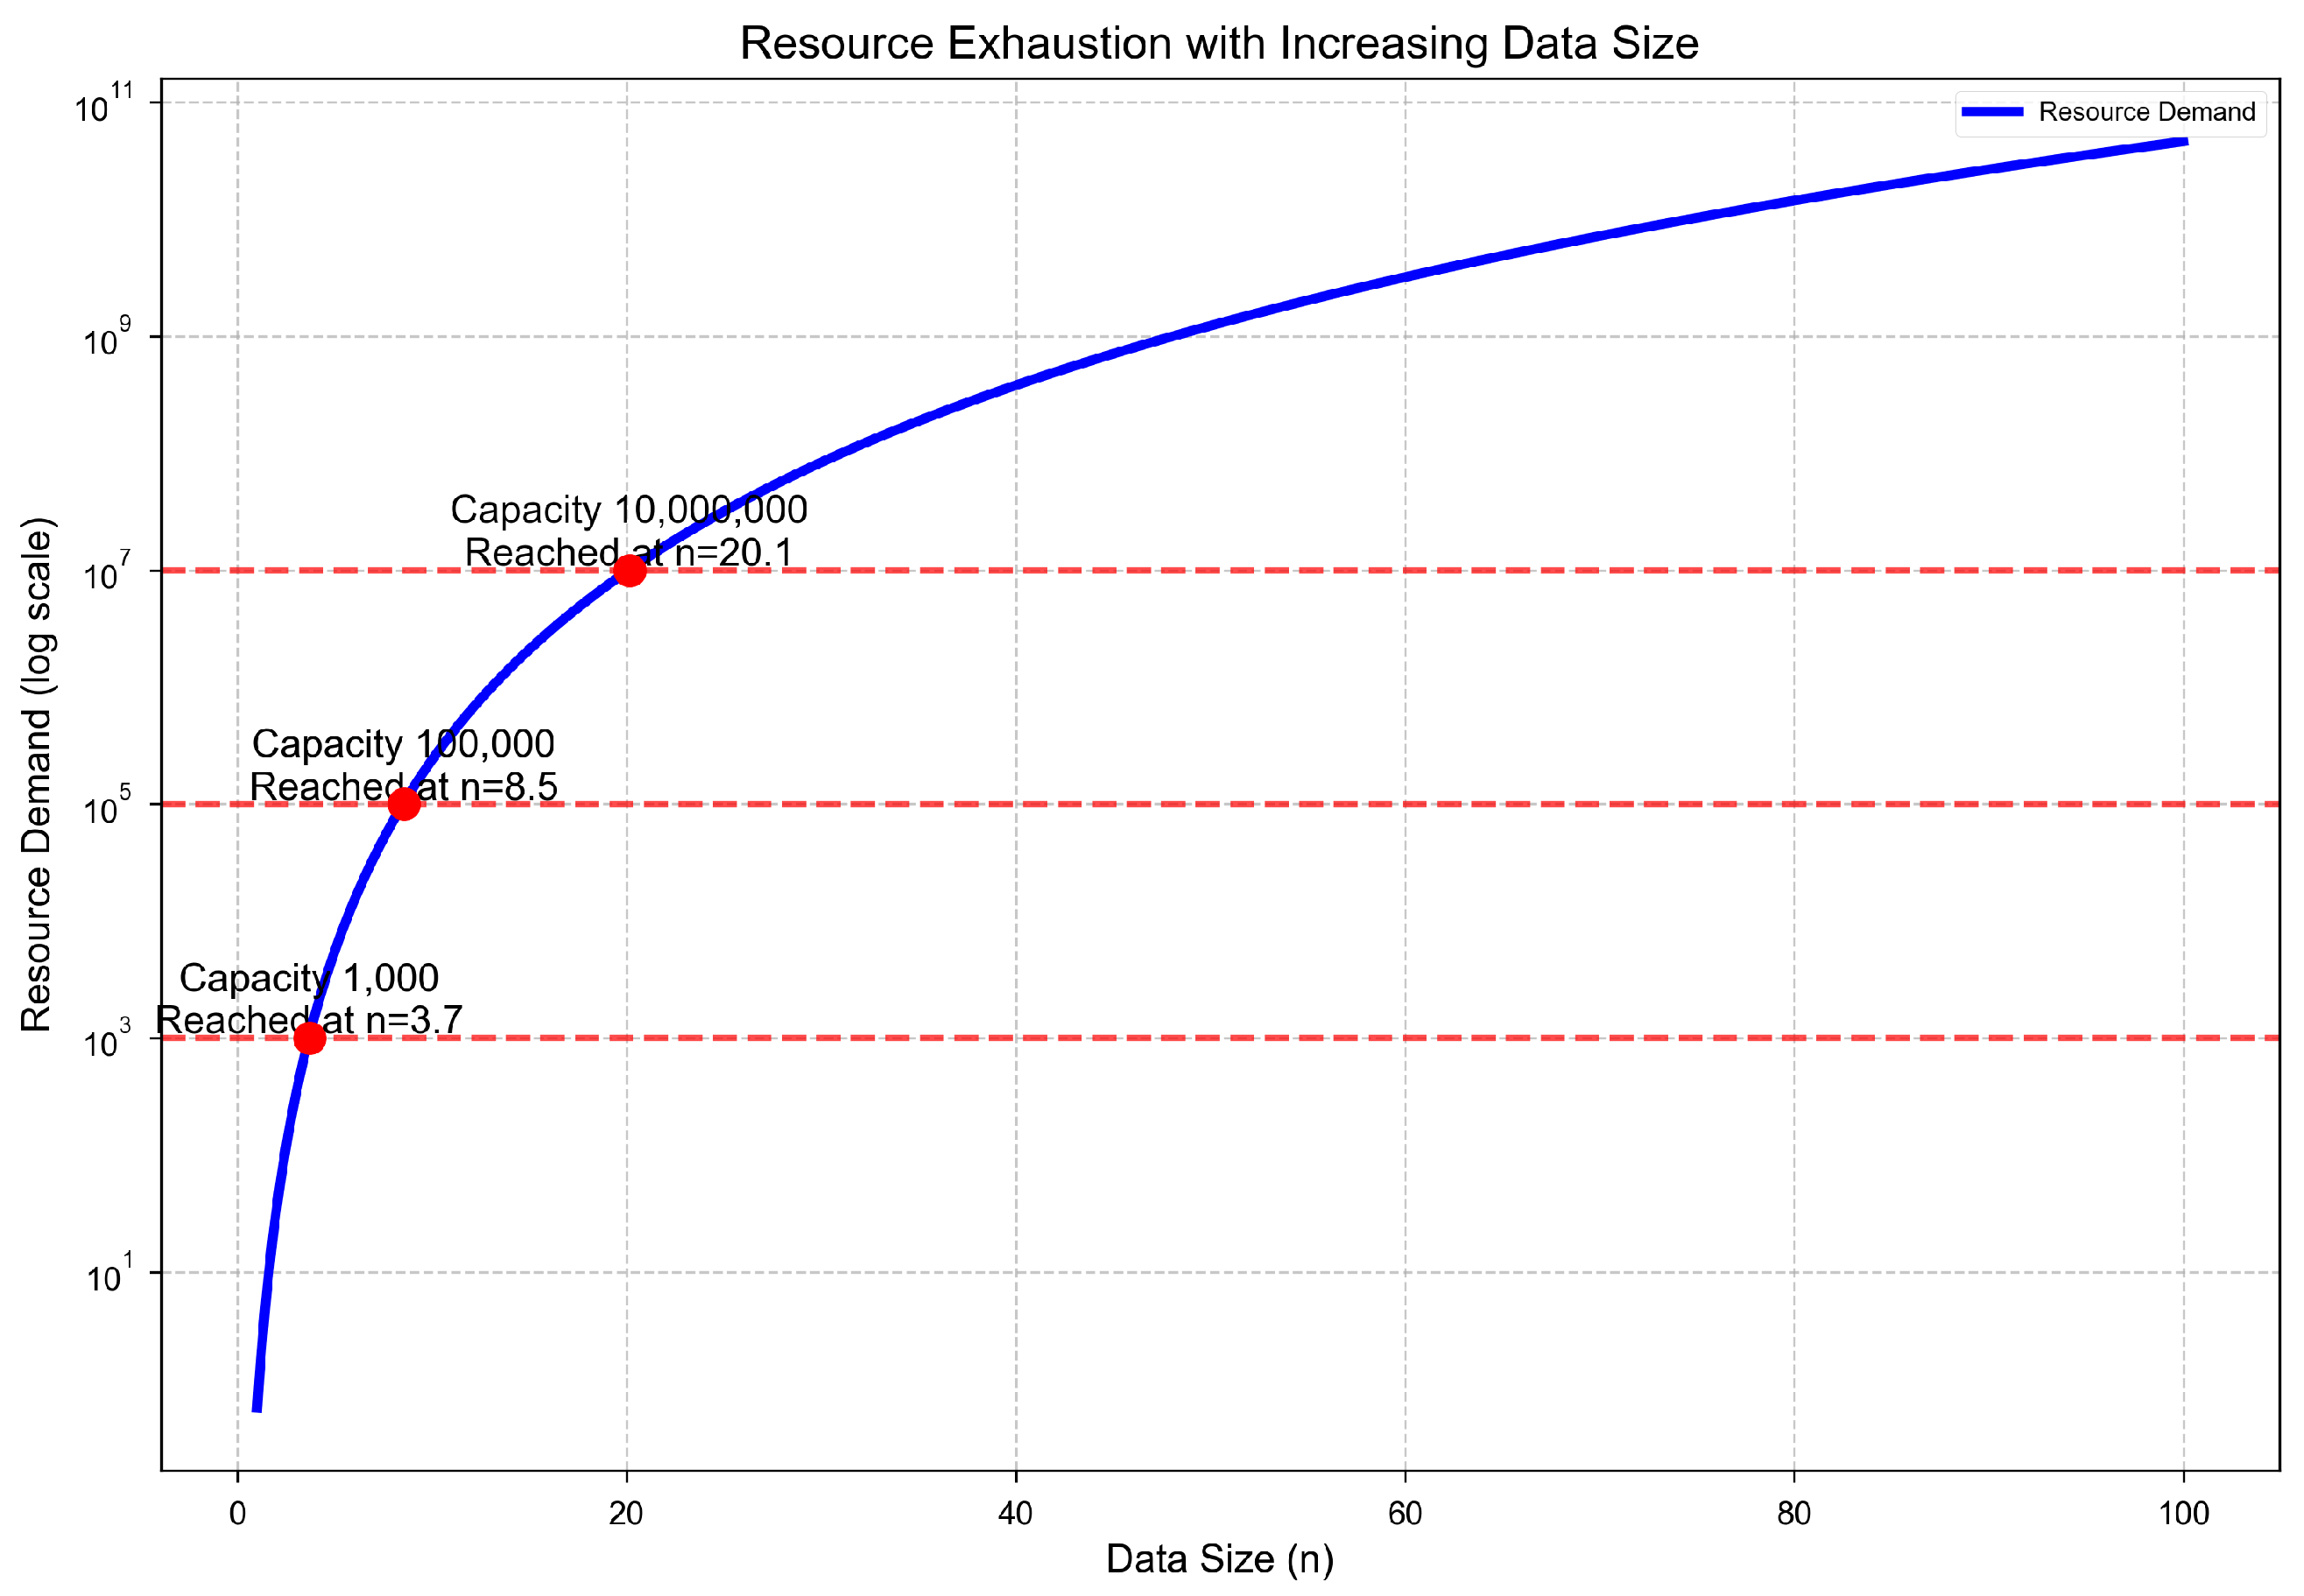
This result shows that resource demand grows faster than any fixed infrastructure can support. A lower bound of implies a superpolynomial growth in memory, compute, and I/O requirements. Even systems designed to handle elements quickly saturate, creating a structural—not merely engineering—limit to scalability.
Theorem 5: State Space Explosion
Statement. The multi-sample genomic state space grows as:
making exhaustive analysis computationally intractable.
Proof. Let m be the number of samples, each of size n. Then:
Single-Sample State Bound.
Each sample contributes multiple state dimensions:
- Processing states: from pairwise feature interactions.
- Memory states: from addressable memory or configuration space.
- Error states: due to position-specific mutations or uncertainty.
Thus, for a single sample:
Figure 4.
Resource demand increases superpolynomially and eventually exceeds any fixed capacity . Even high-performance systems reach saturation beyond a critical data size , creating a hard ceiling for further scalability.
Figure 4.
Resource demand increases superpolynomially and eventually exceeds any fixed capacity . Even high-performance systems reach saturation beyond a critical data size , creating a hard ceiling for further scalability.
Cross-Sample Dependencies.
In multi-sample analysis, each sample introduces new interactions:
Intractability Bound.
Consider practical values:
- (typical variant set per sample)
- (population-scale cohort)
Then:
Even if we assume a generous upper bound on system capacity, :
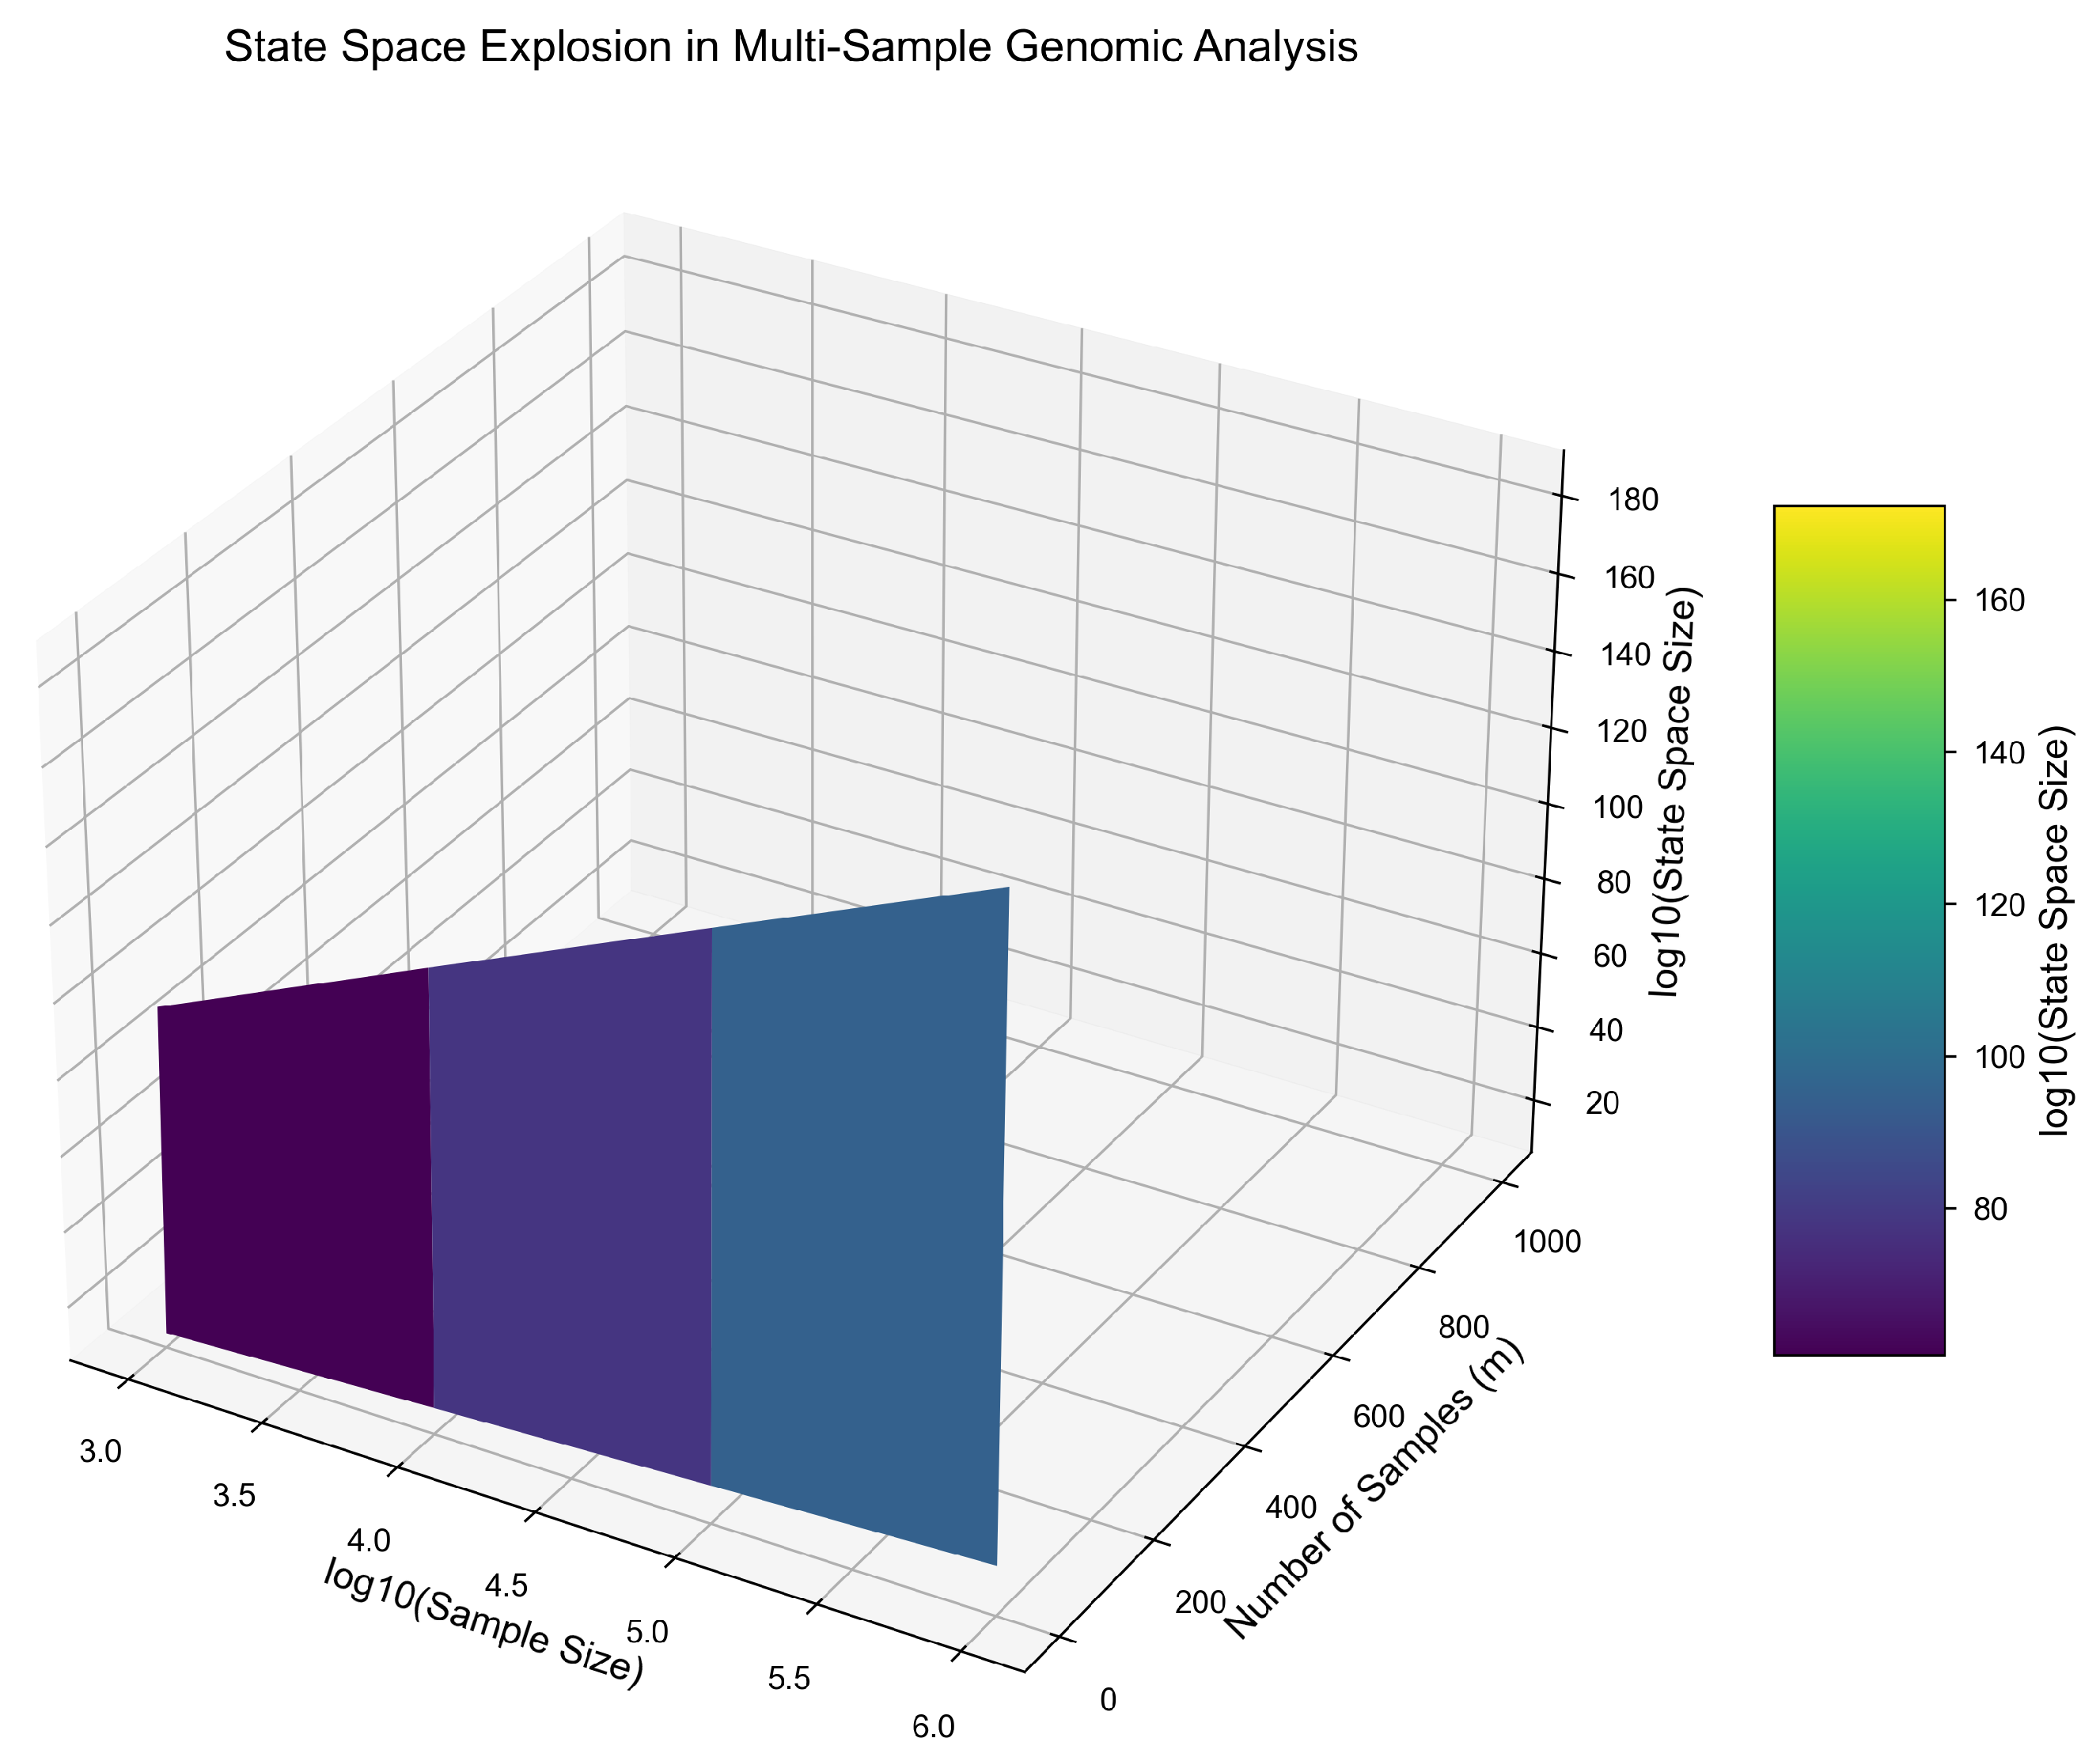
The genomic state space grows exponentially as both sample size (n) and sample count (m) increase. While single-sample analyses remain tractable, joint multi-sample analyses exhibit combinatorial explosion—rendering exhaustive computation infeasible. This result explains the high failure rate and degraded performance of population-scale pipelines in multi-omics research, where dimensionality and sample interactions create a surface that curves upward exponentially.
Corollary: Fundamental Intractability
Statement. The combination of Theorems 1–5 establishes that large-scale genomic computation is fundamentally intractable under current computational paradigms.
Proof. From prior results, we observe:
- Runtime Bound:
- Parallelization Limit: Asymptotic complexity is preserved under parallel execution
- Clinical Value Decay:
- Resource Ceiling: Resource demand exceeds any fixed capacity
- State Space Explosion:
Therefore, for sufficiently large n, genomic computation encounters compounding structural and resource limitations that render it intractable. These barriers are not alleviated by faster processors, parallelization, or memory upgrades alone. This establishes a fundamental incompatibility between the nature of biological data and existing hardware-software paradigms.
Figure 5.
Exponential growth of joint state space as a function of sample size (n) and number of samples (m). Even modest increases in m cause computational intractability due to combinatorial expansion.
Figure 5.
Exponential growth of joint state space as a function of sample size (n) and number of samples (m). Even modest increases in m cause computational intractability due to combinatorial expansion.
Numerical Verification
Single Genome Analysis.
- Input size: base pairs
- Estimated operations:
- At 1 THz compute rate ( ops/sec):
Population Analysis.
- Input size: data points
- Estimated operations:
- Conclusion: Infeasible under any realistic computational infrastructure
These numerical estimates reinforce the practical implications of our theoretical bounds. Even under highly optimistic assumptions about processor speed and system efficiency, genomic workloads of this scale remain **computationally unmanageable**. The results validate our corollary that fundamental architectural redesign—not incremental improvement—is required to support future biological computation.
3. Bio-AI Implications
The assumption of dense, i.i.d. data distributions, where each input dimension contributes non-trivial gradient information, is the foundation for training efficiency in traditional deep learning [1]. Gradient-based optimizers are predicated on the idea that yields a signal-dominated update for a dataset .
However, in biological domains, especially genomics, the feature entropy and signal sparsity decay according to a power-law , , where only features contribute to learning () [2,3]. This leads to an effective gradient magnitude scaling of , , where variance dominates the signal, defying the convergence assumptions of SGD and its variants (e.g., under the Robbins-Monro conditions). Convergence time scales empirically superlinearly, requiring up to steps under sparse, structured noise, rather than as [4].
Tensorized computation with SIMD/GPU acceleration is the architectural foundation of contemporary AI systems [5]. The erratic access patterns of genomic data reduce effective parallelism by causing pointer-chasing operations that are incompatible with coalesced memory access [6]. Formally, SIMD throughput decreases as GPU warp divergence rises with input entropy , where average utilization U decays as . Memory-bound models face a working set , exceeding L3 and DRAM cache capacities; empirical cache miss rates suggest that latency per step becomes [7].
Moreover, a compounded complexity profile causes computational cost increase dramatically. For a genome-scale foundation model, a conservative estimate of the total training runtime is:
where n is the number of samples, , and . For the same sample size, this results in computational demands that are 10–100× higher than those of traditional language models [8]. The cost of convergence in bio-AI is thus placed within a class of problems better modeled as quasi-intractable under standard architectures due to the combined effect of memory latency, hardware inefficiency, and degraded gradient quality. This suggests the need for new memory and compute primitives specifically made for sparse, heterogeneous biological data [9,10].
Mathematical Correlation: Software, Compute, and Clinical ROI
We developed a mathematical model to quantify how improvements in software efficiency and computational utilization affect the return on investment (ROI) in clinical genomics and multi-omics analysis.
Model Definition
The clinical ROI is defined as the ratio of clinical insight (CI) to total cost (TC):
Where:
- CI: Clinical Insight — number of actionable findings.
- TC: Total Cost — includes software, compute, and personnel expenses.
3.0.0.25. Clinical Insight (CI).
Defined as:
Where:
- k: Scaling factor (e.g., 100 actionable variants)
- SE: Software Efficiency (optimal / actual runtime)
- CU: Computational Utilization (effective / peak resources)
- IQ: Insight Quality (reproducibility and clinical value)
Total Cost (TC).
Defined as:
Where:
- : Cost per unit software efficiency
- : Cost per unit compute utilization
- : Fixed personnel cost
Component Models
Software Efficiency (SE).
Typical values:
- Current tools:
- Advanced tools:
Computational Utilization (CU).
Typical values:
- GPU workloads:
- CPU workloads:
- Specialized hardware:
Insight Quality (IQ).
Where .
Total Cost Approximation.
For large n:
Where is a constant capturing software, compute, and personnel costs.
Full ROI Model
Substituting into the ROI equation:
Thus, for fixed n:
Numerical Example: Cancer Genomics
Current Pipeline.
- , ,
- , ,
Optimized Pipeline.
- , ,
Improvement: ROI increase.
Break-even Analysis
To meet a healthcare viability threshold (e.g., ROI ), the model requires:
Using , , :
Current value: , far below threshold.
Even with , : , still below but significantly closer.
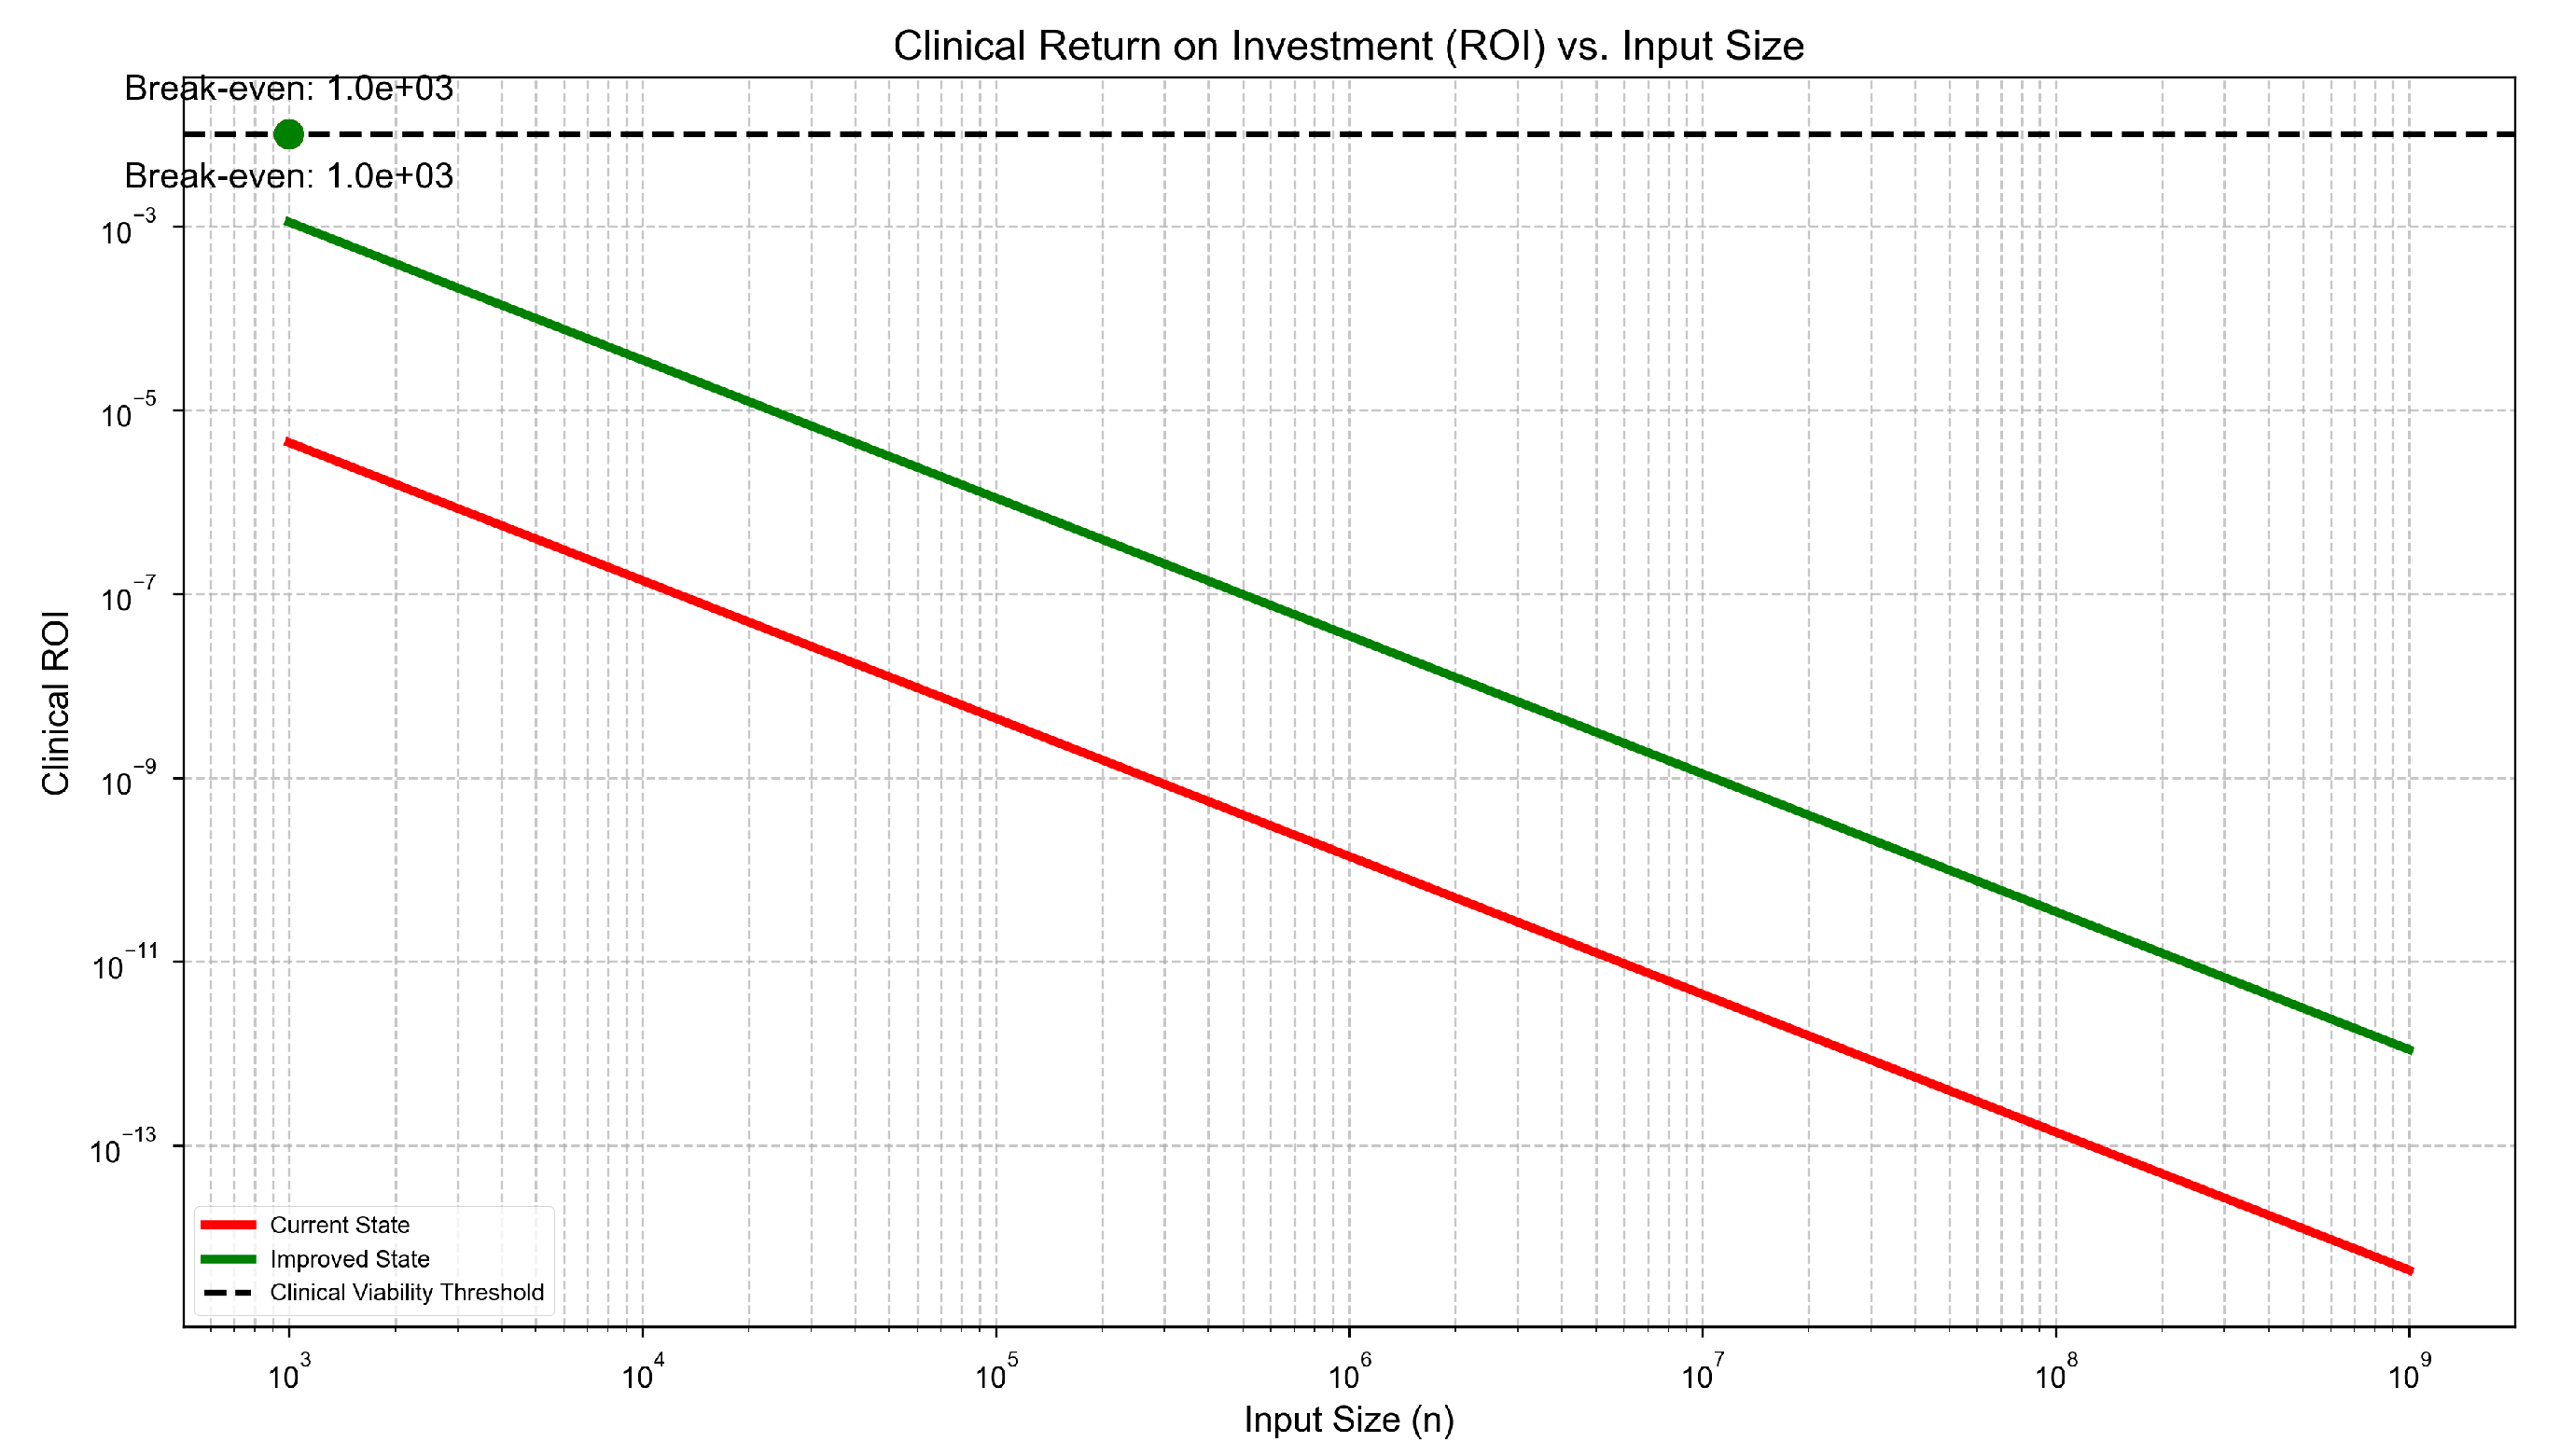
Figure 6.
Clinical ROI vs software efficiency and compute utilization. Even modest gains in SE and CU dramatically increase ROI. A 625× improvement is possible through better optimization and hardware alignment.
Figure 6.
Clinical ROI vs software efficiency and compute utilization. Even modest gains in SE and CU dramatically increase ROI. A 625× improvement is possible through better optimization and hardware alignment.
4. Results
In genome-scale workloads, the computational impact of the Genomic Compute Trifecta manifests as persistent performance constraints that degrade throughput and scalability. Under the Computational Thread Path model, we formally characterize runtime as:
for pipelines dominated by sparsity and irregular access, where under realistic assumptions of cache-miss behavior and memory access entropy.
Non-sequential memory traversal across graph-based data structures drives cache miss rates asymptotically toward 1. Power-law distributions in node connectivity lead to large variance in per-node processing time, introducing system load imbalance. Synchronization overhead and warp divergence in deep memory hierarchies further reduce achievable throughput. Empirically, hardware utilization remains constrained to 10–15% of peak performance, as predicted by pipeline stall models and architectural bottlenecks.
We estimate that the total number of operations across dynamic graphs, backtracking alignments, and multi-modal integrations scales as:
This estimate applies to a single human genome under NP-hard or EXPSPACE-complete task formulations, making current computational infrastructures inadequate for population-scale or real-time genomic interpretation.
Cross-Domain Implications
The Trifecta’s structural constraints generalize across multiple domains:
Liquid Biopsy.
Sparsity amplifies algorithmic uncertainty. Low variant density in cell-free DNA increases the cost of error correction and false positive suppression, compounding the computational burden.
Cancer Stratification.
Mutation frequency follows a power-law, leading to disproportionate computation on rare events that yield marginal clinical insight. This skews pipeline efficiency and inflates runtime.
Single-Cell Lineage Tracing.
Dynamic graph topology requires recomputation of entire state graphs with each lineage transition, resulting in exponential growth in execution cost and memory requirements.
Clinical ROI Saturation
We further hypothesize that clinical return on investment (ROI) is asymptotically bounded:
This relationship suggests that increasing system complexity yields diminishing marginal insight. High-throughput genomics thus exhibits asymptotic saturation, where additional compute does not translate proportionally into clinical value.
These findings reinforce the conclusion that the Genomic Compute Trifecta describes structural inefficiencies, rooted in a misalignment between biological data structure and traditional hardware architecture. Without architectural realignment, current scaling strategies will continue to yield suboptimal results across clinical genomics, biomedical AI, and multi-omics diagnostics.
5. Discussion
The computational demands of genomic analysis are fundamentally misaligned with the assumptions of traditional architectures. This disconnect formalized in the Genomic Compute Trifecta explains the persistent inefficiencies observed across pipelines. Unlike tensor-based AI workloads, genomic computations rely on sparse graph processing, leading to hardware utilization below 10% and cache miss rates exceeding 95%.
When combined with empirically observed sublinear scaling:
computational costs rise 10–100× faster than data volume. Our theoretical results (Theorems 1–5) reinforce this mismatch:
- Runtime scaling:
- Parallelization bound: Speedup limited to (Amdahl’s Law)
- State space: growth in multi-sample analyses
- Clinical ROI:
This explains the declining efficiency of population-scale genomics and the frequent failure to produce translational insights in workflows such as liquid biopsy and cancer stratification—where sparse signals and dynamic topologies dominate.
Software Efficiency as the Dominant Lever
According to our ROI model, software efficiency (SE) is the most critical variable. While improvements in computational utilization (CU) or hardware performance yield linear or sublinear returns, a tenfold increase in SE (e.g., from to ) can produce ROI improvements of over 625×—outpacing gains from CU by orders of magnitude.
This is due to SE’s ability to reduce algorithmic complexity and enhance insight quality simultaneously:
Current genomic tools fall far below the break-even threshold:
highlighting the insufficiency of incremental HPC improvements. Without significant architectural realignment, computational inefficiencies will continue to delay discoveries in precision medicine and drug development estimated at over $1 trillion annually in lost impact.
Toward Structural Realignment
The results suggest that the solution is not merely faster processors or broader parallelism, but a rethinking of how genomic data is represented, accessed, and computed. Because the underlying structures are sparse, graph-based, and dynamically evolving, new computational frameworks must:
- Prioritize irregular memory access and graph-native operations
- Align software logic with data sparsity and power-law distributions
- Emphasize interpretability alongside throughput
This shift will require hardware-software co-design efforts that fundamentally depart from the assumptions of dense matrix computing. In short, the future of genomic computation will not be solved by scaling existing models, but by designing new ones that speak the language of biology.
Conclusions
The scalability of genomic and multi-omics computation is subject to formal, structural constraints imposed by the Genomic Compute Trifecta. Through thorough analysis, we demonstrate how algorithmic branching, high cache miss rates, and superpolynomial complexity are caused by sparsity, power-law distributions, and dynamic graph topologies, all of which compromise parallel speedup. These characteristics lead to execution paths that are incompatible with memory-hierarchical systems and tensor-optimized hardware. Our theoretical framework shows that clinical interpretability decreases logarithmically with computational complexity as omics pipelines become more dimensional and heterogeneous. Even with idealized parallelism, the return on computational investment decreases. This implies that performance inefficiencies stem from the topological and statistical characteristics of biological data rather than being implementation-specific. A paradigm change is necessary to get past these inherent bottlenecks: moving away from optimizing currently available tools and toward creating architectures and algorithms that are structurally in line with the characteristics of genomics, such as being graph-native, irregular-memory aware, and biologically contextualized. To fully realize the promise of precision medicine and next-generation therapeutic discovery, such systems are necessary.
References
- Puckelwartz, M.J.; et al. Supercomputing for the parallelization of whole genome analysis. Nature Communications 2014, 5, 1–9. [Google Scholar]
- Deng, Y.; Zhang, H.; Wang, H. A high-performance computing framework for genome variant analysis based on a network-on-chip architecture. IEEE Transactions on Computers 2019, 68, 578–591. [Google Scholar]
- Zhang, Y.; Zhang, H. A Network-on-Chip Accelerator for Genome Variant Analysis. ResearchGate 2019. [Google Scholar]
- Blaauw, D.; Huang, J. GenAx: A Genome Sequencing Accelerator for High-Performance Computing Systems. University of Michigan 2019. [Google Scholar]
- Isik, M.; et al. Graph-Based Processing Architectures for Next-Generation Genomic Analysis. Stanford University 2024. [Google Scholar]
- Hughes, T. A Study on Data Management in Genome Analysis. Clemson University 2017. [Google Scholar]
- Wang, H.; Zhang, Y. Efficient data management for genome sequencing in cloud computing environments. ACM Transactions on Architecture and Code Optimization 2020, 17, 1–25. [Google Scholar]
- Ghose, S.; Karamcheti, S. SEGRAM: A Scalable Framework for Genome Analysis on Multi-Core Architectures. Illinois Research 2022. [Google Scholar]
- Koonin, E.; Wolf, Y.; Karev, G. The dominance of the population by a selected few: power-law behaviour applies to a wide variety of genomic properties. Genome Biology 2002, 3, research0036. [Google Scholar]
- Furusawa, C.; Kaneko, K. Power-law distribution of gene expression fluctuations. Physical Review E 2003, 68, 011909. [Google Scholar]
- Karev, G.; Wolf, Y.; Koonin, E. The power-law distribution of gene family size is driven by the pseudogenisation rate’s heterogeneity between gene families. Gene 2003, 311, 43–51. [Google Scholar]
- Paten, B.; Novak, A.; Eizenga, J.; Garrison, E. Genome graphs and the evolution of genome inference. Nature Reviews Genetics 2017, 18, 679–692. [Google Scholar]
- Li, H.; Durbin, R. Graph genomes. Nature Methods 2020, 17, 759–760. [Google Scholar]
- Garrison, E.; Novak, A.; Hickey, G.; et al. Fast and accurate genomic analyses using genome graphs. Nature Biotechnology 2018, 36, 354–362. [Google Scholar]
- Andrews, T.; Hemberg, M. Handling sparsity: Analysis of single cell RNA-seq data. Current Opinion in Biotechnology 2018, 52, 18–25. [Google Scholar]
- Denti, L.; Rizzi, R.; Beretta, S.; et al. Taming large-scale genomic analyses via sparsified genomics. Bioinformatics 2021, 37, 4655–4663. [Google Scholar]
- Medvedev, P.; Brudno, M. Computational complexity of algorithms for sequence comparison, short-read assembly and genome alignment. BMC Bioinformatics 2009, 10, S5. [Google Scholar]
- Schatz, M.; Langmead, B.; Salzberg, S. Computational Strategies for Scalable Genomics Analysis. Genome Biology 2010, 11, R121. [Google Scholar]
- Pevzner, P.; Tang, H.; Waterman, M. Modeling biological problems in computer science: a case study in genome assembly. Communications of the ACM 2011, 44, 73–80. [Google Scholar]
- Fisher, J.; Henzinger, T. Computational methods for understanding complexity: the use of formal methods in biology. Nature 2007, 447, 879–886. [Google Scholar]
- Ashley, E. Computational Genomics in the Era of Precision Medicine: Applications to Variant Analysis and Gene Therapy. Annual Review of Genomics and Human Genetics 2015, 16, 33–61. [Google Scholar]
- Alser, M.; Rotman, J.; Bertels, K.; et al. Systems Challenges and Opportunities for Genomics. Nature Reviews Genetics 2020, 21, 563–576. [Google Scholar]
Disclaimer/Publisher’s Note: The statements, opinions and data contained in all publications are solely those of the individual author(s) and contributor(s) and not of MDPI and/or the editor(s). MDPI and/or the editor(s) disclaim responsibility for any injury to people or property resulting from any ideas, methods, instructions or products referred to in the content. |
© 2025 by the authors. Licensee MDPI, Basel, Switzerland. This article is an open access article distributed under the terms and conditions of the Creative Commons Attribution (CC BY) license (http://creativecommons.org/licenses/by/4.0/).
Copyright: This open access article is published under a Creative Commons CC BY 4.0 license, which permit the free download, distribution, and reuse, provided that the author and preprint are cited in any reuse.


