Submitted:
02 July 2025
Posted:
03 July 2025
You are already at the latest version
Abstract
Machine learning and artificial intelligence (AI) are becoming more common in our daily lives. This is changing how we use technology. Chatbots, which are talking tools driven by AI that make it easier for people to use digital services, are one of the most common examples. A technique called Partial Least Squares Structural Equation Modeling (PLS-SEM) is used in this study to look into how people use robots in their daily lives.416 people filled out a poll with 52 questions to learn more about important things like how useful people think robots are, how easy they are to use, social impact, trust, and their plans to use them. Ethical standards are followed in the study by getting full permission, keeping participants' privacy, and including a range of opinions. The results give developers useful information about what makes people want to use chatbots, which helps them make better robot systems that are easier for people to use. The study also talks about possible benefits for society, like making it easier to use technology and conserving resources. UTAUT (Unified Theory of Acceptance and Use of Technology) and DOI (Diffusion of Innovation) were used as guides for the study. The paper says that more study could be done on chatbots' effects on people of different ages, countries, and businesses, as well as on their long-term effects. To keep the study useful, it stresses careful recording, teamwork, and sharing of information.
Keywords:
Chatbot
; Diffusion of Innovation (DOI)
; Unified Theory of Acceptance and Use of Technology (UTAUT)
; PLS
Introduction
The acceptance of chatbot in daily life has received significant pace worldwide, changing various sectors such as education, healthcare, and customer service. In Bangladesh, the present environment shows a growing interest in AI technologies, with robots appearing as tools for improving conversation and service delivery. These intelligent systems can improve daily lives by providing personalized help, easing learning, and boosting mental well-being through user-friendly exchanges. The goals of this study include understanding the factors affecting robot usage, measuring their effect on user interaction, and exploring their potential to improve daily life situations.
Chatbots are changing businesses by offering scalable, cost-effective options for customer service and teaching. They improve user involvement through personalized exchanges, improving accessibility to information and services (Karyotaki et al., 2024). The economic and social effect of robots is predicted to rise, especially among vulnerable groups, by promoting lifelong learning and decision-making (Karyotaki et al., 2024).
The merger of robots in Bangladesh is still in its nascent stages, with growing attention from companies and educational institutions. Initiatives are being taken to leverage robots for better service delivery in areas like healthcare and education, meeting local needs (Hasan et al., 2023).
Chatbots can help in handling daily chores, giving notes, and offering mental health support through unique suggestions (Sharma, 2024). They support learning by serving as virtual teachers, improving educational experiences through direct engagement (Karyotaki et al., 2022).
To evaluate user views and acceptance of robots in different settings, especially in education (Hasan et al., 2023). To find key factors affecting chatbot usage, including user confidence and perceived ease of use (Hasan et al., 2023). While the benefits of chatbot acceptance are obvious, challenges such as user pain and social considerations must be handled to ensure their effective integration into daily life.
Background
The Unified Theory of Acceptance and Use of Technology (UTAUT) is a widely used model to study why people accept new technologies. It has been applied in many areas, such as businesses, schooling, and customer behavior.
(Ahmad et al., 2013) used UTAUT to understand IT usage in businesses, especially with ITIL projects. Their work showed that UTAUT is helpful for understanding why some technology projects succeed or fail. In customer research, Teo et al. (2015) added trust and cost to UTAUT to study mobile transfers. They found that value, ease of use, help, and trust were key to accept-ance. Similarly, (Bhatiasevi., 2016) used the model to study mobile banking in Thailand. He added factors like trustworthiness and ease and showed that value and efficiency meant most to users. At the business level, Carcary et al. (2018) used UTAUT to review IoT usage. Their results showed that the model fits well with complicated technologies like IoT—similar to how robots are being used in daily life. (Rahman et al., 2018) studied mobile internet use among low-income users and stressed the value of local setting. (Queiroz & Wamba., 2019) studied blockchain in supply chains and found UTAUT helpful in finding both the motivators and hurdles to uptake. In e-Government, (Sabani., 2021) added openness to the plan and found it important for user trust. (Kumar et al., 2020) improved UTAUT by including gender and age as key factors in technology use. More recent studies like (Sujati et al., 2023) used UTAUT to study mobile app use in the mining industry during tough times, like pandemics. (Yuan et al., 2023) looked at teachers using education software and found that having the right tools and assistance was most important.
Overall, these works show that UTAUT is a strong and flexible model. Its main ideas—like value, ease of use, social impact, and support—are important in many areas. The model can also be expanded by adding things like trust or age. Because of this freedom, UTAUT is a good fit for studying how people use robots in daily life.
Researchers have widely studied how people accept and use new technologies, focusing on what drives users’ goals and actions. Many of these studies use PLS-SEM (Partial Least Squares Structural Equation Modeling), especially with SmartPLS software, to explore complex relationships between factors.
For example, (Aman et al., 2019) used Smart PLS-SEM to study how traditional and religious views effect opinions toward sustainable tourism. (Sciarelli et al., 2022) also used PLS-SEM to improve the Technology Acceptance Model (TAM) by adding new factors like cost, effectiveness, and security in small Italian companies. Classic models like TAM and DOI (Diffusion of Innovation) continue to drive study in this area. (Billanes et al., 2021) discussed how TAM has been used to study energy technology. (Zakariyah et al., 2023) applied the DOI model to look at how Malaysian waqf institutions are adopting fintech, showing that knowledge and relative benefit are key factors. (Rahman et al., 2018) studied mobile internet use among low-income groups and found that local environment and economic factors greatly affect acceptance. This shows how personal and group forces can shape technology use. Some experts have mixed different ideas to better understand adoption. (Rahi et al., 2024) combined three models—Protection Motivation Theory, DOI, and Task-Technology Fit (TTF)—to study how people started using e-wallets during the COVID-19 pandemic. Their results show that mixing models can give greater insights into user behavior.
In summary, using PLS-SEM helps academics study a wide range of factors that impact technology usage. Studies show that mixing strong theory models like DOI and TAM with real-world data offers a solid basis for understanding how people start using new technologies—such as chatbots—in their daily lives.
Hypotheses and Model Development
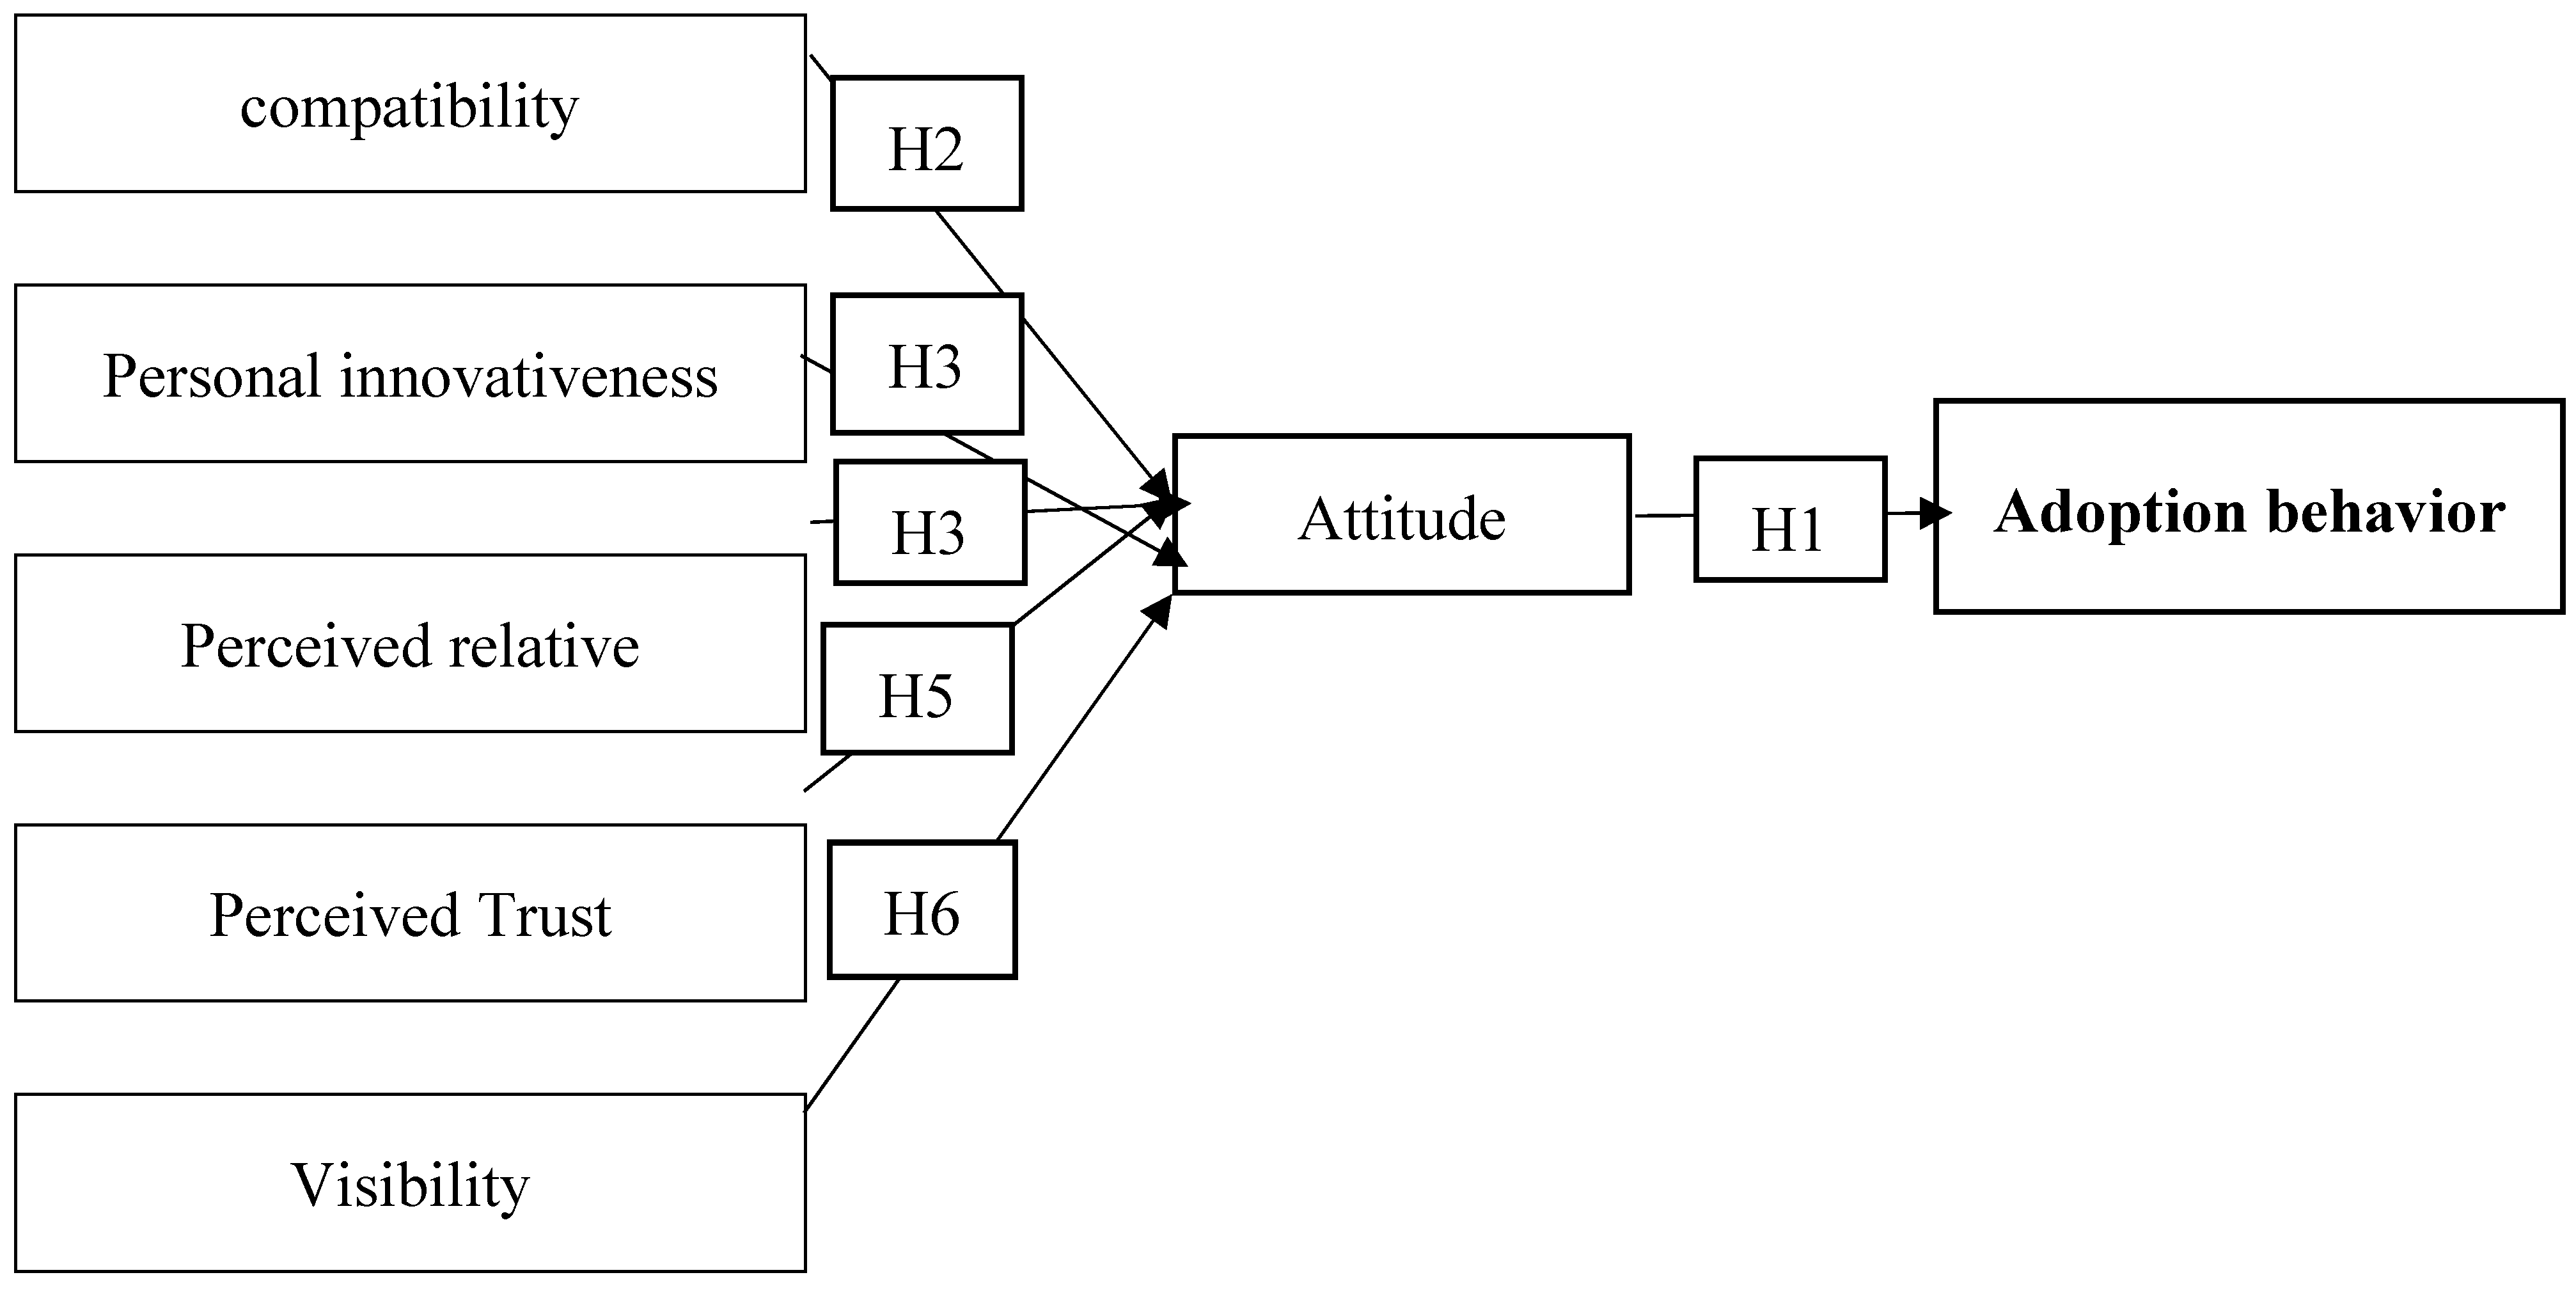
H1: Attitude has a positive impact on the intention to adopt chatbots in day-to-day life.
Attitude is how someone feels about doing something, whether they like it or not (Ajzen, 1991). When it comes to adopting new technologies, having a positive view of them makes it more likely that they will be used. Studies from the past have shown that mood has a big impact on action purpose (Venkatesh et al., 2003). People are more likely to use robots if they think they are useful, easy to use, or helpful in their daily lives.
H2: Compatibility has a positive impact on attitude toward adopting chatbots in day-to-day life.
Rogers (2003) says that compatibility is how well a new idea fits with the beliefs, experiences, and wants of a possible user. People are more likely to use a new technology if it fits in well with their habits and way of life. Compatibility has a big effect on how people feel about mobile and internet-based devices, according to several studies (Moore & Benbasat, 1991; Wang et al., 2009).
H3: Personal innovativeness has a positive impact on attitude toward adopting chatbots in ay-to-day life.
Personal innovativeness is described as the desire of a person to try out new technologies (Agarwal & Prasad, 1998). Individuals who are highly creative are more likely to have good feelings about new technologies like robots. This trait affects how users assess and finally accept new services.
H4: Perceived relative advantage has a positive impact on attitude toward adopting chatbots in day-to-day life.
Perceived relative advantage refers to the degree to which a person thinks that using a particular idea is better than its predecessor or options (Rogers, 2003). When users view chatbots as having better ease, accessibility, or efficiency compared to traditional means (e.g., human agents or apps), their attitude toward chatbot acceptance becomes more favorable (Venkatesh et al., 2012).
H5: Perceived trust has a positive impact on attitude toward adopting chatbots in day-to-day life. Trust plays a crucial role in forming views, especially toward technologies involving robotics and artificial intelligence. Perceived faith in chatbots — regarding their dependability, privacy, and decision-making — can greatly affect users' confidence and favorability toward using them (Gefen et al., 2003; McKnight et al., 2002).
H6: Visibility has a positive impact on attitude toward adopting chatbots in day-to-day life. Visibility refers to the degree to which the use of an idea is obvious to others (Moore & Benbasat, 1991). The more obvious a technology is in a user’s social group, the more likely it is that the user forms a good attitude toward it due to social proof or impact. In the case of chatbots, if people notice friends or the general public using chatbots frequently, their view and mood may improve.
Methodology
The factors used in this study were taken from previously tested tools. Specifically, the categories and number of items included were: Compatibility (COMP, 3 items), Perceived Relative Advantage (PRA, 5 items), Visibility (VIS, 4 items), Performance Impact (PI, 4 items), Attitude (ATT, 4 items), Perceived Trust (PTR, 4 items), and Adoption Behavior (AB, 3 items). All things were scored using a 7-point Likert scale running from "strongly disagree" to "strongly agree." The things were slightly changed to fit the setting of robot usage in daily life.A pre-test and practice study were performed to ensure the clarity and usefulness of the survey questions. A total of 9 items were chosen for the pre-test and 30 items for the pilot test, featuring a group of 39 people. Their opinions helped improve item language and question flow to enhance general understanding. Based on the pilot test results, the final questionnaire consisted of 27 items across the seven categories stated, and the completed version was distributed during the major data collection process. Data were gathered over a two-month time, from March 23, 2023, to May 27, 2023. A random picking method was applied, selecting students from both bachelor and doctoral levels across different academic institutions. The survey was spread exclusively through online platforms such as Google Forms, utilizing digital contact methods like email and social media (e.g., WhatsApp and Telegram) to reach users. To ensure data quality, original replies were checked for thoroughness and consistency. After removing incorrect or partial entries, the dataset contained only the valid answers used for final analysis. The use of online sharing allowed for a wider geographic reach and ease, though the study admits possible limitations due to self-selection bias and limited participation from non-student groups. Future study may benefit from widening the sample to include working workers or users from different culture and geographic settings.
Result
Partial Least Squares Structural Equation Modeling (PLS-SEM) was applied in this study due to its fit for experimental research and complicated model tests involving multiple latent variables and markers. PLS-SEM is particularly effective for predictive analysis and theory building when the sample size is relatively small and the data does not meet tight normality standards. This method allows simultaneous estimation of both the measurement model (relationships between observed items and their latent constructs) and the structure model (relationships among latent variables). Given the study's focus on understanding the behavioral purpose behind robot uptake and the addition of multiple dimensions, PLS-SEM offered a solid and flexible method to test the suggested hypotheses and measure the model's explanatory power.
Figure 1.
Proposed study model and Hypothesis.
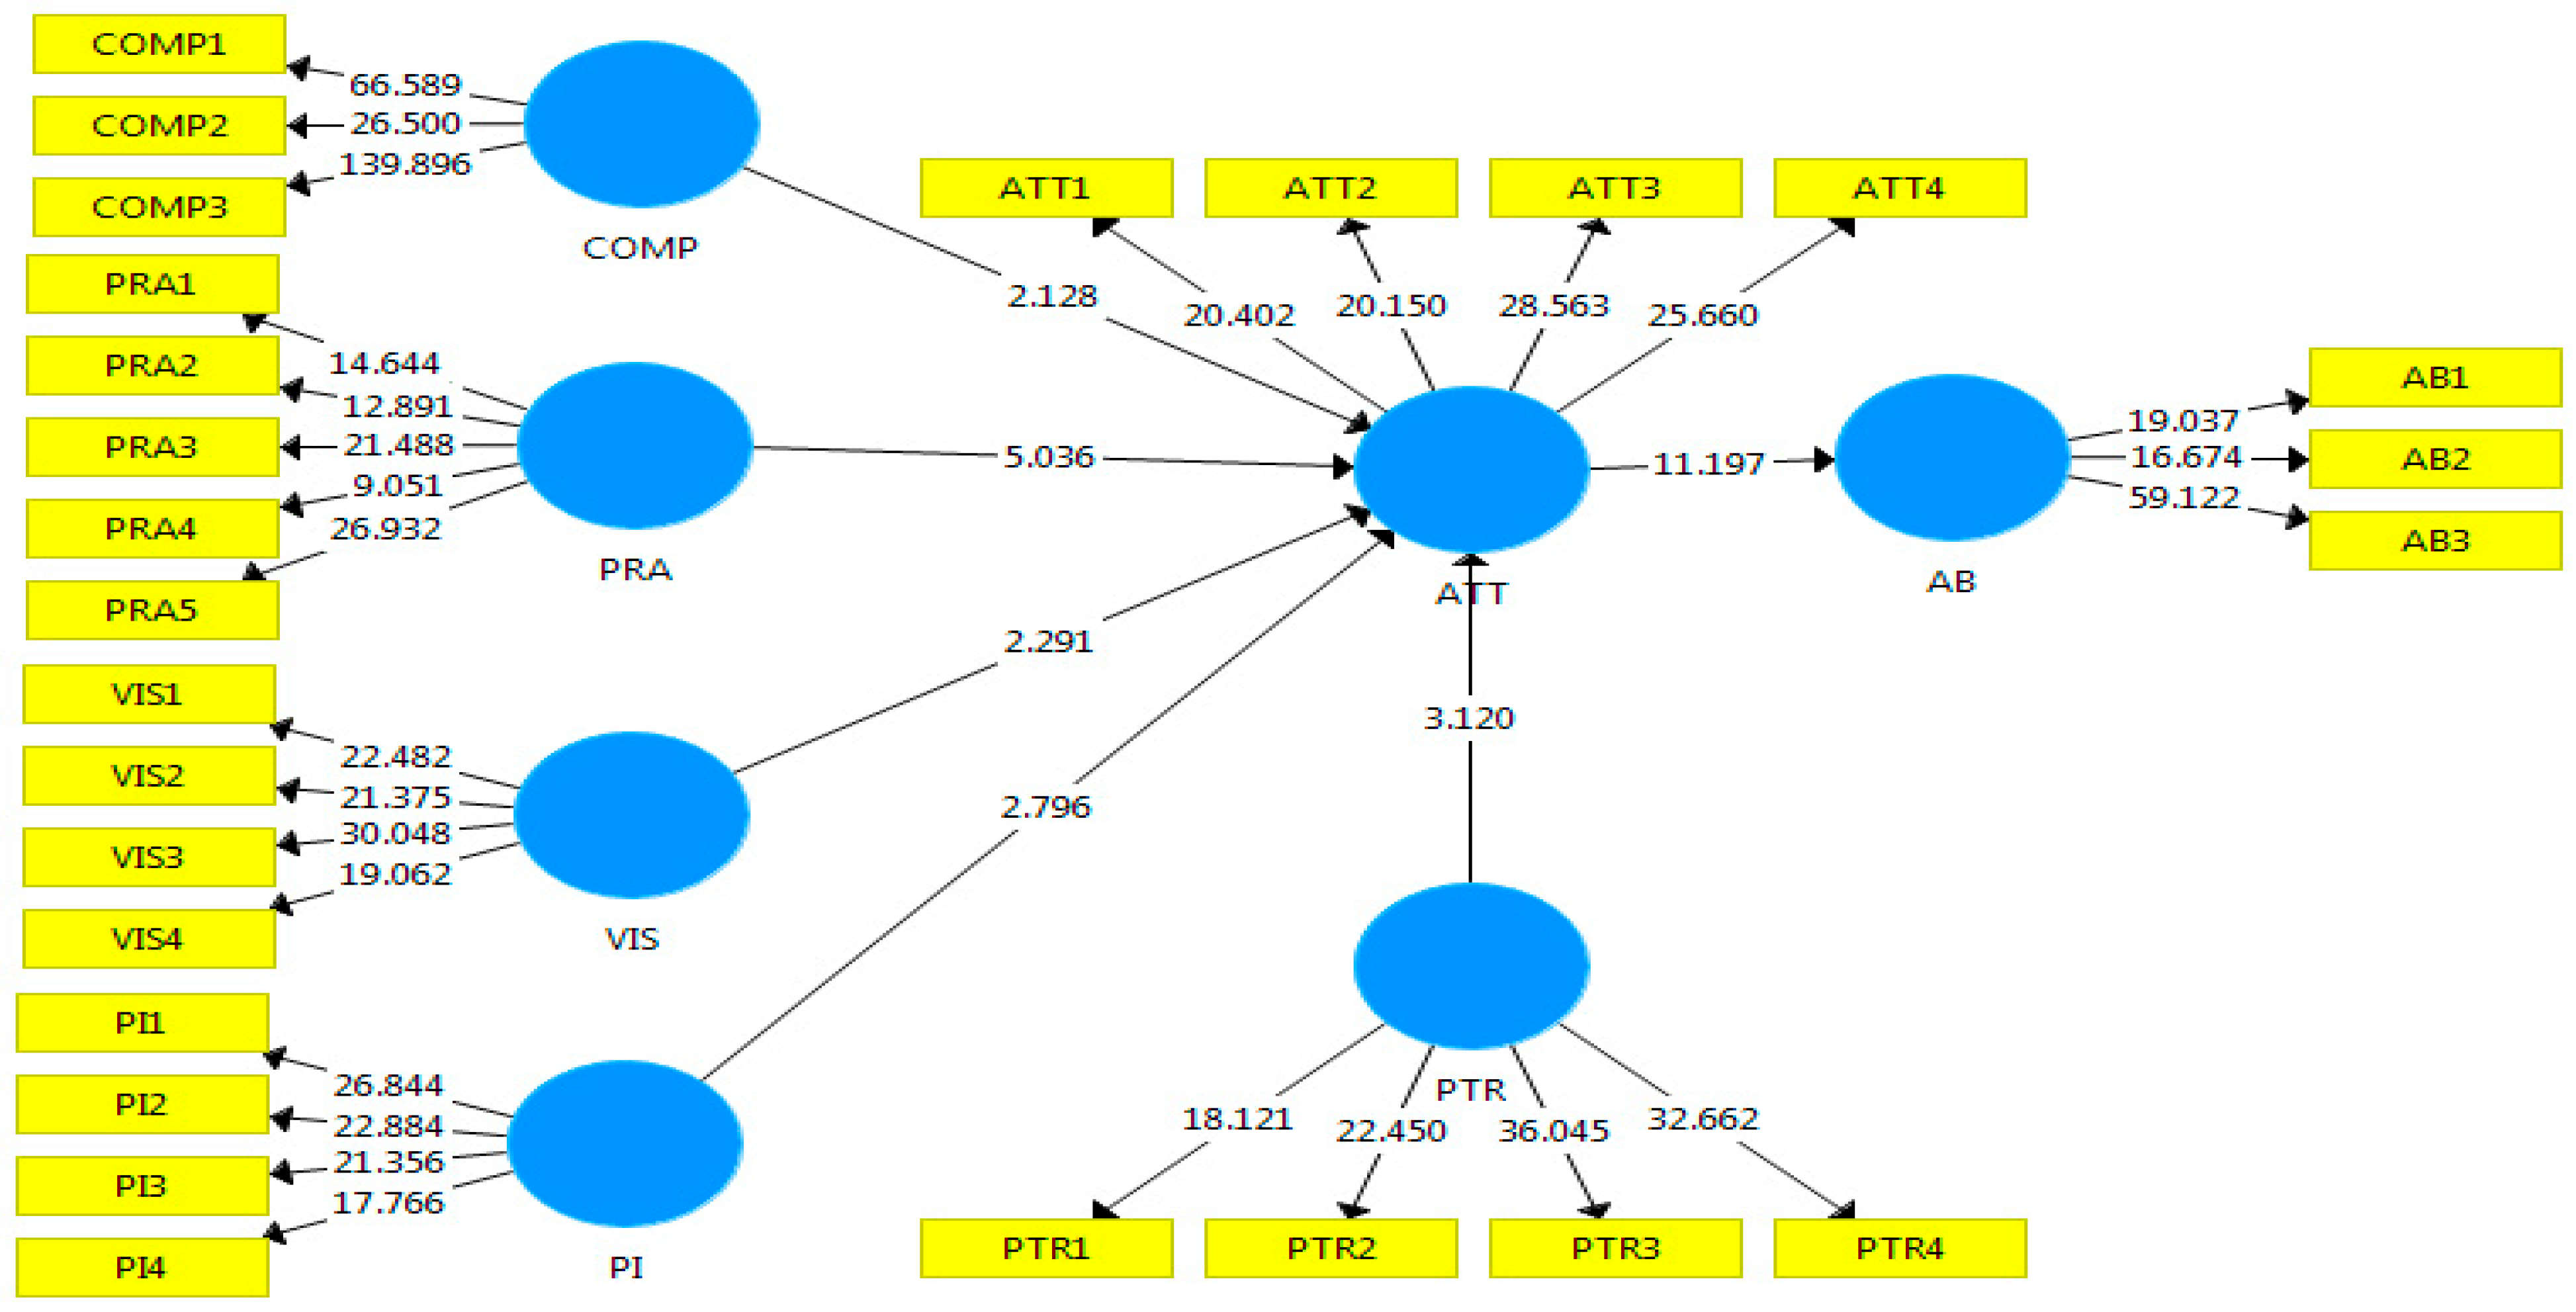
The SmartPLS tool (version 3.3.3) was used to analyze this suggested conceptual model because it is widely used by researchers. The indicator validity, indicator reliability, convergent validity, and internal consistency reliability were tested using the variance inflation factors (VIF), factor loading (FL), average variance extracted (AVE), and composite reliability (CR). The CR, FL, and AVE values of each component must be more than or equal to 0.7, 0.5, and 0.5, respectively, and their VIF values must be less than 5 in order for them to be accepted. Every condition was met, as shown in Table 2. Fornell and Larcker were used to test discriminant validity in line. The highest squared correlation of any variable cannot exceed the AVE of any variable. Table 5 shows that the constructs showed predictive traits. According to Table 4, the coefficient of determination (R2) for AB and ATT were 46.6% and 72.2%. When effects (f2) have values more than or equal to 0.35, 0.15, 0.02, and 0.01, respectively, they are categorized as large, medium, small, and very small effects respectively.6 out of 6 assumptions of the model were significant as per Table 6. Usefulness, happiness, social impact, self-efficacy, and personal innovativeness were the things that affected mood. Moreover, attitude performed as an important indicator of purpose. Therefore, H1, H2, H3, H4, H5 and H6 were approved

Table 1.
Demographic Data.
| Variables | Category | Frequency | Percentage |
| Gender | Male | 215 | 51.93 |
| Female | 199 | 48.07 | |
| Age | 19-25 years | 360 | 86.96 |
| 26-35 years | 33 | 13.04 | |
| Highest Academic Qualification | Undergraduate 1st year | 66 | 15.94 |
| Undergraduate 2nd year | 95 | 22.95 | |
| Undergraduate 3rd year | 78 | 18.84 | |
| Undergraduate 4th year | 141 | 34.06 | |
| Postgraduate 1st year | 19 | 4.59 | |
| Others | 0 | 0.00 | |
| Marital Status | Unmarried | 374 | 90.34 |
| Married | 40 | 09.66 |
Discussion and Analysis
Table 4 shows that the R² value for Attitude (ATT) is 0.728, showing that 72.8% of the variation in attitude can be described by the categories Compatibility (COMP), Personal Innovativeness (PI), Perceived Relative Advantage (PRA), Perceived Trust (PTR), and Visibility (VIS). For Adoption Behavior (AB), the R² is 0.466, showing that 46.6% of the difference in AB is explained by Attitude alone. These numbers show modest to large explanatory power, especially for ATT.
Additionally, Table 5 shows the f² effect sizes. Attitude has a large effect size on AB (f² = 0.871), while PRA (f² = 0.109) shows the most considerable individual impact on ATT. Other variables (COMP = 0.013, PI = 0.033, PTR = 0.043, VIS = 0.027) show small but significant effects.
According to Hypothesis H1, a higher level of attitude leads to greater behavioral desire to adopt robots. The results support this with a strong positive effect (β = 0.682, p < 0.001, f² = 0.871). This result fits with earlier research (Najib & Fahma, 2020; Sayaf et al., 2021), which shows that when people form positive views toward technology, they are more likely to accept it. University students in this study showed a high level of desire to use chatbots, likely due to their experience with digital tools and perceived worth in daily use.
For Hypothesis H2, compatibility positively affects mood (β = 0.066, p < 0.05, f² = 0.013). Although the impact size is small, the relationship is statistically significant, suggesting that when robots are viewed as suitable with users' daily habits and digital tastes, users are more likely to form positive views. This is aligned with previous study (Moore & Benbasat, 1991), showing similarity as a driver in technology acceptance.
Hypothesis H3 examines the role of Personal Innovativeness (PI), which has a significant positive effect on attitude (β = 0.190, p < 0.01, f² = 0.033). This shows that users who see themselves as technologically adventurous are more open to robot adoption, matching results from (Kasilingam., 2020 & Lestari., 2021). Since the majority of responders are university students, it is fair to expect high innovativeness among them, which drives their desire to explore and adopt new technologies like chatbots.
According to Hypothesis H4, observed relative advantage significantly affects mood (β = 0.332, p < 0.001, f² = 0.109). This is the best indicator of mood among the external factors, supporting the idea that users see real benefits in chatbot use, such as ease and time-saving features. This finding fits with Rogers' Diffusion of Innovation Theory, which posits that the bigger the perceived benefit, the faster the uptake.
In Hypothesis H5, perceived trust also has a positive and significant effect on attitude (β = 0.210, p < 0.01, f² = 0.043). Trust in the chatbot’s information correctness, privacy handling, and dependability creates a positive attitude. This result is aligned with previous studies (Gefen et al., 2003), noting the value of trust in digital platforms, especially for apps involving private or individual data.
Hypothesis H6 supports the positive effect of exposure on attitude (β = 0.161, p < 0.05, f² = 0.027). Though the effect size is small, its importance shows that users are affected by the observability of others using robots. When users see peers or leaders accepting chatbots, they are more likely to view the technology positively, keeping with the social exposure concept of the Technology Acceptance Model.
Theoretical and Practical Contribution
This study gives both academic and practical advances to the understanding of robot acceptance in daily life. Theoretically, it extends established models like UTAUT and DOI by combining variables such as mood, perceived happiness, perceived value, self-efficacy, and social impact, offering a more complete framework for studying robot usage. Notably, the negative link between perceived value and attitude questions standard ideas and opens new directions for future study. The use of PLS-SEM also shows a solid method for modeling complex user actions. Practically, the results offer useful insights for developers and decision-makers, stressing the importance of user-friendly, fun, and confidence-building robot designs. Social impact and emotional connection are shown to be key drivers of acceptance, stressing the need for smart marketing and inclusive, ethical chatbot development.
Limitations and Future Works
While this study offers important insights into the factors affecting robot usage using PLS-SEM, it has several drawbacks. First, the data was taken through self-reported polls, which may be subject to answer bias. Second, the sample was limited to a specific demographic group, which may affect the generalizability of the results across countries or age groups. Third, the study focused on a limited set of factors and did not explore other possible influences such as privacy concerns, trust in AI, or robot performance quality. For future research, studies could engage more diverse groups, apply continuous methods to measure changes over time, and explore industry-specific or context-based robot usage. Additionally, combining other theory models or performing informal studies could provide deeper insights into user views and behavioral reasons.
Conclusions
In conclusion, this study studied the key factors influencing the acceptance of robots in daily life using Partial Least Squares Structural Equation Modeling (PLS-SEM). By combining variables from UTAUT and DOI models, the study found that attitude, perceived happiness, self-efficacy, and social influence positively affect the desire to adopt robots, while perceived usefulness showed a surprising negative effect on attitude. These results show the importance of building robots that are not only useful but also interesting and easy to use. The study adds both theoretically and realistically by improving our understanding of user behavior and giving useful insights for coders, companies, and lawmakers. Future study can build on this work by exploring wider user groups, additional factors, and changing robot apps across various sectors.
Appendix A
| Performance Expectancy |
I find Chatbot useful in my daily life. |
| Chatbot increases my chances of achieving tasks that are important to me. | |
| Chatbot helps me accomplish tasks more quickly. | |
| Chatbot increases my productivity. | |
| Effort Expectancy | Learning how to use Chatbot is easy for me. |
| My interaction with Chatbot is clear and understandable | |
| I find Chatbot easy to use. | |
| It is easy for me to become skillful at using Chatbot | |
| Social influence | People who are important to me think that I should use Chatbot. |
| People who influence my behavior think that I should use Chatbot. | |
| People whose opinions that I value prefer that I use Chatbot. | |
| Facilitating Condition |
I have the resources necessary to use Chatbot |
| I have the knowledge necessary to use Chatbot | |
| Chatbot is compatible with other technologies I use | |
| I can get help from others when I have difficulties using Chatbot | |
| Hedonic Motivation |
Chatbot is fun |
| Chatbot is enjoyable | |
| Chatbot is very entertaining | |
| I have seen others use Chatbot | |
| It is easy to observe Chatbot being used | |
| I have often seen others using Chatbot | |
| I have had plenty of opportunities to see others using Chatbot | |
| Perceived compatibility | Chatbot are compatible with my lifestyle. |
| Chatbot fits well with the way I go out and come home in my daily life. | |
| Using Chatbot is completely compatible with my current situation. | |
| Chatbot is a good match for my needs. | |
| Perceived relative advantage ( | Chatbot make it easier to search items |
| Chatbot services enables me to search for items more quickly | |
| Chatbot makes it more effective for me to search for items | |
| Chatbot gives me greater control over my searches | |
| Chatbot is more convenient when searching | |
| Personal innovativeness | If I heard about Chatbot, I look for ways to experiment with it |
| Amongst my peers, I am usually the first to try out Chatbot | |
| In general, I am not hesitant to try Chatbot | |
| I like to experiment with Chatbot | |
| Attitude | Using Chatbot is a good idea. |
| Using Chatbot is a wise idea | |
| I like the idea of using Chatbot | |
| Using Chatbot is a pleasant experience | |
| Adoption behavior | I currently use Chatbot. |
| I recommend Chatbot to my friends or others | |
| Chatbot is my first choice when I need services | |
| Perceived Trust | I feel Chatbot is trustworthy. I feel Chatbot is efficient. |
| I feel Chatbot is reliable. | |
| I feel Chatbot is controllable. |
Figure A1.
Research Measurement Model Results from the Smart PLS Too.
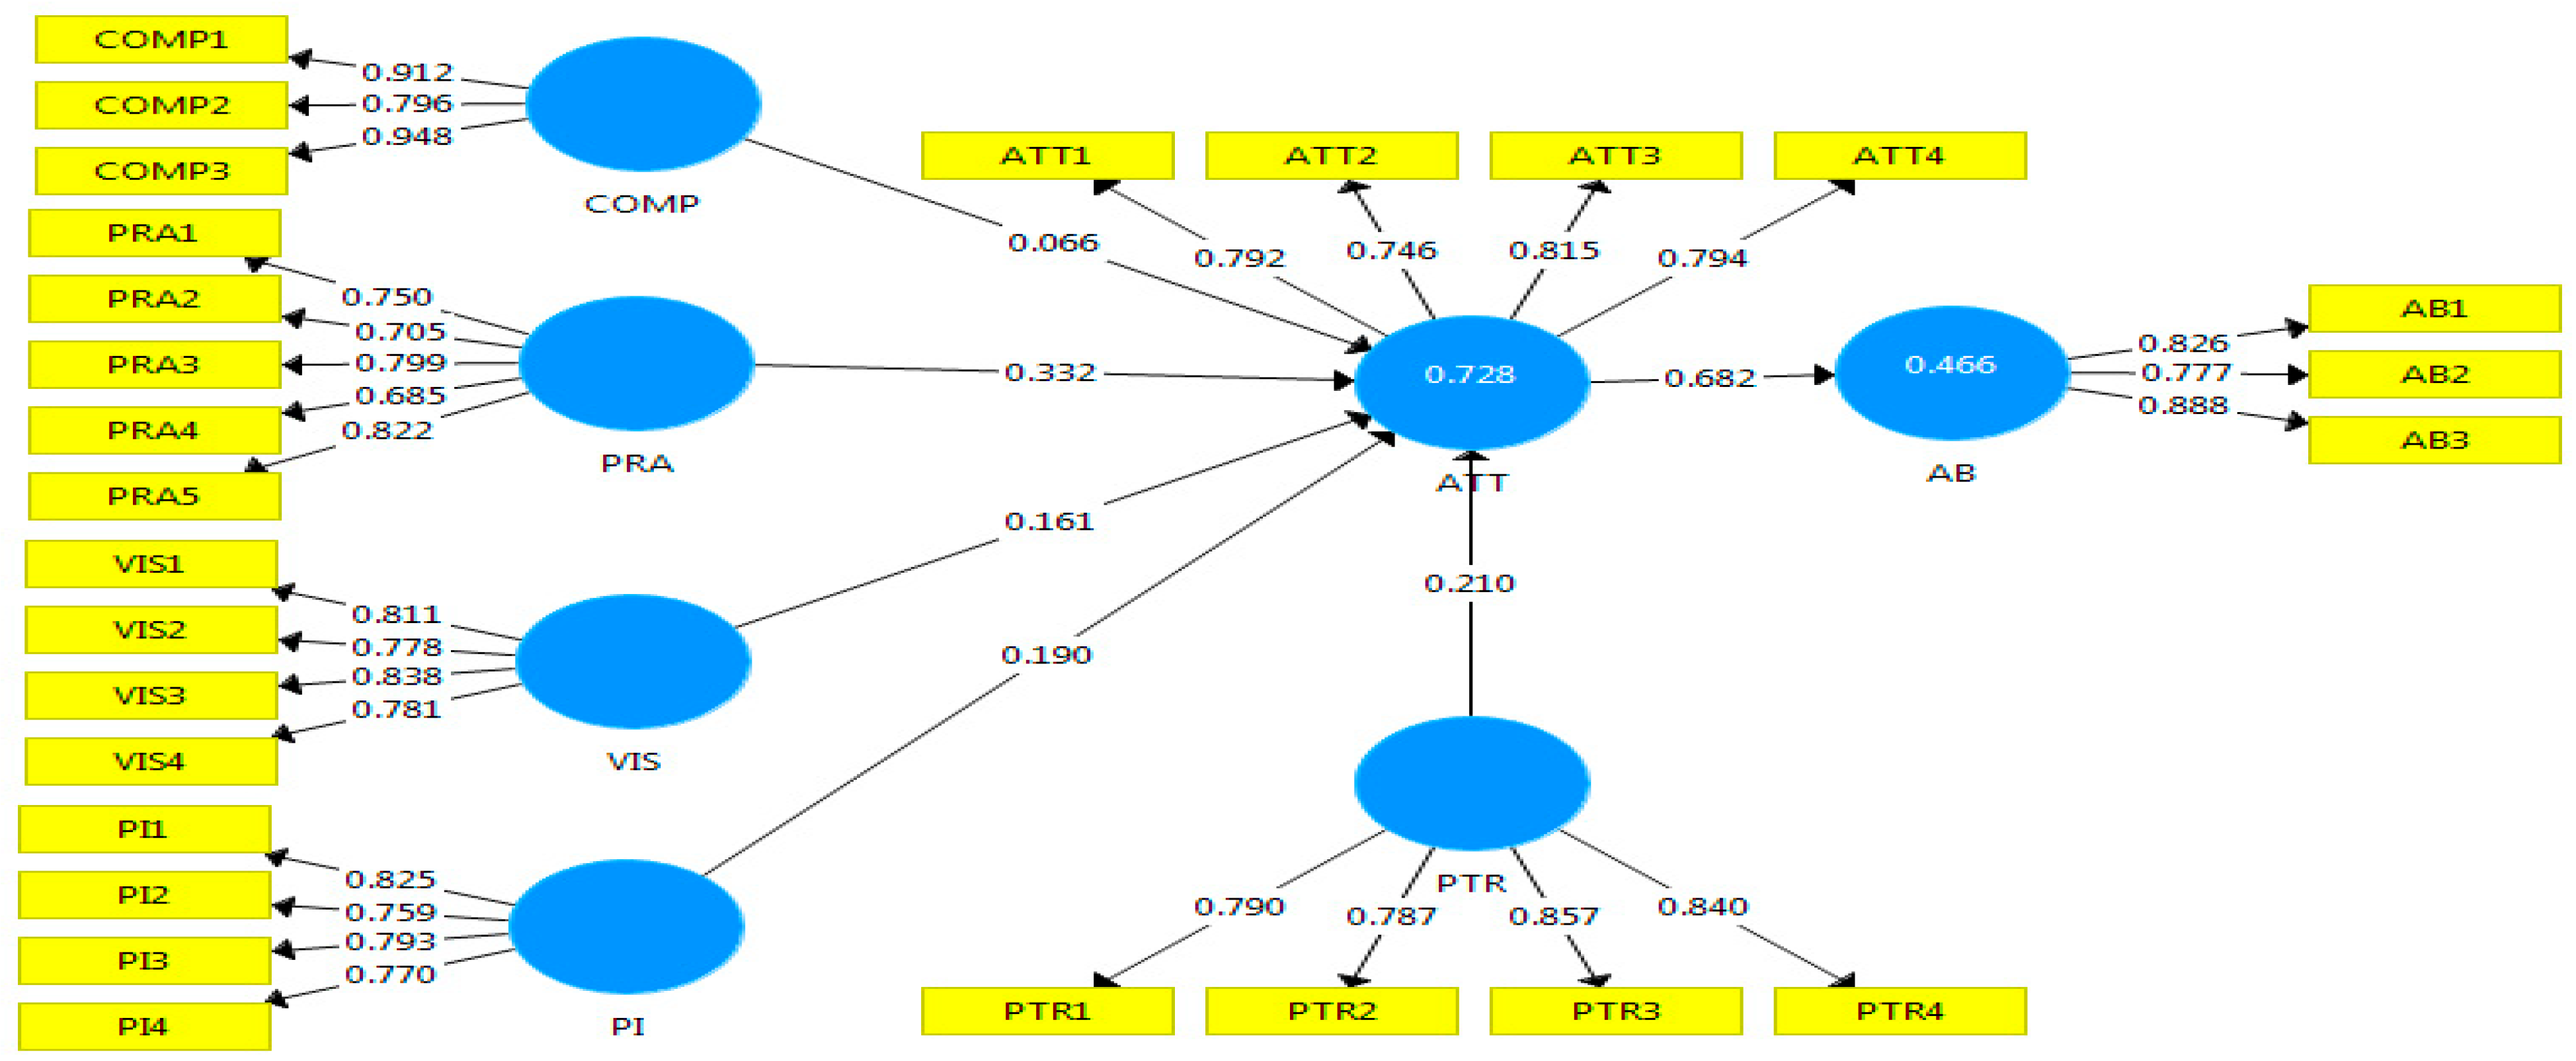
Figure A2.
Research Structural Model Results from Smart PLS Tool.
References
- Karyotaki, M.; Drigas, A.; Skianis, C. Mobile/VR/Robotics/IoT-Based Chatbots and Intelligent Personal Assistants for Social Inclusion. Int. J. Interact. Mob. Technol. (iJIM) 2024, 18, 40–51, . [CrossRef]
- Hasan, M. R., Chowdhury, N. I., Rahman, M. H., Syed, M. A. B., & Ryu, J. (2023). Analysis of the User Perception of Chatbots in Education Using A Partial Least Squares Structural Equation Modeling Approach. arXiv preprint arXiv:2311.03636.
- Dandotiya, A. S., Gupta, S. K., Dandotiya, N., & Sharma, M. P. (2024). AI IN EVERYDAY LIFE: TRANSFORMING SOCIETY. Navi International Book Publication house.
- Ahmad, N.; Amer, N.T.; Qutaifan, F.; Alhilali, A.; Irani, Z. Technology adoption model and a road map to successful implementation of ITIL. J. Enterp. Inf. Manag. 2013, 26, 553–576, . [CrossRef]
- Teo, A.C.; Tan, G.W.H.; Ooi, K.B.; Lin, B. Why consumers adopt mobile payment? A partial least squares structural equation modelling (PLS-SEM) approach. Int. J. Mob. Commun. 2015, 13, 478–497, . [CrossRef]
- Bhatiasevi, V. An extended UTAUT model to explain the adoption of mobile banking. Inf. Dev. 2016, 32, 799–814, . [CrossRef]
- Carcary, M.; Maccani, G.; Doherty, E.; Conway, G. (2018). Exploring the determinants of IoT adoption: Findings from a systematic literature review. In Perspectives in Business Informatics Research: 17th International Conference, BIR 2018, Stockholm, Sweden, September 24-26, 2018, Proceedings 17 (pp. 113-125). Springer International Publishing.
- Rahman, M.S.; Mannan, M.; Amir, R. The rise of mobile internet: the adoption process at the bottom of the pyramid. Digit. Policy, Regul. Gov. 2018, 20, 582–599, . [CrossRef]
- Queiroz, M.M.; Wamba, S.F. Blockchain adoption challenges in supply chain: An empirical investigation of the main drivers in India and the USA. Int. J. Inf. Manag. 2019, 46, 70–82, . [CrossRef]
- Sabani, A. Investigating the influence of transparency on the adoption of e-Government in Indonesia. J. Sci. Technol. Policy Manag. 2020, 12, 236–255, . [CrossRef]
- Kumar, G.; Kapur, P.K. (2020). Developing a Usage Space Dimension Model to Investigate Influence of Intention to Use on Actual Usage of Mobile Phones. Strategic System Assurance and Business Analytics, 201-229.
- Sujati, W.; Yudoko, G.; Okdinawati, L. Systematic Literature Review of UTAUT Model to Understand Adopter's Perception of Digital Mobile App Applications in the Indonesian Coal Mining Industry. J. Indones. Appl. Econ. 2023, 11, 110–128, . [CrossRef]
- Yuan, Z.; Liu, J.; Deng, X.; Ding, T.; Wijaya, T.T. Facilitating Conditions as the Biggest Factor Influencing Elementary School Teachers’ Usage Behavior of Dynamic Mathematics Software in China. Mathematics 2023, 11, 1536, . [CrossRef]
- Gangwar, H.; Date, H.; Raoot, A. Review on IT adoption: insights from recent technologies. J. Enterp. Inf. Manag. 2014, 27, 488–502, . [CrossRef]
- Rahman, M.S.; Mannan, M.; Amir, R. The rise of mobile internet: the adoption process at the bottom of the pyramid. Digit. Policy, Regul. Gov. 2018, 20, 582–599, . [CrossRef]
- Aman, J.; Abbas, J.; Mahmood, S.; Nurunnabi, M.; Bano, S. The Influence of Islamic Religiosity on the Perceived Socio-Cultural Impact of Sustainable Tourism Development in Pakistan: A Structural Equation Modeling Approach. Sustainability 2019, 11, 3039, . [CrossRef]
- Ramadhan, G. PENGGUNAAN MODEL POE2WE DALAM MATERI ELEKTROMAGNETIK UNTUK MENINGKATKAN PEMAHAMAN KONSEP DAN MOTIVASI BELAJAR SISWA.
- El Mallouli, A.; Sassi, H. Determinants of Islamic banking products and services adoption in Morocco: a conceptual framework. J. Islam. Mark. 2021, 13, 1589–1605, . [CrossRef]
- Billanes, J.; Enevoldsen, P. A critical analysis of ten influential factors to energy technology acceptance and adoption. Energy Rep. 2021, 7, 6899–6907, . [CrossRef]
- Sciarelli, M.; Prisco, A.; Gheith, M.H.; Muto, V. Factors affecting the adoption of blockchain technology in innovative Italian companies: an extended TAM approach. J. Strat. Manag. 2021, 15, 495–507, . [CrossRef]
- Raza, H.; Ali, A.; Rafiq, N.; Xing, L.; Asif, T.; Jing, C. Comparison of Higher Education in Pakistan and China: A Sustainable Development in Student’s Perspective. Sustainability 2023, 15, 4327, . [CrossRef]
- Zakariyah, H.; Salaudeen, A.O.; Othman, A.H.A.; Rosman, R. The determinants of financial technology adoption amongst Malaysian waqf institutions. Int. J. Soc. Econ. 2023, 50, 1302–1322, . [CrossRef]
- Rahi, S.; Alghizzawi, M.; Ngah, A.H. Understanding consumer behavior toward adoption of e-wallet with the moderating role of pandemic risk: an integrative perspective. Kybernetes 2023, 53, 4818–4839, . [CrossRef]
- Ajzen, I. (1991). The theory of planned behavior. Organizational Behavior and Human Decision Processes, 50(2), 179-211.
- Agarwal, R.; Prasad, J. A Conceptual and Operational Definition of Personal Innovativeness in the Domain of Information Technology. Inf. Syst. Res. 1998, 9, 204–215, . [CrossRef]
- Gefen, D.; Karahanna, E.; Straub, D.W. Trust and TAM in Online Shopping: An Integrated Model. MIS Q. 2003, 27, 51–90. [CrossRef]
- McKnight, D.H.; Choudhury, V.; Kacmar, C. Developing and Validating Trust Measures for e-Commerce: An Integrative Typology. Inf. Syst. Res. 2002, 13, 334–359, . [CrossRef]
- Moore, G.C.; Benbasat, I. Development of an Instrument to Measure the Perceptions of Adopting an Information Technology Innovation. Inf. Syst. Res. 1991, 2, 192–222, . [CrossRef]
- Rogers, E. M. (2003). Diffusion of innovations, 5th edn Tampa. FL: Free Press.[Google Scholar].
- Venkatesh, V., Morris, M. G., Davis, G. B., & Davis, F. D. (2003). User acceptance of information technology: Toward a unified view. MIS quarterly, 425-478.
- Wang, Y.-S.; Wu, M.-C.; Wang, H.-Y. Investigating the determinants and age and gender differences in the acceptance of mobile learning. Br. J. Educ. Technol. 2009, 40, 92–118, . [CrossRef]
- Venkatesh, V., Thong, J. Y., & Xu, X. (2012). Consumer acceptance and use of information technology: extending the unified theory of acceptance and use of technology. MIS quarterly, 157-178.
- Davis, F. D. (1989). Perceived usefulness, perceived ease of use, and user acceptance of information technology. MIS quarterly, 319-340.
- Moore, G.C.; Benbasat, I. Development of an Instrument to Measure the Perceptions of Adopting an Information Technology Innovation. Inf. Syst. Res. 1991, 2, 192–222, . [CrossRef]
- Agarwal, R.; Prasad, J. A Conceptual and Operational Definition of Personal Innovativeness in the Domain of Information Technology. Inf. Syst. Res. 1998, 9, 204–215, . [CrossRef]
- Rogers, E. M. (2003). Diffusion of innovations, 5th edn Tampa. FL: Free Press.[Google Scholar].
- Gefen, D.; Karahanna, E.; Straub, D.W. Trust and TAM in Online Shopping: An Integrated Model. MIS Q. 2003, 27, 51–90. [CrossRef]
- Venkatesh, V.; Davis, F.D. A Theoretical Extension of the Technology Acceptance Model: Four Longitudinal Field Studies. Manag. Sci. 2000, 46, 186–204, doi:10.1287/mnsc.46.2.186.11926.
- Kasilingam, D. L. (2020). Understanding the attitude and intention to use smartphone ride-hailing apps among Millennials. Journal of Retailing and Consumer Services, 56, 102-108.
- Endang, A. M. (2022). eHealth Literacy and COVID-19 Preventive Behaviours of the Migrant Domestic Workers in Hong Kong: A Mixed Methods Study (Doctoral dissertation, The Chinese University of Hong Kong (Hong Kong)).
Table 2.
FL, VIF, CR, and AVE values.
| Variables | Items | FL Values | VIF Values | CR Values | AVE Values |
| Adoption behavior | AB1 | 0.826 | 1.626 | 0.870 | 0.691 |
| AB2 | 0.777 | 1.489 | |||
| AB3 | 0.888 | 1.871 | |||
| ATT1 | 0.826 | 1.668 | 0.867 | 0.619 | |
| Attitude | ATT2 | 0.792 | 1.540 | ||
| ATT3 | 0.746 | 1.755 | |||
| ATT4 | 0.815 | 1.723 | |||
| compatibility | COMP1 | 0.912 | 4.193 | 0.917 | 0.788 |
| COMP2 | 0.796 | 1.634 | |||
| COMP3 | 0.948 | 4.879 | |||
| Personal innovativeness | PI1 | 0.825 | 1.862 | 0.867 | 0.620 |
| PI2 | 0.759 | 1.550 | |||
| PI3 | 0.793 | 1.736 | |||
| PI4 | 0.770 | 1.600 | |||
| Perceived relative | PRA1 | 0.750 | 1.638 | 0.868 | 0.569 |
| PRA2 | 0.705 | 1.463 | |||
| PRA3 | 0.799 | 1.924 | |||
| PRA4 | 0.685 | 1.424 | |||
| PRA5 | 0.822 | 2.000 | |||
| Perceived Trust | PTR1 | 0.790 | 1.835 | 0.891 | 0.671 |
| PTR2 | 0.787 | 1.801 | |||
| PTR3 | 0.857 | 2.161 | |||
| PTR4 | 0.840 | 2.071 | |||
| Visibility | VIS1 | 0.811 | 1.853 | 0.878 | 0.644 |
| VIS2 | 0.778 | 1.591 | |||
| VIS3 | 0.838 | 1.975 | |||
| VIS4 | 0.781 | 1.654 |
Table 3.
Discriminant Validity.
| Variables | AB | ATT | COMP | PI | PRA | PTR | VIS |
| AB | 0.831 | ||||||
| ATT | 0.682 | 0.787 | |||||
| COMP | 0.200 | 0.413 | 0.888 | ||||
| PI | 0.713 | 0.780 | 0.424 | 0.787 | |||
| PRA | 0.665 | 0.804 | 0.395 | 0.798 | 0.754 | ||
| PTR | 0.705 | 0.779 | 0.371 | 0.803 | 0.802 | 0.819 | |
| VIS | 0.696 | 0.759 | 0.357 | 0.796 | 0.779 | 0.782 | 0.802 |
Table 4.
R squire.
| Variables | R Square | R Square Adjusted |
| AB | 0.466 | 0.464 |
| ATT | 0.728 | 0.725 |
Table 5.
F squire Effect Size.
| Variables | AB | ATT |
| ATT | 0.871 | |
| COMP | 0.013 | |
| PI | 0.033 | |
| PRA | 0.109 | |
| PTR | 0.043 | |
| VIS | 0.027 |
Table 6.
Hypotheses Result.
| Hypothesis | Relationship | Original Sample (O) | Sample Mean (M) | Standard Deviation (STDEV) | T Statistics (|O/STDEV|) | P Values | Remarks |
| H1 | ATT -> AB | 0.682 | 0.679 | 0.061 | 11.197 | 0.000 | Supported |
| H2 | COMP -> ATT | 0.066 | 0.067 | 0.031 | 2.128 | 0.034 | Supported |
| H3 | PI -> ATT | 0.190 | 0.187 | 0.068 | 2.796 | 0.005 | Supported |
| H4 | PRA -> ATT | 0.332 | 0.326 | 0.066 | 5.036 | 0.000 | Supported |
| H5 | PTR -> ATT | 0.210 | 0.206 | 0.067 | 3.120 | 0.002 | Supported |
| H6 | VIS -> ATT | 0.161 | 0.170 | 0.070 | 2.291 | 0.022 | Supported |
Disclaimer/Publisher’s Note: The statements, opinions and data contained in all publications are solely those of the individual author(s) and contributor(s) and not of MDPI and/or the editor(s). MDPI and/or the editor(s) disclaim responsibility for any injury to people or property resulting from any ideas, methods, instructions or products referred to in the content. |
© 2025 by the authors. Licensee MDPI, Basel, Switzerland. This article is an open access article distributed under the terms and conditions of the Creative Commons Attribution (CC BY) license (http://creativecommons.org/licenses/by/4.0/).
Copyright: This open access article is published under a Creative Commons CC BY 4.0 license, which permit the free download, distribution, and reuse, provided that the author and preprint are cited in any reuse.


